Scope
This paper demonstrates the combined in vitro capabilities of Seda Pharmaceutical Development Services in the manufacture and physical characterisation of lipid-based nanoparticles for nucleic acid delivery, coupled with the advanced in vitro characterisation capabilities of Medicines Discovery Catapult (MDC). Together, these organisations can support the design, prototype manufacture and screening of complex medicines ready for progression to preclinical in vivo testing and onwards to clinical development.
Introduction
In recent years, nucleic acid (NA)-based medicines have emerged as a promising new biotherapeutic modality, with the potential to target proteins considered ‘undruggable’ by small molecules. These medicines could revolutionise the treatment of genetic disorders, infectious diseases and even some types of cancer. There is a growing number of NA therapies that have been approved for clinical use and the market is forecast to reach USD 9.54 billion globally by 2028 (estimated by Mordor Intelligence)1. This recent increase has been significantly influenced by the success and the FDA approval of ONPATTRO® in 2018, and the SARS-CoV-2 lipid nanoparticle (LNP) vaccines in 2021 which deliver siRNA and mRNA, respectively. This has resulted in an increase in the number of SMEs and larger pharmaceutical companies investing in the development of NA medicines. RNA-based medicines (siRNA, mRNA and some antisense oligonucleotides) use RNA molecules to modulate the expression of specific genes. However, to be efficacious both in vitro and in vivo, they require a stable carrier. The development of suitable drug delivery vectors is therefore critical to realise therapeutic potential. To date, LNPs are the most clinically advanced, non-viral NA delivery tool.
The role of the drug delivery system is to: 1) protect the NA cargo from degradation by RNAses in the serum, 2) prevent unwanted patient immunogenicity and off-target effects driven by exposure to naked NAs, and 3) facilitate cellular trafficking (uptake and endosomal escape) and cytoplasmic delivery of cargo. Once the vector, with its NA cargo, has successfully crossed the relevant biological barriers, the intact cargo must be released at an appropriate concentration to exert the desired therapeutic effect.
Characterising the physical properties and biological function of nanoparticles (NPs) is critical for translation to the clinic. Key Physical criteria include a particle size of 200nm or less (typically closer to 100nm), a narrow size distribution, high encapsulation efficiency, and appropriate surface charge at physiological pH to balance both safety and efficacy. In terms of biological requirements, particles must have the capacity to internalise via direct fusion with the plasma membrane
or endocytosis-mediated uptake (e.g. clathrin, dynamin, caveolin dependent and micropinocytosis), escape from a trafficking vesicle and efficiently deliver the cargo into the cell cytoplasm. Additionally, the development of robust and scalable manufacturing processes capable of ensuring product quality that meet regulatory requirements is essential. Comparability of LNP critical quality attributes across batches used in preclinical and clinical studies is also required.

There is a growing number of NA therapies that have been approved for clinical use and the market is forecast to reach USD 9.54 billion globally by 2028.
Preparation, characterisation and in vitro assessment of siRNA-loaded lipid-based nanoparticles 2


MDC is developing new ways to characterise the physical properties of NPs using single molecule localisation microscopy.
Liposomes, the pioneering lipid-based formulations, are a bilayer system with an aqueous core and were originally designed to improve the therapeutic index of small molecule drugs. Liposome composition has been enhanced over the years to improve stability, reduce cargo leakage and to evade immune responses in order to increase circulation time (stealth liposomes). Cationic liposomes have been investigated for gene delivery applications as they are known to form polyplexes by electrostatic interactions with anionic NA. More recently, LNPs specifically developed for delivering new modalities such as NAs, are formed of a lipid monolayer with a reverse micelle as the core structure, and the NA is condensed with cationic/ionisable lipids. Like liposomes, LNPs protect and stabilise the cargo, and improve pharmacokinetics and cellular uptake. A key feature of LNPs is their suitability for intracellular delivery due to their ability to escape the endosomal compartment via the presence
of the cationic/ionisable lipid. Ionisable lipids can transition between charged and neutral states based on environmental pH. They remain deprotonated under neutral conditions and acquire a positive charge in environments with a pH below their acid-dissociation constant. Although the proton sponge effect is the main theory for the endosomal escape mechanism, other hypotheses related to the fusion membrane are currently being debated in the literature2
The interplay between formulation and biological performance is more complex in NA-based therapies compared to conventional small molecule drug development and demands a range of expertise and methods of analysis. This white paper is the result of a partnership between MDC and Seda with the primary aim of showcasing their respective but complementary laboratory capability in elucidating this formulation/efficacy relationship (Fig. 1).
In this study, siRNA-loaded liposomes (termed lipoplexes) and LNPs were chosen as representative molecules to investigate the influence of the manufacturing process of the lipid-based formulation on intracellular delivery. The design and manufacture, including process optimisation and physical characterisation, of both nanoparticle (NP) formulation types was performed by Seda. The biological performance of the NPs was assessed by MDC. Advanced microscopy techniques were used to demonstrate the kinetics of uptake, visualise intracellular trafficking and cytoplasmic delivery of siRNA by lipoplexes and LNPs. In addition, MDC is developing new ways to characterise the physical properties of NPs using single molecule localisation microscopy (SMLM), a super resolution microscopy technique that improves resolution up to ten-fold compared to conventional widefield microscopy.
Preparation, characterisation and in vitro assessment of siRNA-loaded lipid-based nanoparticles 3
Figure 1. Workflow from nanoparticles (NPs) preparation to cellular analysis.
siRNA Labelling • Process optimisation including total lipid concentration and N/P selection • Scalability • Reproducibility NPs Manufacturing (lab scale) • Average size • Size distribution • NP concentration • Surface charge • Loading capacity • Colloidal stability Physical Characterisation • Cell viability • Uptake • Endosomal escape • Efficacy Biological performance (in vitro)
• Enabling tracking of
cellular
uptake and trafficking
Cy3 fluorescent labelling of siRNA targeting euchromatic histonelysine N-methyltransferase (EHMT2)
EHMT2 was chosen as the siRNA target as it is highly expressed in many human cell lines and readily detectable in biochemical assays, for example, western blot. Prior to NP preparation, siRNA targeting EHMT2 (siEHMT2) was labelled with a Cy3 fluorophore to allow visualisation of cellular uptake and trafficking using fluorescence microscopy. Results show that nearly 80% of the siRNA was recovered following labelling and the low ratio of base:dye indicated an effective labelling of siRNA (data not shown). To ensure that the fluorescent label did not affect the functional integrity of the siRNA, HeLa cells were transfected with either Cy3-siEHMT2 or unlabelled siEHMT2 using a commercial transfection reagent (Lipofectamine™ RNAiMAX). Expression of EHMT2 was assessed at different time-points by western blotting. Both labelled and unlabelled siRNA showed protein knockdown with no notable difference observed between the two at any timepoint. By 48 h EHMT2 expression had been reduced to 20% and appeared to be complete reduction at 72 h, using western blot analysis. (Fig. 2).
Formulation manufacturing and physical characterisation
Lipoplexes and LNPs were prepared using a combination of commercially available lipids and loaded were prepared and loaded initially with polyadenylic acid (polyA) as a less expensive surrogate for the Cy3-siEHMT2 cargo to optimise the manufacturing process. Specifically, DLin-MC3-DMA, (1,2-distearoyl-sn-glycero3-phosphocholine) (DSPC), 1,2-dimyristoylrac-glycero-3-methoxypolyethylene glycol-2000 (DMG-PEG2000) and cholesterol were selected with a ratio of 50:10:1.5:38.5 for both formulations. A schematic representation of the formulation process of lipoplexes and LNPs is shown in Fig. 3, differing only in the point of NA addition. NP fabrication was performed at pH 3 ensuring that the ionisable lipid, MC3 (pKa~ 6.4), was protonated and therefore able to complex with the anionic NA. For LNPs, NA was already present in the citrate buffer prior to addition of the ethanol lipid mix, whereas for the preparation of lipoplexes, the NA was added after the liposomes were formed. After 30 minutes complexation time, the solutions were neutralised by adding 1 M tris HCl buffer.


(a) Western blot analysis of HeLa cell lysates for EHMT2 expression following treatment with Cy-3 labelled and unlabelled siEHMT2 at 24, 48 and 72 h. (b) Quantification of EHMT2 expression using densitometry analysis of EHMT2 western blot using Licor’s Image Studio Software.


Preparation, characterisation and in vitro assessment of siRNA-loaded lipid-based nanoparticles 4
Figure 2. Effect of labelling of siEHMT2 with Cy3 dye.
a b
Figure 3. Schematic representation of the manufacturing process of the NAloaded lipoplexes and LNPs.
Lipoplex
LNP
PolyA-loaded lipoplexes and LNPs
Initially, process development was performed using polyA to determine the influence of key process parameters such as mixing, scale, total lipid concentration, filtration, and extrusion on the attributes of the NPs such as size, size distribution, NP concentration and z-potential measured by dynamic and electrophoretic light scattering (DLS/ELS). Briefly, polyA-loaded LNPs were prepared using nitrogen:phosphate (N/P) ratios ranging from 0.66 to 20. Based on size (z-average) and polydispersity index (PDI), the N/P ratio of 10 was selected as optimal, with values of 152 nm and 0.32 for z-average and PDI, respectively. Additionally, the process was scaled up by a factor of 15 and the key attributes of the LNPs were assessed. z-Average and PDI of the polyA-loaded LNPs which were found to be ~177.1 nm and ~0.26 respectively remained similar to those produced at small scale. However, higher resolution size determination by multi angle dynamic light scattering (MADLS) revealed the presence of multiple size populations, which could not be improved using extrusion.
Increasing the total lipid concentration by ~7-fold was found to improve formulation characteristics. The z-average and PDI were found to be 141.5 nm and 0.11, respectively, indicating narrow size distribution (Fig. 4b). A further MADLS measurement confirmed the monomodal distribution of the polyAloaded LNP solution with the detection of a single peak (Fig. 4a). Lipoplexes showed similar physical properties to LNPs with an average size of 157 nm and PDI of 0.11.
Key attributes remained similar after filtration through a 0.22 µm PVDF membrane filter, providing an appropriate method for achieving low bioburden samples suitable for parenteral dosing in preclinical species. Attributes were also similar across 3 batches prepared under the same conditions (Fig. 5) indicating low batch to batch variability.

lipoplexes.
(a) Representative particle size distribution of polyA-loaded LNPs determined by MADLS (n=3). (b) z-Average and PDI measured by DLS (n=3).

PolyA-loaded lipoplexes were prepared using the manufacturing process described in Fig. 3 at the same scale and total lipid concentration as used for the LNPs, and were of similar size, PDI and zeta potential to the LNPs (see Fig. 4b).
5
Figure 5. z-Average and PDI measurement by DLS of 3 batches of polyA-loaded LNPs (n=3).
Figure 4. Summary of the physical characterisation of polyA-loaded LNPs and
a b Property Lipoplex LNP Z-average (nm) 157 141.5 PDI 0.11 0.11 Particle diameter (nm) 0 100 200 300 400 500 15 10 5 0 Intensity (%) Batch 1 2 3 200 0.3 0.2 0.1 0.0 150 100 50 0 z-average (nm) PDI Preparation, characterisation and in vitro assessment of siRNA-loaded lipid-based nanoparticles
Cy3-siEHMT2-loaded lipoplexes and LNPs
Cy3-labelled siRNA-loaded lipoplexes and LNPs were prepared using the established manufacturing process and characterised using the Zetasizer. The average particle size of the two formulations was similar and PDIs were below 0.2 indicating narrow size distribution (Table 1).
Z-potential of the lipoplexes and LNPs was -1.9 and -2.3, respectively, when samples were prepared by diluting 10-fold in 10 mM NaCl (pH ~7.4). Z-potential values between -10 and 10 mV are generally considered to indicate the neutrality of the NP surface.
For orthogonal determination of nanoparticle size, the formulations were examined with single molecule localisation microscopy. To this end, NPs were fixed with paraformaldehyde and stained with DiD, a lipophilic tracer, prior to acquisition of single fluorophore blinking events. The subpixel centroid of each fluorophore was determined using Zen
(Zeiss), yielding an average resolution of 42 nm. This increased resolution enabled the identification of individual particles, approximately 100 nm in diameter, the size of which was vastly overestimated by diffraction-limited widefield imaging (Fig. 6a). In agreement with the DLS data, there were no detectable differences in diameter between the particles with median diameters of 84.2 nm and 92.8 nm for lipoplexes and LNPs, respectively, calculated with SR-Tesseler3 (Fig.6b). These data suggest that SMLM performance is comparable to current DLS or electron microscopy approaches, and given its advantages in labelling and sample preparation, it is well-positioned as a tool for the determination of particle size and loading. In addition, SMLM can be used to image multiple labels and, therefore, it was possible to visualise both the lipids and the Cy3-siEHMT2. Example images of the DiD labelled NPs and
Cy3-siEHMT2 for lipoplexes and LNPs are shown in Fig. 6c. These images suggest a difference in cargo interaction with the lipids between lipoplex and LNPs. In LNPs, Cy3-siEHMT2 overlapped with the lipids suggesting efficient encapsulation into the core whereas in the lipoplexes, much of the cargo was localised outside of the lipid core with some lipid overlap, suggesting presence of Cy3-siEHMT2 both inside and outside of the NP.
The total amount of Cy3-siEHMT2 within the two formulations was assessed by Quant-it ™RiboGreen assay (Table 1). To facilitate the release of siRNA from LNPs and lipoplexes, the samples were incubated with 1% Triton X-100 for 10 min prior to treatment with RiboGreen reagent. The concentration of siRNA within the formulations was comparable, indicating that spatial arrangement visualised by SMLM did not have an impact on cargo loading of NPs.


Preparation, characterisation and assessment of siRNA-loaded lipid-based nanoparticles 6
DiD labelled LNP a Property Lipoplex LNP Z-average (nm) 113.5 105.7 PDI 0.16 0.15 Zeta potential (mV) -2.3 -1.9 Cy3- siEHMT2 concentration (µM) 2.33 2 bi bii 0 100 200 300 400 500 600 0 5 10 15 Particle diameter (nm) Intensit y( %) 0 100 200 300 400 500 0 00 0 05 0.10 0 15 Particle diameter (nm) F r e q u e n c y LNP Lipoplex LNP Lipoplex
Table 1. Summary of the characterisation of the Cy3-labelled siRNA-loaded lipid-based NPs (n=3).
Widefield SMLM Widefield SMLM Widefield DiD labelled LNP Lipoplex LNP siRNA-Cy3 siRNA-Cy3 siRNA-Cy3 (bii) 0 100 200 300 400 500 600 0 5 10 15 Particle diameter (nm) Intensit y( %) 0 100 200 300 400 500 0 00 0 05 0 10 0 15 Particle diameter (nm) F r e q u e n c y LNP Lipoplex LNP Lipoplex
Widefield SMLM Widefield SMLM Widefield DiD labelled LNP LNP siRNA-Cy3 (bii) 0 100 200 300 400 500 600 0 5 10 15 Particle diameter (nm) Intensit y( %) 0 100 200 300 400 500 0 00 0 05 0 10 0 15 Particle diameter (nm) F r e q u e n c y LNP Lipoplex LNP Lipoplex (a)
Widefield 100nm 400nm 100nm DiD labelled LNP Lipoplex LNP siRNA-Cy3 siRNA-Cy3 (bii) 0 100 200 300 400 500 600 0 5 10 15 Particle diameter (nm) Intensit y( %) 0 100 200 300 400 500 0 00 0 05 0 10 0 15 Particle diameter (nm) F r e q u e n c y LNP Lipoplex LNP Lipoplex (a)
(a) (bi) (c)
(a) (bi) (c)
(bi) (c)
Widefield SMLM Widefield Widefield DiD labelled LNP Lipoplex LNP siRNA-Cy3 siRNA-Cy3 siRNA-Cy3 siRNA-Cy3 (bii) 0 100 200 300 400 500 600 0 5 10 15 Particle diameter (nm) Intensit y( %) 0 100 200 300 400 500 0 00 0 05 0 10 0 15 Particle diameter (nm) F r e q u e n c y LNP Lipoplex LNP Lipoplex (a)
Widefield SMLM 100nm Widefield Widefield 400nm DiD labelled LNP Lipoplex LNP siRNA-Cy3 DiD DiD siRNA-Cy3 siRNA-Cy3 DiD siRNA-Cy3 DiD (bii) 0 100 200 300 400 500 600 0 5 10 15 Particle diameter (nm) Intensit y( %) 0 100 200 300 400 500 0 00 0 05 0 10 0 15 Particle diameter (nm) F r e q u e n c y LNP Lipoplex LNP Lipoplex (a)
Widefield SMLM 100nm Widefield SMLM Widefield 400nm 100nm 400nm DiD labelled LNP Lipoplex LNP siRNA-Cy3 DiD DiD siRNA-Cy3 siRNA-Cy3 DiD siRNA-Cy3 DiD (bii) Particle diameter (nm) Particle diameter (nm) Frequency 0 0 0.15 0.00 100 100 200 200 300 300 400 400 500 500 600 15 10 5 0 Intensity (%)
(bi) (c)
(bi) (c)
(bi) (c)


(a) SMLM enhances visualisation of particles in comparison to widefield microscopy. (b) Particle diameters were quantified using SR-Tesseler and DLS. (c) Representative SMLM images of Lipoplexes and LNPs, labelled using DiD lipid dye (magenta in overlay) with cargo, Cy3-siEHMT2 (cyan in overlay). Overlay is presented as a gaussian rendered image. Scale bar is 100 nm.
The two formulations were stored at 2-8 °C for 7 days and DLS measurements were performed at day 1, 3 and 7 to determine z-average and PDI (Fig. 7). With these attributes remaining consistent, we could confidently surmise that formulations could be prepared at Seda then shipped to MDC for further in vitro characterisation without loss of physical stability.

7 Lipoplex LNP c 0 100 200 300 400 500 600 0 5 Particle diameter (nm) Intensit 0 100 200 300 400 500 0 00 0.05 Particle diameter (nm) F r e (c) Lipoplex LNP siRNA-Cy3 DiD DiD siRNA-Cy3 siRNA-Cy3 DiD siRNA-Cy3 DiD 0 100 200 300 400 500 600 0 5 Particle diameter (nm) Intensit 0 100 200 300 400 500 0 00 0.05 Particle diameter (nm) F r e (c) Lipoplex LNP siRNA-Cy3 DiD DiD siRNA-Cy3 siRNA-Cy3 DiD siRNA-Cy3 DiD
Figure 6. Physical characterisation of particles using DLS and single molecule localisation microscopy (SMLM).
Lipoplex LNP
0 0 140 120 100 80 60 40 20 0 140 120 100 80 60 40 20 0 0.25 0.20 0.15 0.10 0.05 0.00 0.25 0.20 0.15 0.10 0.05 0.00 2 2 4 4 6 6 8 8 Day Day z-average (nm) z-average (nm) PDI PDI Preparation, characterisation and in vitro assessment of siRNA-loaded lipid-based nanoparticles
Figure 7. Colloidal stability assessment of the Cy3-labelled siRNA-loaded LNPs and lipoplexes over 7 days (n=3).
In vitro performance of lipoplexes and LNPs
HeLa cells, treated with increasing doses of lipoplexes and LNPs, were assayed for cell growth and viability after 24 h. No obvious morphological changes were observed, however, in all conditions, including the buffer alone, there was a small decrease in growth and ATP production (Fig. 8a and b). This finding corresponds to in vitro observations in the literature that lipid-based nanoparticles exhibit minimal toxicity at efficacious dose2 ai aii


8
Lipoplex LNP bi bii 0 0 5 5 10 10 15 15 20 20 25 25 Time (h) Percentage viability Percentage viability 0 nM 1 nM 10 nM 100 nM 200 nM Buffer only Triton X-100 0 nM 1 nM 10 nM 100 nM 200 nM Buffer only Triton X-100 Time (h) 2.0 1.5 1.0 0.5 0.0 100 80 60 40 20 0 100 80 60 40 20 0 2.0 1.5 1.0 0.5 0.0 Fold change in confluency Fold change in confluency Concentration (nM) Concentration (nM) Preparation, characterisation and in vitro assessment of siRNA-loaded lipid-based nanoparticles
Figure 8. Dose response determination of toxicity of Lipoplexes and LNPs in vitro (a) Cell growth was monitored by live cell imaging (Incucyte S3) of confluency every hour for 24 h after treatment with increasing concentrations of lipoplexes (i) or LNPs (ii). (b) Cell health/viability was measured at 24 h using the CellTiter-Glo® assay.
The rate of internalisation of both lipoplexes and LNPs was investigated using high-content spinning disk microscopy (OperaPhenix Plus). Nanoparticles loaded with Cy3-siEHMT2 were dosed to cells at 100 nM and then cultures were fixed at 0.5, 1, 2, 4, 8 and 24 h. Following fixation, cells were labelled for the nuclei (DAPI) and membrane (wheat germ agglutinin- WGA). Using Signals Image Artist™ software, the WGA stain was used to create a cell boundary mask and Cy3 ‘spots’ within this mask were quantified. To ensure the particles counted were inside the cell and not simply adherent to the surface membrane, multiple z-stack images were captured. Initial uptake was seen at 2 h which increased continuously and peaked at 8 h before reducing slightly at 24 h. No difference between the rate or level of uptake was seen between the lipoplexes and LNPs (Fig. 9). ai aiii

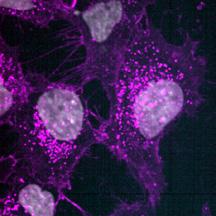


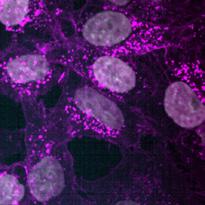


(a) Representative high-content confocal images of HeLa cells treated with buffer only (i), Lipoplexes (ii) or LNPs (iii) and labelled for DAPI (grey) and membrane by WGA (magenta). Lipoplexes and LNPs were loaded with Cy3-siEHMT2 (cyan in combined image). The number of siRNA-Cy3 spots inside the cell (bi) and the mean intensity of the siRNA-Cy3 spots (bii) was quantified. Graphs shown as mean ± standard deviation, 3 replicates.
Preparation, characterisation and in vitro assessment of siRNA-loaded lipid-based nanoparticles 9
bii Buffer Lipoplex LNP (aiii) (aii) (ai) DAPI W G A siR N A-cy3 Lipoplex Bu er 0.5h 24h 8h 4h 2h 1h DAPI siR DAPI siR N 0 4 8 12 16 20 24 0 20 40 60 Time (hours) I n t e r n a i s e d s p o t s / c 0 4 8 12 16 20 24 0 00 0 01 0 02 0 03 Time (hours) M e a n s p o t n t e n s t y [ A (aiii) (aii) (ai) siRNA-Cy3 siRNA-Cy3 DAPI W G A siR N A-cy3 Lipoplex Bu er 0.5h 24h 8h 4h 2h 1h DAPI siR N A-cy3 DAPI W siR N A-cy3 0 4 8 12 16 20 24 0 20 40 60 80 Time (hours) I n t e r n a l i s e d s p t s / c e l 0 4 8 12 16 20 24 0 00 0 01 0 02 0 03 0 04 Time (hours) M e a n s p o t i n t e n s i t y [ A U LNP LNP (aiii) (aii) (ai) siRNA-Cy3 siRNA-Cy3 Buffer only DAPI W G A siR N A-cy3 Lipoplex Bu er 0.5h 24h 8h 4h 2h 1h DAPI W G siR N A-cy3 W G A A-cy3 0 4 8 12 16 20 24 0 20 40 60 80 Time (hours) I n t e r n a l i s d s p o t s / c e l l 0 4 8 12 16 20 24 0 00 0 01 0 02 0 03 0 04 Time (hours) M e a n s p o t i n t e n s i t y [ A U ] Lipoplex LNP Lipoplex LNP (bii)
siRNA-Cy3
W G A siR N A-cy3 Lipoplex 0.5h LNP 0.5h Bu er 0.5h DAPI W G A siR N A-cy3 DAPI W G A siR N A-cy3 0 4 8 12 16 20 24 0 20 40 60 80 Time (hours) I n t e r n a l i s e d s p o t s / c e l l 0 4 8 12 16 20 24 0 00 0 01 0 02 0 03 0 04 Time (hours) M e a n s p o t i n t e n s i t y [ A U ] Buffer Lipoplex LNP Buffer Lipoplex LNP (bii) (bi) (aiii) (aii) (ai) siRNA-Cy3 siRNA-Cy3 Buffer only DAPI W G A siR N A-cy3 Lipoplex 0.5h 24h 8h 4h 2h 1h LNP 0.5h 24h 8h 4h 2h 1h Bu er 0.5h 24h 8h 4h 2h 1h DAPI W G A siR N A-cy3 DAPI W G A siR N A-cy3 0 4 8 12 16 20 24 0 20 40 60 80 Time (hours) I n t e r n a l i s e d s p o t s / c e l l 0 4 8 12 16 20 24 0 00 0 01 0 02 0 03 0 04 Time (hours) M e a n s p o t i n t e n s i t y [ A U ] Buffer Lipoplex LNP Buffer L poplex LNP
aii bi
(bi) (aiii) (aii) (ai) siRNA-Cy3
Buffer only DAPI
Figure 9. Time course internalisation of lipoplexes and LNPs.
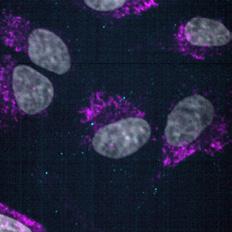


To determine the fate of Cy3-siEHMT2 cargo following uptake, a cell line was generated to visualise endosomal compartments by microscopy. CRISPR Cas-9 technology was employed to fuse Emerald GFP to the N-terminus of endogenous RAB7A, a protein localised to the late endosomes and lysosomes. Colocalisation of Cy3-siEHMT2 and RAB7A was observed at approximately 2 h post treatment and continued to increase reaching a plateau at 24 h, correlating with the observations made during uptake (Fig. 10). ai aii b


Figure 10. Time course co-localisation of lipoplexes and LNPs.
(a) Representative high-content confocal images of HeLa GFP-RAB7A cells treated with lipoplexes (i) or LNPs (ii). Rab7a (magenta), DAPI (grey) and siRNA Cy3- siEHMT2 (cyan in combined image). (b) The total number of spots inside the cell and spots colocalised to Rab7a were quantified and graph shows mean ± standard deviation for n=3 replicates.
Preparation, characterisation and in vitro assessment of siRNA-loaded lipid-based nanoparticles 10
Lipoplex LNP Lipoplex LNP (ai) DAPI GFP-Rab7a siR N A-cy3 0.5h 24h 8h 4h 2h 1h 0.5h 24h 8h 4h 2h 1h (aii) DAPI GFP-Rab7a siR N A-cy3 GFP-Rab7a siRNA-cy3 GFP-Rab7a siRNA-cy3 (b) 0 4 8 12 16 20 24 0 20 40 60 Time (hours) S p o t s colocalised with Rab7/Cell f Lipoplex LNP Total Rab7 Lipoplex LNP (ai) DAPI GFP-Rab7a siR N A-cy3 0.5h 24h 8h 4h 2h 1h 0.5h 24h 8h 4h 2h 1h (aii) DAPI GFP-Rab7a siR N A-cy3 GFP-Rab7a siRNA-cy3 GFP-Rab7a siRNA-cy3 (b) 0 4 8 12 16 20 24 0 20 40 60 80 Time (hours) S p o t s colocalised with Rab7/Cell Buffer Lipoplex LNP Total Rab7 0 4 8 12 16 20 24 Time (hours) Buffer Lipoplex LNP Total Rab7 80 60 40 20 0 Spots colocalised with Rab7/Cell
To identify the cellular mechanism involved in NP endocytosis, cells were pretreated with the following inhibitors:
Chlorpromazine: A cationic amphiphilic drug that modulates clathrin specific endocytosis of various ligands receptors and nanoparticles
Nystatin: Primarily inhibits caveolaemediated endocytosis
(ai)
(ai)
Lipoplex
Untreated Chlorpromazine Nystatin Cytochalasin
Cytochalasin D: A cationic amphilic drug that modulates clathrin-specific endocytosis of various ligands, receptors and nanoparticles.
DAPI WGA siRNA-cy3
siRNA-cy3
(aii)
DAPI WGA siRNA-cy3
siRNA-cy3
(bi)

Lipoplex LNP
Fig. 11 indicates that both the lipoplexes and LNPs were internalised predominantly via caveolae mediated endocytosis. Nystatin treatment inhibited the uptake of both NP, however, LNPs demonstrated a greater reduction in total number of spots (~80%), compared to lipoplexes, which showed more variability in uptake efficiency (40%). Chlorpromazine, however, did not appear to have any impact on cellular uptake, suggesting that, under these conditions, clathrin-mediated pathways are not critical. The literature suggests that depending on the conditions, cell type and distinct characteristics of the nanoparticles, the mode of endocytosis can vary. Kubota et al. also showed significant reduction in both lipoplexes and LNPs uptake in HeLa cells pretreated with nystatin4. However, there are also reports demonstrating that clathrin mediated endocytosis is the primary endocytic pathway involved in LNP uptake5. Interestingly, the mean Cy3 spot intensity decreased substantially with cytochalasin D treatment (~40% for both lipoplexes and LNPs), despite smaller changes in the total number of internalised spots, suggesting actin plays a role in internalisation of the particles. It is unsurprising that both the lipoplexes and LNPs had a similar mechanism of uptake as their physical properties in terms of size and z-potential were comparable.


DAPI WGA siRNA-cy3


(ai) Lipoplex Untreated Cytochalasin D
DAPI WGA siRNA-cy3 WGA

siRNA-cy3

(aii)


Untreated Chlorpromazine Nystatin Cytochalasin D


Untreated Chlorpromazine Nystatin Cytochalasin

Untreated Cytochalasin D siRNA-cy3
siRNA-cy3
(bi)

DAPI WGA siRNA-cy3 reatedChlorNystatinCytoDUntreatedChlorNystatinCytoD


Untreated Chlorpromazine Nystatin Cytochalasin D


(bii)

Lipoplex LNP
(bii)

0
NystatinCytoDUntreatedChlorNystatinCytoD
Figure 11. Mechanism of cellular internalisation of Lipoplexes and LNPs.
(a) Representative high-content confocal images of HeLa cells treated with, Lipoplexes (i) or LNPs (ii) and labelled for DAPI (grey) and membrane by WGA (magenta). Prior to treatment, internalisation mechanisms were inhibited with Chlorpromazine, Nystatin or Cytochalasin D. The number of siRNA-Cy3 spots inside the cell was quantified (bi) and the mean intensity of the siRNA-Cy3 spots (bii). Graphs shown are mean data ± standard deviation, 3 replicates.
11
Lipoplex bii (ai) Lipoplex Untreated Cytochalasin D Untreated Chlorpromazine Cytochalasin
siRNA-cy3 siRNA-cy3
ai
D
ed or tin
Treatment ed or atin C D ed or tin D ed or tin D
D reatedChlorNystatinCytoDUntreatedChlorNystatinCytoD
Treatment p
ati C a f
05
U
00 0 01 0 02 0 03 0 04
M e a n s p o t i n t e n s t y [ A U ]
at Treatment /
UntreatedChlor
0
Treatme
Buffer Lipoplex
0 05
0 00 0 01 0 02 0 03 0 04 Treatment M e a n s p o t i n t e n s i t y [ A U ] Buffer Lipoplex LNP 100
Cy
Cy
0 50 Treatment n t e r n a l i s e d s p o t s / c e l Buffer Lipoplex LNP Preparation, characterisation and in vitro assessment of siRNA-loaded lipid-based nanoparticles
UntreatedChlorNystatinCytoDUntreatedChlorNystatinCytoDUntreatedChlorNystatinCytoD
UntreatedChlorNystatinCytoDUntreatedChlorNystatin
toDUntreatedChlorNystatin
toD
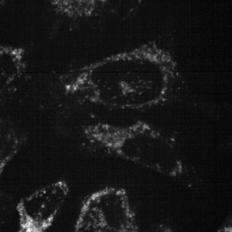
One of the major bottlenecks with the adoption of NA-based therapies is that efficacy is often hampered due to poor cytoplasmic delivery of the payload or cargo. Endosomal escape of siRNA is essential for subsequent processing by endogenous cell machinery. Additionally, if the endosome containing payload merges with a lysosome, the entrapped molecules can become susceptible to degradation due to the presence of hydrolytic enzymes. In this study, NP synthesis was conducted at pH 3 allowing the ionisable lipid to interact electrostatically with the siRNA. Following cellular uptake, as the endosomal pH decreases, these ionisable lipids become cationic, facilitating endosomal escape. The endosomal escape assay described by Munson et al. was adapted and implemented to determine the onset of rupture induced by the lipoplexes and LNPs6. A lentiviral construct was generated encoding human galectin-9 (LGALS9) fused to eGFP. GAL-9 interactions with glycan structures and β-galactosidases post-endosomal rupture are detectable as GAL9-eGFP transitions from diffuse cytoplasmic distribution to forming obvious puncta at the site. Live-cell imaging was performed on an Incucyte SX5 to capture puncta formation at multiple timepoints and speck analysis was performed using the Incucyte 2021A software by filtering on size and intensity of GFP spots. Both lipoplexes and LNPs showed rapid GAL9-eGFP recruitment, initiating within 2 h and increasing to 24 h (Fig. 12). This is consistent with both particles containing D-Lin-MC3-DMA, a potent and clinically adopted ionisable lipid.


Preparation, characterisation and in vitro assessment of siRNA-loaded lipid-based nanoparticles 12
a b 0 2 4 8 12 24 Time (hours) 0.020 0.015 0.010 0.005 0.000 Buffer Lipoplex LNP Normalised Gal9-eGFP spot [a.u.] 0h 2h 12h 24h
Figure 12. GAL9-eGFP mediated sensing of endosomal rupture in HeLa cells treated with nanoparticles. (a) Representative images of endosomal rupture over time (0-24 h) post treatment with LNPs and lipoplexes (b) GAL9-eGFP puncta were counted for each condition at each timepoint and normalised to cell confluency. Graphs shown as mean ± standard deviation, 3 replicates.
To determine potency of the NP, expression of the siRNA target, EHMT2, was analysed by western blot. Fig. 13 demonstrates that both lipoplexes and LNPs efficiently knockdown EHMT2. Knockdown was comparable to a commercial transfection reagent, Lipofectamine™ RNAiMAX demonstrating over 80% knockdown at 48 h, (the timepoint identified in Fig. 2), indicating highly efficient delivery of both LNP and lipoplexes to the cells.

13
a b
Figure 13. – Transfection efficiency of lipoplexes and LNPs.
Normalised signal intensity
Lipoplex RNAimax LNP 100 80 60 40 20 0
Ladder Lipoplex LNPRNAimax Preparation, characterisation and in vitro assessment of siRNA-loaded lipid-based nanoparticles
(a) Western blot analysis of EHMT2 expression following transfection of HeLa cells with 100 nM of lipoplexes and LNPs for 48 h. (b) Normalised quantitative analysis of western blot data by densitometry analysis. Graphs shown as mean ± standard deviation, 3 replicates.
Bufferalone
Bufferalone
Conclusions
Since the success of LNPs as nanocarriers in the FDA and EMA approved mRNA SARS-Cov-2 vaccines and the Onpattro siRNA formulation, there has been a notable increase in the development of therapeutic lipid-based formualtions.
This study investigated in vitro efficacy of two different types of lipid-based nanoformulations - lipoplexes and LNPs - which were composed of the same lipids but manufactured differently.
Both particle types performed well as evidenced by comparable uptake, endosomal escape, and efficacy similar to a commercial transfection reagent, Lipofectamine™ RNAiMAX. It was initially hypothesised that the LNPs may demonstrate better efficacy that lipoplexes due to the manufacturing conditions i.e., mixing an alcoholic lipid solution with aqueous NA solution in one step for improved encapsulation. For example, in the Kubota et al (2017) study4. At a concentration of 100 nM, ‘one-step’ LNPs more efficiently delivered siRNA compared to lipoplexes into HeLa cells. However, the composition of lipids incorporated in that study was different using DODMA, PEG-DSPE, DSPC and cholesterol in a molar ratio of 50:1.5:10:38.5. In this study, we chose to investigate a composition like the clinically approved ONPATTRO® formulation. This incorporated MC3 as the ionisable lipid, which has been reported to demonstrate greater potency for in vitro transfection than DODMA, potentially attributable to differences in pKa and ultrastructural features7. Ionisable lipids which form the bulk of lipids among commercially approved LNP formulations are neutral at physiological pH and positively charged at acidic pH.
This helps in minimising toxicity while simultaneously facilitating endosomal release of siRNA through endosomal disruption at low pH8. Perhaps, for this lipid composition, a concentration of 100 nM exceeds the optimal concentration for high transfection efficiency thus obscuring potential differences in performance between the formulations. A concentration response assay may have exposed the true impact of the different manufacturing method.
Importantly, distinguishable differences in the physical properties of the lipoplexes and LNPs were observed. Super resolution microscopy highlighted that the localisation of Cy3-siEHMT2 within the formulations were different. In the lipoplexes, the siRNA appeared to be decorated more on the surface of the particles, compared to the LNPs that showed better encapsulation of cargo within the lipids. The protection of cargo can be critical to function of NPs, particularly when considering in vivo applications. siRNA that is exposed on the surface of lipoplexes, when injected in vivo could be susceptible to degradation via nucleases in contrast to siRNA which is encapsulated within the core of LNPs. Moreover, naked siRNA has been shown to induce immunogenicity both in vitro and in vivo 9,10. HeLa cells are known to possess immune sensing capabilities as they express some Toll-like receptors, a class of protein that plays a role in innate immunity and can be responsive to double stranded RNA, including siRNA10. Kubota et al did also observe a significant upregulation of IL-1β production, a key inflammatory marker, in lipoplexes compared to LNPs in their study. Although immune profiling was not explored in this study, it is possible
Acknowledgements
Lorraine Jones, Senior Scientist at Seda for support in manufacturing the NA-loaded lipid-based nanoparticles; Marcel de Matas, Seda Chief Technology Officer and Paul Gellert, Seda’s Associate – Complex Medicines for their help in conceptualisation of the study. Sarah Brockbank, Strategy Leader – Complex Medicines at MDC to support the development of the study and publication.
Nucleic acid therapies hold great promise for treating diseases considered undruggable by small molecules.
that the loading differences highlighted by SMLM, and undetectable in any of the physical characterisation or efficacy assays, could have played a significant role in predicting the performance of each particle in an in vivo setting.
Nucleic acid therapies hold great promise for treating diseases considered undruggable by small molecules, however, they are intrinsically more complex and prediction of biodistribution and efficacy in vivo remains a challenge. This study demonstrates the requirement for in depth characterisation in vitro prior to preclinical administration in vivo. Both MDC and Seda have developed core capabilities to facilitate this characterisation and aim to assist collaborators progress their nucleic acid therapies closer to the clinic.
14
Preparation, characterisation and in vitro assessment of siRNA-loaded lipid-based nanoparticles

About Seda
Seda, founded in 2015, provide integrated Pharmaceutical Development and Clinical Pharmacology support to the Biotech sector. We enable rapid and efficient development of optimal medicinal products, from conventional to complex, through pragmatic and coherent scientific excellence.
Headquartered in Greater Manchester UK, our bespoke facility is well-equipped for the rapid design, development and evaluation of prototype formulations. Through a combination of laboratory, pharmacokinetic modelling and consultancy services, we help clients design and develop formulations with optimal in vivo performance alongside robust manufacturability.
Enhancing the value proposition of our clients is our contribution to bringing new, innovative therapies to patients rapidly and successfully.
More information: sedapds.com
About MDC
Medicines
Discovery Catapult (MDC) is an independent, not-for-profit innovation centre for drug discovery and part of the Catapult Network established by Innovate UK.
MDC’s vision is to reshape drug discovery for patient benefit by transforming great UK science into better treatments through partnership. It supports drug discovery innovators by making world-class expertise, facilities, complex technologies and advanced analytics accessible to enable successful medicines discovery.
MDC develops pioneering, impactful R&D collaborations across biotech, academia, technology companies, charities, and global pharma. It brings these communities together in active, focused national programmes that target high-risk areas of patient need.
In doing so, MDC helps to create a thriving UK drug discovery sector and translates the best of UK science into the best new treatments for the benefit of patients worldwide.
More information: md.catapult.org.uk
15
Preparation, characterisation and in vitro assessment of siRNA-loaded lipid-based nanoparticles
References
1. Nucleic Acid Based Therapeutics Market Size & Share AnalysisIndustry Research Report - Growth Trends (mordorintelligence.com)
2. Syama, K., Jakubek, Z.J., Chen, S., Zaifman, J., Tam, Y.Y.C. and Zou, S., 2022. Development of lipid nanoparticles and liposomes reference materials (II): cytotoxic profiles. Scientific Reports, 12(1), p.18071.
3. Culley, S., Albrecht, D., Jacobs, C., Pereira, P.M., Leterrier, C., Mercer, J. and Henriques, R., 2018. Quantitative mapping and minimization of superresolution optical imaging artifacts. Nature methods, 15(4), pp.263-266.
4. Kubota, K., Onishi, K., Sawaki, K., Li, T., Mitsuoka, K., Sato, T. and Takeoka, S., 2017. Effect of the nanoformulation of siRNA-lipid assemblies on their cellular uptake and immune stimulation. International journal of nanomedicine, pp.5121-5133.
5. Gilleron, J., Querbes, W., Zeigerer, A., Borodovsky, A., Marsico, G., Schubert, U., Manygoats, K., Seifert, S., Andree, C., Stöter, M. and Epstein-Barash, H., 2013. Image-based analysis of lipid nanoparticle–mediated siRNA delivery, intracellular trafficking and endosomal escape. Nature biotechnology, 31(7), pp.638-646.
6. Munson, M.J., O’Driscoll, G., Silva, A.M., Lázaro-Ibáñez, E., Gallud, A., Wilson, J.T., Collén, A., Esbjörner, E.K. and Sabirsh, A., 2021. A high-throughput Galectin-9 imaging assay for quantifying nanoparticle uptake, endosomal escape and functional RNA delivery. Communications biology, 4(1), p.211.
7. Carrasco, M.J., Alishetty, S., Alameh, M.G., Said, H., Wright, L., Paige, M., Soliman, O., Weissman, D., Cleveland IV, T.E., Grishaev, A. and Buschmann, M.D., 2021. Ionization and structural properties of mRNA lipid nanoparticles influence expression in intramuscular and intravascular administration. Communications biology, 4(1), p.956.
8. Han, X., Zhang, H., Butowska, K., Swingle, K.L., Alameh, M.G., Weissman, D. and Mitchell, M.J., 2021. An ionizable lipid toolbox for RNA delivery. Nature communications, 12(1), p.7233.
9. Cho, W.G., Albuquerque, R.J., Kleinman, M.E., Tarallo, V., Greco, A., Nozaki, M., Green, M.G., Baffi, J.Z., Ambati, B.K., De Falco, M. and Alexander, J.S., 2009. Small interfering RNA-induced TLR3 activation inhibits blood and lymphatic vessel growth. Proceedings of the National Academy of Sciences, 106(17), pp.7137-7142.
10. Sui, H., Zhou, M., Chen, Q., Lane, H.C. and Imamichi, T., 2014. siRNA enhances DNA-mediated interferon lambda-1 response through crosstalk between RIG-I and IFI16 signalling pathway. Nucleic acids research, 42(1), pp.583-598.
Preparation, characterisation and in vitro assessment of siRNA-loaded lipid-based nanoparticles 17


 Fanny Jouberta, Nisha Ponnappanb, Lauren Tomsb, Claire Pattersona and Lorna FitzPatrickb


