Local Market Update – April 2022
Key Metrics
2021
2022
Percent Change
2021
2022
118
144
21 the Multiple32Listing Service + 52.4% A Research Tool Provided by of
New Listings
A Research Tool Provided by the Multiple Listing Service of Hilton Head Island and the Hilton Head Area Association of REALTORS®
84
- 36.4%
Real Estate Market Report
Median Sales Price*
Local Market Update – April 2022 A Research Tool Provided by the Multiple Listing ServiceSea of Pines Hilton Head Island and the Hilton Head Area Association of REALTORS®
$1,600,000
$1,247,500
+ 28.3%
$1,375,500
$1,100,000
+ 25.0%
Sea Pines | April 2022 Sea LocalPines Market Update – April 2022
ercent of List Price Received*
97.4%
102.0%
+ 4.7%
96.8%
100.4%
84
84
+ 0.7%
108
73
ays on Market Until Sale
+ 3.7% Detached Homes Only - 31.8%
30 49 A Research Tool Provided by the+ 63.3% Multiple Listing-- Service of --Hilton Head Island andHilton the Head HiltonArea Head Area Association of REALTORS® Hilton Head Island and the Association of REALTORS®
nventory of Homes for Sale
Sea Pines
A Research Tool Provided Detached Homes Onlyby the Multiple Listing Service of
oes not account for sale concessions and/or downpayment assistance. | Percent changes are calculated using rounded figures and can sometimes look extreme due to small sample size.
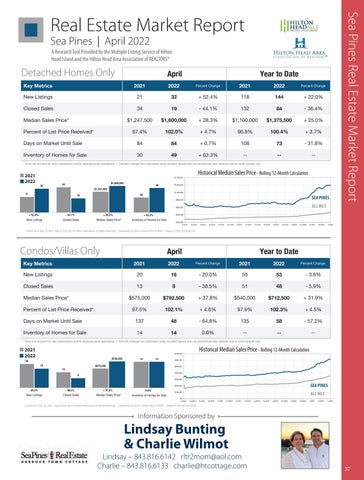
April
Detached Homes Only
Local Market Update – April 2022 Detached Homes Only
Sea Pines
A Research Tool Provided by the Multiple Listing Service of Hilton Head Island and the Hilton Head Area34 Association of REALTORS®
32
Key Metrics
NewPines Listings Sea Detached Homes Only
21
19
Detached Homes Only
ocal MarketClosed Update – April 2022 Sales
esearch Tool Provided by the Multiple Listing Service of on Head Island and the Hilton Head Area Association of REALTORS® + 52.4% - 44.1%
Median Sales Price* Key Metrics
2021
2022 32
+ 52.4%
30
2022
Percent Change
New Listings
21
32
+ 52.4%
118
144
+ 22.0%
Closed Sales 2021 2022
34
19
- 44.1%
132
84
- 36.4%
$1,247,500
$1,600,000
+ 28.3%
$1,100,000
$1,375,500
+ 25.0%
97.4%
102.0%
+ 4.7%
96.8%
100.4%
+ 3.7%
84
April
Inventory of Homes for Sale
32
2021 84
+ 0.7%
108
49
+ 63.3%
--
30
+ 52.4%
Year to Date
118
2022 144
Percent Change - 31.8% 73
2021
19April
$1,247,500 2021 2022
- 44.1% 34
+32 28.3%
2021
Percent Change
132
32
21
April
+ 63.3% $1,600,000
Percent Change
2022
+ 52.4%
84
118
Year to Date $1,600,000
$1,100,000$1,247,500 $1,375,500
+ 22.0%
--
2022
2021 - 36.4%
2022
144
49 + 25.0%
- 44.1% 132 84 Percent 30 Change 2021 2022 + 3.7% 100.4% 44.1% 132 Median- Sales Price* $1,247,500 + 28.3% $1,100,000 $1,600,000 $1,375,500 New Listings $1,247,500 $1,600,000 + 28.3% $1,100,000 $1,375,500 21 + 25.0% + 52.4% 118 + 22.0% 32 144 Median Sales Price* istorical Median Sales Price Rolling 12-Month Calculation Days on Market Until Sale Percent of List Price Received* 84 + 0.7% 102.0% 108 + 4.7% 73 84All MLS — 97.4% 96.8%- 31.8%100.4% Percent of List Price Received* 97.4% + 4.7% 96.8% + 3.7% 102.0% 100.4% Sea19 Pines — + 52.4% + 28.3% ondos / Villas Only + 63.3% Closed Sales 34 - 44.1% - 44.1% 132 - 36.4% 84 Days on Market Until Sale + 0.7% 108 - 31.8% 84 New Listings Closed Sales Median Sales Price* Inventory of Homes for Sale 400,000 Inventory of Homes for84 Sale Days 3073 --49 on Market Until Sale 84+ 63.3% + 0.7% -108 84 73 Inventory of Homes for Sale 30 + 63.3% --49 -Median Sales Price* $1,247,500 + 28.3% $1,100,000 + 25.0% $1,600,000 $1,375,500 April Yearusing to Date * Does not account for sale concessions and/or downpayment assistance. | Percent changes are calculated rounded figures and can sometimes look extreme due to small sample size. 200,000 Historical Median All MLS — InventoryPercent of Homes for Sale 30 Sales Price Rolling -4912-Month Calculation+ 63.3% -Change Percent Change ey Metrics 2021 2022 2021 Sea Pines — Percent of List Price Received* 97.4% 2022 102.0% + 4.7%Median Sales 96.8% + 3.7% Historical Price - Rolling100.4% 12-Month Calculation 000,000 April2021 2021 2022 * Does not account for sale concessions and/or downpayment assistance.$1,400,000 | Percent changes are calculated using rounded figures and can sometimes look extreme due to small sample size. ew Listings 20 - 20.0% 55 - 3.6% 16 53 2022 Days on Market 2021 2022 Local $1,600,000 Until Sale 84 49 + 0.7%– April 2022108 - 31.8% 84 Market Update 73 800,000 34 $1,200,000 New Listings New Listings
Closed Sales Median Sales Price*
Closed Sales21
Key Metrics
Percent of List Price Received* Closed Sales 34 19
Sea Pines
of + 22.0% 144 Inventory
2021
118
97.4% 84
19
Year to Date
--
* Does not account for sale concessions and/or downpayment assistance. | Percent changes are calculated using rounded figures and can sometimes look extreme due to small sample size.
Year to Date
+ 28.3%
Percent Change
2021
Percent 49 of List Price Received*
34
New April Listings
Percent Change
Percent Change 2022 Days on Market Until Sale
21
Key Metrics
2022
Median Sales Price*
2021
Year to Date
2021
April
$1,600,000
$1,247,500
April
-Key Metrics
Homes for21Sale 34
2022
Percent Change
- 36.4% 102.0%
19
+ 4.7%
96.8%
* Does not account for sale concessions and/or downpayment assistance. | Percent changes are calculated using rounded figures and can sometimes look extreme due to small sample size.
Local April Market Update – April 2022
A Research32Tool Provided 13 by the Multiple8Listing Service of 51 $1,247,500 - 38.5% Hilton Head Island and the Hilton Head Area Association of REALTORS® 21 Inventory of$575,000 Homes Sale 30 30 19 for edian Sales Price* + 37.8% $540,000 $792,500 34
osed Sales
April
600,000
32 * Does not account for sale concessions and/or downpayment assistance.
400,000
rcent of List Price Received*
Sea Pines
200,000 ays on Market Until Sale+ 52.4%
21
April New Listings ventory of Homes for Sale 4-2014
10-2014
102.1%
97.5%
4-2015
10-2015
4-2016
137 - 44.1%
10-2016
4-2017
48
10-2017
Closed Sales
14
14
+ 63.3% $1,600,000
4-2019
10-2019
135
Sea Pines
+ 63.3% 4-2020 10-2020
19
+ 4.5%
$1,247,500 $600,000 34
58
4-2021
Inventory of Homes for Sale
0.0%
--
--
- 57.2% Condos /4-2022 Villas Only $400,000 10-2021 --
$200,000 4-2014
19 10-2015
10-2014
4-2015
pril
+ 52.4% Condos/Villas Only
$792,500 - 44.1%
$575,000+
New Listings
$1,000,000
16
Key Metrics13
Sea NewPines Listings
8
Historical Median Sales Price + 52.4%
Condos $400,000 / Villas Only
Closed Sales
$200,000 4-2014
10-2014
- 20.0%
4-2015
Key Metrics
New ListingsMedian New$1,400,000 Listings
10-2015
4-2016
10-2016
4-2017
2021 SalesClosed Price* Sales
+ 28.3%
2022
10-2018
10-2019
4-2020
10-2020
4-2021
10-2021
48
137
$1,400,000 Inventory of Homes for14 Sale$1,000,000 14
Inventory of Homes for Sale
,000
2021
135
0.0%
--
58
- 57.2%
14--
--
- 31.8% --
202
2022
Percent Change
49
8 $792,500
- 38.5%
102.1%
48
- 5.9%
$712,500
+ 31.9%
51
63.3% Year30to+ Date + 37.8%
$540,000
+ 4.6% 97.9% + 4.5% 102.3% + Inventory 28.3% of Homes for Sale + 63.3%
- 64.8% 2021 48 2022 135 Median Sales Price* 14 0.0% -14 55 53
137
Percent - 57.2% 58 Change
Inventory of Homes for Sa --- 3.6% 2022
All MLS — Sea Pines —
4-2022
13
+ 4.6%
51
- 64.8%
+ 3.7%
49
Percent Change
- 38.5%
+ 25.0%
2022 10-2020 to4-2021 Year Date10-2021304-2022
* Does not account for sale concessions and/or downpayment assistance. | Percent changes are calculated using rounded figures and can sometimes look extreme due to small sample size.
- 5.9% 102.1% 48 97.5% $1,200,000 Historical Median Sales+ 37.8% Price$540,000 Rolling$712,500 12-Month Calculation storical Median Sales Price Rolling 12-Month Median Sales Price* $575,000Calculation + 31.9% $792,500 All MLS $1,200,000 Days on Market Until Sale 137 48 Sea Pines Percent of List Price Received* 97.5% + 4.6% 97.9% + 4.5% 102.1% 102.3%
$1,000,000
13
- Median 44.1% Sales Price*97.5%
Percent Change
$1,400,000
Days on Market Until Sale
4-2020
Rolling 12-Month Calculation
4-2019
+ 37.8%
- 36.4%
2021 10-2019
+ 63.3% All MLS 2021 — 51 - 5.9% 48 Sea Pines — 14 0.0% $792,500 Closed Sales Median Sales Price* Inventory of Homes for Sale 14 20 2021 2022 $575,000 $540,000 $575,000$712,500 + 31.9% Median Sales Price* Inventory $792,500 of Homes for Sale +1637.8%
4-2018
13 8 Percent of List Price Received*
,000
4-2019
Percent Change
$575,000
Percent Days on Market Until Sale Change 2022 Closed Sales Inventory of Homes for Sale - 20.0% 16
Current as of May 10, 2022. Data © 202220 MLS of Hilton Head Island. | Sponsored by South ShowingTime. - 20.0% 55Carolina REALTORS®. 16 All Rights Reserved. 53 | Report © 2022- 3.6%
Closed Sales
10-2018
- 44.1% 28.3% 13 - +38.5% 8 April Historical Median April YearSales to Date Price Rolling 12-Month Calculation
10-2017
- 38.5% New Listings
2022
Percent of List Price Received*
52.4% Closed Sales
2021 New Listings 20
$800,000
$600,000
April14
10-2017
+ 22.0%
Current as of May 10, 2022. Data © 2022 20 MLS of Hilton Head Island. | Sponsored by South - 20.0% 55Carolina REALTORS®. 3.6% 16 All Rights Reserved. 53| Report © 2022- ShowingTime.
Median Sales Price*
19 14
4-2018 April
4-2017
Closed Sales
Local Market Update 21 – April 2022
$1,200,000
20
10-2016
2022 $1,247,500
2021
$1,400,000
A Research Tool Provided by the Multiple Listing Service of Hilton Head Island and the Hilton Head Area Association of REALTORS®
4-2016
2021 $1,600,000
34
32
30
Percent Chan
2021
--
49 SEA PINES ALL MLS
$1,600,000
$1,247,500
es not account for sale concessions and/or downpayment assistance. | Percent changes are calculated using rounded figures and can sometimes look extreme due to small sample size. Current as of May 10, 2022. Data © 2022 MLS of Hilton Head Island. All Rights Reserved. | Sponsored by South Carolina REALTORS®. | Report © 2022 ShowingTime. Key Metrics Rolling 12-Month Calculation All MLS — New Listings Sea Pines —
Historical Median/Sales PriceOnly Condos Villas
--
--
$800,000
102.3%
97.9%
Median Sales Price*
21
49 + 31.9%
$712,500
32
- 64.8% + 28.3% 10-2018
A Research Tool Provided by the Multiple Listing Service of - 5.9% Hilton Head Island and the Hilton Head Area Association of REALTORS®
$1,000,000
| Percent changes are calculated using rounded figures and can sometimes look extreme due to small sample size.
+ 4.6%
4-2018
48
Sea Pines Real Estate Market Report
Hilton Head Island and the 34 Hilton Head Area of REALTORS® - 44.1% 132 19 Association
Closed Sales
Percent Change
Local Market Update – April 2022 + 22.0%
— —
- 20.0%
- 64.8%
- 38.5%
New Listings
14
102.3%
8 97.9%
135
Closed Sales
0.0%
+ 37.8%
+ 4.5% All MLS — - 57.2% Sea Pines — 0.0%
58
Median Sales Price*
Inventory of Homes for Sale
--
--
--
*$800,000 Does not account for sale concessions and/or downpayment assistance. | Percent changes are calculated using roundedHistorical figures andMedian can sometimes extreme due12-Month to smallCalculation sample size. Saleslook Price Rolling
* Does not account for sale concessions and/or downpayment assistance. | Percent changes are calculated using rounded figures and can sometimes look extreme due to small sample size.
$800,000
$1,200,000
,000
April2021
2021
$600,000
,000
2022$1,000,000 April
$600,000
$400,000 16
$800,000
,000
$792,500
4-2014 4-2015 - 20.0% 10-2015
14
13
10-2014
4-2016
$400,000 New Listings
$792,500
14
$300,000 $200,000 10-20154-2014 4-201610-2014 10-2016 4-2017 10-2017 4-2018 10-2018 4-2015 10-2015 4-2016 4-2017 4-2019 10-2017 10-2019 4-2018 $200,000 10-2016
10-2017
4-2018
Closed Sales
+10-2018 37.8%
13
4-2019
10-2019
Median Sales Price*
4-2020 0.0%10-2020
4-2021
4-2020 10-2018 10-2020 4-2019
$575,000
10-2021
14 4-2021 10-2019
4-2014
10-2015
4-2016
$0 4-2014
10-2014
10-2021
10-2015
4-2016
10-2016
4-2017
10-2017
4-2018
10-2018
4-2019
10-2019
10-2018
Information Sponsored by
4-2019
10-2019
4-2020
10-2020
4-2020
10-2020
4-2021
Closed Sales
$300,000 $200,000
10-2021
4-2022
4-2021
10-2021
4-2022
Current as of May 10, 2022. Data © 2022 MLS of Hilton Head Island. All Rights Reserved. | Sponsored by South Carolina REALTORS®. | Report © 2022 ShowingTime.
Median Sales Price*
Lindsay – 12-Month 843.816.6142 Historical Median Sales Price Rolling Calculation rltr2mom@aol.com Charlie – 843.816.6133 charlie@htcottage.com
Inventory of Homes for Sale
$100,000
$0 4-2014
10-2014
$700,000
4-2015
10-2015
4-2016
10-2016
4-2017
10-2017
4-2018
10-2018
4-2019
10-2019
4-2020
10-2020
4-2021
10-2021
4-2022
Current as of May 10, 2022. Data © 2022 MLS of Hilton Head Island. All Rights Reserved. | Sponsored by South Carolina REALTORS®. | Report © 2022 ShowingTime.
4-
by South©Carolina REALTORS®. | Report © 2022 Showing Report 2022 ShowingTime.
- 38.5% 37.8%| Sponsored by South Carolina REALTORS®. | 0.0% Current as of May 10, 2022. Data © 2022 MLS of Hilton Head Island. All Rights+Reserved. Report © 2022 ShowingTime.
New Listings
$400,000
4-2018
4-2021
ALL MLS 4-2015
Lindsay Bunting & Charlie Wilmot
- 20.0%
$500,000
All MLS — 10-2017 4-2017 Sea Pines —
10-2016
$700,000 $600,000
4-2022 SEA10-2020 PINES
Inventory of Homes for Sale
8
Rolling 12-Month Calculation 10-2014 4-2015
10-2021 4-2020
4-2022
$100,000
Current of May 10, 2022. Data © 2022Reserved. MLS of Hilton Head Island. Rights Reserved. | Sponsored| of All May 10, 2022. | Data © 2022 MLS ofas Hilton Head Island. AllShowingTime. Rights | Sponsored byAll South Carolina REALTORS®. Current as of May 10, 2022. Data © 2022 MLS of Current Hilton Headas Island. Rights Reserved. Sponsored by South Carolina REALTORS®. | Report © 2022
$200,000 Historical Median Sales Price
2022
$500,000 $400,000
4-2015 16
10-2016 - 38.5% 4-2017
2021
$600,000
$400,000 8
$600,000
10-2014
14
$575,000
20 $200,000
,000 $0 4-2014
$700,000
20
,000
All MLS — Sea Pines —
Historical Median Sales Price - Rolling 12-Month Calculation
2022
All MLS — Sea Pines —
37


