Local Market Update – October 2021 2021 Local Market Update – October Local Market Update – October 2021 Real Estate Market Report Hilton Head Plantation | October 2021 Hilton Head Plantation Local Market Update – October 2021 HiltonLocalHead Plantation Hilton Head Market Update – October 2021 Plantation Hilton Head Island and the Hilton Head Area Association of REALTORS®
A Research Tool Provided by the Multiple Listing Service of Hilton Head Island and the Hilton Head Area Association of REALTORS®
A Research Tool Provided by the Multiple Lsting Serve of Hilton Head Island
A Research Provided by the Multiple of Listing Service of and theTool Hilton Head Area Association REALTORS® Hilton Head Island and the Hilton Head Area Association of REALTORS®
Local Market Update – October October2021
A Research Tool Provided by the Multiple Listing Service of Hilton Head Island and the Hilton Head Area Association of REALTORS® A Research Tool Provided by the Multiple Listing Service of Hilton Head Island and the Hilton Head Area Association of REALTORS®
Year to Date
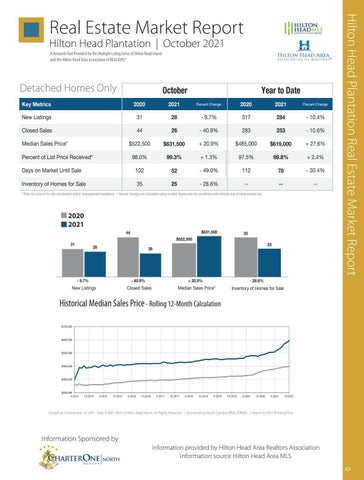
Detached Homes Only2020Plantation 2021 October Hilton Head
Key Metrics
Percent Change
Hilton Head Plantation 2020 2021 Hilton Head Plantation 31 28
New Listings
Key Metrics
Closed Sales
New Listings
Median Sales Price*
Percent of List Price Received* Key Metrics
284
2021 2020
- 10.4% Percent Change
253
- 10.6% - 9.7% 284
28
- 9.7%
317 Percent Change
44 New Listings
26
- 40.9%
283 31 - 9.7%
$631,500
Closed $522,500 Sales
Key Metrics Closed Sales
2021 October
31
Key Metrics
44 2020 99.3% 2020
98.0%Price* Median Sales
2020
October
+ 20.9%
Year to Date
2020
28
Percent Change
317
2021
$619,000
$485,000
Year to Date
Percent Change 2021 2020
317 - 10.4%
284
283
253
Year to Date + 27.6%
44 - 40.9% 26 October Year283 to Date Percent Change 2020 2021 - 40.9% 26 2021 253 + 1.3%Percent + 2.4% 99.8% $522,500 20.9% $631,500 October Year Change 97.5% Percent Change 2021 2020 2021 to+ Date
- 10.6%
Percent Change
$485,000 $619,000 31 - 9.7% 317 - 10.4% 28 284 + 20.9% $485,000 + 27.6% $631,500 $619,000 Percent Change Percent Change New Listings 3152 - -10.4% 28-2021 284 2021+ 1.3% Percent of102 List Price Received* 98.0% 112 3172020 97.5% 99.3% 78 99.8% Days on Market Until Sale 49.0% - 9.7% 30.4% Closed Sales 44 - 40.9% 283 - 10.6% 26 253 New Listings 31 9.7% 317 10.4% 28 284 Percent of List Price Received*Days on Market 98.0% + 1.3% 97.5% 99.3% 99.8% 44 - 10.6% 26 102 112 + 2.4% 78 Inventory of Homes for Closed Sale Sales 35 Until Sale - 28.6%- 40.9% -- 283 52 --253 - 49.0% -25 Median Sales Price* $522,500 + 20.9% $485,000 + 27.6% $631,500 $619,000 Closed Sales 44 - 40.9% 283 - 10.6% 26 253 Sales assistance. Price* | Percent changes are calculated using $522,500 20.9% $485,000 + 27.6% $631,500 * Does not account for sale concessions and/or downpayment rounded can sometimes look+extreme to small sample size. 25 $619,000 - 28.6% Inventory of Homes for Sale figures and 35 -- - 30.4% -Days on Market Median Until Sale 102 -due49.0% 112 52 78 Percent of Median List Price 98.0% + 1.3%$485,000 97.5% + 2.4% 99.3% + 20.9% SalesReceived* Price* $522,500 +99.8% 27.6% $631,500 $619,000 New Listings
Median Sales Price* Key Metrics
$522,500 2020
not account for sale concessions 98.0% and/or downpayment 99.3% assistance. Percent of List Price* Does Received*
InventoryDays of Homes for Sale Percent of ListSale Price Received* on Market Until October Days on Market Until Sale
| Percent using rounded figures and can sometimes extreme due to small sample size. + changes 1.3% are calculated97.5% + look 2.4% 99.8%
28.6% 25 + -1.3% 99.3% - 49.0% 97.5% 52 - 49.0% 112 52
35 98.0% 102 102
+-2.4%
--112 99.8%
78 2020 - 30.4%2021
* Does not account for sale concessions and/or downpayment assistance. | Percent changes are calculated due to small sample78 size. Days on Market Until Sale 102 using rounded 49.0% look extreme112 52figures and can- sometimes
- 30.4% -- ---
October InventoryInventory of Homes for Sale of Homes for Sale
78
25 - 28.6% - 28.6%-35 35 25 ---$631,500 35 * Does not account for concessions and/orand/or downpayment Percent changes are calculated using rounded and canextreme sometimes looksample extreme of concessions Homes for downpayment Sale assistance. - 28.6% --size. due to small sample 25 -- size. * DoesInventory notsale account for sale assistance. | |Percent changes are 35 calculated using rounded figures and canfigures sometimes look due to small
44
* Does not account for sale concessions and/or downpayment assistance. | Percent changes are calculated using rounded figures and can sometimes look extreme due to small sample size.
2020 28 October
October
31
31
26
31
2021 October
44
31
28 31 28
- 9.7%
28
28
2021 2020
$631,500 $631,500 $631,500 $522,500 $522,500 $522,500 $522,500
26
26 26 26
- 9.7%
Closed Sales
New Listings
2021
2020
2021
25
+ 20.9%
- 28.6%
Median Sales Price*
Inventory of Homes for Sale
+ 20.9%
Closed Sales
- 40.9%
$700,000
- 40.9% Closed Sales
$600,000
$700,000 $700,000
$600,000
$600,000 $600,000
$500,000
$500,000 $500,000
$400,000
Historical Median Sales Price $700,000
$500,000
$700,000
$600,000
$400,000
$500,000
$400,000 $400,000
$400,000
$300,000 $300,000
$200,000 4-2014
$300,000
$400,000
- 30.4 --
2
+ 20.9% - 28.6% Median Sales Price* Hilton Head Inventory Plantation —of Homes for Sale
Rolling 12-Month Calculation
Inventory of Homes for Sale
All MLS — Hilton Head Plantation —
All MLS — All MLS — Hilton Head Plantation — Hilton Head Plantation —
All MLS — Hilton Head Plantation —
Rolling 12-Month Calculation
All MLS — Hilton Head Plantation —
$300,000
$300,000$600,000
$200,000$500,000 4-2014 10-2014
+ 2.4%
- 28.6%
New Listings Closed Sales Median Sales Price* Historical Median Sales Price - Rolling 12-Month Calculation Historical Median Sales Price Rolling 12-Month Calculation $700,000 Historical Median Sales Price Rolling 12-Month Calculation
Historical Median Sales Price
+ 27.6
Inventory of Homes for S
- 9.7% - 40.9% + 20.9% - 28.6% - 9.7% - 40.9% + 20.9% NewPrice Listings Rolling 12-Month Closed Sales Median Sales Price* Inventory of Homes for Sale- 28.6% Historical Median Sales Calculation Historical Median 12-Month Calculation All MLSfor—Sale New Listings ClosedSales Sales Price Rolling Median Sales Price* Inventory of Homes
- 9.7% New Listings
- 10.6
- 28.6%
Median Sales Price*
+ 20.9%
- 10.4
25
25 25
25
- 40.9%
35
2020
35
35
Percent Ch
2020
--
2021
35
$631,500 35
28
- 9.7%
2020
26
44 44 44
- 40.9%
New Listings
25
$522,500
-- 30.4%
$631,500
$522,500 44
October 31
Hilton Head Plantation Real Estate Market Report
A Research Tool Provided by the Multiple Listing Service of A Research Tool Provided by the Multiple Listing Service of Hilton Head Island and the Hilton Head Area Association of REALTORS®
$200,000 4-2015 10-2015 $200,000
4-2016
10-2014
10-2016
4-2015
4-2017
10-2015
10-2017
4-2018
4-2016
10-2018
10-2016
4-2019
4-2017
10-2019
10-2017
4-2020
4-2018
10-2020
10-2018
4-2021
4-2019
10-2019
4-2020
10-2020
4-2021
1
10-2021
4-2014 10-2018 4-20194-2019 10-2019 4-20204-2020 10-2020 4-2021 4-2021 10-202110-2021 4-2014 10-2014 10-2014 4-2015 4-201510-2015 10-20154-2016 4-201610-2016 10-20164-2017 4-201710-2017 10-20174-20184-2018 10-2018 10-2019 10-2020
Current as of November 10, 2021. Data © 2021 MLS of Hilton Head Island. All Rights Reserved. | Sponsored by South Carolina REALTORS®. | Report © 2021 Show $200,000 Current November 10, 2021. Data © 2021 MLS of Island. Allof4-2017 Rights Reserved. Sponsored by| South REALTORS®. | |Report ©4-2020 2021 ShowingTime. Current as of November 10, 4-2016 2021. Data Data ©Head 2021 MLS of Hilton Head Head Island. All Rights Reserved. | Sponsored byCarolina South Carolina REALTORS®. Report © 2021 Current as of November 10,Hilton 2021. © 2021 MLS Hilton Island. All| Rights Reserved. Sponsored by South Carolina REALTORS®. | Report ©ShowingTime. 2021 ShowingTime. 4-2014as of10-2014 4-2015 10-2015 10-2016 10-2017 4-2018 10-2018 4-2019 10-2019 10-2020 4-2021 10-2021
$300,000 Current as of November 10, 2021. Data © 2021 MLS of Hilton Head Island. All Rights Reserved. | Sponsored by South Carolina REALTORS®. | Report © 2021 ShowingTime.
Information Sponsored by
$200,000 4-2014
10-2014
4-2015
10-2015
4-2016
10-2016
10-2017 4-2018 10-2018 4-2019 Head 10-2019Area 4-2020 10-2020 4-2021 10-2021 Information provided by Hilton Realtors Association Information source Hilton Head Area MLS
4-2017
Current as of November 10, 2021. Data © 2021 MLS of Hilton Head Island. All Rights Reserved. | Sponsored by South Carolina REALTORS®. | Report © 2021 ShowingTime.
45


