A Research Tool Provided by the Multiple Listing Service of
Real Estate Market Report Hampton Hall | October 2021 Local Market Update – October 2021 Hampton Hall Hampton HallHampton Hall
Hilton Head Island and the Hilton Head Area of REALTORS® Local Market Local Market Update – Association October 2021Update – October 2021 A Research Tool Provided by the Multiple Listing Service of A Research Tool Provided by the Multiple Listing Service of HiltonofHead Island and the Hilton Head Area Association of REALTORS® Hilton Head Island and the Hilton Head Area Association REALTORS®
A Research Tool Provided by the Multiple Lsting Serve of Hilton Head Island
A Research Provided by the Multiple of Listing Service of and theTool Hilton Head Area Association REALTORS® Hilton Head Island and the Hilton Head Area Association of REALTORS®
Local Market Update – October 2021
Hampton Hall Detached Homes Only October Local Market Update – October October2021 A Research Tool Provided by the Multiple Listing Service of Hilton Head Island and the Hilton Head Area Association of REALTORS®
A Research Tool Provided by the Multiple Listing Service of Key Metrics Hilton Head Island and the Hilton Head Area Association of REALTORS® 2020
Key Metrics
Key Metrics
2020
Hampton Hall 10 Hampton Hall 5 New Listings
Listings NewNew Listings
Closed Sales
Key Metrics Closed SalesSales Closed
5
Median Sales Price*
2021 2020
2020
2020 9
80.0% 9+ 2021
2021
10
3
5
9
$762,500
$749,000
3- 70.0% October
3
10
Year to Date
Year to Date
2020 Change Percent 2021 Percent Change
2021
Year to Date
October - 70.0% 84
Percent Change 67 + 80.0%
2020 Percent Change 2021
2021
Percent Change
Percent Change
- 70.0%
84
+ 80.0%
67
- 1.8%
$541,300
104 Year to Date + 23.8%
84 104 2020 83 67
2021 + 23.9% 83
NewPrice* Listings Median Sales
Median Sales Price*
Sales Inventory of HomesClosed for Sale
19
$749,000 4 9
$762,500 5
-+1.8% 80.0%
- 78.9%
$723,000 83
$541,300 67
+ 33.6% + 23.9%
103 --
--158
Days on Market Untilassistance. Sale | Percent changes are calculated using rounded 189 figures and can sometimes 82 look extreme due -to 56.6% * Does not account for sale concessions and/or downpayment small sample size.
October
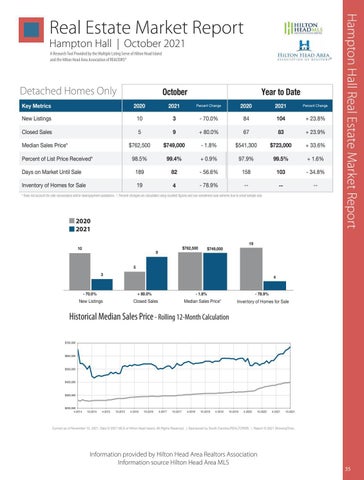
Percent of List Price* Price Received* 98.5% 0.9% 97.9% 99.4% 99.5% Median $762,500 - 1.8% look extreme $541,300 $749,000 and can+ sometimes $723,000 * Does not account for sale concessions and/orSales downpayment Inventory of Homes for Saleassistance. | Percent changes are calculated 19 using rounded figures - 78.9% due to small sample -- size. 4
October
Days on Market Until Sale of List Price Received* * Does not account forPercent sale concessions and/or downpayment assistance.
10
October
10
10
|
- 78.9% - 56.6%
9
10
3
$762,500
9
5 -570.0%
3
Median Sales Price*
Closed Sales + 80.0% Closed Sales + 80.0%
19
$700,000
2021
2021
- 78.9%
4 Inventory of Homes for S
4
- 78.9%
Median -Sales 1.8%Price*
Median Sales Price* Median Sales Price*
All MLS — Hampton Hall —
Homes for Sale -of 78.9%
78.9% for Sale Inventory of-Homes
ofSale Homes All MLSfor— InventoryInventory of Homes Hampton Hall —
for Sale
All MLS —
All MLS — Hampton Hall — HamptonAll HallMLS —— Hampton Hall —
All MLS — Hampton Hall —
$600,000
$400,000
$500,000
$500,000
$300,000
$500,000
$400,000 $600,000
$400,000
$400,000
$400,000
$300,000
$500,000
$200,000 4-2014
$300,000
$300,000
10-2014
4-2015
10-2015
4-2016
10-2016
4-2017
10-2017
4-2018
10-2018
4-2019
10-2019
4-2020
10-2020
4-2021
$200,000
Current10-2016 as of November 10, 2021. Data © 2021 MLS of Hilton Island. Rights Reserved. | Sponsored by South Carolina REALTORS®. | Report © 2021 Show 4-2014 10-2015 4-2017 4-2016 4-2017 10-2017 4-2018 10-2018 4-2019 Head 10-2019 4-2020 10-2020 4-2021 10-2021 4-2015 10-2015 10-2014 4-20164-201510-2016 10-2017 4-2018 10-2018 4-2019 10-2019 4-2020All 10-2020 4-2021 10-2021 $200,000 4-2014
10-2014
10-2014
4-2015
4-2015
10-2015
10-2015
4-2016
4-2016
10-2016
10-2016
4-2017
4-2017
10-2017
10-2017
4-2018
10-2018
4-2018
4-2019
10-2018
10-2019
4-2019
4-2020
10-2020
10-2019
4-2021
4-2020
10-2021
10-2020
4-2021
10-2021
Current as of November 10, 2021. Data © 2021 MLS of Hilton Head Island. All Rights Reserved. | Sponsored by South Carolina REALTORS®. | Report © 2021 ShowingTime.
Current as of November 10, 2021.Current Data as © of 2021 MLS of Head Island. Reserved. Sponsored by| South Carolina REALTORS®. | Report © 2021 ShowingTime. November 10,Hilton 2021. Data © 2021 MLSAll of Rights Hilton Head Island. All| Rights Reserved. Sponsored by South Carolina REALTORS®. | Report © 2021 ShowingTime. Current as of November 10, 2021. Data © 2021 MLS of Hilton Head Island. All Rights Reserved. | Sponsored by South Carolina REALTORS®. | Report © 2021 ShowingTime.
$200,000 4-2014
1
$300,000
$200,000 4-2014
$300,000
2
4
- 78.9% Inventory
$500,000
$600,000
10-2014
--
4
2021
$700,000
$500,000
$200,000 4-2014 $400,000
- 34.8
Inventory of Homes for4 Sale
- 1.8%
$600,000
$600,000
+ 1.6%
2021
2020
Historical Median Sales Price Rolling 12-Month Calculation Historical Median Sales Price Rolling 12-Month Calculation $700,000 $700,000
2020
Median Sales Price* - 78.9% 4
HistoricalHistorical MedianMedian Sales Price Rolling 12-Month Calculation Historical Median Sales Price - Rolling 12-Month Calculation Sales Price Rolling 12-Month Calculation
$600,000
19 2020
--
+ 33.6
2020
--
- 1.8%
Rolling 12-Month Calculation - 1.8% Sales Price* Median - 1.8%
Historical New Median SalesNew Price Rolling 12-Month Listings Closed Calculation Sales $700,000 Listings Closed Sales
19 19
2020
19
Closed Sales - 1.8%
+ 80.0% Historical Median Sales Price - 70.0% + 80.0%
$749,000 ---34.8%
--
$749,000
+ 80.0%
5 New Listings 3+ 80.0% 5
New Listings - 70.0%
$749,000
$762,500
9
3 Closed Sales
- 70.0%
--
- 34.8% + 1.6% 2020 2021
19
$749,000 2020 19 $762,500 4 - 78.9% -9 * Does not2021 account for sale concessions and/or downpayment assistance. | Percent changes are calculated using rounded figures and can sometimes look extreme due to small sample size. 5 October $762,500 $762,500 $749,000 $749,000 3 9 9 5 October
New Listings - 70.0%
$700,000
$762,500 --103
--158
Inventory of Homes for Sale
10
New Listings
482
19 189
* Does not account for sale concessions and/or downpayment assistance. | Percent changes are calculated using rounded figures and can sometimes look extreme due to small sample size.
3
- 70.0%
--
- 34.8% --
++ 1.6% 33.6%
189 - 56.6% 158 82 103 98.5% 0.9% 97.9% 99.4% 99.5% Percent changes are calculated using rounded figures and+can sometimes look extreme due to small sample size.
10 Inventory of Homes forSale Sale Days on Market Until
October
103
* Does not account for19 sale concessions and/or downpayment assistance. | Percent changes are calculated and can sometimes look extreme - 78.9% -- using rounded figures--- due to small sample size. 4
Inventory of Homes for Sale
+ 23.9
$723,000
+ 0.9% 189 158 + 1.6% 82 97.9% - 56.6%99.5% - 70.0%- 1.8% 84 +$723,000 23.8% 3 104 + 33.6% $749,000 Percent Change 2020 $541,300 -2021 56.6% Percent Change158 - 34.8% 103 2021 19 78.9% -4 56.6% -+34.8% 82999.4% 103 + 80.0% + 23.9% 83104 --70.0% + 23.8% 3 + 0.9% 6784 158 97.9% 1.6% 99.5%
10 $762,500 2020 82 Inventory of Homes for Sale Days on Percent Market of Until Sale 18998.5% Closed Sales 510 New Listings List Price Received*
189
+ 23.8
83
+ 23.9%
Percent Change
99.4%
Percent of List Price Received*Days on Market Until 98.5% Sale
Days on Market Until SaleKey Metrics
Percent Ch
104
+ 23.8%
10 - 70.0% + 23.8% 3 104 $762,500$762,500 - 1.8% $541,300 + 33.6% $749,000 $723,000 October Year84to Date $723,000 - 1.8% $541,300 + 33.6% 99.5% $749,000 Percent of List Price Received* 98.5% + 0.9% 97.9% 99.4% Closed Sales 5 + 80.0% 67 + 23.9% 9 83 Change Key Metrics 2020 2021 2021 Percent of List Price Received* 98.5% + 0.9% Percent Change97.9% 2020 + 1.6% 99.4% 99.5% October Year to DatePercent New Listings Median SalesSales Price* Median Price*
Hampton Hall Real Estate Market Report
Local Market Update – October 2021
10-2014
4-2015
10-2015
4-2016
10-2016
4-2017
10-2017
4-2018
10-2018
4-2019
10-2019
Information provided by Hilton Head Area Realtors Association Information source Hilton Head Area MLS
4-2020
10-2020
4-2021
10-2021
Current as of November 10, 2021. Data © 2021 MLS of Hilton Head Island. All Rights Reserved. | Sponsored by South Carolina REALTORS®. | Report © 2021 ShowingTime.
35


