Sea Pines
Homes Only Local Market Update – OctoberDetached 2021
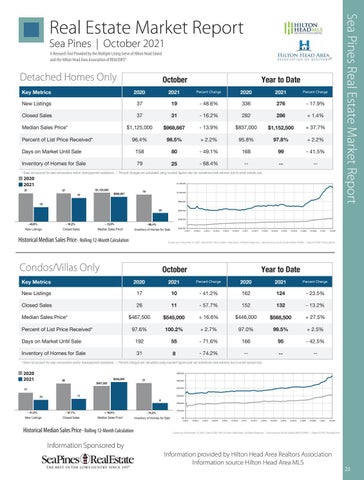
A Research Tool Provided by the Multiple Listing Service of Hilton Head Island and the Hilton Head Area Association of REALTORS®
Real Estate Market Report
Local Market Update – October 2021 A Research Tool Provided by the Multiple Listing Service of Pines Hilton Head Island and the Hilton Head Area AssociationSea of REALTORS® Detached Homes Only SeaMarket Pines Update | October 2021 Local – October 2021 A Research Tool Provided by the Multiple Lsting Serve of Hilton Head Island Key Metrics
2021
Percent Change
2020
2021
Percent Change
37
19
- 48.6%
336
276
- 17.9%
New Listings
Sea Pines
37
31
- 16.2%
282
286
+ 1.4%
$1,125,000
$968,667
- 13.9%
$837,000
$1,152,500
+ 37.7%
96.4%
98.5%
+ 2.2% October
2020 80
-2021 49.1%
Closed Sales
Median Sales Price*
Percent of List Price Received*
Sea Pines
A Research Provided by the Multiple of Listing Service of and theTool Hilton Head Area Association REALTORS® Detached Homes Only Days on Market Until SaleKey Metrics Hilton Head Island and the Hilton Head Area Association of REALTORS® Inventory of Homes for Sale
Detached Homes Only
2020
99 2021
19
- 48.6%
336
276
37
31
- 16.2%
282
286
+ 1.4%
$1,125,000
$968,667
- 13.9%
$837,000
$1,152,500
+ 37.7%
96.4%
98.5%
+ 2.2%
95.8%
37
25
79
97.8% Year to Date+ 2.2%
95.8% Percent Change
Closed Sales
168
- 68.4%
--
--
* Does not account for sale concessions and/or downpayment assistance. | Percent changes are calculated using rounded figures and can sometimes look extreme due to small sample size.
Sea Pines
A Research Tool Provided by the Multiple Listing Service of Hilton Head Island and the Hilton Head Area Association of REALTORS®
October
Median Sales Price*
October 2020
Key Metrics
Percent of List Price Received*
37
19
37
Detached Homes Only
New Listings October Closed Sales Percent Change 2021
Inventory of Homes for Sale
31 October
37
31
- 48.6% 2020
2021
158
80
- 49.1%
79
25
- 68.4% $968,667
2021 336
--
276
- 17.9%
--
97.8% 2020
+ 2021 2.2%
Year to Date
Percent Change - 41.5% 99
168
Percent Change
Percent Change - 41.5%
79
--
--
2020- 17.9% 2021
* Does not account for sale concessions and/or downpayment assistance. | Percent changes are calculated using rounded figures and can sometimes look extreme due to small sample size.
19
19
37 - 16.2%
October
Year to Date
Year to Date
2020 October $1,125,000
2021Days on MarketPercent Until Sale Change
37
Detached Homes OnlyKey Metrics Sea NewPines Listings Closed Sales
158
New Listings
Local Market Update – October 2021 Detached Homes Only
Year to Date
2020
37
- 48.6% 286
282
276
2020 336 + 1.4%
Year to Date
$1,125,000
37
Sea Pines Real Estate Market Report
Local Market Update – October October2021
A Research Tool Provided by the Multiple Listing Service of Hilton Head Island and the Hilton Head Area Association of REALTORS®
2021
25
79
Percent Ch
- 17.9
$968,667 31 - 16.2% 31$837,000 286 + 37.7% $1,152,500 282Percent Change 2020 2021 New Listings 37 - 48.6% 336 - 17.9% 19 276 19 - 48.6% - 16.2% - 13.9% - 68.4% Median Sales Price* $1,125,000 - 13.9% $837,000 $968,667 $1,152,500 Percent of List Price Received* + 2.2% 95.8% 2.2% Closed Sales 37 - 16.2% 282 96.4% 1.4%98.5%19 31 28637 New Listings - 48.6% 336 Sales Price*97.8% 17.9% 276 Inventory of-+Homes New+Listings Closed Sales Median for25Sale Median Sales Price* $1,125,000 - 13.9% + 37.7% $968,667 $1,152,500 Percent of List $837,000 Price Received* 96.4% + 2.2% 95.8% 98.5% 97.8% Days on Closed MarketSales Until Sale 15897.8% - 49.1% 168 -+41.5% 80 Update 99 37 +Market - 16.2% 2021 282 1.4% 31 - 48.6%– 286 Percent of List Price Received* 96.4% + 2.2% 95.8% 2.2% 98.5% Local October - 16.2% - 13.9% - 68.4% Historical Median Sales Price Rolling 12-Month Calculation A Research Tool Provided by the Multiple Listing Service All MLSfor—Sale Days on Market 168 Until Sale 158 of - Median 49.1% 168 80Sales 99 New Listings Closed Sales Price* Inventory of Homes Days on Market Until Sale 158 - 49.1% - 41.5% 80 99 Hilton Head Island and the Hilton Head Area Association of-REALTORS® Salesfor Price* $1,125,000 13.9% $837,000 + 37.7% $968,667 $1,152,500 Sea InventoryMedian of Homes Sale 79 - 68.4% --- Pines — 25 -Inventory of Homes for Sale 79 - 68.4% --25 -Inventory of| Homes for$1,200,000 Sale 79 SaleslookPrice - 68.4% -25to smallCalculation -Median Rolling * Does not* account and/or downpayment Percent changes are calculated using rounded figures and can sometimes look extreme due to small sample size. Doesfor sale notconcessions account for saleassistance. concessions and/or downpayment assistance. Percent changes are calculated using roundedHistorical figures and can sometimes extreme due12-Month sample size. Percent of | List Price Received* 96.4% + 2.2% 95.8% + 2.2%All MLS — 98.5% 97.8% * Does not account for sale concessions and/or downpayment assistance. | Percent changes are calculated using rounded figures and can sometimes look extreme due to small sample size. Sea Pines — 2020 $1,000,000 October $1,200,000 2021 Days on Market Until Sale 158 2020 2021 - 49.1% 168 - 41.5% 80 99 $1,125,000 37 37 2020 2021 79 Condos / Villas Only $800,000 $1,000,000 $968,667 31 October Inventory of Homes for Sale 79 - 68.4% --25 -$800,000 Local Market Update – October 2021 A Research37 Provided the Multipleand/or Listing Service of $600,000 $1,125,000 37 19 * Tool Does not account forby sale concessions downpayment assistance. | Percent changes are calculated using rounded figures and can sometimes look extremeOctober due to small sample size. Year to Date 79 A37 Research Tool Provided by the Multiple Listing Service of $1,125,000 37 of REALTORS® Hilton Head Island and the Hilton Head Area Association 79 Hilton Head Island and the Hilton Head Area Association of REALTORS® $600,000 25 $968,667 31 Percent Change $968,667 Percent Change Key Metrics 2020 2021 2020 2021 $400,000 31
Median Sales Price*
Key Metrics
2020
Key Metrics
2021 $1,125,000
2020
2020
37 - 13.9%
$968,667
Percent Change
2021
Percent Change
Sea Pines
October
Local Market Update – October 2021 October
- 48.6%
New Listings - 16.2%
- 13.9%
19Sales Closed
Sea Pines New Listings
37
Median Sales Price*
10-2014 19 of HomesSales Inventory for Sale
37
31
4-2014
10-2014
4-2015
10-2015
Condos/Villas Only Key Metrics
10-2017
$545,000
4-2018
100.2%
97.6%
Key Metrics
16.2% - 13.9%
31
October + 2.7%
October
4-2015
10-2015
Closed Sales
2021
Percent Change
17
10
- 41.2%
Closed Sales October Median Sales Price* Percent of List Price Received*
- 71.6%
8
26
11
4-2016
Median Historical Sales Price*
10-2016
4-2017
10-2017
4-2018
10-2018
4-2019
10-2019
$1,200,000 October
Median Sales Price
4-2020
26
10-2020
17
New Listings
- 41.2% 10 $1,000,000
17
4-2021
10-2020
166
-- 74.2% 13.9%
--
- 57.7%
100.2%
2020
192
- 13.9%
1110October
- 57.7%
Rolling 12-Month$545,000 Calculation $467,500
26 11 of List Price Received*
Median Sales Price*$1,200,000
152
$446,000
100.2%
+ 2.7%
97.0%
55
- 71.6%
166
$545,000
Days on Market Until Sale 97.6% $800,000
Days on Market Until$1,000,000 Sale
192
Inventory of Homes for31Sale
Inventory of Homes for Sale
132 97.6%
- 57.7% + 16.6%
$467,500
Percent of List Price Received*
124
$800,000
$600,000
8
- 74.2%
--
$568,500
+ 27.5%
Year to Date 99.5%
+ 2.5%
25
2020
2021
Percent Change
124
- 23.5%
132 25
- 13.2%
95
162
+ 2.7%
25
- 42.5%
--
--
- 68.4%
$568,500 99.5%
97.0%
2021
55
- 71.6%
166
- 68.4%
$545,000
+ 2.5%
2020
2021
Percent Change - 42.5% 95
31
$545,000
26
+ 16.6%
2020 Sea Pines — - 13.2%
132
152
11
All MLS — Sea Pines —
$446,000
- 41.2%
- 57.7%
$568,500
100.2%
27.5% All+MLS — Sea Pines — - 74.2%
$467,500
+ 16.6%
11 97.0% 99.5% Median Sales Price*
+10Closed 2.7%Sales
- 13.2%
New Listings + 27.5%
19299.5% - 71.6% 166 + 2.5% 55 - 41.2% - 57.7% Historical Median Sales Price Rolling 12-Month Calculation - 42.5% 95 New Listings Closed Sales 31 -- 74.2% -8 --
+ 2.5%
Inventory of Homes8 for Sale
95
- 42.5%
+ 16.6%
- 74.2%
Median Sales Price*
Inventory of Homes All for MLSSale — Sea Pines —
--
--
Median SaleslookPrice Rolling *$600,000 Does not account for sale concessions and/or downpayment assistance. | Percent changes are $600,000 calculated using roundedHistorical figures and can sometimes extreme due12-Month to smallCalculation sample size. $800,000 $400,000
2021 $400,000 October
$600,000
$545,000
26
$200,000 $467,500 4-2014
17
$400,000
$200,000 10 4-2014
11
10-2014
$500,000
4-2015
$200,000 - 41.2% 4-2014 - 57.7% 10-2014 New Listings Closed Sales
17
10-2015
26
2021
31$400,000
10-2014
4-2016
2020
10-2016
$200,000
All MLS — Sea Pines —
$600,000
$500,000
4-2015 $300,000 10-2015
4-2016 $400,000
10-2016
10-2017
4-2017
10-2017
4-2018
10-2018
$545,000
$300,000
4-2017 8
2021
8
31
17
- 23.5%
4-2018 10-2018 $467,500
4-2019
$200,000
4-2019
2020
2021
10-2019
4-2020
10-2020
+10-2015 16.6% - 74.2% 4-2017 4-2015 4-2016 10-2016 $0 Median Sales Price* 4-2014 for 10-2014 Inventory of Homes Sale
Historical Median Median Sales PriceSales Rolling Price 12-Month -Calculation Historical Rolling 12-Month Calculation
4-2020
10-2020
4-2021
10-2021
$100,000
10-2017 4-2015$0
4-2018
10-2015
4-2014
10-2014
4-2016
4-2015
10-2018 10-2016 10-2015
4-2019 4-2017
4-2016
10-2019
10-2017
10-2016
4-2017
4-2018
10-2017
4-2020 10-2018 4-2018
4-2019
10-2018
10-2020 10-2019
4-2019
4-2021 4-2020
10-2019
4-2020
10-2020
10-2020
10-2021 4-2021 4-2021
10-2021
10-2021
8
as of November 10, 2021. Data ©Head 2021 MLS Hilton HeadCarolina Island. All Rights | Sponsored South Carolina REALTORS®. | Report © © 2021 — Head Current as of November 10, Current 2021. Data © 2021 MLS of Hilton Island. All Rights Reserved. | Reserved. Sponsored by Southby REALTORS®. Report 2021ShowingTime. ShowingTime. Current as of November 10, 2021. Data © 2021 MLS All ofMLS Hilton Island. All Rights Reserved. | Sponsored byofSouth REALTORS®. | Carolina Report © 2021 |ShowingTime.
Sea Pines —
$400,000
$300,000
$200,000
$100,000
1
$100,000 Current as of November 10, 2021. Data © 2021 MLS of Hilton Head Island. All Rights Reserved. | Sponsored by South Carolina REALTORS®. | Report © 2021 Show
10
$500,000
4-2021
31 10-2019
Current as of November 10, 2021. Data © 2021 MLS11 of Hilton Head Island. All Rights Reserved. | Sponsored by South Carolina REALTORS®. | Report © 2021 ShowingTime.
$600,000
2
10-2021
$568,500
* Does not account for sale concessions and/or downpayment assistance. | Percent changes are calculated using rounded figures and can sometimes look extreme due to small sample size.
October 2020
2020
--
10-2021 - 13.2%
4-2021
- 74.2% --8 -Rolling 12-Month Calculation31 $467,500 - 41.2% 23.5% 124of Homes- for Median Sales Price* 162 Inventory Sale All MLS —
10-2021
Year to Date 162
- 41.5
+ 27.5% Inventory Inventory of Homes for Sale of Homes for S
97.6%
2021Days on MarketPercent Until Sale Change
Current as of November 10, 2021. Data © 2021 MLS of Hilton Head Island. All Rights Reserved. | Sponsored by South Carolina REALTORS®. | Report © 2021 ShowingTime. Percent Change Percent Change 2020 2021 2020 2021
Percent $1,000,000
4-2020
4-2021
* Does not account for sale concessions and/or downpayment assistance. | Percent changes are calculated using rounded figures and can sometimes look extreme due to small sample size.
Condos / Villas Only $200,000
Closed Sales
10-2019
97.0%
2020
Inventory of Homes for26 Sale
Key$1,200,000 Metrics
4-2019
79$446,000
+ 2.2%
- 23.5% 2021
10-2020 132
4-2020
152 - 68.4% $467,500 Median + 16.6%Price* $446,000 $545,000Year Sales to Date
Median Sales Price*
$400,000
10-2014
10-2018
+ 16.6%
55
192
Closed Sales
- 48.6% - 16.2% Historical Median Sales Price Sea NewPines Listings Median 17 Sales 10 Historical Sales Price RollingClosed 12-Month Calculation New Listings 4-2014
10-2019 152
* Does not account for sale concessions and/or downpayment assistance. | Percent changes are calculated using rounded figures and can sometimes look extreme due to small sample size.
2020
$600,000
4-2017
$968,667
Inventory of Homes for Sale-
New Listings Closed Sales
$800,000
10-2016
124 2020
162
10-2018 - 57.7%4-2019
+ 37.7
Current as of November 10, 2021.Current Data as © of 2021 MLS of Head Island. Reserved. Sponsored by| South Carolina REALTORS®. | Report © 2021 ShowingTime. November 10,Hilton 2021. Data © 2021 MLSAll of Rights Hilton Head Island. All| Rights Reserved. Sponsored by South Carolina REALTORS®. | Report © 2021 ShowingTime.
New Listings
- 48.6% - 16.2%
- 48.6% Local Market Update – October 2021 A Research Tool Provided by the Multiple Listing Service of New Hilton Head Island and the Hilton Head Area Listings Association of REALTORS®
$1,000,000
4-2016
$467,500
Days on Market Until Sale
19
- 41.2%
10-201711 4-2018
264-2017
10-2016
— Price Received* PercentAllofMLSList Sea Pines —
$1,200,000
4-2016
Condos /$1,125,000 Villas Only
Median Sales Price*
Historical Median SalesRolling Price - Rolling 12-Month Calculation Historical Median Sales Price 12-Month Calculation
Condos / Villas Only
4-2015 10-2015 $200,000
10
17
$400,000
Sea Pines
- 68.4% $200,000 4-2014 Closed
+ 1.4%
Information Sponsored by
- 41.2%
- 57.7%
New Listings
Closed Sales
+ 16.6% by Hilton Head Area Realtors - 74.2% Association Information provided Median Sales Price* Inventory of Homes Information source Hilton Head Area MLS for Sale
21


