Palmetto Dunes
Palmetto Dunes Real Estate Market Report
Homes Only Local Market Update – OctoberDetached 2021
A Research Tool Provided by the Multiple Listing Service of Hilton Head Island and the Hilton Head Area Association of REALTORS®
Local Market Update – October October2021 A Research Tool Provided by the Multiple Listing Service of Hilton Head Island and the Hilton Head Area Association of REALTORS®
Real Estate Market Report
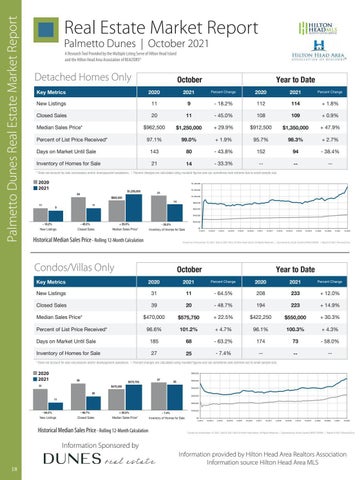
Local Market Update – October 2021 A Research Tool Provided by the Multiple Listing Service of Hilton Head Island and the Hilton Head Area AssociationPalmetto of REALTORS® Dunes Detached Homes Only Palmetto Dunes | October 2021 Local Market Update – October 2021 A Research Tool Provided by the Multiple Lsting Serve of Hilton Head Island Key Metrics
New Listings
Palmetto Dunes
Percent of List Price Received*
Palmetto Dunes
A Research Provided by the Multiple of Listing Service of and theTool Hilton Head Area Association REALTORS® Detached Homes Only Days on Market Until SaleKey Metrics Hilton Head Island and the Hilton Head Area Association of REALTORS®
114
+ 1.8%
11
- 45.0%
108
109
+ 0.9%
+ 29.9%
$912,500
$1,350,000
+ 47.9%
97.1%
99.0%
+ 1.9% October
2020 80
-2021 43.8%
143
2020
94 2021
9
- 18.2%
112
114
20
11
- 45.0%
108
109
+ 0.9%
$962,500
$1,250,000
+ 29.9%
$912,500
$1,350,000
+ 47.9%
95.7%
14
21
98.3% Year to Date+ 2.7%
95.7% Percent Change
11
152
- 33.3%
--
--
9 11
20
2021 $962,500
2020
99.0%
+ 1.9%
143
80
- 43.8%
21
14
Inventory of Homes 20for Sale
98.3% 2020
$1,250,000
- 33.3%
--
+ 2021 2.7%
Year to Date
Percent Change - 38.4% 94
152
112 Percent Change114 2021 $962,500
- 18.2% 2020
October
$1,250,000
Percent Change
2021
+ 1.8%
--
21
--
--
2020 + 1.8% 2021
P
9
11
- 18.2%
114
112
2021
11 - 45.0%11
9
14
- 18.2% 109
108
114
2020 112 + 0.9%
2021
Year to Date $1,250,000
21 2029.9% 20 11$912,500 - 45.0% 109 + + 47.9% $1,350,000 108Percent $962,500 Percent Change Change
2020 2021 14 - 45.0% + 29.9% 11 - 33.3% $962,500 + 29.9% $912,500 $1,250,000 $1,350,000 9 + 1.9% 95.7% + 2.7% 98.3% - 18.2% 112 Sales Price* 114 Inventory of+Homes 1.8% Closed Sales Median for Sale Median Sales Price* $962,500 + 29.9% + 47.9% $1,250,000 $1,350,000 Percent of List $912,500 Price Received* 97.1% + 1.9% 95.7% 99.0% 98.3% Days on Closed MarketSales Until Sale 14398.3% - 43.8% 152 -+38.4% 80 Update 94 20 +Market - 45.0% 2021 108 0.9% 11 - 18.2%– 109 Percent of List Price Received* 97.1% + 1.9% 95.7% 2.7% 99.0% Local October - 45.0% + 29.9% - 33.3% Historical Median Sales Price Rolling 12-Month Calculation A Research Tool Provided by the Multiple Listing Service All MLSfor—Sale Days on Market 152 Until Sale 143 of - Median 43.8% 152 80Sales 94 New Listings Closed Sales Price* Inventory of Homes Days on Market Until Sale 143 - 43.8% - 38.4% 80 94 Hilton Head Island and the Hilton Head Area Association of+REALTORS® Salesfor Price* 29.9% $912,500 +Palmetto 47.9% $1,250,000 $1,350,000 InventoryMedian of Homes Sale 21$962,500 - 33.3% ---Dunes — 14 -Inventory of Homes for Sale 21 - 33.3% --14 -Inventory of| Homes for$1,400,000 Sale 21 SaleslookPrice - 33.3% -14to smallCalculation -Median Rolling * Does not* account and/or downpayment Percent changes are calculated using rounded figures and can sometimes look extreme due to small sample size. Doesfor sale notconcessions account for saleassistance. concessions and/or downpayment assistance. Percent changes are calculated using roundedHistorical figures and can sometimes extreme due12-Month sample size. Percent of | List Price Received* 97.1% + 1.9% 95.7% + 2.7%All MLS — 99.0% 98.3% New Listings
2020
97.1%
Percent Change - 38.4%
* Does not account for sale concessions and/or downpayment assistance. | Percent changes are calculated using rounded figures and can sometimes look extreme due to small sample size.
11 9 October
Year to Date
Year to Date
2020 October
Percent of List Price Received*
2021Days on MarketPercent Until Sale Change
11
New Listings October Closed Sales Percent Change 2021
2020
112
Median Sales Price*
Detached Homes Only
Key Metrics
- 18.2%
October
October 2020
Detached Palmetto DunesHomes OnlyKey Metrics New Listings
Median Sales Price*
Percent Change
9
Closed Sales
Palmetto Dunes
Key Metrics
Key Metrics
2021
11
* Does not account for sale concessions and/or downpayment assistance. | Percent changes are calculated using rounded figures and can sometimes look extreme due to small sample size.
A Research Tool Provided by the Multiple Listing Service of Hilton Head Island and the Hilton Head Area Association of REALTORS®
Closed Sales
2020
$1,250,000
Inventory of Homes for Sale
Detached Homes Only
Percent Change
20
New Listings
Local Market Update – October 2021 Detached Homes Only
2021
$962,500
Closed Sales
Median Sales Price*
Year to Date
2020
+ 1.8%
- 18.2%
Median Sales Price* Percent New of List Price Received* 20 - 45.0% 108 97.1% 0.9%99.0%9 11 10911 Listings New+Listings
11
Closed Sales
Palmetto 143 - 43.8% 80 Dunes
Palmetto Dunes — $1,200,000 * Does not account for sale concessions and/or downpayment assistance. | Percent changes are calculated using rounded figures and can sometimes look extreme due to small sample size.
2020 October
Days on Market Until Sale
2021 October
$1,000,000
2020
2021
October LocalInventory Market Update – October 2021 of Homes for Sale 20
94
152
$1,400,000
- 38.4% 2020 2021 --
$1,200,000 21 Condos / Villas Only $800,000 $1,000,000 21 14
$1,250,000
- 33.3% --$962,500 $600,000 14 $800,000 Local Market Update – October 2021 A 11 Research*Tool Provided by the Multiple Listing Service of Does not account for sale concessions and/or downpayment assistance. | Percent changes are calculated using rounded figures and can sometimes look extremeOctober due to small sample size. Year to Date 11 $1,250,000 A Research Tool Provided by the Multiple Listing Service of 21 $1,250,000 $600,000 Hilton Head9 Island and the Hilton Head Area Association20 of REALTORS®$400,000 Hilton Head Island and the Hilton Head Area Association of REALTORS® Percent Change Key Metrics 2020 2021 2020 2021 20 $400,000 $200,000 $962,500 New Listings 31 - 64.5% 208 11$962,500 233
October
- 18.2%
- 45.0%
+ 29.9%
Palmetto Dunes New Listings 11
Median 11 Sales Price*
Closed Sales
9
9
Historical Median SalesRolling Price - Rolling 12-Month Calculation20 Historical Median Sales Price 12-Month Calculation 9
Condos/Villas Only Key Metrics
11
10-2017
4-2018
10-2018
4-2019
October + 4.7%
October
2021
Percent Change
New Listings
31
11
- 64.5%
Closed Sales
39
68
185
27 45.0% + 29.9%
- 63.2%
25
174
Condos / Villas Only $0
Closed Sales
4-2016
Median Historical Sales Price*
Key$1,400,000 Metrics
10-2016
4-2017
10-2017
4-2018
10-2018
4-2019
Percent of List Price Received*
10-2019
$1,400,000 October
Median$1,200,000 Sales Price 11
31
- 64.5%
$1,200,000
39 - 48.7% 20 $1,000,000 Percent of List Price Received*
Closed Sales
Median Sales Price*$1,400,000
4-2020
39
194
10-2020
233
101.2%
2020
185
208
+ 29.9%
+ 4.7%
4-2021
10-2021
20 October
- 48.7%
101.2%
+ 4.7%
96.1%
68
- 63.2%
174
25
- 7.4%
--
Percent of List Price Received*
$1,200,000
Days on Market Until Sale $800,000
185
Inventory of Homes for27Sale
Inventory of Homes $1,000,000 for Sale
$800,000 $600,000
20
11
- 63.2%
233
+ 12.0%
223
+ 14.9%
$422,250 20
- 48.7%
100.3%
174
- 33.3%
101.2%
New Listings + 30.3%
27
31
39
$0
$0 11$200,000 4-2014 10-2014
31
- 64.5%
New Listings
20
4-2015
$0 4-2014 - 48.7% 10-2014 Closed Sales
10-2015
27$400,000
$575,750
$470,000 4-2014
$400,000
10-2014
39
4-2016
2020
2021
$200,000
4-2017
2021
25
+ 4.3%
73
- 58.0%
+ 22.5%
- 7.4%
Median Sales Price*
Inventory of Homes All for MLSSale — Palmetto Dunes —
--
--
All MLS — Palmetto Dunes —
$600,000
$500,000
25
4-2015 $300,000 10-2015
10-2016
A Palmetto
Inventory of Homes for Sale
$800,000 $600,000
2021
30.3% All+MLS — Palmetto Dunes - 7.4%—
$400,000 Median SaleslookPrice Rolling *$600,000 Does not account for sale concessions and/or downpayment assistance. | Percent changes are $600,000 calculated using roundedHistorical figures and can sometimes extreme due12-Month to smallCalculation sample size.
2021 October $200,000
+ 4.3%
2020
27
$575,750
96.1% 100.3% Median Sales Price*
+11Closed 4.7%Sales
+ 14.9%
$500,000
- 33.3%
Percent Change - 58.0% 73
$550,000
$470,000
+ 22.5%
185100.3% - 63.2% 174 + 4.3% 68 - 64.5% - 48.7% Historical Median Sales Price Rolling 12-Month Calculation - 58.0% 73 New Listings Closed Sales 27 -- 7.4% -25 --
$200,000
--
$550,000
* Does not account for sale concessions and/or downpayment assistance. | Percent changes are calculated using rounded figures and can sometimes look extreme due to small sample size.
October $400,000 2020
- 58.0%
2020 — + 14.9% 223 Palmetto Dunes
194
39
+ 22.5%
- 64.5%
$550,000
$422,250
+ 4.3%
Percent Change
--
96.1%
2021
68
+ 12.0%
223 96.6%
Days on Market Until Sale 96.6%
$1,000,000
+ 22.5%
2021 14 73
- 7.4% -25 -25-$575,750 Rolling 12-Month Calculation27 - 64.5% + 12.0% 233 $470,000 Inventory of Homes for Sale Median Sales Price* 208 All MLS —
Rolling 12-Month$575,750 Calculation31 $470,000
208
$575,750
10-2021
+ 30.3%
* Does not account for sale concessions and/or downpayment assistance. | Percent changes are calculated using rounded figures and can sometimes look extreme due to small sample size.
Year to Date
$470,000
10-2021 + 14.9%
4-2021
+ 30.3% Inventory Inventory of Homes for Sale of Home
96.6%
2021Days on MarketPercent Until Sale Change
Current as of November 10, 2021. Data © 2021 MLS of Hilton Head Island. All Rights Reserved. | Sponsored by South Carolina REALTORS®. | Report © 2021 ShowingTime. Percent Change Percent Change 2020 2021 2020 2021
New Listings
10-2020
Year to Date 100.3%
2020
+ 22.5%Price* $422,250 $575,750Year Closed Sales Sales October to Date Median Sales Price*$470,000Median
31
10-2015
4-2021
$550,000
20
Inventory of Homes for39 Sale
$200,000
4-2015
4-2020
96.1%
2020
- 18.2% - 45.0% Historical Median Sales Price Palmetto Dunes New Listings 31 Sales 11 Historical Median Sales Price RollingClosed 12-Month Calculation New Listings 10-2014
10-2019
21$422,250
+ 22.5%
Median Sales Price*
$400,000
4-2014
10-2020 223
4-2020
-+- 7.4% 29.9% - 48.7% - 33.3% 194 * Does not account for sale concessions and/or downpayment assistance. | Percent changes are calculated using rounded figures and can sometimes look extreme due to small sample size.
2020
$600,000
4-2017
101.2%
96.6%
Key Metrics
Inventory of Homes for Sale-
New Listings Closed Sales
$800,000
10-2016
10-2019 194
Current as of November 10, 2021.Current Data as © of 2021 MLS of Head Island. Reserved. Sponsored by| South Carolina REALTORS®. | Report © 2021 ShowingTime. November 10,Hilton 2021. Data © 2021 MLSAll of Rights Hilton Head Island. All| Rights Reserved. Sponsored by South Carolina REALTORS®. | Report © 2021 ShowingTime.
- 18.2% - 45.0%
Local Market Update – October 2021 A Research Tool Provided by the Multiple Listing Service of New Hilton Head Island and the Hilton Head Area Listings Association of REALTORS®
4-2016
10-2018 - 48.7%4-2019
$1,250,000 $470,000 $575,750
Days on Market Until Sale
- 18.2%
$1,000,000
Condos / Villas Only
— Price Received*$962,500 PercentAllofMLSList Palmetto Dunes —
11
$1,200,000
10-201720 4-2018
394-2017
10-2015 4-2016 10-2016 $0 4-2014 10-2014 4-2015 10-2015
21
Percent Change
+ 12.0% 2021
2020 14
$200,000
4-2015
Median Sales Price*
Condos / Villas Only
$1,400,000
Palmetto11Dunes
- $0 33.3%
4-2014 Sales 10-2014 Closed Inventory of Homes for Sale 11
20
4-2016 $400,000
10-2016
$300,000
10-2017
$200,000
4-2017
10-2017
10-2018$575,750 4-2019
4-2018
4-2018
10-2018
4-2019
2020
2021
10-2019
4-2020
27 10-2019
4-2020
25
10-2020
4-2021
10-2020
10-2021
$470,000
$100,000 Current as of November 10, 2021. Data © 2021 MLS of Hilton Head Island. All Rights Reserved. | Sponsored by South Carolina REALTORS®. | Report © 2
+10-2015 22.5% - 7.4% 4-2017 4-2015 4-2016 10-2016 $0 Median Sales Price* 4-2014 for 10-2014 Inventory of Homes Sale
20
$100,000
10-2017 4-2015$0
4-2018
10-2015
4-2014
10-2014
4-2016
4-2015
10-2018 10-2016 10-2015
4-2019 4-2017
4-2016
10-2019
10-2017
10-2016
4-2017
4-2018
10-2017
4-2020 10-2018 4-2018
4-2019
10-2018
10-2020 10-2019
4-2019
4-2021 4-2020
10-2019
4-2020
10-2020
10-2020
10-2021 4-2021 4-2021
10-2021
10-2021
Current as of November 10, 2021. Data © 2021 MLS of Hilton Head Island. All Rights Reserved. | Sponsored by South Carolina REALTORS®. | Report © 2021 ShowingTime.
11 Historical Median Median Sales PriceSales Rolling 12-Month -Calculation Historical Price Rolling 12-Month Calculation
as of November 10, 2021. Data ©Head 2021 MLS Hilton HeadCarolina Island. All Rights | Sponsored South Carolina REALTORS®. | Report © © 2021 — Head Current as of November 10, Current 2021. Data © 2021 MLS of Hilton Island. All Rights Reserved. | Reserved. Sponsored by Southby REALTORS®. Report 2021ShowingTime. ShowingTime. Current as of November 10, 2021. Data © 2021 MLS All ofMLS Hilton Island. All Rights Reserved. | Sponsored byofSouth REALTORS®. | Carolina Report © 2021 |ShowingTime.
Palmetto Dunes —
$600,000
$500,000
$400,000
18
$300,000
$200,000
$100,000
4-
Information Sponsored by
- 64.5%
- 48.7%
New Listings
Closed Sales
+ 22.5% by Hilton Head Area Realtors - 7.4% Association Information provided Median Sales Price* Inventory of Homes Information source Hilton Head Area MLS for Sale


