Latitude Margaritaville Real Estate Market Report
Local Market Update – October 2021 2021 Local Market Update – October A Research Tool Provided by the Multiple Listing Service of A Research Tool by Area the Multiple Listing Service of Hilton Head Island and theProvided Hilton Head Association of REALTORS®
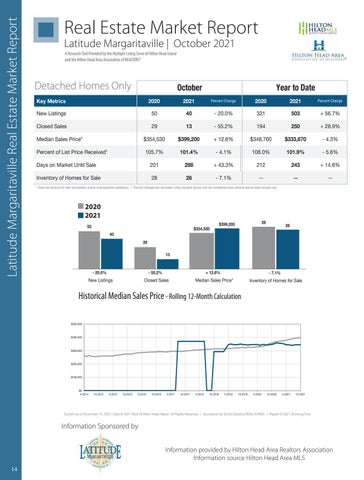
Local Market Update – October 2021 Real Estate Market Report Latitude Margaritaville | October 2021 Latitude Margaritaville Local Market Update – October 2021 Latitude Margaritaville Local Market Update – October 2021 Hilton Head Island and the Hilton Head Area Association of REALTORS®
A Research Tool Provided by the Multiple Listing Service of Hilton Head Island and the Hilton Head Area Association of REALTORS®
A Research Tool Provided by the Multiple Lsting Serve of Hilton Head Island
Latitude Margaritaville
A Research Provided by the Multiple of Listing Service of and theTool Hilton Head Area Association REALTORS® A Research the Multiple Listing ServiceofofREALTORS® Hilton Head Island andTool theProvided Hilton by Head Area Association
Hilton Head Island and the Hilton Head Area Association of REALTORS® Local Market Update – October 2021
October
Year to Date
A Research Tool Provided by the Multiple Listing Service of Hilton Head Island and the Hilton Head Area Association of REALTORS®
Detached Homes Margaritaville Only2020 2021 October Latitude
Latitude Margaritaville Latitude Margaritaville
Key Metrics
2020
Percent Change
New Listings Key Metrics
50
2020 40
- 20.0% 2021
321 Percent Change
29
13
- 55.2% 40
194 - 20.0%
Key Metrics
Closed Sales New Listings
50
New Listings
Percent Change
2021 40
50
503 2020
+ 2021 56.7%
Percent Change
250 321
+ 28.9% 503
- 20.0%
Year to Date Percent Change
2020
2021
P
321+ 56.7% 503
Year to DateYear to Date
- 250 4.3% 194+ 28.9% 250 13 $333,670 194 - 55.2% Percent Change 2021 Percent Change 2020 2021 October Year to Date Percent of List Price Received* 105.7% - 4.1% $354,530 108.0%$399,200 101.4% 101.9% + 12.6%- 5.6% $348,760 Median Sales Price* New Listings 5050 - 20.0% + 56.7% 40 503 Median Sales Price* $354,530 + 12.6% 321 $348,760 4.3% $333,670 $399,200 $333,670 New Listings 321 +- 56.7% Percent503 Change Key Metrics 2020 2021 40 Percent Change- 20.0%2020 2021 Days on Market Until Sale 212 194 14.6% 108.0% 288 Percent of 201 List Price Received* 101.4% 243 101.9% Closed Sales 29 55.2% ++28.9% 13+ 43.3% -105.7% 250 - 4.1% New Listings 5029 + 56.7% 40 13 - 20.0% 503 Sales - 55.2%321 108.0% 194 +- 28.9% 250 Percent Closed of List Price Received* 105.7% - 4.1% 5.6% 101.4% 101.9% Days on Market 201 212 288 $333,670 243 Median Sales Price* $354,530 - 4.3% $399,200 Inventory of Homes forClosed Sale 28 Until Sale - 7.1% + 12.6% --$348,760 -26 --250 + 43.3% Sales 29 +$333,670 28.9% 13$399,200- 55.2% + 12.6%194 Median Sales Price* $354,530 $348,760 - 14.6% 4.3% Days on Market Until Sale 201 + 43.3% 212 + 288 243 * Does not account for sale concessions and/or downpayment | Percent changes are calculated using rounded figures and101.4% can sometimes look extreme size. Percent of Listassistance. Price Received* 105.7% - 4.1% 108.0% - 5.6% 101.9% Sale 28due to small sample -26 -Median Sales Price*Inventory of Homes for $354,530 + 12.6% $348,760 $399,200 $333,670- 7.1%- 4.3% Percent of List Price Received* 105.7% - 4.1% 108.0% - 5.6% 101.4% 101.9% Median Sales Sales Price* Closed
29$399,200
2020
October October
Year to Date
2021
October
$354,530 Closed Sales
Key Metrics Key Metrics
2020 2020
+ 12.6% 13
$348,760 29 - 55.2%
2021 2021 Percent Change 2020 Percent Change
* Does not account for sale concessions and/or downpayment assistance. calculated using rounded figures can sometimes + look extreme Inventory of Homes Sale Until 28 -are7.1% --and243 -26 | Percent+changes -- due to small sample size. Daysfor on Market Sale 201 43.3% 212 14.6% 288
105.7%
101.4%
- 4.1%
108.0%
101.9%
Days on Market Until Sale
201
288
+ 43.3%
212
243
Inventory of Homes for Sale
28
26
- 7.1%
--
--
Percent of List Price Received*
Days on Market Until Sale 201 + 43.3% 212 288 October * Does not account for sale concessions and/or downpayment assistance. | Percent changes are calculated using rounded figures and can sometimes look extreme due to small sample size. Inventory of Homes for Sale 28 - 7.1% -26 --
October Inventory* Does of notHomes Sale - 7.1% 26 account for salefor concessions and/or downpayment assistance. | Percent changes 28 are calculated using rounded figures and can sometimes look extreme due to small sample size. 28 -$399,200
50
October
2020 2021
$354,530
- 5.6%
2020 243 2021 -+ 14.6% --
* Does not account for sale concessions and/or downpayment assistance. | Percent changes are calculated using rounded figures and can sometimes look extreme due to small sample size.
October
50
October October
50
29 $354,530 $354,530
40
40 50
50
40
29
50
$354,530 2020
$399,200 $399,200 $354,530 $354,530
13
40 40
29 - 55.2%
New Listings
Closed Sales
13
New Listings
- 20.0%
13 13
- 55.2%
New Listings - 20.0%
28
$399,200
2020
202128
28
2020
2021
2021
2020
26
2021
28
28
26
13
29
29 29 - 20.0%
- 20.0%
$399,200 $399,200
+ 12.6%
- 7.1%
Price* 13Median Sales Closed Sales
Inventory of Homes for Sale
- 55.2%
+ 12.6%
Closed Sales - 55.2%
Median Sales Price* + 12.6%
20
--
26 --
* Does not account for sale concessions and/or downpayment assistance. | Percent changes are calculated using rounded figures and can sometimes look extreme due to small sample size.
40
+ 14.6%
26 26
+ 12.6%
- 7.1%
Median Sales Price*
Inventory of Home
- 7.1%
Inventory of- 7.1% Homes for Sale
- 20.0%- 20.0% - 55.2% + 12.6% --7.1% - 55.2% 12.6% 7.1% Historical Median Sales Rolling 12-Month Calculation NewPrice Listings Closed Sales Sales+Price* for Sale Historical Median Sales Price Median Rolling 12-Month CalculationInventory of Homes All MLS — A New Listings Closed Sales Median Sales Price* Inventory of Homes Sale New Listings Closed Sales Median Sales Price* Inventory of Homes for for Sale Historical Median SalesRolling Price - Rolling 12-Month Calculation Latitude Margaritaville — Historical Median Sales Price 12-Month Calculation Latitude Margari
Historical Median Sales Price $500,000
$500,000
Rolling 12-Month Calculation
Historical Median 12-Month Calculation Historical Median SalesSales PricePrice RollingRolling 12-Month Calculation $500,000
$400,000
$500,000
$400,000
$300,000$500,000
$400,000
All MLS — All MLS — Latitude Margaritaville —
Latitude Margaritaville —
$400,000
$500,000
All MLS — Latitude Margaritaville — All MLS — Latitude Margaritaville —
$300,000
$300,000
$400,000
$200,000$400,000
$300,000
$200,000
$200,000
$300,000
$200,000
$100,000
$100,000
$300,000 $200,000
$100,000
$100,000
$0
$0
4-2014 4-2015 10-2015 10-2017 4-2016 4-2017 10-2017 4-2020 4-2018 4-2014 10-2014 4-2015 10-201510-2014 4-2016 10-2016 4-2017 4-2018 10-2016 10-2018 4-2019 10-2019 10-2020 10-2018 4-2021 $0 $0 $200,000 10-2014 4-2014 10-2015 4-2017 10-2016 10-20174-2017 4-2018 4-2019 4-2019 10-201910-2019 4-2020 10-2014 4-2016 4-2015 10-2016 10-2015 4-2016 10-2017 10-2018 4-2018 10-2018 4-2020 10-2020 10-2020 4-2021 4-2021 $100,000 4-2015 4-2014
$100,000
$0 4-2014
4-2019 10-2021
10-2019
4-2020
10-2020
Current as of November 10, 2021. Data © 2021 of Hilton Head10, Island. All Rights | Sponsored by South | Report © 2021 ShowingTime. Current asMLS of November 2021. Data Reserved. © 2021 MLS of Hilton HeadCarolina Island.REALTORS®. All Rights Reserved. | Sponsored by South Carolina REALTORS®. | Report © 2 $0 Current as of November 10, 2021. Data © 2021 MLS of Hilton Head Island. All Rights Reserved. | Sponsored by South Carolina REALTORS®. | Report © 2021 ShowingTime. 4-2014 as of10-2014 4-2015 10-2015 4-2016 10-2016 4-2017 10-2017| Sponsored 4-2018 by South 10-2018 10-2019 10-2020 4-2021 10-2021 Current November 10, 2021. Data © 2021 MLS of Hilton Head Island. All Rights Reserved. Carolina4-2019 REALTORS®. | Report4-2020 © 2021 ShowingTime.
Information Sponsored by 10-2014
4-2015Current 10-2015 4-2016 10-2016 4-2017 10-2017 4-2018 10-2018 | Sponsored 4-2019 by10-2019 4-2020 10-2020 4-2021 10-2021 as of November 10, 2021. Data © 2021 MLS of Hilton Head Island. All Rights Reserved. South Carolina REALTORS®. | Report © 2021 ShowingTime.
Information provided by Hilton Head Area Realtors Association Information source Hilton Head Area MLS
Current as of November 10, 2021. Data © 2021 MLS of Hilton Head Island. All Rights Reserved. | Sponsored by South Carolina REALTORS®. | Report © 2021 ShowingTime.
14
4-2
10-2021 10-2021


