Local Market Update – December 2023 A Research Tool Provided by REsides, Inc. and the Hilton Head Area Association of REALTORS®
Wexford Real Estate Market Report
Local Market Update – December 2023 A Research Tool Provided by REsides, Inc. and the Hilton Head Area Association of REALTORS®
Local Market Update – December 2023 Wexford Real Estate Market Report A Research Tool Provided by REsides, Inc. and the Hilton Head Area Association of REALTORS®
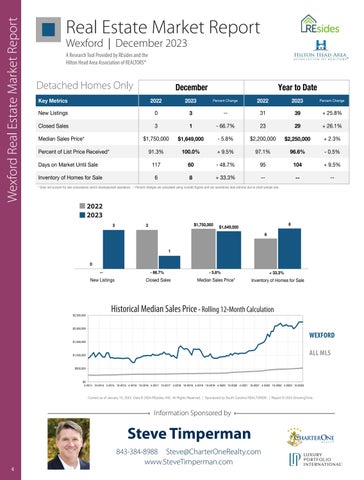
Wexford | December 2023
Wexford Local Market Update – December 2023 December Local Market Update – December 2023
Local Market Update – December 2023 A Research Tool Provided by REsides and the
Wexford
A Research Tool Provided by REsides, Inc. and the AHead Research Tool Provided by REsides, and the Area Association of Inc. REALTORS® HiltonHilton Head Area Association of REALTORS® HeadTool AreaProvided Association of REALTORS® A Hilton Research by REsides, Inc. and the Hilton Head Area Association of REALTORS®2022
Key Metrics
2023
Detached Homes Only 0 Wexford
New Listings
Wexford Wexford
Closed Sales
Key Metrics
3
3
Key Metrics
Median Sales Price*
$1,750,000
New Listings
Percent of List Price Received*
0
Closed Sales
3
91.3%
Closed Sales
Key Metrics Key Metrics Days on Market Until Sale Key Metrics
2022
2023
Percent Change
--
31
39
Year to Date
- 66.7%
2023
$1,649,000
New Listings
Percent Change
December
1
2022
Year to Date
- 5.8%
3
23 December 29
Percent Change
2022
$2,200,000
+ 9.5% 100.0% December December
December 1
+ 25.8%
2023
0 --
$2,250,000
31
3
Year to Date
+ 26.1%
2022 Percent Change 2023
Percent Change
+ 2.3%
2022
2023
Perc
31 + 25.8%
39
+
29
+
39
--
- 0.5% 96.6% Year to DateYear to Date - 66.7% 29 23 + 26.1% 1 Year 23 to Date
97.1%
-366.7%
Percent Change 2022 2023 2023 Percent Change Percent Change 2022 2023 Percent Change 2022 2023 - 48.7% 95 2022 + 9.5% 60 104 Percent Change Percent Change 2022 2023 2022 2023 Median Sales Price* $1,750,000 5.8% $2,200,000 $1,649,000 New Listings 00 -- - 5.8% + 25.8% 3 39 Median Sales Price* $1,750,000 $2,200,000 2.3%$2,250,000 $1,649,000 $2,250,000 New Listings ---- 31 31 ++25.8% 3 08 31 + 25.8% 3+ 33.3% -39 Inventory of Homes forNew SaleListings 6 --39 -Percent of List Price Received* 91.3% 97.1% 100.0% 96.6% Closed Sales 3 - 66.7% 23 + 26.1% 1 29 + 9.5% * Does notPercent account for saleClosed concessions and/or downpayment using rounded can1sometimes small sample23 size. Sales -to 66.7% 2329 +- 26.1% 1 look -extreme 29 of List Price Received* 91.3% +due9.5% 97.1% 0.5% Closed Sales assistance. | Percent changes are calculated 3 3 figures and100.0% 66.7% +96.6% 26.1% Days on Market Until $1,750,000 Sale 117 - 48.7% 95 60 $2,250,000 104 Median Sales Price* - 5.8% $2,200,000 + 2.3% $1,649,000 Sales Price* $1,750,000 - 5.8% - 5.8% + 2.3% $2,250,000 Sales $1,750,000 $1,649,000 + 2.3% $1,649,000 $2,250,000 Days on Median MarketMedian Until Price* Sale 117 - 48.7%$2,200,000 $2,200,000 95 + 9.5% 60 104 Percent of List Price Received* of Homes for 91.3% + 9.5% 97.1% 8 - 0.5%2023 100.0% 96.6%+ 33.3% Inventory Sale 6 --2022 List Price Received* 91.3% - 96.6% 0.5% 100.0% 96.6% Percent Percent of List of Price Received* 91.3% 97.1% - 0.5% 100.0% + 9.5% + 9.5%97.1%
117
+
-
+
December
* Does not account for sale concessions6and/or downpayment assistance. calculated using can sometimes look extreme Inventory of Homes Sale Until + are 33.3% -8 | Percent -changes -- due to small sample size. Daysfor on Market Sale 117 48.7% 95rounded figures--and104 + 9.5% 60
Days on Market Until Sale
117
60
- 48.7%
Inventory of Homes for Sale Inventory of Homes for Sale
6 6
8 8
+ 33.3% + 33.3%
117 $1,750,000 60
Days on Market Until Sale
- 48.7%
95
104
+ 9.5%
---
---
95
3 assistance. | Percent changes are calculated using rounded figures $1,649,000 * Does not account for sale3concessions and/or downpayment and can sometimes look extreme due to small sample size. ---
8 104
+ 9.5%
--
--
December Inventory* Does of notHomes Sale 6calculated using rounded figures8and can sometimes look + 33.3% 6 -account for salefor concessions and/or downpayment assistance. | Percent changes are extreme due to small sample size. * Does not account for sale concessions and/or downpayment assistance. | Percent changes are calculated using rounded figures and can sometimes look extreme due to small sample size.
December
2022
* Does not account for sale concessions and/or downpayment assistance. | Percent changes are calculated using rounded figures and can sometimes look extreme due to small sample size.
3
December December 2023
1
December3 0
3
33
3
--
New Listings
$1,750,000 1
3
- 66.7%
- 5.8%
1
--
00
New Listings
1
$2,500,000
NewListings Listings New --
New Listings New Listings
Closed Sales Sales Closed
- 66.7% - 66.7%
+ 33.3%
Closed SalesSales Closed
- 66.7%
- 5.8%
Median Sales Price*
- 5.8%
Median Sales Price* - 5.8% - 5.8%
+ 33.3%
Inventory of Homes f
Inventory for Inventory of ofHomes Homes forSale Sale Wexford ++—33.3% 33.3%
Median Sales Price* Median Sales Price*
Inventory Sale Inventoryof ofHomes Homes for for Sale
Historical Median Sales Price - Rolling 12-Month Calculation
AllMLS MLS — — All Wexford — — Wexford
Wexford —
WEXFORD
$2,500,000 $1,500,000
$2,000,000 $1,000,000 $1,000,000
$500,000 $2,000,000
All M Wexf
All MLS — All MLS — Wexford —
$2,000,000
$1,500,000 $1,500,000
2023 6
8
++33.3% 33.3% All MLS —
$2,000,000 $2,000,000
$2,500,000 $1,000,000
20228
8
6
Closed Sales
$2,500,000
$1,500,000
2023
6
Historical Median 12-Month Calculation Historical Median SalesSales PricePrice RollingRolling 12-Month Calculation $2,500,000 $2,500,000
2022
Inventory of Homes for Sale
Historical Median Sales Price Rolling 12-Month Calculation
Historical HistoricalMedian MedianSales SalesPrice Price Rolling Rolling 12-Month 12-Month Calculation Calculation
$2,000,000
88
6 $1,649,000 6
Median Sales Price*
11
66.7% Historical Median Sales Price Rolling 12-Month Calculation -----66.7% 0
--
2022$1,649,000 2023 2022 2023
$1,750,000 $1,750,000 $1,649,000 $1,750,000 $1,649,000 $1,649,000
33
Closed 0 Sales
0
$1,750,000
3
2022
ALL MLS
$1,000,000
$1,500,000 $500,000 $500,000
$500,000
$0 $1,500,000 4-2014 10-2014 4-2015 10-2015 4-2016 10-2016 4-2017 10-2017 4-2018 10-2018 4-2019 10-2019 4-2020 10-2020 4-2021 10-2021 4-2022 10-2022 4-2023 10-2023 $1,000,000
$1,000,000
$500,000
$0 $0 $0 4-2014 10-2014 4-2015 10-2015 4-2016 10-2016 4-2017 10-2017 4-2018 10-2018 4-2019 10-2019 4-2020 10-2020 4-2021 10-2021 4-2022 10-2022 4-2023 10-2023 4-20144-2016 10-2014 4-2015 4-2016 10-2016 4-20184-2021 10-2018 4-2020 10-2020 4-2021 10-2021 4-2022 10-2022 4-2023 4-2014 10-2014 4-2015 10-2015 10-2016 4-2017 10-2015 10-2017 4-2018 10-2018 4-20194-2017 10-2019 10-2017 4-2020 10-2020 10-20214-2019 4-2022 10-2019 10-2022 4-2023 10-2023
Current as of January 10, 2024. Data © 2024 REsides, INC. All Rights Reserved. | Sponsored by South Carolina REALTORS®. | Report © 2024 ShowingTime. Current as of January 10, 2024. Data © 2024 REsides, INC. All Rights Reserved. | Sponsored by South Carolina REALTORS®. | Report © 2024 ShowingTime.
$500,000
Current as of January 10, 2024. Data © Current 2024 REsides, All Rights | Sponsored South Carolina | Report © 2024 ShowingTime.by South Carolina REALTORS®. | Report © 2024 as ofINC. January 10,Reserved. 2024. Data © 2024byREsides, INC.REALTORS®. All Rights Reserved. | Sponsored $0 4-2014 10-2014 4-2015 10-2015 4-2016 10-2016 4-2017 10-2017 4-2018 10-2018 4-2019 10-2019 4-2020 10-2020 4-2021 10-2021 4-2022 10-2022 4-2023 10-2023
Information Sponsored by
Steve Timperman
$0 4-2014 10-2014 4-2015 10-2015 4-2016Current 10-2016 4-2017 10, 10-2017 4-2018 4-2019 10-2019 4-2020 10-2020 by4-2021 10-2021 4-2022 10-2022 10-2023 as of January 2024. Data © 202410-2018 REsides, INC. All Rights Reserved. | Sponsored South Carolina REALTORS®. | Report 4-2023 © 2024 ShowingTime.
843-384-8988 Steve@CharterOneRealty.com www.SteveTimperman.com
Current as of January 10, 2024. Data © 2024 REsides, INC. All Rights Reserved. | Sponsored by South Carolina REALTORS®. | Report © 2024 ShowingTime.
4