Local Market Update – December 2023
Local Market Update – December 2023
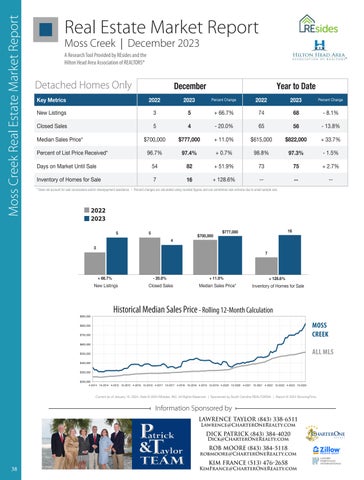
Moss Creek Real Estate Market Report
A Research Tool Provided by REsides, Inc. and the Hilton Head Area Association of REALTORS®
A Research Tool Provided by REsides, Inc. and the Hilton Head Area Association of REALTORS®
Local Market Update – December 2023 Real Estate Market Report MossMoss Creek Creek | December 2023 Local Creek Market Update – December 2023 Moss A Research Tool Provided by REsides, Inc. and the Hilton Head Area Association of REALTORS®
A Research Tool Provided by Inc. REsides and the A Research Tool Provided by REsides, and the Head Area Association of REALTORS® HiltonHilton Head Area Association of REALTORS®
Moss Creek
Local 2023 December Local Market Market Update Update––December December 2023 A Research Tool Provided by REsides, Inc. and the A Research Tool Provided by REsides, Inc. and the Hilton Head Area Association of REALTORS® 2022 Hilton Head Area Association of REALTORS®
Key Metrics
Detached Homes Only New Listings Moss Creek
Moss Creek Creek
Closed Sales Key Metrics
Key Metrics
Median Sales Price* New Listings
2023
2022
4
Closed Sales96.7%
Key Metrics
Days on Market Until Sale
74
68
2023 - 20.0%Percent Change65
2022 56
- 13.8% 2023
$822,000 74
+68 33.7%
5
97.4% 2022
82
54
December
2022
2023
December + 0.7%
4 December December 2023
Year to Date - 8.1%
+ 66.7%
Closed ClosedSales Sales Days on Market Until Sale 5 5
Median Sales Price*
$700,000 Inventory of Homes for Sale Percent of List Price Received* 96.7% Percent of List Price Received* 96.7%
December
54 $700,000 $700,000
2022
2023
Perce
- 8.1%
68
-
65 - 13.8%
56
-1
74
Year -to1.5% Date
73
75
-- 74 74 97.4%
---68+ 0.7%- 8.1% 68 - 8.1%
Percent Change
+ 2.7%
+ 11.0% $777,000 $822,000 Percent Change Percent Change$615,000 2022 2023 2022$615,000 2023 + 11.0% +- 33.7% $822,000 + 66.7% 74 8.1% 68
+3
98.8% 97.3% --13.8% 1.5% - 20.0% 6565 - 13.8% -54 20.0% - 13.8% 44 5656 + 51.9% 73 82 75 + 11.0% $615,000 + 33.7% $777,000 $822,000 + 51.9% 73 + 2.7% + 11.0% $615,000 + 33.7% $777,000 $822,000 82 75 + 11.0% $615,000 + 33.7% $777,000 $822,000 7 + 128.6% -16 -2022 2023 + 0.7% 98.8% 98.8% - 1.5% 97.4% 97.3% + 0.7% - 1.5% 97.4% 97.3%
-
+96.7% 5 5+ 128.6% +66.7% 66.7%
Sales Received* - 20.0% 65 Percent Closed of List Price 96.7% 5 + 0.7% 98.8% 97.4%4 * Does not account for sale concessions and/or downpayment assistance. | Percent changes are calculated using rounded figures and can sometimes look extreme due to small sample size.
Days on Market Until SaleSales Median SalesPrice* Price* Median
Year to Date Percent Change
97.3% - 20.0% 56 -520.0%98.8% 4 Year 65 totoDate Year Date 2023 Percent Change 2022
+ 51.9% $700,000 Percent Change Percent Change
2022 2023 KeyMetrics Metrics Median Sales Price* 2022 $777,000 2023 Median Sales Price*Key $700,000 New Listings 3 5
Inventory of Homes forNew Sale 7 Listings 3 3 16 New Listings Percent of List Price Received*
Percent Change
Percent Change
$615,000 $777,000 5 + 11.0% + 66.7% 3 5
New Listings
Closed Sales
2023
December + 66.7%
$700,000 3
Percent of List Price Received*
2022
Percent Change
5
3 5
Year to Date
56 97.3%
+
Percent of List Price Received* + 0.7% 98.8% - 1.5% 97.4%| Percent changes 97.3% * Does not account for sale concessions and/or96.7% downpayment assistance. are calculated using rounded figures and can sometimes look extreme due to small sample size.
Inventory of Homes for Sale
7
Days on Market Until Sale Dayson onMarket Market UntilSale Sale Days Until
16
828282
54 5454
+ 128.6%
--
--
+ 51.9% 7373 +51.9% 51.9% +$777,000
+75 2.7% + 2.7% 16
+ 2.7%
-- -- --
-----
--
* Does not account for sale concessions | Percent changes are calculated using rounded figures and can sometimes look extreme due to small sample size. 5 and/or downpayment assistance. 5
December Inventory Homes forSale Sale Inventory ofInventory Homesofof for Sale Homes for
$700,000
161616
777
4
128.6% + 128.6% -- -+ +128.6%
--
737575
2022
Doesnot notaccount accountforforsale saleconcessions concessionsand/or and/ordownpayment downpaymentassistance. assistance.| Percent | Percent changes calculated using rounded figures and sometimes look extreme due to small sample changes areare calculated using rounded figures and cancan sometimes extreme due to small sample size.size. * Does not account for**Does sale concessions and/or downpayment assistance. | Percent changes are calculated using rounded figures and canlook sometimes look extreme due to small sample size.
3 December
2022 December December 2023 December
5
55
5
+ 66.7%
3
5 5
55
4
- 20.0%
3 3
4
$700,000 $700,000 $700,000
4
+ 66.7%
New Listings + 66.7%New Listings
$900,000 $800,000
New Listings
$777,000
+ 128.6%
+ 66.7%
- 20.0%
Closed Sales
Median Sales Price*
+ 11.0% + 11.0%
+ 128.6% + 128.6% All MLS — Inventory of Homes for Sale Moss Creek —
Median Sales Price* Median Sales Price*
$900,000
Inventory All MLSof—Homes for Sale
$500,000
All MLS — Moss Creek —
$900,000 $400,000
MOSS All MLS — CREEK Moss Creek —
$800,000
$700,000
$900,000
$700,000
$600,000
$800,000
$700,000 $600,000 $600,000 $500,000
$500,000
$500,000 $400,000
$400,000
$700,000
$300,000 $800,000 $600,000
All M Moss Cre
All MLS —— Moss Creek Moss Creek —
$900,000 $800,000
Inventory of Homes fo
Inventory of Homes for Sale
Historical Median Sales Price Rolling 12-Month Calculation
$600,000
+ 128.6%
+ 128.6%
Historical Median Sales Price - Rolling 12-Month Calculation
Historical Median$800,000 Sales Price Rolling 12-Month Calculation
7
Inventory of Homes for Sale + 128.6%
Median Sales Price*
Historical Median Sales Price Sales Rolling 12-Month Calculation Median Sales Price* New Listings Closed Historical Median Sales Price Rolling 12-Month Calculation
2023
16
+ 11.0%
- 20.0% + 11.0% Historical Median - 20.0% Sales Price Rolling 12-Month + 11.0%Calculation
Closed Sales
2022
16
New Listings
Closed Sales Closed Sales
2023
16
7 Inventory 7 of Homes for Sale 77
- 20.0%
2022
1616
+ 11.0%
$900,000
$700,000
2022 2023 2023 2022
Median Sales Price*
4
Closed Sales
$777,000
$777,000 $777,000 $777,000
$700,000
Historical Median Sales+ 66.7% Price Rolling 12-Month -Calculation 20.0% + 66.7%
7 $700,000
4
5 3 Listings New 3
5
ALL MLS
$400,000 $300,000
$200,000 $300,000 $700,000 4-2014$500,000 10-2014 4-2015 10-2015 4-2016 10-2016 4-2017 10-2017 4-2018 10-2018 4-2019 10-2019 4-2020 10-2020 4-2021 10-2021 4-2022 10-2022 4-2023 10-2023 $300,000 $200,000 $200,000 4-2014 10-2014 4-2015 10-2015 4-2016 10-2016 4-2017 10-2017 4-2018 10-2018 4-2019 10-2019 4-2020 10-2020 4-2021 10-2021 4-2022 10-2022 4-2023 10-2023 4-2014 10-2014 4-2015 10-2015 4-2016 10-2016 4-2017 10-2017 4-2018 10-2018 4-2019 10-2019 4-2020 10-2020 $200,000 4-2014 10-2014 4-2015 10-2015 4-2016 10-2016 4-2017 10-2017 4-2018 10-2018 4-2019 10-2019 4-2020 10-2020 4-2021 10-2021 4-2022 10-2022 4-2023 10-2023
$600,000
$400,000
$500,000
$300,000
$400,000
Current as of January 10, 2024. Data © 2024 REsides, INC. All Rights Reserved. | Sponsored by South Carolina REALTORS®. | Report © 2024 Current as of January 10, 2024. Data © 2024 REsides, INC. All Rights Reserved. | Sponsored by South Carolina REALTORS®. | Report © 2024 ShowingTime. $200,000 4-2014 10-2014 4-2015 10-2015 4-2016 10-2016 4-2017 10-2017 4-2018 10-2018 4-2019 10-2019 4-2020 10-2020 4-2021 10-2021 4-2022 10-2022 4-2023 10-2023
4-2021 10-2021 4-2022 10-2022 4-2023
Current as of January 10, 2024. Data © 2024 REsides, INC. All Rights Reserved. | Sponsored by South Carolina REALTORS®. | Report © 2024 ShowingTime. Current as of January 10, 2024. Data © 2024 REsides, INC. All Rights Reserved. | Sponsored by South Carolina REALTORS®. | Report © 2024 ShowingTime.
Information Sponsored by
LAWRENCE TAYLOR (843) 338-6511 $300,000
Lawrence@CharterOneRealty.com
DICK PATRICK (843) 384-4020
Current as of January 10, 2024. Data © 2024 REsides, INC. All Rights Reserved. | Sponsored by South Carolina REALTORS®. | Report © 2024 ShowingTime.
$200,000 Dick@CharterOneRealty.com 4-2014 10-2014 4-2015 10-2015 4-2016 10-2016 4-2017 10-2017 4-2018 10-2018 4-2019 10-2019 4-2020 10-2020 4-2021 10-2021 4-2022 10-2022 4-2023 10-2023
ROB MOORE (843) 384-5118
robmoore@CharterOneRealty.com
38
KIM FRANCE (513) 476-2658
Current as of January 10, 2024. Data © 2024 REsides, INC. All KimFrance@CharterOneRealty.com Rights Reserved. | Sponsored by South Carolina REALTORS®. | Report © 2024 ShowingTime.