Local Market Update – December 2023 A Research Tool Provided by REsides, Inc. and the Hilton Head Area Association of REALTORS®
Windmill Harbour Real Estate Market Report
Local Market Update – December 2023 A Research Tool Provided by REsides, Inc. and the Hilton Head Area Association of REALTORS®
Local Market Update – December 2023 Windmill Harbour Real Estate Market Report A Research Tool Provided by REsides, Inc. and the Hilton Head Area Association of REALTORS®
Windmill Harbour | December 2023
Windmill Harbour Local Market Update – December 2023 December Local Market Update – December 2023
Local Market Update – December 2023 A Research Tool Provided by REsides and the
Windmill Harbour
A Research Tool Provided by REsides, Inc. and the A Head Research Tool Provided by REsides, and the Area Association ofInc. REALTORS® Hilton Hilton Head Area Association of REALTORS® HeadTool AreaProvided Association of REALTORS® A Hilton Research by REsides, Inc. and the Hilton Head Area Association of REALTORS®2022
Key Metrics
2023
Year to Date
Percent Change
2022
2023
Percent Change
24
37
Year to Date
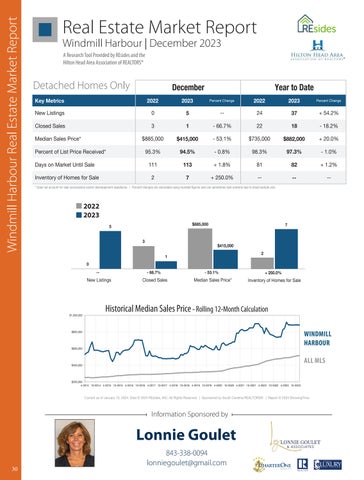
0 -5 Detached Homes Only December Windmill Harbour
New Listings
Windmill Harbour Harbour Windmill
Closed Sales
3
Key Metrics
2022
Key Metrics
Median Sales Price*
$885,000
New Listings
Percent of List Price Received*
Closed Sales
- 66.7%
2023
$415,000
New Listings
0
Closed Sales
3
94.5%
95.3%
Key Metrics Key Metrics Days on Market Until Sale Key Metrics
1
- 53.1%
5
+ 54.2%
22 December 18
Percent Change
2022
$735,000
2023
0 --
$882,000
24
5
- 0.8% 98.3% December December December -366.7% 1
- 18.2%
2022 Percent Change 2023
+ 20.0%
2022
2023
Percen
24 + 54.2%
37
+5
18
-1
37
--
Year to Date Percent Change
- 1.0% 97.3% Year to DateYear to Date - 66.7% 18 22 - 18.2% 1 Year 22 to Date
Percent Change Percent Change 2022 2023 2023 Percent Change Percent Change 2022 2022 2023 +2023 1.8%Percent Change 81 2022 + 1.2% 113 82 Percent Change 2022 2023 2022 2023 Median Sales Price* $885,000 53.1% $735,000 $415,000 $882,000 New Listings 00 --- 53.1% + 54.2% 5 37 Median Sales Price* $885,000 $735,000 ++ 20.0% $415,000 $882,000 New Listings ---- 24 24 54.2% 5 07 24 + 54.2% 5+ 250.0% -37 Inventory of Homes forNew SaleListings 2 --37 -Percent of List Price Received* 95.3% 98.3% 97.3% Closed Sales 3 - 66.7% 2294.5% - 18.2% 1 18 - 0.8% * Does notPercent account for saleClosed concessions and/or downpayment using rounded can1sometimes small sample22 size. Sales -to 66.7% 2218 --18.2% 1 look -extreme 18 of List Price Received* 95.3% -due0.8% 98.3% 1.0% Closed Sales assistance. | Percent changes are calculated 3 3 figures and94.5% 66.7% -97.3% 18.2% Days on Market Until Sale 111 81 113 $882,000+ 1.8% 82 Median Sales Price* $885,000 - 53.1% $735,000 + 20.0% $415,000 Sales Price* $885,000 $735,000 $735,000 +$882,000 20.0% $882,000 Sales $885,000 $415,000 - 53.1% ++20.0% $415,000- 53.1% Days on Median MarketMedian Until Price* Sale 111 + 1.8% 81 1.2% 113 82 Percent of List Price Received* of Homes for 95.3% - 0.8% 98.3% 7 - 1.0%2023 94.5% 97.3%+ 250.0% Inventory Sale 2 --2022 List Price Received* 95.3% - 97.3% 1.0% 94.5% 97.3% Percent Percent of List of Price Received* 95.3% 98.3% - 1.0% 94.5% - 0.8% - 0.8%98.3%
111
+2
-1
+1
December
* Does not account for sale concessions2and/or downpayment assistance. are calculated using can sometimes look extreme Inventory of Homes Sale Until + 250.0% -7 | Percent changes -- due to small sample size. Daysfor on Market Sale 111 + 1.8% 81rounded figures--and82 + 1.2% 113
Days on Market Until Sale
111
113
+ 1.8%
Inventory of Homes for Sale Inventory of Homes for Sale
2 2
7 7
+ 250.0% + 250.0%
111 $885,000 113
Days on Market Until Sale
+ 1.8%
81
82
+ 1.2%
---
---
7 82
81
* Does not account for sale5concessions and/or downpayment assistance. | Percent changes are calculated using rounded figures and can sometimes look extreme due to small sample size.
---
December Inventory* Does of notHomes Sale 2calculated using rounded figures7and can sometimes look+extreme 250.0% account for salefor concessions and/or downpayment assistance. | Percent changes are due to small sample size.
December
3
2022
--
--
* Does not account for sale concessions and/or downpayment assistance. | Percent changes are calculated using rounded figures and can sometimes look extreme due to small sample size.
+ 1.2%
* Does not account for sale concessions and/or downpayment assistance. | Percent changes are calculated using rounded figures and can sometimes look extreme due to small sample size.
December December 2023
December
5
0
- 66.7%
3 Closed 0 Sales
New Listings
- 53.1%
33 11
New Listings
1
66.7% Historical Median Sales Price Rolling 12-Month Calculation -----66.7% 0
-$1,000,000
NewListings Listings New --
New Listings New Listings
1
Closed Sales Sales Closed
- 66.7% - 66.7%
Closed SalesSales Closed
$415,000
Closed Sales Median Sales Price* - 53.1% - 53.1%
$1,000,000
2
- 53.1% 2 2
$800,000
$800,000
$400,000 $400,000
Inventory of Homes fo
Inventory Sale Inventoryof ofHomes Homes for for Sale AllMLS MLS — — All WindmillHarbour Harbour — — Windmill
All ML Windmill Harbou
Historical Median Sales Price - Rolling 12-Month Calculation
All MLS — All MLS — Windmill Harbour —
Windmill Harbour —
WINDMILL HARBOUR
$800,000 $800,000
$600,000 $600,000
2
Inventory of for InventoryWindmill ofHomes Homes forSale Sale Harbour ++— 250.0% 250.0%
$1,000,000 $400,000
7
+ 250.0%
++250.0% 250.0% All MLS —
Median Sales Price* Median Sales Price*
$800,000
$600,000
7
Median Sales Price*
- 53.1%
Historical Median 12-Month Calculation Historical Median SalesSales PricePrice RollingRolling 12-Month Calculation $1,000,000 $1,000,000
2023
7
$415,000 Inventory2of Homes for Sale
$1,000,000
$800,000
2022
+ 250.0%
Historical Median Sales Price Rolling 12-Month Calculation
Historical HistoricalMedian MedianSales SalesPrice Price Rolling Rolling 12-Month 12-Month Calculation Calculation
2023
$415,000
1 $415,000 $415,000
- 66.7%
2022 2023 2023
77
Median Sales Price*
3
--
00
0
2022 2022
$885,000
5
--
2
$885,000 $885,000 $885,000 3
1
55
$885,000
$415,000
5
2022
--
$600,000
ALL MLS
$400,000
$600,000 $200,000 4-2014 10-2014 4-2015 10-2015 4-2016 10-2016 4-2017 10-2017 4-2018 10-2018 4-2019 10-2019 4-2020 10-2020 4-2021 10-2021 4-2022 10-2022 4-2023 10-2023
$600,000 $400,000
$200,000 $200,000 $200,000 4-2014 10-2014 4-2015 10-2015 4-2016 10-2016 4-2017 10-2017 4-2018 10-2018 4-2019 10-2019 4-2020 10-2020 4-2021 10-2021 4-2022 10-2022 4-2023 10-2023 4-20144-2016 10-2014 4-2015 4-2016 10-2016 4-20184-2021 10-2018 4-2020 10-2020 4-2021 10-2021 4-2022 10-2022 4-2023 4-2014 10-2014 4-2015 10-2015 10-2016 4-2017 10-2015 10-2017 4-2018 10-2018 4-20194-2017 10-2019 10-2017 4-2020 10-2020 10-20214-2019 4-2022 10-2019 10-2022 4-2023 10-2023
Current as of January 10, 2024. Data © 2024 REsides, INC. All Rights Reserved. | Sponsored by South Carolina REALTORS®. | Report © 2024 ShowingTime.
$400,000
Current as of January 10, 2024. Data © 2024 REsides, INC. All Rights Reserved. | Sponsored by South Carolina REALTORS®. | Report © 2024 ShowingTime.
Current as of January 10, 2024. Data © Current 2024 REsides, All Rights | Sponsored South Carolina | Report © 2024 ShowingTime.by South Carolina REALTORS®. | Report © 2024 S as ofINC. January 10,Reserved. 2024. Data © 2024byREsides, INC.REALTORS®. All Rights Reserved. | Sponsored $200,000 4-2014 10-2014 4-2015 10-2015 4-2016 10-2016 4-2017 10-2017 4-2018 10-2018 4-2019 10-2019 4-2020 10-2020 4-2021 10-2021 4-2022 10-2022 4-2023 10-2023
Information Sponsored by
$200,000 4-2014 10-2014 4-2015 10-2015 4-2016Current 10-2016 4-2017 10, 10-2017 4-2018 4-2019 10-2019 4-2020 10-2020 by4-2021 10-2021 4-2022 10-2022 10-2023 as of January 2024. Data © 202410-2018 REsides, INC. All Rights Reserved. | Sponsored South Carolina REALTORS®. | Report 4-2023 © 2024 ShowingTime.
Lonnie Goulet 843-338-0094 lonniegoulet@gmail.com
Current as of January 10, 2024. Data © 2024 REsides, INC. All Rights Reserved. | Sponsored by South Carolina REALTORS®. | Report © 2024 ShowingTime.
30