Local Market Update – December 2023
Local Market Update – December 2023
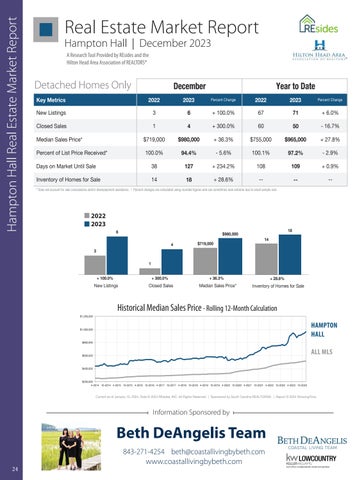
Hampton Hall Real Estate Market Report
A Research Tool Provided by REsides, Inc. and the Hilton Head Area Association of REALTORS®
A Research Tool Provided by REsides, Inc. and the Hilton Head Area Association of REALTORS®
Local Market Update – December 2023 Real Estate Market Report Hampton Hall HamptonUpdate Hall | –December 2023 Local MarketHall December 2023 Hampton A Research Tool Provided by REsides, Inc. and the Hilton Head Area Association of REALTORS®
A Research Tool Provided REsides A Research Tool Provided by REsides,byInc. and theand the Hilton Head Area Association of REALTORS® Hilton Head Area Association of REALTORS®
Hampton Hall
Local 2023 December Local Market Market Update Update––December December 2023 A Research Tool Provided by REsides, Inc. and the A Research Tool Provided by REsides, Inc. and the Hilton Head Area Association of REALTORS® 2022 Hilton Head Area Association of REALTORS®
Key Metrics
2023
Detached Homes Only New Listings Hampton Hall3 Closed Sales Key Metrics
1 2022
4
Closed Sales100.0% 1
Key Metrics
Days on Market Until Sale
67
71
Percent Change 60 2023 + 300.0%
2022 50
- 16.7% 2023
$965,000 67
+7127.8%
94.4% 2022
127
38
2023
+ 36.3%+ 100.0% $755,000
December - 5.6%
3
Percent Change
Year to Date + 6.0%
Percent Change
6
+ 234.2% $719,000 Percent Change Percent Change
$719,000 Inventory of Homes for Sale Percent of List Price Received* 100.0% Percent of List Price Received* 100.0%
December
38 $719,000 $719,000
2023
Perce
67 + 6.0%
71
+
60 - 16.7%
50
-1
Year -to2.9% Date
$980,000
127 $980,000 $980,000
94.4%
Percent Change
108
109
-- 67 67 94.4%
-- 100.1% --71- 5.6%+ 6.0% 71 + 6.0%
+ 0.9%
+ 36.3% $980,000 $965,000 Percent Change Percent Change$755,000 2022 2023 2022$755,000 2023 + 36.3% ++27.8% $965,000 + 100.0% 67 6.0% 71
+
97.2%
-
109
+
+ +100.0% 6 6 + 28.6% 100.0% 100.0% 44
Closed ClosedSales Sales Days on Market Until Sale 1 1
Median Sales Price*
2022
+ 100.0%
Closed SalesReceived* + 300.0% 60 Percent of List Price 100.0% 1 - 5.6% 100.1% 94.4% 4 * Does not account for sale concessions and/or downpayment assistance. | Percent changes are calculated using rounded figures and can sometimes look extreme due to small sample size.
Days on Market Until SaleSales Median SalesPrice* Price* Median
Year to Date Percent Change
100.1% 4 97.2% +Date 300.0% 50 + 1300.0% 60 4 December Year toto December Year Date 2023 Percent Change 2023 2022
2023 KeyMetrics Metrics Median Sales Price* 2022 $980,000 2023 Median Sales Price*Key $719,0002022 New Listings 3 6
Inventory of Homes forNew Sale Listings 3 3 18 New Listings Percent of List 14 Price Received*
December
2022
$980,000 6
New Listings
Closed Sales
2023
December + 100.0%
$719,000 3
Percent of List Price Received*
2022
Percent Change
6
Hampton Hampton Hall Hall Key Metrics
Median Sales Price* New Listings
Year to Date
50 97.2%
-- 16.7% 2.9%
- 16.7% - 16.7% 50+ 50234.2% 108 $755,000 + 27.8% $965,000 + 0.9% + 27.8% 109 + 27.8% 14 + 28.6% -18 2022 2023 5.6% 100.1% - 2.9% 97.2% - 5.6% 100.1% - 2.9% 97.2%
+ +300.0% 300.0% 38
+ 36.3%
60127 60
234.2% $755,000 +36.3% 36.3% $755,000 108 $965,000 ++ $965,000
--
94.4% Percent of List Price Received* 100.0% - 5.6% 100.1% - 2.9% 94.4% 97.2% * Does not account for sale concessions and/or downpayment assistance. | Percent changes are calculated using rounded figures and can sometimes look extreme due to small sample size.
Inventory of Homes for Sale
14
Days on Market Until Sale Dayson onMarket Market UntilSale Sale Days Until
3838
18
+ 28.6%
127
+ 234.2% 108 + 234.2%
181818
28.6% + 28.6% -- -+ +28.6%
--
--
108
127 109 38 + 234.2% 108 127 109 6 and/or downpayment assistance. | Percent changes are calculated * Does not account for sale concessions using rounded figures and can$980,000 sometimes look extreme due to small sample size.
December Inventory Homes forSale Sale Inventory ofInventory Homesofof for Sale Homes for
14 1414
$719,000
4
--
+109 0.9% 18 + 0.9%
+ 0.9%
-----
--
-- -- -14
2022
Doesnot notaccount accountforforsale saleconcessions concessionsand/or and/ordownpayment downpaymentassistance. assistance.| Percent | Percent changes calculated using rounded figures and sometimes look extreme due to small sample changes areare calculated using rounded figures and cancan sometimes extreme due to small sample size.size. * Does not account for**Does sale concessions and/or downpayment assistance. | Percent changes are calculated using rounded figures and canlook sometimes look extreme due to small sample size.
December 3
6
2022 2023 6
December December December
66
6
1
+ 100.0%
$719,000
4
4
4
$719,000 36.3% $719,000 1+$719,000
4
$980,000
$719,000
2022 2023 2023 2022
+ 100.0% 1
+ 300.0%
+ 36.3%
Historical Median Sales+ 100.0% Price Rolling 12-Month+Calculation 300.0%
Closed Sales
Median Sales Price*
+ 36.3% + 36.3%
+ 28.6% + 28.6% All MLS — Inventory of Hampton Homes for HallSale —
1
+ 100.0%
New Listings New Listings + 100.0%
$1,200,000
$1,000,000
+ 100.0%
New Listings
+ 300.0%
Closed Sales Sales +Closed 300.0%
+ 28.6%
Inventory of Homes f
Inventory of Homes for Sale + 28.6%
Historical+Median 300.0% Sales Price Rolling 12-Month + 36.3%Calculation
Median Sales Price*
Historical Median Sales PriceSales Rolling 12-Month Calculation Median Sales Price* New Listings Closed Historical Median Sales Price Rolling 12-Month Calculation
+ 28.6%
Inventory of Homes for Sale
Inventory of—Homes for Sale All MLS
All M Hampton H
Historical Median Sales Price - Rolling 12-Month Calculation
$1,200,000
Historical Median Sales Price Rolling 12-Month Calculation $1,200,000
Historical Median Sales Price Rolling 12-Month Calculation $1,200,000
$800,000
$1,200,000
$600,000
All MLSHall —— Hampton Hampton Hall —
All MLS — Hampton Hall —
$800,000
HAMPTON All MLS — HALLHall — Hampton
$600,000
ALL MLS
$1,000,000
$1,000,000
$1,000,000 $800,000
$1,200,000 $1,000,000
$800,000
$400,000
$600,000
$1,000,000
18
14
Inventory of Homes for Sale
Median Sales Price* Median Sales Price* + 36.3%
Closed Sales
2023
+ 28.6% 14
New 1 1 Listings
3
2022
18
18
Median Sales Price*
Closed Sales
2023
14
14 14
4
New 3 Listings
2022
1818
$980,000 $980,000 $980,000
3
+ 300.0% 3 3
$980,000
$800,000
$600,000 $400,000
$400,000
$200,000 $400,000 4-2014 10-2014 4-2015 10-2015 4-2016 10-2016 4-2017 10-2017 4-2018 10-2018 4-2019 10-2019 4-2020 10-2020 4-2021 10-2021 4-2022 10-2022 4-2023 10-2023 $600,000
$800,000 $400,000
$600,000
$200,000 $200,000 4-2014 10-2014 4-2015 10-2015 4-2016 10-2016 4-2017 10-2017 4-2018 10-2018 4-2019 10-2019 4-2020 10-2020 4-2021 10-2021 4-2022 10-2022 4-2023 10-2023 4-2014 10-2014 4-2015 10-2015 4-2016 10-2016 4-2017 10-2017 4-2018 10-2018 4-2019 10-2019 4-2020 10-2020 4-2021 10-2021 4-2022 10-2022 4-2023 $200,000 4-2014 10-2014 4-2015 10-2015 4-2016 10-2016 4-2017 10-2017 4-2018 10-2018 4-2019 10-2019 4-2020 10-2020 4-2021 10-2021 4-2022 10-2022 4-2023 10-2023
Current as of January 10, 2024. Data © 2024 REsides, INC. All Rights Reserved. | Sponsored by South Carolina REALTORS®. | Report © 2024 ShowingTime. Current as of January 10, 2024. Data © 2024 REsides, INC. All Rights Reserved. | Sponsored by South Carolina REALTORS®. | Report © 2024 ShowingTime.
Current as of January 10, 2024. Data © 2024 REsides, INC. All Rights Reserved. | Sponsored by South Carolina REALTORS®. | Report © 2024 Current as of January 10, 2024. Data © 2024 REsides, INC. All Rights Reserved. | Sponsored by South Carolina REALTORS®. | Report © 2024 ShowingTime. $200,000 4-2014 10-2014 4-2015 10-2015 4-2016 10-2016 4-2017 10-2017 4-2018 10-2018 4-2019 10-2019 4-2020 10-2020 4-2021 10-2021 4-2022 10-2022 4-2023 10-2023
Information Sponsored by
$400,000
Beth DeAngelis Team
Current as of January 10, 2024. Data © 2024 REsides, INC. All Rights Reserved. | Sponsored by South Carolina REALTORS®. | Report © 2024 ShowingTime.
$200,000 4-2014 10-2014 4-2015 10-2015 4-2016 10-2016 4-2017 10-2017 4-2018 10-2018 4-2019 10-2019 4-2020 10-2020 4-2021 10-2021 4-2022 10-2022 4-2023 10-2023
24
843-271-4254 beth@coastallivingbybeth.com www.coastallivingbybeth.com
Current as of January 10, 2024. Data © 2024 REsides, INC. All Rights Reserved. | Sponsored by South Carolina REALTORS®. | Report © 2024 ShowingTime.