December
Year to Date
New Listings
Local Market Update – December 2023Local Market Update – December 2023
Closed Sales
Hilton Head Area Association 8 of REALTORS® 9
+ 12.5%
163
145
$1,395,000
- 14.2%
$1,650,000
$1,550,000
Sea Pines Real Estate Market Report
Key Metrics
2022
2023
Percent Change
2022
2023
3 REsides, Inc. 7 and the + 133.3% A Research Tool Provided by
205
178
Percent Change
- 13.2%
A Research Tool Provided by REsides, Inc. and the Hilton Head Area Association of REALTORS®
- 11.0%
Real Estate Market Report
Median Sales Price*
$1,625,000
Local Market Update – December 2023 A Research Tool Provided by REsides, Inc. and the Sea Pines Hilton Head Area Association of REALTORS® - 6.1%
Sea Pines | December 2023 Sea LocalPines Market Update – December 2023 95.5%
97.3%
+ 1.9%
99.2%
97.7%
Days on Market Until Sale
123
62
- 49.9%
93
92
Inventory of Homes for Sale
30
31
+ 3.3%
--
--
Percent of List Price Received*
Sea Pines
A Research ToolbyProvided by REsides A Research Tool Provided REsides, Inc. and the and the Detached Homes Only
- 1.6% Detached Homes Only - 1.9%
December
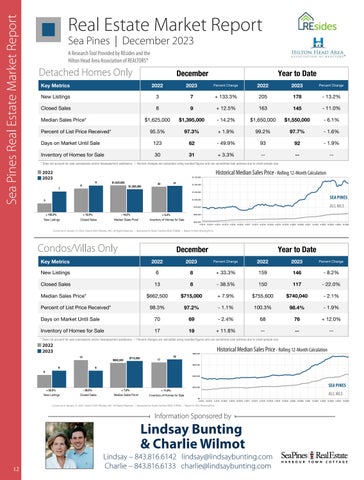
Detached Homes Only
Sea Pines 9
A Research Tool Provided by REsides, Inc. and the Hilton Head Area Association of REALTORS®
2023
Percent Change
2022
2023
Percent Change
New Listings
3
7
+ 133.3%
205
178
- 13.2%
Closed Sales 2022 2023
8
9
+ 12.5%
163
145
- 11.0%
$1,625,000
$1,395,000
- 14.2%
$1,650,000
$1,550,000
- 6.1%
Percent of List Price Received*
95.5%
97.3%
+ 1.9%
99.2%
97.7%
7 Key Metrics
8
- 1.6%
Percent Change 2023 Days on Market Until Sale
123
Median Sales Price*
2022
Local MarketClosed Update – December 2023 Sales + 12.5% 2022 Median Sales Price* Key Metrics
- 49.9%
93
31
+ 3.3%
--
30
+ 133.3%
2022
9 December
Year to Date
- 14.2%
2022 62
December
Inventory of Homes for Sale
Year to Date
205
2023 178
Percent Change - 1.9% 92
2023
Percent Change
$1,625,000 2022 2023
7
+ 133.3%
205
2023
+ 12.5%
163
7
3
December - 14.2%
+ 3.3% $1,395,000
Percent Change
8
9
+ 133.3%
145
205
Year to Date $1,550,000
$1,625,000
$1,650,000
- 13.2%
--
2023
2022 - 11.0%
31
30
Perce
2023
178
-1
- 6.1%
$1,395,000
+ 12.5% 163 145 Percent Change 2022 2023 1.6% 97.7% 12.5% 163 Median+ Sales Price* $1,625,000 - 14.2% $1,650,000 $1,395,000 $1,550,000 New Listings $1,625,000 $1,395,000 - 14.2% 3 + 133.3% 205 - 13.2% 7 178 Median Sales Price* $1,650,000 - 6.1% $1,550,000 Historical Median Sales Price Rolling 12-Month Calculation Days on Market Until Sale Percent of List Price Received* 123 - 49.9% 97.3% 93 + 1.9% 92 62All MLS — 95.5% 99.2% - 1.9% 97.7% Percent of List Price Received* 95.5% + 1.9% 99.2% - 1.6% 97.3% 97.7% Sea Pines + 133.3% + 12.5% + 12.5% - 14.2% Condos / Villas Only + 3.3% Closed Sales 8 163 - 11.0% 9 — 145 Days on Market Until Sale 123 - 49.9% 93 - 1.9% 62 New Listings Closed Sales Median Sales Price* Inventory of Homes for Sale $1,750,000 Inventory of Homes for Sale Days 3092 -- - 49.9% -31 -on Market Until Sale 123+ 3.3% 93 62 92 Inventory of Homes for Sale 30 + 3.3% --31 -Median Sales Price* $1,625,000 - 14.2% $1,650,000 - 6.1% $1,395,000 $1,550,000 Yearusing to Date * Does not account for sale concessions and/orDecember downpayment assistance. | Percent changes are calculated rounded figures and can sometimes look extreme due to small sample size. $1,500,000 Historical Median All MLS — InventoryPercent of Homes for Sale 30 Sales Price Rolling -3112-Month Calculation+ 3.3% -Change Percent Change Key Metrics 2022 2023 2022 Percent of List Price Received* 95.5% 2023 97.3% + 1.9%Median Sales 99.2% - 1.6%Sea Pines — 2022 Historical Price - Rolling 97.7% 12-Month Calculation $1,250,000 December 2022 2023 * Does not account for sale concessions and/or downpayment assistance.$1,750,000 | Percent changes are calculated using rounded figures and can sometimes look extreme due to small sample size. 2023 New Listings 6 + 33.3% 159 - 8.2% 8 146 2022 2023 9 Sale $1,625,000 Local 2023 31 Days Market Until 49.9%– December93 - 1.9% 62 Market -Update 92 $1,000,000 30 123 $1,500,000 A Research Toolon Provided by REsides, Inc. and the New Listings New Listings
Closed Sales Median Sales Price*
Closed Sales3
Key Metrics
Percent of List Price Received* Closed Sales 8 9
Sea Pines
of Homes for Sale - 13.2% 178 Inventory
2022
2023
87
Percent Change
- 11.0% 97.3% 3
95.5% 145
9
2022
Percent Change
Year to Date
--
* Does not account for sale concessions and/or downpayment assistance. | Percent changes are calculated using rounded figures and can sometimes look extreme due to small sample size.
8
New Listings December
A Research Tool Provided by REsides, Inc. and the Hilton Head Area Association of REALTORS® + 133.3%
7
3
Key Metrics
Detached Homes Only
30
$1,395,000
NewPines Listings Sea Detached Homes Only
3
December 31
$1,625,000
Year to Date
2022
Hilton Head AreaHead Association of REALTORS® Hilton Area Association of REALTORS®
Local Market Update – December 2023 Detached Homes Only
December
--
Key Metrics
* Does not account for sale concessions and/or downpayment assistance. | Percent changes are calculated using rounded figures and can sometimes look extreme due to small sample size.
+ 1.9%
-1
-1
Local Market Update – December 2023 December 8
$1,395,000 - 38.5%
8
13
7
117
150
December Inventory of$662,500 Homes for$715,000 Sale + 7.9%
Hilton Head Area Association of REALTORS®
A Research Tool Provided by REsides, Inc. and the - 22.0% Hilton Head Area Association of REALTORS®
+ 3.3% -31 $1,625,000 - 2.1% $740,040 8 * Does not account for sale concessions and/or downpayment assistance. | Percent changes are calculated using rounded figures and can sometimes look extreme due to small sample size. $1,395,000 $500,000 Percent of List Price Received* 98.3% - 1.1% 100.3% - 1.9% 97.2% 98.4% 7 9 $1,625,000 $750,000
Median Sales Price*
30 $755,6009
December Sea Pines New Listings
Inventory of Homes for Sale
Sea Pines
69
- 2.4% - 14.2%
Closed Sales
19
Median Sales Price*
17
3
8
76
68
Inventory of Homes for Sale
+ 11.8%
Condos Villas Historical Median/Sales PriceOnly
3
--
--
7
Local Market Update 13 – December 2023
$1,500,000
A Research Tool Provided by REsides, Inc. and the Hilton Head Area Association of REALTORS®
Sea NewPines Listings $750,000
2022
17
2023
2023
13
8 $715,000
Percent of List Price Received*
98.3%
97.2%
+ 12.5%
2022 Median SalesClosed Price* Sales
Key Metrics
New Listings
New$1,750,000 Listings
2023
Percent Change
117
$755,600
$740,040
- 2.1%
- 1.1%
100.3%
98.4%
- 1.9%
- 14.2%
- 22.0%
+ 3.3%
22.0% 117 + 3.3% All-MLS 2022 —
150
2023
All ML Sea Pine
13
Percent Change
8
Current as of January 10, 2024. Data | Sponsored by South ShowingTime. 6 © 2024 REsides, INC. + 33.3% 159Carolina REALTORS®. 8 All Rights Reserved. 146| Report © 2024- 8.2%
$1,750,000 Percent of List Price Received* 13 - 38.5% 8
6 98.3% - 22.0% 97.2% 117 $1,500,000 Historical Median Sales Price Rolling 12-Month Calculation Historical Median Sales Median Sales Price* Price Rolling 12-Month $662,500Calculation + 7.9% $755,600 - 2.1% $715,000 $740,040 All MLS — Days on Market Until Sale $1,500,000 70 69 Sea Pines — Percent of List Price Received* 98.3% - 1.1% 100.3% - 1.9% 97.2% 98.4% 150
8
- 1.1%
$1,250,000
- 2.4% 69 Inventory of Homes for70 Sale$1,250,000 $1,750,000
Days on Market Until Sale
19
+ 11.8%
68
1776
--
--
+ 12.0%
19
98.4%
100.3%
- 2.4%
+ 33.3%
17
150
+ 7.9%
Sea Pines — 19 $715,000 Closed Sales + 11.8% Median Sales Price* Inventory of Homes for Sale 17 2022$662,500 2023 + 7.9% $755,600 $662,500$740,040 - 2.1% $715,000 Median Sales Price* Inventory of Homes for Sale + 7.9%
Closed Sales
Inventory of Homes for Sale
- 38.5%
Year to+Date 3.3%
* Does not account for sale concessions and/or downpayment assistance. | Percent changes are calculated using rounded figures and can sometimes look extreme due to small sample size.
- -38.5% 14.2% Historical Median YearSales to Date Price Rolling 12-Month Calculation
December
Percent Change
Median Sales Inventory of Homes forChange Sale Percent ChangePrice* 2022 Percent 2023 2023 Days on Market Until Sale 70 - 2.4% 68 + 12.0% 69 76 Closed Sales Median Sales Price* Inventory of Homes fo Inventory of Homes for Sale 17 + 11.8% --19 -+ 33.3% 159 - 8.2% 8 146
Historical Sales Price Rolling+ 12-Month Calculation Closed Sales Median 13 8 December + 133.3% 12.5% - 38.5% New Listings
30
$662,500
- 14.2%
$250,000 4-2014 10-2014 4-2015 10-2015 4-2016 10-2016 4-2017 10-2017 4-2018 10-2018 4-2019 10-2019 4-2020 10-2020 4-2021 10-2021 4-2022 10-2022 4-2023 10-2023
+ 33.3%
312023
2022
Percent Change
$1,395,000
19 Sales Price* Median
December
$715,000 + 12.5%
2023 Year to Date
Current as of January 10, 2024. Data | Sponsored by South Carolina REALTORS®. 6 © 2024 REsides, INC. + 33.3% 159 8.2% 8 All Rights Reserved. 146| Report © 2024- ShowingTime.
Closed Sales
+ 133.3%
Condos $500,000 / Villas Only
31
2022
December
$1,625,000
Closed 2022 Sales New Listings 6
8Key Metrics
$1,000,000
ALL MLS 30
$1,395,000
--
2022
$662,500
New 3Listings8
$1,250,000
2022
$250,000 4-2014 10-2014 4-2015 10-2015 4-2016 10-2016 4-2017 10-2017 4-2018 10-2018 4-2019 10-2019 4-2020 10-2020 4-2021 10-2021 4-2022 10-2022 4-2023 10-2023
9
8
Condos/Villas Only + 133.3%
$1,750,000
31--SEA PINES
$750,000
70 + 12.5%
* Does not account for sale concessions and/or downpayment assistance. | Percent changes are calculated using rounded figures and can sometimes look extreme due to small sample size. Current as of January 10, 2024. Data © 2024 REsides, INC. All Rights Reserved. | Sponsored by South Carolina REALTORS®. | Report © 2024 ShowingTime. Key Metrics Rolling 12-Month Calculation All MLS — New Listings Sea Pines —
6
30
$1,000,000
+ 12.0% Condos / Villas Only $500,000 + 3.3% 4-2022 10-2022 4-2023 4-2014 10-2014 4-2015 10-2015 4-2016 10-2016 4-2017 10-2017 4-2018 10-2018 4-2019 10-2019 4-2020 10-202074-2021 10-2021 10-2023
December
--
$1,250,000
3
$250,000 Days on Market Until Sale+ 133.3%
76
68 - 38.5%
New Listings + 11.8%
Closed Sales
+ 7.9%
Median Sales -Price*
--
- 1.9% All MLS — + 12.0% Sea Pines — + 11.8% Inventory of-Homes for Sale
--
* Does not account for sale concessions and/or downpayment assistance. | Percent changes are calculated using rounded figures and can sometimes look extreme due to small sample size. $1,000,000
Historical Median Sales Price Rolling 12-Month Calculation
* Does not account for sale concessions and/or downpayment assistance. | Percent changes are calculated using rounded figures and can sometimes look extreme due to small sample size.
$600,000
-6
* Does not account for sale concessions and/or downpayment assistance. | Percent changes are calculated using rounded figures and can sometimes look extreme due to small sample size.
Closed Sales
$800,000
-1
99.2%
$1,000,000
2022$1,500,000
December 2023
$1,250,000 December
$750,000
$400,000
2022
$750,000
13
$662,500
$500,000 8 6
$200,000
8
$1,000,000
$500,000
Historical Median Sales Price - Rolling 12-Month Calculation
2023 $800,000
$715,000
2022
19
17
$600,000
13
$715,000
$662,500
$400,000
All MLS — Sea Pines —
2023
19
17
$250,000 $250,000 $750,000 4-2014 10-2014 4-2015 10-2015 4-2016 10-2016 4-2017 4-2020 10-2018 10-2020 4-2019 4-202110-2019 10-20214-2020 4-202210-2020 10-2022 4-2023 10-2023 4-2014 10-2014 4-201510-2017 10-20154-2018 4-2016 10-2018 10-2016 4-2019 4-2017 10-2019 10-2017 4-2018 4-2021 10-2021 4-2022 10-2022 4-2023 SEA PINES
8
8
$0 $200,000 4-2014 10-2014 4-2015 10-2015 4-2016 10-2016 4-2017 10-2017 + 33.3% - 38.5% 4-2018 10-2018 4-2019 +10-2019 7.9% 4-2020 10-2020 4-2021 +10-2021 11.8% 4-2022 10-2022 4-2023 10-2023
$500,000 New Listings 6
Closed Sales
Median Sales Price*
ALL MLS
Inventory of Homes for Sale
$0 4-2014 10-2014 4-2015 10-2015 4-2016 10-2016 4-2017 10-2017 4-2018 10-2018 4-2019 10-2019 4-2020 10-2020 4-2021 10-2021 4-2022 10-2022 4-2023 10-2023
Current as| of January 2024.Reserved. Data © 2024 REsides, INC. Rights Reserved. | Sponsored| by South©Carolina REALTORS®. as Reserved. of January 10, 2024. Data © 2024 REsides, INC. All10, Rights | Sponsored byAll South Carolina REALTORS®. Report 2024 ShowingTime. Current as of January 10, 2024. Data © 2024 REsides,Current INC. All Rights | Sponsored by South Carolina REALTORS®. Report © 2024 ShowingTime.
$250,000 Historical Median Sales Price Rolling 12-Month Calculation
All MLS — 4-2014 10-2014 4-2015 10-2015 4-2016 10-2016 4-2017 10-2017 4-2018 10-2018 4-2019 10-2019 4-2020 10-2020 4-2021 10-2021 4-2022 10-2022 4-2023 10-2023 Sea Pines —
Information Sponsored by
$800,000
$600,000
+ 33.3%
New Listings $400,000
$200,000
12
Current as of January 10, 2024. Data © 2024 REsides, INC. All Rights Reserved. | Sponsored by South Carolina REALTORS®. | Report © 2024 ShowingTime.
Lindsay Bunting & Charlie Wilmot
- 38.5%
+ 7.9%
+ 11.8%
Closed Sales
Median Sales Price*
Inventory of Homes for Sale
Current as of January 10, 2024. Data © 2024 REsides, INC. All Rights Reserved. | Sponsored by South Carolina REALTORS®. | Report © 2024 ShowingTime.
Lindsay lindsay@lindsaybunting.com Historical Median Sales Price– 843.816.6142 Rolling 12-Month Calculation Charlie – 843.816.6133 charlie@lindsaybunting.com
$0 4-2014 10-2014 4-2015 10-2015 4-2016 10-2016 4-2017 10-2017 4-2018 10-2018 4-2019 10-2019 4-2020 10-2020 4-2021 10-2021 4-2022 10-2022 4-2023 10-2023
$800,000
| Report © 2024 S
Current as of January 10, 2024. Data © 2024 REsides, INC. All Rights Reserved. | Sponsored by South Carolina REALTORS®. | Report © 2024 ShowingTime.
Lindsay – 843.816.6142 rltr2mom@aol.com
All MLS — Sea Pines —