

&Real Estate © 2023 MEDIA SOLUTIONS 360, LLC HiltonHead360.com LowCountryHome.com 866.462.1497 LOWCOUNTRY LIVING A Quarterly Market Report for Hilton Head, Bluffton, Beaufort County & Jasper County MAY 2023 THE REPORT Real Estate Activity for Individual Communities Vacation Rental Report Real Estate Opportunities IN THIS ISSUE
TOM TOLPA

BARBARA BYRD

tomtolpa@theoceanbroker.com
843.384.8252
barbarabyrdh@aol.com
843.304.2530
markdevers@theoceanbroker.com
markdevers@theoceanbroker.com

843.384.2888

SPECIALIZING IN HILTON HEAD OCEANFRONT PROPERTY SINCE 1974


MAIN OFFICE: 843.785.7215 www. theoceanbroker. com
MAIN OFFICE: 843.785.7215 www. theoceanbroker. com
MAIN OFFICE: 843.785.7215 www. theoceanbroker. com
SEA PINES OCEANSIDE LOT

This property has been a family legacy for 60+ years and is now on the market. 3rd/4th row ocean on a private beach path with access to adjacent Atlantic Pointe amenities including community pool, tennis/pickleball, cabana and a private gated beach walkway. 3 minute stroll to the ocean. Lot size: 105’ x 110’. Bush-hogged with corners flagged for easy viewing. Complete boundary/tree/topo/elevation available. This unique offering will sell quickly. MLS #432934 $1,750,000 CALL MARK
SEA PINES OCEANSIDE LOT This property has been a family legacy for 60+ years and is now on the market. 3rd/4th row ocean on a private beach path with access to adjacent Atlantic Pointe amenities including community pool, tennis/pickleball, cabana and a private gated beach walkway. 3 minute stroll to the ocean. Lot size: 105’ x 110’. Bush-hogged with corners flagged for easy viewing. Complete boundary/tree/topo/elevation available. This unique offering will sell quickly. MLS #432934 $1,750,000 CALL MARK
SEA PINES OCEANSIDE LOT This property has been a family legacy for 60+ years and is now on the market. 3rd/4th row ocean on a private beach path with access to adjacent Atlantic Pointe amenities including community pool, tennis/pickleball, cabana and a private gated beach walkway. 3 minute stroll to the ocean. Lot size: 105’ x 110’. Bush-hogged with corners flagged for easy viewing. Complete boundary/tree/topo/elevation available. This unique offering will sell quickly. MLS #432934 $1,750,000 CALL MARK
SEA PINES MARSH VIEW HOME 9th row, 5 bed/5.5 bath home in Sea Pines. All bedrooms are en suite. Pool/spa overlooking the marsh with a spacious outdoor entertaining patio that includes a fireplace & large grilling area. Soaring ceilings in the main living area that get plenty of natural light. Owners built the house in 2006 and have never rented it.
SEA PINES MARSH VIEW HOME 9th row, 5 bed/5.5 bath home in Sea Pines. All bedrooms are en suite. Pool/spa overlooking the marsh with a spacious outdoor entertaining patio that includes a fireplace & large grilling area. Soaring ceilings in the main living area that get plenty of natural light. Owners built the house in 2006 and have never rented it.
SEA PINES MARSH VIEW HOME 9th row, 5 bed/5.5 bath home in Sea Pines. All bedrooms are en suite. Pool/spa overlooking the marsh with a spacious outdoor entertaining patio that includes a fireplace & large grilling area. Soaring ceilings in the main living area that get plenty of natural light. Owners built the house in 2006 and have never rented it.
MLS #430499 $3,399,000 CALL MARK
SEA PINES VACANT LOT Rarely available lot near the beach. Almost a third of an acre. 15-20 minute walk to the beach. Private location, sits at the end of the street with no through traffic.
SEA PINES VACANT LOT Rarely available lot near the beach. Almost a third of an acre. 15-20 minute walk to the beach. Private location, sits at the end of the street with no through traffic.

MLS #433231 $949,000 CALL MARK
MLS #433231 $949,000 CALL MARK
MLS #430499 $3,399,000 CALL MARK
MLS #430499 $3,399,000 CALL MARK
THEOCEANBROKERHHI ® Registered Trademark US Patent Office, Washington, DC ©2023 The Ocean Broker FOLLOW US
THEOCEANBROKERHHI ® Registered Trademark US Patent Office, Washington, DC ©2023 The Ocean Broker
FOLLOW US
THEOCEANBROKERHHI ® Registered Trademark US Patent Office, Washington, DC ©2023 The Ocean Broker
DEVERS
MARK
FOLLOW US A $BILLION IN SALES
40 BATTERY ROAD
3 GULL POINT OFFERING! FIRST
15 SURF SCOTER
TIME
SEA PINES VACANT LOT Rarely available lot near the beach. Almost a third of an acre. 15-20 minute walk to the beach. Private location, sits at the end of the street with no through traffic.
MLS #433231 $949,000 CALL MARK


LOOKING FOR A NEW HOME? CALL US TODAY! We Know the Lowcountry FEATURED LISTINGS BY THE LOWCOUNTRY SPECIALISTS INFO@LOWCOUNTRYSPECIALISTS.COM LOWCOUNTRYSPECIALISTS.COM ANN WALTON | 248.342.7878 AnnWalton@CharterOneRealty.com MARY AIANA | 843.368.7779 Mary@CharterOneRealty.com RICH REED | 843.368.3040 RichReed@CharterOneRealty.com SANDIE MAJOR | 843.388.2821 Sandie@CharterOneRealty.com COURTNEY ADAMS | 843.949.9085 CourtneyAdams@CharterOneRealty.com LOOKING FOR A NEW HOME? CALL US TODAY! We Know the Lowcountry FEATURED LISTINGS BY THE LOWCOUNTRY SPECIALISTS 26 BAINBRIDGE WAY 4 BD | 3.5 BA | LIST PRICE: $735,000 BAYNARD PARK 7 REFLECTION POINT 4 BD | 3.5 BA | LIST PRICE: $1,500,000 HAMPTON LAKE 14 ISLAND CREEK DRIVE 3 BD | 3.5 BA | LIST PRICE: $1,269,000 CALLAWASSIE ISLAND 304 GOOD HOPE ROAD 5 BD | 5.5 BA | LIST PRICE: $2,095,000 BERKELEY HALL INFO@LOWCOUNTRYSPECIALISTS.COM LOWCOUNTRYSPECIALISTS.COM UNDER CONTRACT! 32 MOORING BUOY 4 BD | 4 BA | LIST PRICE: $2,325,000 PALMETTO DUNES 3RD ROW OCEAN! 243 GOOD HOPE ROAD 5 BD | 4.5 BA | LIST PRICE: $2,050,000 JUST LISTED! BERKELEY HALL UNDER CONTRACT! UNDER CONTRACT! ANN WALTON | 248.342.7878 AnnWalton@CharterOneRealty.com MARY AIANA | 843.368.7779 Mary@CharterOneRealty.com RICH REED | 843.368.3040 RichReed@CharterOneRealty.com SANDIE MAJOR | 843.388.2821 Sandie@CharterOneRealty.com COURTNEY ADAMS | 843.949.9085 CourtneyAdams@CharterOneRealty.com LLRE Full Page - MAY 2023 - Lowcountry Specialists.indd 1
Real Estate Market


Local Market Update – March 2023
Local Market Update – March 2023
Report Wexford | March 2023
Local Market Update – March 2023
Local Market Update – March 2023
Detached Homes Only
Wexford
March Year to Date
4-201410-20144-201510-20154-201610-20164-201710-20174-201810-20184-201910-20194-202010-20204-202110-20214-202210-2022
Local Market Update – March 2023 Key Metrics 20222023 Percent Change 20222023 Percent Change New Listings 4 3 - 25.0% 5 7 + 40.0% Closed Sales 1 2 + 100.0%5 4 - 20.0% Median Sales Price* $955,000 $2,075,000 + 117.3%$2,200,000 $2,337,500 + 6.3% Percent of List Price Received* 95.5% 105.8% + 10.8%98.7% 99.5% + 0.8% Days on Market Until Sale 150 145 - 3.3%138 150 + 8.7% Inventory of Homes for Sale 1 5 + 400.0%-A Research Tool Provided by REsides, Inc. and the Hilton Head Area Association of REALTORS® Wexford
* Does not account for sale concessions and/or downpayment assistance. | Percent changes are calculated using rounded figures and can sometimes look extreme due to small sample size. March All MLS — Wexford — Current as of April 24, 2023. Data © 2023 REsides, INC. All Rights Reserved. | Sponsored by South Carolina REALTORS®. | Report © 2023 ShowingTime. 4 1 3 2 New Listings Closed Sales $500,000 $1,000,000 $1,500,000 $2,000,000 $2,500,000 4-201410-20144-201510-20154-201610-20164-201710-20174-201810-20184-201910-20194-202010-20204-202110-20214-202210-2022 Historical Median Sales Price Rolling 12-Month Calculation $955,000 $2,075,000 Median Sales Price* 1 5 Inventory of Homes for Sale 2022 2023 -25.0% + 100.0% + 117.3% + 400.0%
Key Metrics 20222023 Percent Change 20222023 New Listings 4 3 - 25.0% 5 7 Closed Sales 1 2 + 100.0%5 4 Median Sales Price* $955,000 $2,075,000 + 117.3%$2,200,000 $2,337,500 Percent of List Price Received* 95.5% 105.8% + 10.8%98.7% 99.5% Days on Market Until Sale 150 145 - 3.3%138 150 Inventory of Homes for Sale 1 5 + 400.0%-A Research Tool Provided by REsides, Inc. and the Hilton Head Area Association of REALTORS® Wexford March Year to Date * Does not account for sale concessions and/or downpayment assistance. | Percent changes are calculated using rounded figures and can sometimes look extreme due to small sample size. March Wexford Current as of April 24, 2023. Data © 2023 REsides, INC. All Rights Reserved. | Sponsored by South Carolina REALTORS®. | Report © 4 1 3 2 New Listings Closed Sales $0 $500,000 $1,000,000 $1,500,000 $2,000,000 $2,500,000 4-201410-20144-201510-20154-201610-20164-201710-20174-201810-20184-201910-20194-202010-20204-202110-20214-202210-2022 Historical Median Sales Price Rolling 12-Month Calculation $955,000 $2,075,000 Median Sales Price* 1 Inventory of Homes 2022 -25.0% + 100.0% + 117.3% + 400.0%
Key Metrics 20222023 Percent Change 20222023 Percent Change New Listings 4 3 - 25.0% 5 7 + 40.0% Closed Sales 1 2 + 100.0%5 4 - 20.0% Median Sales Price* $955,000 $2,075,000 + 117.3%$2,200,000 $2,337,500 + 6.3% Percent of List Price Received* 95.5% 105.8% + 10.8%98.7% 99.5% + 0.8% Days on Market Until Sale 150 145 - 3.3%138 150 + 8.7% Inventory of Homes for Sale 1 5 + 400.0%-- -A Research Tool Provided by REsides, Inc. and the Hilton Head Area Association of REALTORS®
March Year to Date * Does not account for sale concessions and/or downpayment assistance. | Percent changes are calculated using rounded figures and can sometimes look extreme due to small sample size. March All MLS — Wexford — Current as of April 24, 2023. Data © 2023 REsides, INC. All Rights Reserved. | Sponsored by South Carolina REALTORS®. | Report © 2023 ShowingTime. 4 1 3 2 New Listings Closed Sales $0 $500,000 $1,000,000 $1,500,000 $2,000,000 $2,500,000 4-201410-20144-201510-20154-201610-20164-201710-20174-201810-20184-201910-20194-202010-20204-202110-20214-202210-2022 Historical Median Sales Price Rolling 12-Month Calculation $955,000 $2,075,000 Median Sales Price* 1 5 Inventory of Homes for Sale 2022 2023 -25.0% + 100.0% + 117.3% + 400.0%
Wexford
Key Metrics 20222023 Percent Change 20222023 Percent Change New Listings 4 3 - 25.0% 5 7 + 40.0% Closed Sales 1 2 + 100.0%5 4 - 20.0% Median Sales Price* $955,000 $2,075,000 + 117.3%$2,200,000 $2,337,500 + 6.3% Percent of List Price Received* 95.5% 105.8% + 10.8%98.7% 99.5% + 0.8% Days on Market Until Sale 150 145 - 3.3%138 150 + 8.7% Inventory of Homes for Sale 1 5 + 400.0%-A Research Tool Provided by REsides, Inc. and the Hilton Head Area Association of REALTORS®
March
* Does not account for sale concessions and/or downpayment assistance. Percent changes are calculated using rounded figures and can sometimes look extreme due to small sample size. March All MLS — Wexford — Current as of April 24, 2023. Data © 2023 REsides, INC. All Rights Reserved. | Sponsored by South Carolina REALTORS®. Report © 2023 ShowingTime. 4 1 3 2 New Listings Closed Sales $0 $500,000 $1,000,000 $1,500,000 $2,000,000 $2,500,000
Year to Date
Historical Median Sales Price Rolling 12-Month Calculation $955,000 $2,075,000 Median Sales Price* 1 5 Inventory of Homes for Sale 2022 2023 -25.0% + 100.0% + 117.3% + 400.0%
Key Metrics 20222023 Percent Change 20222023 Percent Change New Listings 4 3 - 25.0% 5 7 + 40.0% Closed Sales 1 2 + 100.0%5 4 - 20.0% Median Sales Price* $955,000 $2,075,000 + 117.3%$2,200,000 $2,337,500 + 6.3% Percent of List Price Received* 95.5% 105.8% + 10.8%98.7% 99.5% + 0.8% Days on Market Until Sale 150 145 - 3.3%138 150 + 8.7% Inventory of Homes for Sale 1 5 + 400.0%-A Research Tool Provided by REsides, Inc. and the Hilton Head Area Association of REALTORS®
March Year to Date * Does not account for sale concessions and/or downpayment assistance. Percent changes are calculated using rounded figures and can sometimes look extreme due to small sample size. March All MLS — Wexford — Current as of April 24, 2023. Data © 2023 REsides, INC. All Rights Reserved. Sponsored by South Carolina REALTORS®. | Report © 2023 ShowingTime. 4 1 3 2 New Listings Closed Sales $0 $500,000 $1,000,000 $1,500,000 $2,000,000 $2,500,000
Historical Median Sales Price Rolling 12-Month Calculation $955,000 $2,075,000 Median Sales Price* 1 5 Inventory of Homes for Sale 2022 2023 -25.0% + 100.0% + 117.3% + 400.0% Key Metrics 20222023 Percent Change 20222023 Percent Change New Listings 4 3 - 25.0% 5 7 + 40.0% Closed Sales 1 2 + 100.0%5 4 - 20.0% Median Sales Price* $955,000 $2,075,000 + 117.3%$2,200,000 $2,337,500 + 6.3% Percent of List Price Received* 95.5% 105.8% + 10.8%98.7% 99.5% + 0.8% Days on Market Until Sale 150 145 - 3.3%138 150 + 8.7% Inventory of Homes for Sale 1 5 + 400.0%-A Research Tool Provided by REsides, Inc. and the Hilton Head Area Association of REALTORS® Wexford
* Does not account for sale concessions and/or downpayment assistance. Percent changes are calculated using rounded figures and can sometimes look extreme due to small sample size. March All MLS — Wexford — Current as of April 24, 2023. Data © 2023 REsides, INC. All Rights Reserved. | Sponsored by South Carolina REALTORS®. | Report © 2023 ShowingTime. 4 1 3 2 New Listings Closed Sales $0 $500,000 $1,000,000 $1,500,000 $2,000,000 $2,500,000 4-201410-20144-201510-20154-201610-20164-201710-20174-201810-20184-201910-20194-202010-20204-202110-20214-202210-2022 Historical Median Sales Price Rolling 12-Month Calculation $955,000 $2,075,000 Median Sales Price* 1 5 Inventory of Homes for Sale 2022 2023 -25.0% + 100.0% + 117.3% + 400.0% Historical Median Sales Price - Rolling 12-Month Calculation 2022 2023 Wexford Real Estate Market Report Information Sponsored by Steve Timperman 843-384-8988 Steve@CharterOneRealty.com www.SteveTimperman.com WEXFORD ALL MLS A Research Tool Provided by REsides and the Hilton Head Area Association of REALTORS® 4
Wexford
4-201410-20144-201510-20154-201610-20164-201710-20174-201810-20184-201910-20194-202010-20204-202110-20214-202210-2022
March Year to Date
Felice LaMarca your source for


exceptional homes


(843) 384-6702
Easy walk to the beach or golf from this desirable Sea Pines location!


Quality & total reconstruction in 2004. More upgrades in 2020. High end woodwork, cabinets & stone. Open floorplan w/lots of windows. Beautiful long fairway views of Heron Point #17. Best position & location on the golf course. Sit on your new covered patio & enjoy always an ocean breeze or a dip in the heated pool. Easy path to the beach or golf or dining, makes this location extremely desirable. Sitting room off the master bedroom where you can read, relax or nap. 4th bedroom over the garage. All guest bedrooms have private baths. Entertain your dinner guests on your baby grand piano. Comfortable, furnished & turnkey! Sold furnished@$2,195,000.

The nicest villa in Broad Creek Landing on the South end!

Beautifully renovated 2 bedroom 2 bath Forest Cove villa on the south end of the island. Pleasant wooded views for privacy. Close to shopping, dining & the Beach! Windows replaced, bathrooms updated, smooth ceilings, bamboo floors. You will love the updated Kitchen w/ expansion of the cabinets & granite counters gives you better function & serving. Complex has pools, tennis & lovely grounds for walking or biking. Priced@ $289,000 furnished.
They Want an Exceptional Home Too!
Adopt Today – Palmetto Animal League, 843-645-1725 www.FeliceLaMarca.com

Felice@FeliceLaMarca.com Felice
LaMarca Broker Associate
CONTRACT
UNDER
UNDER CONTRACT
Jean Beck Chief Executive Officer Market Overview


03-202203-2023 Percent Change YTD 2022YTD 2023 Percent Change Closed Sales 561 456 - 18.7%1,397 1,043 - 25.3% Key market metrics for the current month and year-to-date figures. New Listings 804 652 - 18.9% 1,571 - 14.3% Pending Sales 664 536 - 19.3%1,680 1,423 - 15.3% 1,834 Historical Sparkbars - 2.1% Average Sales Price $681,005 $677,888 - 0.5%$675,503 $684,015 + 42.9% Median Sales Price $470,000 $504,000 + 7.2%$465,000 $495,808 + 6.6% Days on Market 102 148 + 45.1%105 150 - 22.7% Inventory of Homes for Sale 541 919 + 69.9%-Housing Affordability Index 87 67 - 23.0%88 68 Months Supply of Inventory - 2.4%100.1% 98.0% Current as of April 24, 2023. Data © 2023 REsides, INC. All Rights Reserved. Sponsored by South Carolina REALTORS®. Report © 2023 ShowingTime. 2 Key Metrics 1.0 2.0 + 100.0%-+ 1.3% Pct. of List Price Received 100.8% 98.4% 3-2021 3-2022 3-2023 3-2021 3-2022 3-2023 3-2021 3-2022 3-2023 3-2021 3-2022 3-2023 3-2021 3-2022 3-2023 3-2021 3-2022 3-2023 3-2021 3-2022 3-2023 3-2021 3-2022 3-2023 3-2021 3-2022 3-2023 3-2021 3-2022 3-2023 March Market Overview


Top Dawg Tavern

(843)-785-5600
www.topdawgtavern.com


13 Harbourside Lane in Shelter Cove
The SandBar

(843)-342-7263
101 Pope Avenue www.sandbarhhi.com
Salty Dog Cafe

(843)-671-2233
South Beach Marina Village
Big Bamboo Big Bamboo

(843)-686-3443 Coligny Plaza


Carolina Coffee & Crumbs

(843)-342-4800 101 Pope Avenue
HIckory Tavern


(843) 802-0010
44 Shelter Cove Lane Hilton Head Island
Hilton Head 44 Shelter Cove Ln Hilton Head Island, SC 29928 843-802-0010

New York City Pizza

(843)-842-2227
Festival Centre: 45 Pembroke Dr, Ste 105 Heritage Plaza: 81 Pope Avenue

Slapfish

(843) 521-5830 1
024 William Hilton Pkwy., HHI www.slapfishrestaurant.com

Taste of Europe
(843)-715-2691
Pockets Full of Sunshine- Making the Lowcountry a sunnier place by providing inclusive social & vocational opportunities for adults with disabilities

Follow on Instagram & pocketsfullofsun.org

Taste of Europe


435 William Hilton Pkwy, Ste O Northridge Shopping Ctr
Local Pie

Bluffton: 15 State of Mind St.
HHI: 55 New Orleans Rd. #106 www.localpie.com


Red Stripes

(843)-715-8008
840 Williams Hilton Pwky


843-715-8008
8 Pin Oak St. Bluffton (843)757-8111
1 North Forest Beach, HHI
Olive & Fig
(843)-707-1934
1533 Fording Island Rd. Moss Creek Village
contents 4 Wexford Market Report 6 Hilton Head Realtors Association March Market Overview 8 A Sampling of Restaurants from our Hilton Head 360 Map 10 Palmetto Dunes Market Report 17 Port Royal Market Report 20 Vacation Rental Report 26 Sea Pines Market Report 30 Inside Lowcountry Living & Real Estate Magazine 31 Hilton Head Plantation Market Report 32 Indigo Run Market Report 34 Windmill Harbour Market Report 35 Colleton River Market Report 38 Moss Creek Market Report Published by local owners Dan Monroe and Deborah Monroe. PO Box 5850 Hilton Head, SC 843-785-7272 HiltonHead360 8 &Real Estate LOWCOUNTRY LIVING A Quarterly Market Report for Hilton Head, Bluffton, Beaufort County & Jasper County THE REPORT
to Wall TV’s Family Friendly Weekly Specials Full Bar Patio Seating Ad for Bring in this
to check out our local Events & Specials! Off $5 $25
Wall
• purchase a home, villa or condo


• use it as income producing property
• use it for family and friends vacations
DEEP WATER LOT
8.42 acres
230 feet of deep-water frontage

• it becomes your retirement haven
DEEP WATER LUXURY LIVING. Set on 8.420 acres of blissful Lowcountry scenery with 3 acres of building site and 230 feet of waterfront, this pristine deep-water estate sized lot dazzles with natural serenity and sparkling Beaufort River views. Ringed by conservation easement in a tract of just five lots, this lot represents a unique opportunity to establish a family legacy on unspoiled waterfront land just minutes from downtown Beaufort.


COLLEEN
KATIE DYER ADMINISTRATIVE ASSISTANT 843.949.9178
SULLIVAN ASSOCIATE BROKER 843.338.1708
Local Market Update – March 2023
Local Market Update – March 2023
Palmetto Dunes | March 2023 Local Market Update – March 2023


Real Estate Market Report

Local Market Update – March 2023

Key Metrics 20222023 Percent Change 20222023 Percent New Listings 4 7 + 75.0%15 14 Closed Sales 6 8 + 33.3%24 10 Median Sales Price* $2,197,500 $1,937,500 - 11.8%$2,015,000 $2,050,000 Percent of List Price Received* 99.4% 95.9% - 3.5%98.4% 95.8% Days on Market Until Sale 104 105 + 0.9%115 101 Inventory of Homes for Sale 6 10 + 66.7%-* Does not account for sale concessions and/or downpayment assistance. | Percent changes are calculated using rounded figures and can sometimes look extreme due to small sample size. March All Palmetto Dunes Current as of April 24, 2023. Data © 2023 REsides, INC. All Rights Reserved. | Sponsored by South Carolina REALTORS®. | Report © 2023 A Research Tool Provided by REsides, Inc. and the Hilton Head Area Association of REALTORS® Palmetto Dunes Detached Homes Only March Year to Date 4 6 7 8 New Listings Closed Sales $250,000 $500,000 $750,000 $1,000,000 $1,250,000 $1,500,000 $1,750,000 4-201410-20144-201510-20154-201610-20164-201710-20174-201810-20184-201910-20194-202010-20204-202110-20214-202210-2022 Historical Median Sales Price Rolling 12-Month Calculation $2,197,500 $1,937,500 Median Sales Price* 6 Inventory of Homes 2022 + 75.0% + 33.3% -11.8% + 66.7%
Key Metrics 20222023 Percent Change 20222023 Percent Change New Listings 4 7 + 75.0%15 14 - 6.7% Closed Sales 6 8 + 33.3%24 10 - 58.3% Median Sales Price* $2,197,500 $1,937,500 - 11.8%$2,015,000 $2,050,000 + 1.7% Percent of List Price Received* 99.4% 95.9% - 3.5%98.4% Days on Market Until Sale 104 105 + 0.9%115 Inventory of Homes for Sale 6 10 + 66.7%-* Does not account for sale concessions and/or downpayment assistance. | Percent changes are calculated using rounded figures and can sometimes look extreme due to small sample size. March All MLS — Palmetto Dunes — Current as of April 24, 2023. Data © 2023 REsides, INC. All Rights Reserved. Sponsored by South Carolina REALTORS®. | Report © 2023 ShowingTime. A Research Tool Provided by REsides, Inc. and the Hilton Head Area Association of REALTORS®
Dunes Detached Homes Only March Year to Date 4 6 7 8 New Listings Closed Sales $250,000 $500,000 $750,000 $1,000,000 $1,250,000 $1,500,000 $1,750,000 4-201410-20144-201510-20154-201610-20164-201710-20174-201810-20184-201910-20194-202010-20204-202110-20214-202210-2022 Historical Median Sales Price Rolling 12-Month Calculation $2,197,500 $1,937,500 Median Sales Price* 6 10 Inventory of Homes for Sale 2022 2023 + 75.0% + 33.3% -11.8% + 66.7% Local Market Update – March 2023 Key Metrics 20222023 Percent Change 20222023 Percent Change New Listings 4 7 + 75.0%15 14 - 6.7% Closed Sales + 33.3%24 10 - 58.3% Median Sales Price* $2,197,500 $1,937,500 - 11.8%$2,015,000 $2,050,000 + 1.7% Percent of List Price Received* 99.4% 95.9% - 3.5%98.4% 95.8% - 2.7% Days on Market Until Sale 104 105 + 0.9%115 101 - 12.5% Inventory of Homes for Sale 6 10 + 66.7%-* Does not account for sale concessions and/or downpayment assistance. | Percent changes are calculated using rounded figures and can sometimes look extreme due to small sample size. March All MLS — Palmetto Dunes — Current as of April 24, 2023. Data © 2023 REsides, INC. All Rights Reserved. | Sponsored by South Carolina REALTORS®. | Report © 2023 ShowingTime. A Research Tool Provided by REsides, Inc. and the Hilton Head Area Association of REALTORS® Palmetto Dunes Detached Homes Only March Year to Date 4 6 7 8 New Listings Closed Sales $250,000 $500,000 $750,000 $1,000,000 $1,250,000 $1,500,000 $1,750,000 4-201410-20144-201510-20154-201610-20164-201710-20174-201810-20184-201910-20194-202010-20204-202110-20214-202210-2022 Historical Median Sales Price Rolling 12-Month Calculation $2,197,500 $1,937,500 Median Sales Price* 6 10 Inventory of Homes for Sale + 75.0% + 33.3% -11.8% + 66.7% Detached Homes Only Local Market Update – March 2023 Key Metrics 20222023 Percent Change 20222023 Percent Change New Listings 4 7 + 75.0%15 14 - 6.7% Closed Sales 6 8 + 33.3%24 10 - 58.3% Median Sales Price* $2,197,500 $1,937,500 - 11.8%$2,015,000 $2,050,000 + 1.7% Percent of List Price Received* 99.4% 95.9% - 3.5%98.4% 95.8% - 2.7% Days on Market Until Sale 104 105 + 0.9%115 101 - 12.5% Inventory of Homes for Sale 6 10 + 66.7%-* Does not account for sale concessions and/or downpayment assistance. Percent changes are calculated using rounded figures and can sometimes look extreme due to small sample size. March All MLS — Palmetto Dunes — Current as of April 24, 2023. Data © 2023 REsides, INC. All Rights Reserved. Sponsored by South Carolina REALTORS®. Report © 2023 ShowingTime. A Research Tool Provided by REsides, Inc. and the Hilton Head Area Association of REALTORS® Palmetto Dunes Detached Homes Only March 4 6 7 8 New Listings Closed Sales $250,000 $500,000 $750,000 $1,000,000 $1,250,000 $1,500,000 $1,750,000 4-201410-20144-201510-20154-201610-20164-201710-20174-201810-20184-201910-20194-202010-20204-202110-20214-202210-2022 Historical Median Sales Price Rolling 12-Month Calculation $2,197,500 $1,937,500 Median Sales Price* 6 10 Inventory of Homes for Sale 2022 2023 + 75.0% + 33.3% -11.8% + 66.7%
Palmetto
Key Metrics 20222023 Percent Change 20222023 Percent Change New Listings 4 7 + 75.0%15 14 - 6.7% Closed Sales 6 8 + 33.3%24 10 - 58.3% Median Sales Price* $2,197,500 $1,937,500 - 11.8%$2,015,000 $2,050,000 + 1.7% Percent of List Price Received* 99.4% 95.9% - 3.5%98.4% 95.8% - 2.7% Days on Market Until Sale 104 105 + 0.9%115 101 - 12.5% Inventory of Homes for Sale 6 10 + 66.7%-* Does not account for sale concessions and/or downpayment assistance. Percent changes are calculated using rounded figures and can sometimes look extreme due to small sample size. All MLS — Palmetto Dunes — Current as of April 24, 2023. Data © 2023 REsides, INC. All Rights Reserved. Sponsored by South Carolina REALTORS®. Report © 2023 ShowingTime. A Research Tool Provided by REsides, Inc. and the Hilton Head Area Association of REALTORS®
Dunes Detached Homes Only March Year to Date 4 6 7 8 New Listings Closed Sales $250,000 $500,000 $750,000 $1,000,000 $1,250,000 $1,500,000 $1,750,000 4-201410-20144-201510-20154-201610-20164-201710-20174-201810-20184-201910-20194-202010-20204-202110-20214-202210-2022 Historical Median Sales Price Rolling 12-Month Calculation $2,197,500 $1,937,500 Median Sales Price* 6 10 Inventory of Homes for Sale 2022 2023 + 75.0% + 33.3% -11.8% + 66.7% Key Metrics 20222023 Percent Change 20222023 Percent Change New Listings 4 7 + 75.0%15 14 - 6.7% Closed Sales 6 8 + 33.3%24 10 - 58.3% Median Sales Price* $2,197,500 $1,937,500 - 11.8%$2,015,000 $2,050,000 + 1.7% Percent of List Price Received* 99.4% 95.9% - 3.5%98.4% 95.8% - 2.7% Days on Market Until Sale 104 105 + 0.9%115 101 - 12.5% Inventory of Homes for Sale 6 10 + 66.7%-* Does not account for sale concessions and/or downpayment assistance. Percent changes are calculated using rounded figures and can sometimes look extreme due to small sample size. March All MLS — Palmetto Dunes — Current as of April 24, 2023. Data © 2023 REsides, INC. All Rights Reserved. | Sponsored by South Carolina REALTORS®. | Report © 2023 ShowingTime. 4 6 7 8 New Listings Closed Sales $250,000 $500,000 $750,000 $1,000,000 $1,250,000 $1,500,000 $1,750,000 4-201410-20144-201510-20154-201610-20164-201710-20174-201810-20184-201910-20194-202010-20204-202110-20214-202210-2022 Historical Median Sales Price Rolling 12-Month Calculation $2,197,500 $1,937,500 Median Sales Price* 6 10 Inventory of Homes for Sale 2022 2023 + 75.0% + 33.3% -11.8% + 66.7% Historical Median Sales Price - Rolling 12-Month Calculation 2022 2023 Local Market Update – March 2023 Key Metrics 20222023 Percent Change 20222023 Percent Change New Listings 26 18 - 30.8%67 50 - 25.4% Closed Sales 22 20 - 9.1% 52 43 - 17.3% Median Sales Price* $667,000 $724,000 + 8.5%$694,500 $718,000 + 3.4% Percent of List Price Received* 102.7% 97.1% - 5.5%101.7% 96.5% - 5.1% Days on Market Until Sale 49 117 + 136.6%78 118 + 51.8% Inventory of Homes for Sale 10 24 + 140.0%-* Does not account for sale concessions and/or downpayment assistance. | Percent changes are calculated using rounded figures and can sometimes look extreme due to small sample size. March All MLS — Palmetto Dunes — A Research Tool Provided by REsides, Inc. and the Hilton Head Area Association of REALTORS® Palmetto Dunes Condos / Villas Only March Year to Date 26 22 18 20 Closed Sales $800,000 Historical Median Sales Price Rolling 12-Month Calculation $667,000 $724,000 Median Sales Price* 10 24 Inventory of Homes for Sale 2022 2023 -9.1% + 8.5% + 140.0% Condos/Villas Only Local Market Update – March 2023 Key Metrics 20222023 Percent Change 20222023 Percent Change New Listings 26 18 - 30.8%67 50 - 25.4% Closed Sales 22 20 - 9.1% 52 43 - 17.3% Median Sales Price* $667,000 $724,000 + 8.5%$694,500 $718,000 + 3.4% Percent of List Price Received* 102.7% 97.1% - 5.5%101.7% 96.5% - 5.1% Days on Market Until Sale 49 117 + 136.6%78 118 + 51.8% Inventory of Homes for Sale 10 24 + 140.0%-Does not account for sale concessions and/or downpayment assistance. Percent changes are calculated using rounded figures and can sometimes look extreme due to small sample size. March All MLS — Palmetto Dunes — Current as of April 24, 2023. Data © 2023 REsides, INC. All Rights Reserved. Sponsored by South Carolina REALTORS®. Report © 2023 ShowingTime. A Research Tool Provided by REsides, Inc. and the Hilton Head Area Association of REALTORS® Palmetto Dunes Condos / Villas Only March Year to Date 26 22 18 20 New Listings Closed Sales $0 $200,000 $400,000 $600,000 $800,000 4-201410-20144-201510-20154-201610-20164-201710-20174-201810-20184-201910-20194-202010-20204-202110-20214-202210-2022 Historical Median Sales Price Rolling 12-Month Calculation $667,000 $724,000 Median Sales Price* 10 24 Inventory of Homes for Sale 2022 2023 -30.8% -9.1% + 8.5% + 140.0% Local Market Update – March 2023 Key Metrics 20222023 Percent Change 20222023 Percent Change New Listings 26 18 - 30.8%67 50 - 25.4% Closed Sales 22 20 - 9.1% 52 43 - 17.3% Median Sales Price* $667,000 $724,000 + 8.5%$694,500 $718,000 + 3.4% Percent of List Price Received* 102.7% 97.1% - 5.5%101.7% 96.5% - 5.1% Days on Market Until Sale 49 117 + 136.6%78 118 + 51.8% Inventory of Homes for Sale 10 24 + 140.0%-* Does not account for sale concessions and/or downpayment assistance. Percent changes are calculated using rounded figures and can sometimes look extreme due to small sample size. March All MLS — Palmetto Dunes — Current as of April 24, 2023. Data © 2023 REsides, INC. All Rights Reserved. Sponsored by South Carolina REALTORS®. Report © 2023 ShowingTime. A Research Tool Provided by REsides, Inc. and the Hilton Head Area Association of REALTORS® Palmetto Dunes Condos / Villas Only March Year to Date 26 22 18 20 New Listings Closed Sales $0 $200,000 $400,000 $600,000 $800,000 4-201410-20144-201510-20154-201610-20164-201710-20174-201810-20184-201910-20194-202010-20204-202110-20214-202210-2022 Historical Median Sales Price Rolling 12-Month Calculation $667,000 $724,000 Median Sales Price* 10 24 Inventory of Homes for Sale 2022 2023 -30.8% -9.1% + 8.5% + 140.0%
Palmetto
Key Metrics 20222023 Percent Change 20222023 Percent Change New Listings 26 18 - 30.8%67 50 - 25.4% Closed Sales 22 20 - 9.1% 52 43 - 17.3% Median Sales Price* $667,000 $724,000 + 8.5%$694,500 $718,000 + 3.4% Percent of List Price Received* 102.7% 97.1% - 5.5%101.7% 96.5% - 5.1% Days on Market Until Sale 49 117 + 136.6%78 118 + 51.8% Inventory of Homes for Sale 10 24 + 140.0%-* Does not account for sale concessions and/or downpayment assistance. Percent changes are calculated using rounded figures and can sometimes look extreme due to small sample size. March All MLS — Palmetto Dunes — Current as of April 24, 2023. Data © 2023 REsides, INC. All Rights Reserved. Sponsored by South Carolina REALTORS®. Report © 2023 ShowingTime. A Research Tool Provided by REsides, Inc. and the Hilton Head Area Association of REALTORS® Palmetto Dunes Condos / Villas Only March Year to Date 26 22 18 20 New Listings Closed Sales $0 $200,000 $400,000 $600,000 $800,000 4-201410-20144-201510-20154-201610-20164-201710-20174-201810-20184-201910-20194-202010-20204-202110-20214-202210-2022 Historical Median Sales Price Rolling 12-Month Calculation $667,000 $724,000 Median Sales Price* 10 24 Inventory of Homes for Sale 2022 2023 -30.8% -9.1% + 8.5% + 140.0% Historical Median Sales Price - Rolling 12-Month Calculation 2022 2023 Information Sponsored by PALMETTO DUNES ALL MLS PALMETTO DUNES ALL MLS A Research Tool Provided by REsides and the Hilton Head Area Association of REALTORS® Beth DeAngelis Team 843-271-4254 beth@coastallivingbybeth.com www.coastallivingbybeth.com Palmetto Dunes Real Estate Market Report 10


our website Palmetto
Singleton
Each office is independently owned and operated Sun City | 238 Gleneagle Court Hampton
9
Ct. HHBT | 40 Folly Field Rd #C224 Among the Top 1.5% in the HHI/Bluffton MLS A Team You Can Trust to Deliver Results with 30+ Years of Experience Dedicated & Committed to Represent with Integrity & Trust Responsive to Your Needs Expert Negotiator Always Up to Date on the Latest Market Data & Trends Hilton Head Island Luxury Specialist With 114 Happy Clients & Over $80M in Sales for 2022! Buying or Selling? Call or Text Beth at (843) 271-4254 beth@coastallivingbybeth.com Getting Results! Thinking of Selling? We can help!
Dunes | 1 High Water
Beach | 17 Corine Lane
Lake |
Sweet Marsh


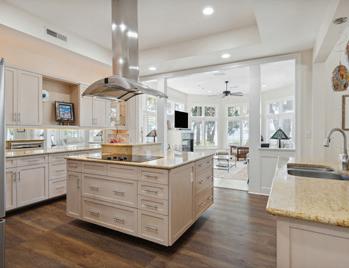

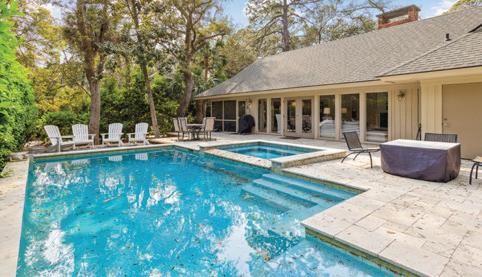


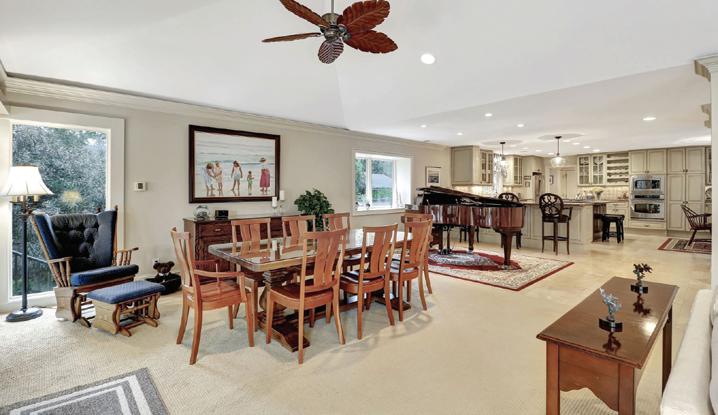
The time to sell 843.422.7500 BethDrake.com To search the entire MLS visit www.BethDrake.com WINDMILL HARBOUR 3rd row home with a direct beach path! 3 BR, 2.5 BA with a private pool. Rentals in place. 114 Mooring Buoy. $1,999,000 Enchant your senses in
inviting waterfront home. Marvel at its generously sized, naturally lit rooms and beautiful architectural details. 4 BR, 4.5 BA and a 2 car garage. First floor primary suite. Soak in the low country views as you entertain outside. 4 Sailstock Point. $1,900,000 Top 1 % of Area Realtors Thinking of buying or selling real estate? UNDERCONTRACT Stunning 4 BR, 3 BA home with a fenced backyard. Well-appointed kitchen. Screenedin porch. 109 Rudder Run. $599,500 THE LANDINGS PALMETTO DUNES www.CallenIns.com 843-681-2221 17 Executive Park Road | Hilton Head Island, SC 29928 Call for your Free Home Quote Primary/Secondary/ Rental Properties Callen Insurance Services Homeowners • Auto • Boat • Commercial • Life • Health Ask for Free Consultation for Long-term Care Life, Disability and Health Insurance Our Mission is to Create Peace of Mind Are You Prepared? Visit our New Location at 17 Executive Park Rd CALL OR EMAIL SHERI NIXON TO BUY OR SELL YOUR HILTON HEAD HOME 843-301-2688 Sheri@LivingonHHI.com www.SheriNixonTeam.com 3BD 2.5
Carriage House
Each office is independently owned and operated Riverton Pointe $525,000
this
BA
with expansive views of lagoon and Nicklaus golf course in gated
community
with great amenities. Features include 2 story foyer with dramatic curved staircase, kitchen with breakfast nook, dining area, living room with fireplace, upstairs loft, sunroom and large screened in porch.

RESIDENTIAL | NEW DEVELOMENT | COMMERCIAL There is a New Face of Real Estate in The Lowcountry. SERHANT. LLC is a licensed real estate broker and abides by Equal Housing Opportunity laws. All material presented herein is intended for informational purposes only. Information is compiled from sources deemed reliable but is subject to errors, omissions, changes in price, condition, sale, or withdrawal without notice. No statement is made as to the accuracy of any description. All measurements and square footages are approximate. This is not intended to solicit property already listed. Nothing herein shall be construed as legal, accounting, or other professional advice outside the realm of real estate brokerage. The Most Followed Real Estate Brand in the World. Chris Bowes Broker in Charge, Founding Member, SC chris.bowes@serhant.com 843.368.2935 HILTON HEAD BLUFFTON BEAUFORT CHARLESTON
Work With the Best!


843-671-5551 www.LighthouseRealtyHHI.com George W. Flathmann, Broker-in-Charge 843-671-5551 71 Lighthouse Road, Suite 216 Hilton Head, SC 29928 www.LighthouseRealtyHHI.com 843-671-5551 71 Lighthouse Road, Suite 216 Hilton Head, SC 29928 www.LighthouseRealtyHHI.com Congratulations to one of our own agents, Brian Kinard for being selected as the 2022 Realtor of the Year.
Let one of our many experienced Realtors® help you find your dream home.


We Are Invested In: • Your Real Estate Needs • Your Satisfaction • Your Future Ken & Clay Provide: • Exemplary Service • Integrity & Trust • Commitment • Dependability • Support • Knowledge • Experience • Competence • Sincerity & Humility • Sense of Humor OLIVER YOUR OLIVER KEN CLAY YOUR PROVEN REAL ESTATE PROFESSIONALS & OLIVER YOUR PROVEN REAL ESTATE PROFESSIONALS OLIVER KEN CLAY YOUR PROVEN REAL ESTATE PROFESSIONALS & Considering A Realtor? Look No Further! Don’t Hesitate...Ken and Clay Are Just A Call Or Click Away! 843.816.0167 Ken’s cell . 843.422.8432 Clay’s cell Ken-Oliver.com . Ken@Ken-Oliver.com . Clay@Ken-Oliver.com OLIVER TEAM HONORS • Dunes Real Estate’s Top Producing Team for 2022 with 50 Happy Clients and over $45M in Sales! • Dunes Real Estate’s Top Listing and/or Selling Agent 36 out of 44 Years • Have Assisted Thousands of Buyers and Sellers • Island Residents since 1977 & 1994 We Are Invested In: • Your Real Estate Needs • Your Satisfaction • Your Future Ken & Clay Provide: • Exemplary Service • Integrity & Trust • Commitment • Dependability • Support • Knowledge • Experience • Competence • Sincerity & Humility • Sense of Humor OLIVER KEN YOUR OLIVER KEN CLAY YOUR PROVEN REAL ESTATE PROFESSIONALS & & OLIVER KEN CLAY YOUR PROVEN REAL ESTATE PROFESSIONALS OLIVER KEN CLAY YOUR PROVEN REAL ESTATE PROFESSIONALS & Considering A Realtor? Look No Further! Don’t Hesitate...Ken and Clay Are Just A Call Or Click Away! 843.816.0167 Ken’s cell . 843.422.8432 Clay’s cell Ken-Oliver.com . Ken@Ken-Oliver.com . Clay@Ken-Oliver.com OLIVER TEAM HONORS • Dunes Real Estate’s Top Producing Team for 2022 with 50 Happy Clients and over $45M in Sales! • Dunes Real Estate’s Top Listing and/or Selling Agent 36 out of 44 Years • Have Assisted Thousands of Buyers and Sellers • Island Residents since 1977 & 1994
GLENEAGLE GREEN IN SEA PINES


Enjoy the RBC Heritage Classic from your spacious wrap around deck on the 2nd fairway/green of the renowned Harbour Town Links. Rare 3-bedroom, 3-bath end unit with one bedroom and one bathroom on the first floor in a quiet, 20 unit complex with community pool; so many possiblities as a second/vacation home, vacation rental or primary residence. The villa features granite counters, eat-in kitchen, separate dining area with wet bar and 2 refrigerators one for wine and one for beverages. Gleneagle Green is in the heart of Sea Pines, an easy bike/ walk to Harbour Town and Sea Pines Center. Enjoy all that Sea Pines resort has to offer beautiful beaches, golf, tennis, miles of walking/bike paths, 2 marinas, stables, many restaurants and shops, and the Forest Preserve. $989,000


DUNESREALESTATE.COMDUNESREALESTATE.COM First Home....Second Home...Vacation Home...Dream Home 843-301-7501 HHITRISH@GMAIL.COM TRISHW.DUNESREALESTATE.COM Helping Real Estate Dreams Come True 2 BR, 2 BA Villa JUST A SHORT WALK to Dolphin Head and the Water! Truly One of the Most Beautiful Spots on Hilton Head. Large Open Living Area. Lots of Windows and Sunlight. Fireplace. Galley Kitchen. Updated Cabinets. Great Bedroom Separation. Three Spacious Outdoor Living Areas! Privacy and Wide GOLF VIEW. Outdoor Service Area AND Spacious Outdoor Storage Room. $520,000 2015 HILTON HEAD CLUB VILLAS • HILTON HEAD PLANTATION DUNESREALESTATE.COM lisabplowden@gmail.com 843-290-3060 Your Island Friend & Realtor
If you’re not sure what or where to buy real estate on HHI or have questions about ownership fees or rental income, call me. My knowledge & advice is always FREE. The education process for Island Real Estate is interesting & fun, but it is also necessary and important. Start slow, get your feet wet but get started. Start with Lisa, Call Today! 843-290-3060 ? Not Sure Where to Start?? ? Views of Harbour Town Links
Real Estate Market Report
Local Market Update – March 2023
Port Royal | March 2023 Local Market Update – March 2023
Palmetto Dunes
Palmetto Dunes
Local Market Update – March 2023
Palmetto Dunes
Local Market Update – March 2023
Palmetto Dunes
4-201410-20144-201510-20154-201610-20164-201710-20174-201810-20184-201910-20194-202010-20204-202110-20214-202210-2022
Key Metrics 20222023 Percent Change 20222023 Percent Change New Listings 4 7 + 75.0%15 14 - 6.7% Closed Sales 6 8 + 33.3%24 10 - 58.3% Median Sales Price* $2,197,500 $1,937,500 - 11.8%$2,015,000 $2,050,000 + 1.7% Percent of List Price Received* 99.4% 95.9% - 3.5%98.4% 95.8% - 2.7% Days on Market Until Sale 104 105 + 0.9%115 101 - 12.5% Inventory of Homes for Sale 6 10 + 66.7%-* Does not account for sale concessions and/or downpayment assistance. | Percent changes are calculated using rounded figures and can sometimes look extreme due to small sample size. March All MLS — Palmetto Dunes — Current as of April 24, 2023. Data © 2023 REsides, INC. All Rights Reserved. | Sponsored by South Carolina REALTORS®. | Report © 2023 ShowingTime. A Research Tool Provided by REsides, Inc. and the Hilton Head Area Association of REALTORS® Palmetto Dunes Detached Homes Only March Year to Date 4 6 7 8 New Listings Closed Sales $250,000 $500,000 $750,000 $1,000,000 $1,250,000 $1,500,000 $1,750,000 4-201410-20144-201510-20154-201610-20164-201710-20174-201810-20184-201910-20194-202010-20204-202110-20214-202210-2022 Historical Median Sales Price Rolling 12-Month Calculation $2,197,500 $1,937,500 Median Sales Price* 6 10 Inventory of Homes for Sale 2022 2023 + 75.0% + 33.3% -11.8% + 66.7%
Key Metrics 20222023 Percent Change 20222023 Percent Change New Listings 4 7 + 75.0%15 14 - 6.7% Closed Sales 6 8 + 33.3%24 10 - 58.3% Median Sales Price* $2,197,500 $1,937,500 - 11.8%$2,015,000 $2,050,000 + 1.7% Percent of List Price Received* 99.4% 95.9% - 3.5%98.4% Days on Market Until Sale 104 105 + 0.9%115 Inventory of Homes for Sale 6 10 + 66.7%-* Does not account for sale concessions and/or downpayment assistance. | Percent changes are calculated using rounded figures and can sometimes look extreme due to small sample size. March All MLS — Palmetto Dunes — Current as of April 24, 2023. Data © 2023 REsides, INC. All Rights Reserved. | Sponsored by South Carolina REALTORS®. | Report © 2023 ShowingTime. A Research Tool Provided by REsides, Inc. and the Hilton Head Area Association of REALTORS® Palmetto
Detached Homes Only March Year to Date 4 6 7 8 New Listings Closed Sales $250,000 $500,000 $750,000 $1,000,000 $1,250,000 $1,500,000 $1,750,000 4-201410-20144-201510-20154-201610-20164-201710-20174-201810-20184-201910-20194-202010-20204-202110-20214-202210-2022 Historical Median Sales Price Rolling 12-Month Calculation $2,197,500 $1,937,500 Median Sales Price* 6 10 Inventory of Homes for Sale 2022 2023 + 75.0% + 33.3% -11.8% + 66.7% Port Royal Real Estate Market Report 17 Local Market Update – March 2023 Key Metrics 20222023 Percent Change 20222023 Percent Change New Listings 4 7 + 75.0%15 14 - 6.7% Closed Sales + 33.3%24 10 - 58.3% Median Sales Price* $2,197,500 $1,937,500 - 11.8%$2,015,000 $2,050,000 + 1.7% Percent of List Price Received* 99.4% 95.9% - 3.5%98.4% 95.8% - 2.7% Days on Market Until Sale 104 105 + 0.9%115 101 - 12.5% Inventory of Homes for Sale 6 10 + 66.7%-* Does not account for sale concessions and/or downpayment assistance. | Percent changes are calculated using rounded figures and can sometimes look extreme due to small sample size. March All MLS — Palmetto Dunes — Current as of April 24, 2023. Data © 2023 REsides, INC. All Rights Reserved. | Sponsored by South Carolina REALTORS®. | Report © 2023 ShowingTime. A Research Tool Provided by REsides, Inc. and the Hilton Head Area Association of REALTORS® Palmetto Dunes Detached Homes Only March Year to Date 4 6 7 8 New Listings Closed Sales $250,000 $500,000 $750,000 $1,000,000 $1,250,000 $1,500,000 $1,750,000 4-201410-20144-201510-20154-201610-20164-201710-20174-201810-20184-201910-20194-202010-20204-202110-20214-202210-2022 Historical Median Sales Price Rolling 12-Month Calculation $2,197,500 $1,937,500 Median Sales Price* 6 10 Inventory of Homes for Sale + 75.0% + 33.3% -11.8% + 66.7% Detached Homes Only Local Market Update – March 2023 Key Metrics 20222023 Percent Change 20222023 Percent Change New Listings 4 7 + 75.0%15 14 - 6.7% Closed Sales 6 8 + 33.3%24 10 - 58.3% Median Sales Price* $2,197,500 $1,937,500 - 11.8%$2,015,000 $2,050,000 + 1.7% Percent of List Price Received* 99.4% 95.9% - 3.5%98.4% 95.8% - 2.7% Days on Market Until Sale 104 105 + 0.9%115 101 - 12.5% Inventory of Homes for Sale 6 10 + 66.7%-* Does not account for sale concessions and/or downpayment assistance. Percent changes are calculated using rounded figures and can sometimes look extreme due to small sample size. March All MLS — Palmetto Dunes — Current as of April 24, 2023. Data © 2023 REsides, INC. All Rights Reserved. Sponsored by South Carolina REALTORS®. Report © 2023 ShowingTime. A Research Tool Provided by REsides, Inc. and the Hilton Head Area Association of REALTORS®
Dunes
Detached Homes Only March 4 6 7 8 New Listings Closed Sales $250,000 $500,000 $750,000 $1,000,000 $1,250,000 $1,500,000 $1,750,000 4-201410-20144-201510-20154-201610-20164-201710-20174-201810-20184-201910-20194-202010-20204-202110-20214-202210-2022 Historical Median Sales Price Rolling 12-Month Calculation $2,197,500 $1,937,500 Median Sales Price* 6 10 Inventory of Homes for Sale 2022 2023 + 75.0% + 33.3% -11.8% + 66.7%
– March
Key Metrics 20222023 Percent Change 20222023 Percent Change New Listings 4 7 + 75.0%15 14 - 6.7% Closed Sales 6 8 + 33.3%24 10 - 58.3% Median Sales Price* $2,197,500 $1,937,500 - 11.8%$2,015,000 $2,050,000 + 1.7% Percent of List Price Received* 99.4% 95.9% - 3.5%98.4% 95.8% - 2.7% Days on Market Until Sale 104 105 + 0.9%115 101 - 12.5% Inventory of Homes for Sale 6 10 + 66.7%-Does not account for sale concessions and/or downpayment assistance. Percent changes are calculated using rounded figures and can sometimes look extreme due to small sample size. All MLS — Palmetto Dunes — Current as of April 24, 2023. Data © 2023 REsides, INC. All Rights Reserved. Sponsored by South Carolina REALTORS®. Report © 2023 ShowingTime. A Research Tool Provided by REsides, Inc. and the Hilton Head Area Association of REALTORS®
Local Market Update
2023
Detached Homes Only March Year to Date 4 6 7 8 New Listings Closed Sales $250,000 $500,000 $750,000 $1,000,000 $1,250,000 $1,500,000 $1,750,000
Historical Median Sales Price Rolling 12-Month Calculation $2,197,500 $1,937,500 Median Sales Price* 6 10 Inventory of Homes for Sale 2022 2023 + 75.0% + 33.3% -11.8% + 66.7% Metrics 20222023 Percent Change 20222023 Percent Change Listings 4 7 + 75.0%15 14 - 6.7% Closed Sales 6 8 + 33.3%24 10 - 58.3% Median Sales Price* $2,197,500 $1,937,500 - 11.8%$2,015,000 $2,050,000 + 1.7% Percent of List Price Received* 99.4% 95.9% - 3.5%98.4% 95.8% - 2.7% Days on Market Until Sale 104 105 + 0.9%115 101 - 12.5% Inventory of Homes for Sale 6 10 + 66.7%-not account for sale concessions and/or downpayment assistance. Percent changes are calculated using rounded figures and can sometimes look extreme due to small sample size. March All MLS — Palmetto Dunes — Current as of April 24, 2023. Data © 2023 REsides, INC. All Rights Reserved. Sponsored by South Carolina REALTORS®. Report © 2023 ShowingTime. 4 6 7 8 New Listings Closed Sales $250,000 $500,000 $750,000 $1,000,000 $1,250,000 $1,500,000 $1,750,000 4-201410-20144-201510-20154-201610-20164-201710-20174-201810-20184-201910-20194-202010-20204-202110-20214-202210-2022 Historical Median Sales Price Rolling 12-Month Calculation $2,197,500 $1,937,500 Median Sales Price* 6 10 Inventory of Homes for Sale 2022 2023 + 75.0% + 33.3% -11.8% + 66.7% Historical Median Sales Price - Rolling 12-Month Calculation 2022 2023
Key Metrics 20222023 Percent Change 20222023 Percent Change New Listings 26 18 - 30.8%67 50 - 25.4% Closed Sales 22 20 - 9.1% 52 43 - 17.3% Median Sales Price* $667,000 $724,000 + 8.5%$694,500 $718,000 + 3.4% Percent of List Price Received* 102.7% 97.1% - 5.5%101.7% 96.5% - 5.1% Days on Market Until Sale 49 117 + 136.6%78 118 + 51.8% Inventory of Homes for Sale 10 24 + 140.0%-* Does not account for sale concessions and/or downpayment assistance. | Percent changes are calculated using rounded figures and can sometimes look extreme due to small sample size. March All MLS — Palmetto Dunes — A Research Tool Provided by REsides, Inc. and the Hilton Head Area Association of REALTORS® Palmetto Dunes Condos / Villas Only March Year to Date 26 22 18 20 Closed Sales $800,000 Historical Median Sales Price Rolling 12-Month Calculation $667,000 $724,000 Median Sales Price* 10 24 Inventory of Homes for Sale 2022 2023 -30.8% -9.1% + 8.5% Condos/Villas Only Local Market Update – March 2023 Key Metrics 20222023 Percent Change 20222023 Percent Change New Listings 26 18 - 30.8%67 50 - 25.4% Closed Sales 22 20 - 9.1% 52 43 - 17.3% Median Sales Price* $667,000 $724,000 + 8.5%$694,500 $718,000 + 3.4% Percent of List Price Received* 102.7% 97.1% - 5.5%101.7% 96.5% - 5.1% Days on Market Until Sale 49 117 + 136.6%78 118 + 51.8% Inventory of Homes for Sale 10 24 + 140.0%-Does not account for sale concessions and/or downpayment assistance. Percent changes are calculated using rounded figures and can sometimes look extreme due to small sample size. March All MLS — Palmetto Dunes — Current as of April 24, 2023. Data © 2023 REsides, INC. All Rights Reserved. Sponsored by South Carolina REALTORS®. Report © 2023 ShowingTime. A Research Tool Provided by REsides, Inc. and the Hilton Head Area Association of REALTORS® Palmetto Dunes Condos / Villas Only March Year to Date 26 22 18 20 New Listings Closed Sales $0 $200,000 $400,000 $600,000 $800,000 4-201410-20144-201510-20154-201610-20164-201710-20174-201810-20184-201910-20194-202010-20204-202110-20214-202210-2022 Historical Median Sales Price Rolling 12-Month Calculation $667,000 $724,000 Median Sales Price* 10 24 Inventory of Homes for Sale 2022 2023 -30.8% -9.1% + 8.5% + 140.0% Local Market Update – March 2023 Key Metrics 20222023 Percent Change 20222023 Percent Change New Listings 26 18 - 30.8%67 50 - 25.4% Closed Sales 22 20 - 9.1% 52 43 - 17.3% Median Sales Price* $667,000 $724,000 + 8.5%$694,500 $718,000 + 3.4% Percent of List Price Received* 102.7% 97.1% - 5.5%101.7% 96.5% - 5.1% Days on Market Until Sale 49 117 + 136.6%78 118 + 51.8% Inventory of Homes for Sale 10 24 + 140.0%-* Does not account for sale concessions and/or downpayment assistance. Percent changes are calculated using rounded figures and can sometimes look extreme due to small sample size. March All MLS — Palmetto Dunes — Current as of April 24, 2023. Data © 2023 REsides, INC. All Rights Reserved. Sponsored by South Carolina REALTORS®. Report © 2023 ShowingTime. A Research Tool Provided by REsides, Inc. and the Hilton Head Area Association of REALTORS®
Condos / Villas Only March Year to Date 26 22 18 20 New Listings Closed Sales $0 $200,000 $400,000 $600,000 $800,000 4-201410-20144-201510-20154-201610-20164-201710-20174-201810-20184-201910-20194-202010-20204-202110-20214-202210-2022 Historical Median Sales Price Rolling 12-Month Calculation $667,000 $724,000 Median Sales Price* 10 24 Inventory of Homes for Sale 2022 2023 -30.8% -9.1% + 8.5% + 140.0%
Key Metrics 20222023 Percent Change 20222023 Percent Change New Listings 26 18 - 30.8%67 50 - 25.4% Closed Sales 22 20 - 9.1% 52 43 - 17.3% Median Sales Price* $667,000 $724,000 + 8.5%$694,500 $718,000 + 3.4% Percent of List Price Received* 102.7% 97.1% - 5.5%101.7% 96.5% - 5.1% Days on Market Until Sale 49 117 + 136.6%78 118 + 51.8% Inventory of Homes for Sale 10 24 + 140.0%-Does not account for sale concessions and/or downpayment assistance. | Percent changes are calculated using rounded figures and can sometimes look extreme due to small sample size. March All MLS — Palmetto Dunes — Current as of April 24, 2023. Data © 2023 REsides, INC. All Rights Reserved. Sponsored by South Carolina REALTORS®. Report © 2023 ShowingTime. Research Tool Provided by REsides, Inc. and the Hilton Head Area Association of REALTORS®
Condos / Villas Only March Year to Date 26 22 18 20 New Listings Closed Sales $0 $200,000 $400,000 $600,000 $800,000 4-201410-20144-201510-20154-201610-20164-201710-20174-201810-20184-201910-20194-202010-20204-202110-20214-202210-2022 Historical Median Sales Price Rolling 12-Month Calculation $667,000 $724,000 Median Sales Price* 10 24 Inventory of Homes for Sale 2022 2023 -30.8% -9.1% + 8.5% + 140.0% Historical Median Sales Price - Rolling 12-Month Calculation 2022 2023 Information Sponsored by PORT ROYAL ALL MLS PORT ROYAL ALL MLS A Research Tool Provided by REsides and the Hilton Head Area Association of REALTORS® Beth DeAngelis Team 843-271-4254 beth@coastallivingbybeth.com www.coastallivingbybeth.com


Karen
Ann Ekus
Dan Ekus
Robert
Meg O’Hanlon megohanlonhhi.com
WHEREVER YOU’RE COMING FROM, www.HamptonLake.Homes For more info or to see this wonderful community, call/text 843-781-6700 today! Discover the community of Hampton Lake
Lake
Your pets enjoy the beach too... To see the latest Pet-Friendly Villas for Sale, go to www.PetFriendlyVillasForSale.com Find a home your Pets will love too!
DePace karendepace.com 516-818-2131 843-415-1616 Shoreham, NY Springhill, FL
annekus.com 516-652-7292 843-707-7253 Massapequa, NY
danekus.com 516-512-2480 843-707-7253 Mineola, NY
Gladys robertgladys.com 440-463-4419 843-757-2935 Cleveland, Medina & Akron, OH
843-949-7008 Ellicott City, MD Philadelphia, PA Catherine A. Brown, Broker-in-Charge
Hampton
BLUFFTON


Group DiNenna www.GroupDiNenna.com Jim Purcell jimpurcellhhi.com
NC Kendra Rohlfing kendrarohlfing.com
Frankfort, IL
MA Marta Yelverton martayelverton.com
OH
NC Rick Yelverton rickyelverton.com 828-674-7421 843-707-7878
FL Hendersonville, NC Dino DiNenna groupdinenna.com 843-560-9310 VA, MD & DC WE HAVE THE right agent FOR YOU. www.seapines.forsale Enjoy the Sea Pines Lifestyle Sea Pines HILTON HEAD www.hiltonheadnew.homes Find your dream home on Hilton Head
843-368-7694 Asheville,
843-290-5850 West
Boston,
828-674-4328 843-707-7878 Cleveland,
Hendersonville,
Pensacola,
Vacation Home & Villa Report
HILTON HEAD ISLAND ADJUSTED PAID OCCUPANCY % 2022 & 2023 COMPARISON


HILTON HEAD ISLAND AVERAGE DAILY RATE 2022 & 2023 COMPARISON
HILTON HEAD ISLAND REVPAR 2022 & 2023 COMPARISON

843-671-5155 www.Beach-Property.com Information Sponsored & Provided by Hilton Head Island Home & Villa Report 20 HILTON HEAD ISLAND AREA


Luxury Vacation Homes & Villas 1-843-671-5155 | www.beach-property.com Kick Back & Relax O ering full service property management with a personalized touch. Are you maximizing your revenue? Call us today to set up a con dential analysis of your island investment!
Bringing you the Best of Hilton Head!

291 WATERFOWL RD • PALMETTO BLUFF
One of a few remaining waterfront lots in Palmetto Bluff that overlooks The River Road Preserve–a private nature lover’s paradise. Dock Easement in place. Palmetto Bluff is the jewel of the Lowcountry with excellent amenities. Approved plans on file. $1,195,000 Call Lonnie 843-338-0094


Pristine 3/2 home with a den. This home has been lovingly cared for by the original owners. Wisteria model on a cul de sac with a screened porch overlooking gorgeous wooded view. All the main systems are newer (roof, HVAC, HWH) . Being sold furnishedperfect for a second home. $599,000 Call Lonnie 843-338-0094
51 TUPELO COURT • SUN CITY
Adorable, totally updated Heather model with hand built cabinets! Seller has overlooked nothing in the upgrades. Being sold furnished (with a few exceptions). Awesome master bath with huge walk-in closet, LVP floors. Nice location at the end of a cul de sac. $459,000 Call Lonnie 843-338-0094


•
Recently updated 2 BR villa with new HVAC system. New kitchen, new counters & stainless appliances, new paint, new fans. Ready for your family to make great beach memories and put it on the rental market when you are not using it. Steps to miles of island bike paths. Buy now-why wait? $259,000 Call Lonnie 843-338-0094
Lonnie Goulet


843.338.0094


lonniegoulet@gmail.com


A short stroll to the beach from this 2BR/1.5 BA furnished villa. Updated and already on the short term rental market, Seller has grossed over $20,000 since last May. Walk to Coligny Plaza for shops, restaurants and entertainment. Newer HVAC system. Offered at $269,900 furnished Call Lonnie 843-338-0094


Upgraded townhome in The Townes at Buckwalter. Two large bedrooms upstairs, each w/ full bathroom and half bath downstairs for guests. Newer roof, HVAC system, and water heater. Updated kitchen with granite & stainless appliances. Covered back patio, lagoon view. Asking $279,000 Call Shanti 843-298-2743

Shanti
843.298.2743
Shantibringasre@gmail.com
252 NORTH CIRCLE • BLUFFTON
6 ASTON COURT • SUN CITY
104 CORDILLO PARKWAY • M8
104 CORDILLO PARKWAY
04
Bringas
843.301.0814 brian@briankinard.com briankinard.com Helping you navigate the real estate market with confidence and ease BK BRIAN KINARD YOURTRUSTEDREALTOR Follow Brian @cruisingwiththekinards Brian Kinard 2022 REALTOR OF THE YEAR HILTON HEAD AREA REALTORS


Lynne Riggs Anderson 843.384.5426 | lynneriggsanderson@gmail.com REALTORS FOR ISLAND LIFE Selling Hilton Head, Bluffton and the Surrounding Lowcountry Sammi Burns 843.384.4671 | Sammi@beachclubrealestate.com 22 WOOD DUCK CT | SEA PINES 3 BR/2BA with Golf Views $895,000 BeachClubRealEstate.com Familiar Faces. Trusted Advisors. POWERED BY www.imaginehiltonhead.com 140 SEA SIDE VILLA | S. FOREST BEACH 1 BR/1BA Furn. Beach Bungalow $355,000 280 SEA SIDE VILLA | S. FOREST BEACH Oceanfront 1BR/1BA $349,000 C22 SUMMER HOUSE | MARSHLAND RD 2BR/2BA, Lake View Corner Unit $345,000 843-816-2672 Wendy CORBITT wendy@wendycorbitt.com www.wendycorbitt.beachclubrealestate.com 130 Lawton Villas • Sea Pines 2 BR, 2 BA • Carolina Rm • Lagoon View Tastefully remodeled in 2022 $815,000 9 Gull Point • Sea Pines 5 BR, 4 BA, 2 HB • Custom Features Dramatic Views & Open Floorplan Screened Porch & Free-Form Pool Call or text me today for more information about any of these great properties. 70 Crosstree Drive • Windmill Harbour Marsh Front Lot in Private Community 35’ Marsh Frontage $200,000 UNDERCONTRACT
finest
Sea Pines. Meticulously planned 2021 top to bottom ultra-luxurious appointments. Open floor plan, large gathering kitchen with Downsview cabinetry & Subzero/Wolf/Cove bedroom suites with spa-like baths including first and Reclaimed barn wood beams. Fine furniture throughout Private courtyard swimming & dining. Annual Rental projections

Recent & BEAUTIFUL remodel, meticulously cared for, on a near 1/2 acre lot with long fairway and lagoon views on the 14th of Heron Point in the coveted Sea Pines Resort. Long list of updates inside and out including newer roof and hvac, new floors throughout, remodeled kitchen and bathrooms, plantation shutters and so much more. Turnkey property so hard to find in Sea Pines! 3 bedrooms on the main floor with additional office/exercise room adjacent to the open kitchen. HUGE bonus room and bath over the garage would be perfect as a private guest suite or game room. Tons of natural light. High end furnishings top to bottom. Bright and lovely!
SOLD $620,000


5th row walkway “newer” home in award winning Sea Pines Resort, just steps from the beach! Open floor plan w/ two story ceiling & loft. Big kitchen, quality architecture and good bedroom separation. Private pool w/ large deck just off the beach walkway. Stroll to South Beach for dining and shopping. Short-term rental or a great permanent residence!
Beautiful, brand new oceanside construction in Sea Pines Resort. 6th row ocean home with 6 BRs, 6.5 BAs on the beach walkway. Upscale finishes inside and out. Open floor plan with first floor master, luxurious kitchen with huge pantry, spacious bedrooms w/ private baths and bonus area. Swimming pool & entertaining terrace. Rental projections: 270K.


Drew Davis 843-422-5438 | captaindrewdavis@ gmail.com


Here for YOU. On YOUR Side. Contact Susan Ochsner today! OVER 50 YEAR island resident. Experience Counts. YourHiltonHeadAgent.com 843.816.6388 INTEGRITY ~ PROFESSIONALISM ~ EXPERIENCE ~ LOCAL What I do is not about houses or contracts. It’s about Families. It’s about Dreams. It’s about People connect with the 843-384-7314 Barbra@BarbraFiner.com • www.BarbraFiner.com barbra f ner CUNNINGHAM/NOLDE TEAM NANCY CUNNINGHAM 43 YEAR BROKER SUNNY NOLDE 843-683-4580 yeanancy@yahoo.com 843-684-1234 sunnynolde@gmail.com at Four Generations Loving the Lowcountry “Let Drew guide you home” • A true local with a wealth of low country knowledge and a passion for the lowcountry • Multi-million dollars worth of sales last year • Working with Sea Pines Real Estate–the oldest and most successful firm on the Island • Extremely dedicated & hardworking putting clients’ needs first Reasons to work with Drew www.seapinesrealestate.com/beach-club/ @drewdavis_realestate Great multi-use building in quaint Old Town Bluffton with business potential and upstairs apartment. It would be perfect for living over your business and getting that Bluffton experience walking to shops and restaurants. OSCREA. $899,900 MLS 430344 30 Promenade Street in Bluffton Jill Murphy 843-338-1587 BeachClubRealEstate.com Familiar Faces. Trusted Advisors. Find Your Place in the Lowcountry...I can help! Top Selling Realtor for Sea Pines Real Estate Beach Club L OR RI LEWIS REA LTOR/BROKER/PARTNER 843-422-6448 lorrihhi@gmail.com www.myhomeinhiltonhead.com 2 2 Red Cardinal – Se a Pi nes Hil t on H e ad I sl a n d, S C 7 Beds | 6.5 Baths | 4,838 Sqft | $4,800,000 This Grand, 2nd
is
2ND ROW Lorri Lewis
row beachside estate
one of the
sale in
PARTNER/BROKER 843-422-6448 lorrihhi@gmail.com www.myhomeinhiltonhead.com
5 BELTED KINGFISHER • $3,875,000
8 RIDGEWOOD LANE • $2,299,000
15 RUDDY TURNSTONE RD • $4,750,000
...at home on Hilton Head Rob Reichel

While it was Rob’s tennis career that brought him to the Island in 1974 as a tennis pro for Sea Pines, it was his love of the lowcountry that kept him here. While a lot has changed since then, Rob has never lost his enthusiasm for the Island that he, Jody and his four children have called home. His passion for coaching, involvement with his kids’ extracurricular activities, leadership roles on the island and wide ranging success in the real estate business have allowed him to give back to the community on a number of different levels. He’d love the opportunity to share his unique knowledge of this market with you and your family. Whether you’re looking for a vacation villa, the perfect family home or an oceanfront estate, Rob can help you realize your real estate dreams!


Rob Reichel www.RobReichel.com (843) 384-6789 rob@robreichel.com If you are thinking of selling, now is the time! Inventory is low and homes are selling fast. Let the #1 Pro Work for You! Top Ten Hilton Head Island Realtor for 26 Years in a Row Island Resident Since 1974 New Home Construction Expert Sea Pines Property Owner for 20 years! Life Member Distinguished Realtor Sales Award Sea Pines Real Estate Company’s All Time Top Producer Former Director of Tennis for Sea Pines, Shipyard & Port Royal Racquet Club BeachClubRealEstate.com Familiar Faces. Trusted Advisors.
Local Market Update – March 2023
Sea Pines
Local Market Update – March 2023

Sea Pines

Local Market Update – March 2023 Key Metrics 20222023 Percent Change 20222023 Percent Change New Listings 26 18 - 30.8%68 41 - 39.7% Closed Sales - 35.0%43 27 - 37.2% Median Sales Price* $2,200,000 $1,325,000 - 39.8%$1,800,000 $1,250,000 - 30.6% Percent of List Price Received* 101.3% 98.8% - 2.5%100.2% 97.5% - 2.6% Days on Market Until Sale 78 82 + 5.2% 74 99 + 32.4% Inventory of Homes for Sale 25 22 - 12.0% * Does not account for sale concessions and/or downpayment assistance. | Percent changes are calculated using rounded figures and can sometimes look extreme due to small sample size. March All MLS — Sea Pines — Current as of April 24, 2023. Data © 2023 REsides, INC. All Rights Reserved. | Sponsored by South Carolina REALTORS®. | Report © 2023 ShowingTime. A Research Tool Provided by REsides, Inc. and the Hilton Head Area Association of REALTORS® Sea Pines Detached Homes Only March Year to Date 26 20 18 13 New Listings Closed Sales $250,000 $500,000 $750,000 $1,000,000 $1,250,000 $1,500,000 $1,750,000 4-201410-20144-201510-20154-201610-20164-201710-20174-201810-20184-201910-20194-202010-20204-202110-20214-202210-2022 Historical Median Sales Price Rolling 12-Month Calculation $2,200,000 $1,325,000 Median Sales Price* 25 22 Inventory of Homes for Sale -30.8% -35.0% -39.8% -12.0% Real Estate Market Report
Pines
Local
Update
Key Metrics 20222023 Percent Change 20222023 Percent New Listings 26 18 - 30.8%68 41 Closed Sales 20 13 - 35.0%43 27 Median Sales Price* $2,200,000 $1,325,000 - 39.8%$1,800,000 $1,250,000 Percent of List Price Received* 101.3% 98.8% - 2.5%100.2% 97.5% Days on Market Until Sale 78 82 + 5.2% 74 99 Inventory of Homes for Sale 25 - 12.0% * Does not account for sale concessions and/or downpayment assistance. | Percent changes are calculated using rounded figures and can sometimes look extreme due to small sample size. March All Sea Current as of April 24, 2023. Data © 2023 REsides, INC. All Rights Reserved. | Sponsored by South Carolina REALTORS®. | Report © 2023 A Research Tool Provided by REsides, Inc. and the Hilton Head Area Association of REALTORS® Sea Pines Detached Homes Only March Year to Date 26 20 18 13 New Listings Closed Sales $250,000 $500,000 $750,000 $1,000,000 $1,250,000 $1,500,000 $1,750,000 4-201410-20144-201510-20154-201610-20164-201710-20174-201810-20184-201910-20194-202010-20204-202110-20214-202210-2022 Historical Median Sales Price Rolling 12-Month Calculation $2,200,000 $1,325,000 Median Sales Price* 25 Inventory of Homes 2022 -30.8% -35.0% -39.8% -12.0% Detached
Update
Key Metrics 20222023 Percent Change 20222023 Percent Change New Listings 26 18 - 30.8%68 41 - 39.7% Closed Sales 20 13 - 35.0%43 27 - 37.2% Median Sales Price* $2,200,000 $1,325,000 - 39.8%$1,800,000 $1,250,000 - 30.6% Percent of List Price Received* 101.3% 98.8% - 2.5%100.2% 97.5% Days on Market Until Sale 78 82 + 5.2% Inventory of Homes for Sale 25 22 - 12.0% -* Does not account for sale concessions and/or downpayment assistance. | Percent changes are calculated using rounded figures and can sometimes look extreme due to small sample size. March All MLS — Sea Pines — Current as of April 24, 2023. Data © 2023 REsides, INC. All Rights Reserved. | Sponsored by South Carolina REALTORS®. Report © 2023 ShowingTime. A Research Tool Provided by REsides, Inc. and the Hilton Head Area Association of REALTORS® Sea Pines Detached Homes Only March Year to Date 26 20 18 13 New Listings Closed Sales $250,000 $500,000 $750,000 $1,000,000 $1,250,000 $1,500,000 $1,750,000 4-201410-20144-201510-20154-201610-20164-201710-20174-201810-20184-201910-20194-202010-20204-202110-20214-202210-2022 Historical Median Sales Price Rolling 12-Month Calculation $2,200,000 $1,325,000 Median Sales Price* 25 22 Inventory of Homes for Sale 2022 2023 -30.8% -35.0% -39.8% -12.0% Local Market Update – March 2023 Key Metrics 20222023 Percent Change 20222023 Percent Change New Listings 26 18 - 30.8%68 41 - 39.7% Closed Sales 20 13 - 35.0%43 27 - 37.2% Median Sales Price* $2,200,000 $1,325,000 - 39.8%$1,800,000 $1,250,000 - 30.6% Percent of List Price Received* 101.3% 98.8% - 2.5%100.2% 97.5% - 2.6% Days on Market Until Sale 78 82 + 5.2% 74 99 + 32.4% Inventory of Homes for Sale 25 22 - 12.0% * Does not account for sale concessions and/or downpayment assistance. Percent changes are calculated using rounded figures and can sometimes look extreme due to small sample size. March All MLS — Sea Pines — Current as of April 24, 2023. Data © 2023 REsides, INC. All Rights Reserved. Sponsored by South Carolina REALTORS®. Report © 2023 ShowingTime. A Research Tool Provided by REsides, Inc. and the Hilton Head Area Association of REALTORS®
Detached Homes Only March Year to Date 26 20 18 13 New Listings Closed Sales $250,000 $500,000 $750,000 $1,000,000 $1,250,000 $1,500,000 $1,750,000 4-201410-20144-201510-20154-201610-20164-201710-20174-201810-20184-201910-20194-202010-20204-202110-20214-202210-2022 Historical Median Sales Price Rolling 12-Month Calculation $2,200,000 $1,325,000 Median Sales Price* 25 22 Inventory of Homes for Sale 2022 2023 -30.8% -35.0% -39.8% -12.0%
Sea
| March 2023
Market
– March 2023
Homes Only Local Market
– March 2023
Sea Pines
Key Metrics 20222023 Percent Change 20222023 Percent Change New Listings 26 18 - 30.8%68 41 - 39.7% Closed Sales 20 13 - 35.0%43 27 - 37.2% Median Sales Price* $2,200,000 $1,325,000 - 39.8%$1,800,000 $1,250,000 - 30.6% Percent of List Price Received* 101.3% 98.8% - 2.5%100.2% 97.5% - 2.6% Days on Market Until Sale 78 82 + 5.2% 74 99 + 32.4% Inventory of Homes for Sale 25 22 - 12.0% Does not account for sale concessions and/or downpayment assistance. Percent changes are calculated using rounded figures and can sometimes look extreme due to small sample size. All MLS — Sea Pines — Current as of April 24, 2023. Data © 2023 REsides, INC. All Rights Reserved. Sponsored by South Carolina REALTORS®. Report © 2023 ShowingTime. A Research Tool Provided by REsides, Inc. and the Hilton Head Area Association of REALTORS®
Detached Homes Only March Year to Date 26 20 18 13 New Listings Closed Sales $250,000 $500,000 $750,000 $1,000,000 $1,250,000 $1,500,000 $1,750,000 4-201410-20144-201510-20154-201610-20164-201710-20174-201810-20184-201910-20194-202010-20204-202110-20214-202210-2022 Historical Median Sales Price Rolling 12-Month Calculation $2,200,000 $1,325,000 Median Sales Price* 25 22 Inventory of Homes for Sale 2022 2023 -30.8% -35.0% -39.8% -12.0% Key Metrics 20222023 Percent Change 20222023 Percent Change New Listings 26 18 - 30.8%68 41 - 39.7% Closed Sales 20 13 - 35.0%43 27 - 37.2% Median Sales Price* $2,200,000 $1,325,000 - 39.8%$1,800,000 $1,250,000 - 30.6% Percent of List Price Received* 101.3% 98.8% - 2.5%100.2% 97.5% - 2.6% Days on Market Until Sale 78 82 + 5.2% 74 99 + 32.4% Inventory of Homes for Sale 25 22 - 12.0% * Does not account for sale concessions and/or downpayment assistance. Percent changes are calculated using rounded figures and can sometimes look extreme due to small sample size. March All MLS — Sea Pines — Current as of April 24, 2023. Data © 2023 REsides, INC. All Rights Reserved. | Sponsored by South Carolina REALTORS®. | Report © 2023 ShowingTime. 26 20 18 13 New Listings Closed Sales $250,000 $500,000 $750,000 $1,000,000 $1,250,000 $1,500,000 $1,750,000 4-201410-20144-201510-20154-201610-20164-201710-20174-201810-20184-201910-20194-202010-20204-202110-20214-202210-2022 Historical Median Sales Price Rolling 12-Month Calculation $2,200,000 $1,325,000 Median Sales Price* 25 22 Inventory of Homes for Sale 2022 2023 -30.8% -35.0% -39.8% -12.0% Historical Median Sales Price - Rolling 12-Month Calculation 2022 2023 Local Market Update –
2023 Key Metrics 20222023 Percent Change 20222023 Percent Change New Listings 19 18 - 5.3% 41 44 + 7.3% Closed Sales 15 11 - 26.7%44 25 - 43.2% Median Sales Price* $619,000 $735,000 + 18.7%$713,750 $734,500 + 2.9% Percent of List Price Received* 103.0% 99.8% - 3.2%101.9% 98.4% - 3.5% Days on Market Until Sale 56 80 + 43.4%66 83 + 24.9% Inventory of Homes for Sale 10 15 + 50.0%-* Does not account for sale concessions and/or downpayment assistance. | Percent changes are calculated using rounded figures and can sometimes look extreme due to small sample size. March All MLS — Sea Pines — A Research Tool Provided by REsides, Inc. and the Hilton Head Area Association of REALTORS® Sea Pines Condos / Villas Only March Year to Date 19 15 18 11 Closed Sales $800,000 Historical Median Sales Price Rolling 12-Month Calculation $619,000 $735,000 Median Sales Price* 10 15 Inventory of Homes for Sale 2022 2023 -26.7% + 18.7% + 50.0% Condos/Villas Only Local Market Update – March 2023 Key Metrics 20222023 Percent Change 20222023 Percent Change New Listings 19 18 - 5.3% 41 44 + 7.3% Closed Sales 15 11 - 26.7%44 25 - 43.2% Median Sales Price* $619,000 $735,000 + 18.7%$713,750 $734,500 + 2.9% Percent of List Price Received* 103.0% 99.8% - 3.2%101.9% 98.4% - 3.5% Days on Market Until Sale 56 80 + 43.4%66 83 + 24.9% Inventory of Homes for Sale 10 15 + 50.0%-Does not account for sale concessions and/or downpayment assistance. Percent changes are calculated using rounded figures and can sometimes look extreme due to small sample size. March All MLS — Sea Pines — Current as of April 24, 2023. Data © 2023 REsides, INC. All Rights Reserved. Sponsored by South Carolina REALTORS®. Report © 2023 ShowingTime. A Research Tool Provided by REsides, Inc. and the Hilton Head Area Association of REALTORS® Sea Pines Condos / Villas Only March Year to Date 19 15 18 11 New Listings Closed Sales $0 $200,000 $400,000 $600,000 $800,000 4-201410-20144-201510-20154-201610-20164-201710-20174-201810-20184-201910-20194-202010-20204-202110-20214-202210-2022 Historical Median Sales Price Rolling 12-Month Calculation $619,000 $735,000 Median Sales Price* 10 15 Inventory of Homes for Sale 2022 2023 -5.3% -26.7% + 18.7% + 50.0%
March
Key Metrics 20222023 Percent Change 20222023 Percent Change New Listings 19 18 - 5.3% 41 44 + 7.3% Closed Sales 15 11 - 26.7%44 25 - 43.2% Median Sales Price* $619,000 $735,000 + 18.7%$713,750 $734,500 + 2.9% Percent of List Price Received* 103.0% 99.8% - 3.2%101.9% 98.4% - 3.5% Days on Market Until Sale 56 80 + 43.4%66 83 + 24.9% Inventory of Homes for Sale 10 15 + 50.0%-* Does not account for sale concessions and/or downpayment assistance. Percent changes are calculated using rounded figures and can sometimes look extreme due to small sample size. March All MLS — Sea Pines — Current as of April 24, 2023. Data © 2023 REsides, INC. All Rights Reserved. Sponsored by South Carolina REALTORS®. Report © 2023 ShowingTime. A Research Tool Provided by REsides, Inc. and the Hilton Head Area Association of REALTORS®
Local Market Update – March 2023
Condos / Villas Only March Year to Date 19 15 18 11 New Listings Closed Sales $0 $200,000 $400,000 $600,000 $800,000 4-201410-20144-201510-20154-201610-20164-201710-20174-201810-20184-201910-20194-202010-20204-202110-20214-202210-2022 Historical Median Sales Price Rolling 12-Month Calculation $619,000 $735,000 Median Sales Price* 10 15 Inventory of Homes for Sale 2022 2023 -5.3% -26.7% + 18.7% + 50.0%
Key Metrics 20222023 Percent Change 20222023 Percent Change New Listings 19 18 - 5.3% 41 44 + 7.3% Closed Sales 15 11 - 26.7%44 25 - 43.2% Median Sales Price* $619,000 $735,000 + 18.7%$713,750 $734,500 + 2.9% Percent of List Price Received* 103.0% 99.8% - 3.2%101.9% 98.4% - 3.5% Days on Market Until Sale 56 80 + 43.4%66 83 + 24.9% Inventory of Homes for Sale 10 15 + 50.0%-* Does not account for sale concessions and/or downpayment assistance. Percent changes are calculated using rounded figures and can sometimes look extreme due to small sample size. March All MLS — Sea Pines — Current as of April 24, 2023. Data © 2023 REsides, INC. All Rights Reserved. Sponsored by South Carolina REALTORS®. Report © 2023 ShowingTime. A Research Tool Provided by REsides, Inc. and the Hilton Head Area Association of REALTORS®
Condos / Villas Only March Year to Date 19 15 18 11 New Listings Closed Sales $0 $200,000 $400,000 $600,000 $800,000 4-201410-20144-201510-20154-201610-20164-201710-20174-201810-20184-201910-20194-202010-20204-202110-20214-202210-2022 Historical Median Sales Price Rolling 12-Month Calculation $619,000 $735,000 Median Sales Price* 10 15 Inventory of Homes for Sale 2022 2023 -5.3% -26.7% + 18.7% + 50.0% Historical Median Sales Price - Rolling 12-Month Calculation 2022 2023 Information Sponsored by Lindsay Bunting & Charlie Wilmot Lindsay – 843.816.6142 rltr2mom@aol.com Charlie – 843.816.6133 charlie@htcottage.com SEA PINES ALL MLS SEA PINES ALL MLS
Sea Pines
Report 26 A Research Tool Provided by REsides and the Hilton Head Area Association of REALTORS®
Sea Pines Real Estate Market


Lindsay – 843.816.6142 rltr2mom@aol.com Charlie – 843.816.6133 charlie@htcottage.com www.LindsayBunting.com 28 Old Military Road 3 BR + Bonus Room • 4 Full Baths. • Corner lot Pool • 2-car garage • HT 5th Tee
273 Stoney Creek Villas
UNDER CONTRACT UNDER CONTRACT Come visit us while you are at the Heritage!
2-story 1 BR Townhouse • 1 Full BA, 1 Powder Room Steps to Harbour Town • Marsh View • $484,000
Beautifully updated & professionally decorated 1 BR, 1 BA villa located on the 2nd floor with cathedral ceiling & private balcony overlooking tranquil pool & lagoon setting. Offered at $499,000 furn.


cell: 843-384-2919
Experience Matters. Local Experience Matters More! betty@bettyhemphill.com www.BettyHemphill.com


ann@annwebster.com


Charming original Sea Pines cottage on spectacular lot overlooking lagoon and Heron Point golf Course. Fun rental home & vacation getaway or tear down and build your dream home. Best priced property this close to the beach. Designated bike trail at end of cul de sac 10 minutes from the beach. 3 BR/3 ½ BA, Carolina room, Great room, carport with work room, pool. Terrific, centrally located residential neighborhood. $1,600,000. Fully furnished.
Welcome to the RBC Heritage of Golf! Stop by our tent on the 18th fairway of our office in Harbour Town for more real estate information.


Charming custom built 4 BR, 3.5 BA home with private pool & 2-car garage. Located on secluded dead-end street overlooking tidal creek. Offered at $1,100,000.


Spacious 3 BR, 3 BA plus large family room/study. Two garages with parking for 4 cars. All one level living on a half acre golf course lot. Offered at $995,000.

the
Carolyn Adams BROKER
Marsha Handy 843-816-6250 marsha@hhihomesbyhandy.com
Low BROKER
us show you some of the best properties in the Hilton Head Area 9 MIZZENMAST LANE SEA PINES HARBOURTOWN
In
heart of Harbour Town! Four bedroom, three and half baths with pool. A rental machine! Offered at $1,400,000 furnished.
The best move you can make 843-384-3636 CarolynAdams76@gmail.com www.CallCarolyn.com
Ingrid
Knowledge, Integrity, Experience, Success 843-384-7095 ingrid@ingridlow.com www.ingridlow.com Let
www .S ea P ine S R eal e S tate com
Hemphill
2411 LIGHTHOUSE TENNIS SEA PINES
Betty
22 Red Maple • Sea Pines
Ann Webster 843-384-5338
www . S ea P ine S R eal e S tate .
com
98 CLUB COURSE DR SEA PINES
Call me to list or find your home
CONTRACT
21 OYSTER LANDING RD SEA PINES
UNDER


Thurber Scott 843-301-4687 thurberscott@yahoo.com www . S ea P ine S R eal e S tate . com Dock Your Boat in the Middle of Harbourtown! #20 HARBOUR TOWN YACHT BASIN SLIP 60’ with 22’+ beam • $399,000 #12 HARBOUR TOWN YACHT BASIN SLIP 50’ premier slip • $330,000 Enjoy a unique lifestyle in a port known globally for it’s sophistication and style. Harbour Town Yacht Club membership included with these slips. Enjoy the club’s amenities, including the newly renovated rooftop bar-lounge with beautiful deep water views. To find out more about boatslips on Hilton Head Island, call Thurber Scott – an islander & lowcountry boater for over 40 years SOLD SOLD Eva Sheres is an experienced, local Realtor with over 20 years experience in sales. She has your best interest in mind! Eva Sheres 443.454.2704 hiltonheadhomes@sheres.com If you are looking to buy or sell a home in the Hilton Head area, let’s talk! LICENSED IN MARYLAND AND SOUTH CAROLINA Beautiful long lagoon views in a private setting from this 3 BR, 3 BA villa in Carolina Place. Light & bright end unit with hardwood floors. Offered fully furnished and ready to enjoy! $599,000 UNDER CONTRACT 3404 Carolina Place • Sea Pines For a FREE Copy, Call (843) 785-7272 or e-mail info@media360.com or Stop by your Real Estate Office or Builder Suppliers - ESPY • Grayco Visit our updated website for NEW articles and NEW tips: www.lowcountryhome.com • Checklists for choosing an Architect, Builder or Remodelor • Home Planning Guide • Helpful Articles and Tips • New Homebuilding & Remodeling Guide • Hilton Head Area Home Builders Association Membership Directory • And More! Look for your copy of the 2023/2024 LowCountry Home coming soon and visit our website for more information on lowcountry living! GET NOTICED! Be a part of the next issue - email or call us to find out how! LowCountry Home The Publication of the Area Home Builders Association Building Remodeling Kitchens Baths Windows Architecture Interior Design Flooring Pools & More SOLUTIONS Twenty-eighth Edition 2022/2023 Cover.indd 11:52 New Articles & Tips! Great Ideas For Your Home! Home built by Randy Jeffcoat Builders
&Real Estate LOWCOUNTRY LIVING
THE REPORT
A Quarterly Market Report for Hilton Head, Bluffton, Beaufort County & Jasper County

LOWCOUNTRY LIVING
&Real Estate
THE REPORT
May Cover Photo
Jeff Keefer
https://www.vividgalleryhhi.com/

VIVID Gallery is a nonprofit organization which sells the fine art photography of Jeff Keefer. All the proceeds of VIVID are donated to the Michael J. Fox Foundation.
Editors
Dan Monroe Deb Monroe
Sales & Marketing
Dan Monroe, Deborah Monroe, Beverly Thompson
Graphic Design & Pre-Press
Stephanie Williams
HiltonHead360
Dan Monroe Deb Monroe
Photo on this Page
Provided by Media Solutions 360
View Lowcountry Living & Real Estate Magazine at http://www.hiltonhead360.com/magazine Or visit www.hiltonhead360.com Lowcountryhome.com
LOWCOUNTRY LIVING
&Real Estate
Mailing address: PO Box 5850, Hilton Head Island, SC 29938
Advertisers please call 843-785-7272 or 866-462-1497
Equal Housing Opportunity
All real estate advertising in this magazine is subject to the Federal Fair Housing Act of 1968, as amended, which makes it illegal to advertise “any preference, limitation, or discrimination based on race, religion, sex, handicap, familial status, or national origin, or an intention to make any such preference, limitation or discrimination.” This magazine will not knowingly accept any advertising for real estate which is in violation of the law. Our readers are hereby informed that all dwellings in this magazine are available on an equal opportunity basis.
Information concerning properties in this publication is provided by various advertisers to the publisher. The publisher has made no effort to verify the accuracy of said advertisements. The publisher makes no representation or warranty as to the truthfulness or accuracy of said information. The publisher is not responsible for errors or omissions as to any information contained herein concerning any property. Readers are strongly urged to contact the appropriate parties for specific information on any property listed or described herein.
John 10:10
I N S I D E
30
“I leave the gift of peace with you-my peace. Not the kind of fragile peace given by the world, but my perfect peace...”
John 14:27 (The Passion Translation)
Local Market Update – March 2023
Local Market Update – March 2023 21 21
Historical Median Sales Price Rolling 12-Month Calculation $679,000 $840,000 Median Sales Price* 8 24 Inventory of Homes for Sale 2022 2023 + 38.1% + 9.5% + 23.7% + 200.0%
$900,000
$800,000
$700,000
$600,000
$500,000
Hilton 29 23 New Listings Closed Sales $200,000

Hilton Head Plantation $300,000

$400,000
4-201410-20144-201510-20154-201610-20164-201710-20174-201810-20184-201910-20194-202010-20204-202110-20214-202210-2022
March Year to Date * Does not account for sale concessions and/or downpayment assistance. | Percent changes are calculated using rounded figures and can sometimes look extreme due to small sample size. March All MLS — Hilton Head Plantation — Current as of April 24, 2023. Data © 2023 REsides, INC. All Rights Reserved. | Sponsored by South Carolina REALTORS®. Report © 2023 ShowingTime. 21 21 29 23 New Listings Closed Sales $200,000 $300,000 $400,000 $500,000 $600,000 $700,000 $800,000 $900,000 4-201410-20144-201510-20154-201610-20164-201710-20174-201810-20184-201910-20194-202010-20204-202110-20214-202210-2022 Historical Median Sales Price Rolling 12-Month Calculation $679,000 $840,000 Median Sales Price* 8 24 Inventory of Homes for Sale 2022 2023 + 38.1% + 9.5% + 23.7% + 200.0% Key Metrics 20222023 Percent Change 20222023 Percent Change New Listings 21 29 + 38.1%65 64 - 1.5% Closed Sales 21 23 + 9.5% 50 37 - 26.0% Median Sales Price* $679,000 $840,000 + 23.7%$679,500 $840,000 + 23.6% Percent of List Price Received* 101.6% 97.4% - 4.1%102.5% 97.2% - 5.2% Days on Market Until Sale 54 78 + 44.4%57 87 + 52.6% Inventory of Homes for Sale 8 24 + 200.0%-- -Hilton Head Area Association of REALTORS® Hilton Head Plantation March Year to Date * Does not account for sale concessions and/or downpayment assistance. | Percent changes are calculated using rounded figures and can sometimes look extreme due to small sample size. March All MLS — Hilton Head Plantation — Current as of April 24, 2023. Data © 2023 REsides, INC. All Rights Reserved. | Sponsored by South Carolina REALTORS®. Report © 2023 ShowingTime. 21 21 29 23 New Listings Closed Sales $200,000 $300,000 $400,000 $500,000 $600,000 $700,000 $800,000 $900,000
Information Sponsored by
DICK PATRICK (843) 384-4020

Dick@CharterOneRealty.com
ROB MOORE (843) 384-5118
robmoore@CharterOneRealty.com
KIM FRANCE (513) 476-2658
KimFrance@CharterOneRealty.com

Local Market Update – March 2023 Key Metrics 20222023 Percent Change 20222023 Percent Change New Listings 21 29 + 38.1%65 64 - 1.5% Closed Sales 21 23 + 9.5% 50 37 - 26.0% Median Sales Price* $679,000 $840,000 + 23.7%$679,500 $840,000 + 23.6% Percent of List Price Received* 101.6% 97.4% - 4.1%102.5% 97.2% - 5.2% Days on Market Until Sale 54 78 + 44.4%57 87 + 52.6% Inventory of Homes for Sale 8 24 + 200.0%-A Research Tool Provided by REsides, Inc. and the Hilton Head Area Association of REALTORS®
Plantation
Hilton Head
* Does not account for sale concessions and/or downpayment assistance. | Percent changes are calculated using rounded figures and can sometimes look extreme due to small sample size. March All MLS — Hilton Head Plantation — Current as of April 24, 2023. Data © 2023 REsides, INC. All Rights Reserved. | Sponsored by South Carolina REALTORS®. | Report © 2023 ShowingTime. 21 21 29 23 New Listings Closed Sales $200,000 $300,000 $400,000 $500,000 $600,000 $700,000 $800,000 $900,000 4-201410-20144-201510-20154-201610-20164-201710-20174-201810-20184-201910-20194-202010-20204-202110-20214-202210-2022 Historical Median Sales Price Rolling 12-Month Calculation $679,000 $840,000 Median Sales Price* 8 24 Inventory of Homes for Sale 2022 2023 + 38.1% + 9.5% + 23.7% + 200.0% Real Estate Market Report Hilton Head Plantation
Local Market Update
2023 Key Metrics 20222023 Percent Change 20222023 Percent Change New Listings 21 29 + 38.1%65 64 - 1.5% Closed Sales 21 23 + 9.5% 50 37 - 26.0% Median Sales Price* $679,000 $840,000 + 23.7%$679,500 $840,000 + 23.6% Percent of List Price Received* 101.6% 97.4% - 4.1%102.5% 97.2% - 5.2% Days on Market Until Sale 54 78 + 44.4%57 87 + 52.6% Inventory of Homes for Sale 8 24 + 200.0%-A Research Tool Provided by REsides, Inc. and the Hilton Head Area Association of REALTORS® Hilton Head Plantation March Year to Date * Does not account for sale concessions and/or downpayment assistance. | Percent changes are calculated using rounded figures and can sometimes look extreme due to small sample size. March All MLS — Hilton Head Plantation — Current as of April 24, 2023. Data © 2023 REsides, INC. All Rights Reserved. | Sponsored by South Carolina REALTORS®. | Report © 2023 ShowingTime. 21 21 29 23 New Listings Closed Sales $200,000 $300,000 $400,000 $500,000 $600,000 $700,000 $800,000 $900,000 4-201410-20144-201510-20154-201610-20164-201710-20174-201810-20184-201910-20194-202010-20204-202110-20214-202210-2022 Historical Median Sales Price Rolling 12-Month Calculation $679,000 $840,000 Median Sales Price* 8 24 Inventory of Homes for Sale 2022 2023 + 38.1% + 9.5% + 23.7% + 200.0%
March Year to Date
| March 2023
– March
Key Metrics 20222023 Percent Change 20222023 Percent Change New Listings 21 29 + 38.1%65 64 - 1.5% Closed Sales 21 23 + 9.5% 50 37 - 26.0% Median Sales Price* $679,000 $840,000 + 23.7%$679,500 $840,000 + 23.6% Percent of List Price Received* 101.6% 97.4% - 4.1%102.5% 97.2% - 5.2% Days on Market Until Sale 54 78 + 44.4%57 87 + 52.6% Inventory of Homes for Sale 8 24 + 200.0%-A Research Tool Provided by REsides, Inc. and the Hilton Head Area Association of REALTORS®
Head Plantation March Year to Date * Does not account for sale concessions and/or downpayment assistance. | Percent changes are calculated using rounded figures and can sometimes look extreme due to small sample size. March All MLS — Hilton Head Plantation — Current as of April 24, 2023. Data © 2023 REsides, INC. All Rights Reserved. | Sponsored by South Carolina REALTORS®. | Report © 2023 ShowingTime. 21 21 29 23 New Listings Closed Sales $200,000 $300,000 $400,000 $500,000 $600,000 $700,000 $800,000 $900,000 4-201410-20144-201510-20154-201610-20164-201710-20174-201810-20184-201910-20194-202010-20204-202110-20214-202210-2022 Historical Median Sales Price Rolling 12-Month Calculation $679,000 $840,000 Median Sales Price* 8 24 Inventory of Homes for Sale 2022 2023 + 38.1% + 9.5% + 23.7% + 200.0% Local Market Update – March 2023 Key Metrics 20222023 Percent Change 20222023 Percent Change New Listings 21 29 + 38.1%65 64 - 1.5% Closed Sales 21 23 + 9.5% 50 37 - 26.0% Median Sales Price* $679,000 $840,000 + 23.7%$679,500 $840,000 + 23.6% Percent of List Price Received* 101.6% 97.4% - 4.1%102.5% 97.2% - 5.2% Days on Market Until Sale 54 78 + 44.4%57 87 + 52.6% Inventory of Homes for Sale 8 24 + 200.0%-A Research Tool Provided by REsides, Inc. and the Hilton Head Area Association of REALTORS®
Detached Homes Only March Year to Date * Does not account for sale concessions and/or downpayment assistance. | Percent changes are calculated using rounded figures and can sometimes look extreme due to small sample size. March All MLS — Hilton Head Plantation — Current as of April 24, 2023. Data © 2023 REsides, INC. All Rights Reserved. | Sponsored by South Carolina REALTORS®. Report © 2023 ShowingTime.
Key Metrics 20222023 Percent Change 20222023 Percent Change New Listings 21 29 + 38.1%65 64 - 1.5% Closed Sales 21 23 + 9.5% 50 37 - 26.0% Median Sales Price* $679,000 $840,000 + 23.7%$679,500 $840,000 + 23.6% Percent of List Price Received* 101.6% 97.4% - 4.1%102.5% 97.2% - 5.2% Days on Market Until Sale 54 78 + 44.4%57 87 + 52.6% Inventory of Homes for Sale 8 24 + 200.0%-A Research Tool Provided by REsides, Inc. and the Hilton Head Area Association of REALTORS®
Historical Median Sales Price Rolling 12-Month Calculation $679,000 $840,000 Median Sales Price* 8 24 Inventory of Homes for Sale 2022 2023 + 38.1% + 9.5% + 23.7% + 200.0% Historical Median Sales Price - Rolling 12-Month Calculation 2022 2023 Hilton Head Plantation Real Estate Market Report 31
Hilton Head Plantation
4-201410-20144-201510-20154-201610-20164-201710-20174-201810-20184-201910-20194-202010-20204-202110-20214-202210-2022
HILTON HEAD PLANTATION ALL MLS
A Research Tool Provided by REsides and the Hilton Head Area Association of REALTORS®
LAWRENCE TAYLOR (843) 338-6511
Lawrence@CharterOneRealty.com
Indigo Run
Real Estate Market


Indigo Run
Local Market Update – March 2023
Report Indigo Run | March 2023 Local Market Update – March 2023
Local Market Update – March 2023
Local Market Update – March 2023

Detached Homes Only
Indigo Run
* Does
Year to Date
March Year to Date
* Does not account for sale concessions and/or downpayment assistance. | Percent changes are calculated using rounded figures and can sometimes look extreme due to small sample size.
4-201410-20144-201510-20154-201610-20164-201710-20174-201810-20184-201910-20194-202010-20204-202110-20214-202210-2022
Local Market Update – March 2023 Key Metrics 20222023 Percent Change 20222023 Percent Change New Listings 3 5 + 66.7% 7 14 + 100.0% Closed Sales 1 4 + 300.0%6 8 + 33.3% Median Sales Price* $1,400,000 $845,000 - 39.6%$842,500 $845,000 + 0.3% Percent of List Price Received* 112.0% 99.1% - 11.5%101.2% 98.4% - 2.8% Days on Market Until Sale 49 73 + 49.0%70 80 + 14.3% Inventory of Homes for Sale 4 6 + 50.0%-- -A Research Tool Provided by REsides, Inc. and the Hilton Head Area Association of REALTORS®
All MLS — Indigo Run — Current as of April 24, 2023. Data © 2023 REsides, INC. All Rights Reserved. | Sponsored by South Carolina REALTORS®. | Report © 2023 ShowingTime. 3 1 5 4 New Listings Closed Sales $200,000 $400,000 $600,000 $800,000 $1,000,000 $1,200,000 4-201410-20144-201510-20154-201610-20164-201710-20174-201810-20184-201910-20194-202010-20204-202110-20214-202210-2022 Historical Median Sales Price Rolling 12-Month Calculation $1,400,000 $845,000 Median Sales Price* 4 6 Inventory of Homes for Sale 2022 2023 + 66.7% + 300.0% -39.6% + 50.0%
March
Key Metrics 20222023 Percent Change 20222023 New Listings 3 5 + 66.7% 7 14 Closed Sales 1 4 + 300.0%6 8 Median Sales Price* $1,400,000 $845,000 - 39.6%$842,500 $845,000 Percent of List Price Received* 112.0% 99.1% - 11.5%101.2% 98.4% Days on Market Until Sale 49 73 + 49.0%70 80 Inventory of Homes for Sale 4 6 + 50.0%-A Research Tool Provided by REsides, Inc. and the Hilton Head Area Association of REALTORS®
March Year to Date * Does not account for sale concessions and/or downpayment assistance. | Percent changes are calculated using rounded figures and can sometimes look extreme due to small sample size. March Indigo Current as of April 24, 2023. Data © 2023 REsides, INC. All Rights Reserved. | Sponsored by South Carolina REALTORS®. | Report © 3 1 5 4 New Listings Closed Sales $200,000 $400,000 $600,000 $800,000 $1,000,000 $1,200,000 4-201410-20144-201510-20154-201610-20164-201710-20174-201810-20184-201910-20194-202010-20204-202110-20214-202210-2022 Historical Median Sales Price Rolling 12-Month Calculation $1,400,000 $845,000 Median Sales Price* 4 Inventory of Homes 2022 + 66.7% + 300.0% -39.6% + 50.0%
Indigo Run
Key Metrics 20222023 Percent Change 20222023 Percent Change New Listings 3 5 + 66.7% 7 14 + 100.0% Closed Sales 1 4 + 300.0%6 8 + 33.3% Median Sales Price* $1,400,000 $845,000 - 39.6%$842,500 $845,000 + 0.3% Percent of List Price Received* 112.0% 99.1% - 11.5%101.2% 98.4% - 2.8% Days on Market Until Sale 49 73 + 49.0%70 80 + 14.3% Inventory of Homes for Sale 4 6 + 50.0%-- -A Research Tool Provided by REsides, Inc. and the Hilton Head Area Association of REALTORS® Indigo Run March Year to Date * Does not account for sale concessions and/or downpayment assistance. | Percent changes are calculated using rounded figures and can sometimes look extreme due to small sample size. March All MLS — Indigo Run — Current as of April 24, 2023. Data © 2023 REsides, INC. All Rights Reserved. | Sponsored by South Carolina REALTORS®. | Report © 2023 ShowingTime. 3 1 5 4 New Listings Closed Sales $200,000 $400,000 $600,000 $800,000 $1,000,000 $1,200,000 4-201410-20144-201510-20154-201610-20164-201710-20174-201810-20184-201910-20194-202010-20204-202110-20214-202210-2022 Historical Median Sales Price Rolling 12-Month Calculation $1,400,000 $845,000 Median Sales Price* 4 6 Inventory of Homes for Sale 2022 2023 + 66.7% + 300.0% -39.6% + 50.0%
Key Metrics 20222023 Percent Change 20222023 Percent Change New Listings 3 5 + 66.7% 7 14 + 100.0% Closed Sales 1 4 + 300.0%6 8 + 33.3% Median Sales Price* $1,400,000 $845,000 - 39.6%$842,500 $845,000 + 0.3% Percent of List Price Received* 112.0% 99.1% - 11.5%101.2% 98.4% - 2.8% Days on Market Until Sale 49 73 + 49.0%70 80 + 14.3% Inventory of Homes for Sale 4 6 + 50.0%-A Research Tool Provided by REsides, Inc. and the Hilton Head Area Association of REALTORS®
March Year to Date * Does not account for sale concessions and/or downpayment assistance. Percent changes are calculated using rounded figures and can sometimes look extreme due to small sample size. March All MLS — Indigo Run — Current as of April 24, 2023. Data © 2023 REsides, INC. All Rights Reserved. Sponsored by South Carolina REALTORS®. Report © 2023 ShowingTime. 3 1 5 4 New Listings Closed Sales $200,000 $400,000 $600,000 $800,000 $1,000,000 $1,200,000
Indigo Run
Historical Median Sales Price Rolling 12-Month Calculation $1,400,000 $845,000 Median Sales Price* 4 6 Inventory of Homes for Sale 2022 2023 + 66.7% + 300.0% -39.6% + 50.0%
Key Metrics 20222023 Percent Change 20222023 Percent Change New Listings 3 5 + 66.7% 14 + 100.0% Closed Sales 1 4 + 300.0%6 8 + 33.3% Median Sales Price* $1,400,000 $845,000 - 39.6%$842,500 $845,000 + 0.3% Percent of List Price Received* 112.0% 99.1% - 11.5%101.2% 98.4% - 2.8% Days on Market Until Sale 49 73 + 49.0%70 80 + 14.3% Inventory of Homes for Sale 4 6 + 50.0%-A Research Tool Provided by REsides, Inc. and the Hilton Head Area Association of REALTORS®
March Year to Date * Does not account for sale concessions and/or downpayment assistance. | Percent changes are calculated using rounded figures and can sometimes look extreme due to small sample size. March All MLS — Indigo Run — Current as of April 24, 2023. Data © 2023 REsides, INC. All Rights Reserved. Sponsored by South Carolina REALTORS®. Report © 2023 ShowingTime. 3 1 5 4 New Listings Closed Sales $200,000 $400,000 $600,000 $800,000 $1,000,000 $1,200,000 4-201410-20144-201510-20154-201610-20164-201710-20174-201810-20184-201910-20194-202010-20204-202110-20214-202210-2022 Historical Median Sales Price Rolling 12-Month Calculation $1,400,000 $845,000 Median Sales Price* 4 6 Inventory of Homes for Sale 2022 2023 + 66.7% + 300.0% -39.6% + 50.0% Local Market Update – March 2023 Key Metrics 20222023 Percent Change 20222023 Percent Change New Listings 3 5 + 66.7% 7 14 + 100.0% Closed Sales 1 4 + 300.0%6 8 + 33.3% Median Sales Price* $1,400,000 $845,000 - 39.6%$842,500 $845,000 + 0.3% Percent of List Price Received* 112.0% 99.1% - 11.5%101.2% 98.4% - 2.8% Days on Market Until Sale 49 73 + 49.0%70 80 + 14.3% Inventory of Homes for Sale 4 6 + 50.0%-A Research Tool Provided by REsides, Inc. and the Hilton Head Area Association of REALTORS®
March
not account for sale concessions and/or downpayment assistance. | Percent changes are calculated using rounded figures and can sometimes look extreme due to small sample size. March All MLS — Indigo Run — Current as of April 24, 2023. Data © 2023 REsides, INC. All Rights Reserved. | Sponsored by South Carolina REALTORS®. | Report © 2023 ShowingTime. 3 1 5 4 New Listings Closed Sales $200,000 $400,000 $600,000 $800,000 $1,000,000 $1,200,000 4-201410-20144-201510-20154-201610-20164-201710-20174-201810-20184-201910-20194-202010-20204-202110-20214-202210-2022 Historical Median Sales Price Rolling 12-Month Calculation $1,400,000 $845,000 Median Sales Price* 4 6 Inventory of Homes for Sale 2022 2023 + 66.7% + 300.0% -39.6% + 50.0% Historical Median Sales Price - Rolling 12-Month Calculation 2022 2023 Indigo Run Real Estate Market Report Information Sponsored by INDIGO RUN ALL MLS 32 A Research Tool Provided by REsides and the Hilton Head Area Association of REALTORS® Drew Butler 843.384.8637 Drew@DrewButler.com DrewButler.com


See all of Drew’s listings at DrewButler.com DREW BUTLER 843.384.8637 DREW@DREWBUTLER.COM DREW BUTLER 843.384.8637 Drew@DrewButler.com #1 Agent in Indigo Run 2018-2022 DREW BUTLER 843.384.8637 DREW@DREWBUTLER.COM 3 Balmoral Place Indigo Run View of Picturesque 11th Hole 4 Bedrooms | 4.5 Baths |4,449 Sq Ft Soaring Ceilings | Office | Main & Guest Bedroom on 1st Floor $1,650,000 23 Whitney Place Indigo Run Gorgeous Crystal Lake Water Views 3 Bedroom | 3 Bath | 3,795 Sq Ft Owner’s Wing w/ Office/Exercise Rm Bonus/Guest Room with Private Bath over Garage $1,295,000 688 Colonial Drive Indigo Run Long Golf Views of the 14th Hole 4 Bedrooms | 4.5 Baths | 4,875 Sq ft Study | Bonus | Carolina Room $1,500,000 225 Berwick Drive Indigo Run Terrace overlooking 18th Fairway 4 Bedroom | 4 Baths | 3,010 sq ft Lock-and-Leave Lifestyle Rarely Available $995,000 SOLD 3 Pond Drive Indigo Run Lot with Tremendous Privacy .89 Acres Overlooks Legacy Woods in The Golf Club of Indigo Run $295,000 58 Wedgefield Drive Indigo Run Pool & Golf Views 4 Bedrooms | 4 Baths | 3,029 sq ft Courtyard Pool | Screened-in Porch Separate Cabana Room/Guest Suite $875,000 • Put 50 Years of Local Networking to Work For You • 38 Years of Helping Buyers and Sellers in the Lowcountry • Consistently Top 2% of Area Agents and Teams UNDERCONTRACT
Windmill Harbour
Local Market Update – March 2023
Local Market Update – March 2023
Local Market Update – March 2023


Windmill Harbour
Detached Homes Only
Windmill Harbour
Local Market Update – March 2023 Key Metrics 20222023 Percent Change 20222023 Percent Change New Listings 2 5 + 150.0%7 9 + 28.6% Closed Sales 3 2 - 33.3% 8 2 - 75.0% Median Sales Price* $681,000 $1,225,000 + 79.9%$665,000 $1,225,000 + 84.2% Percent of List Price Received* 97.1% 100.0% + 3.0%97.5% 100.0% + 2.6% Days on Market Until Sale 64 45 - 29.7%67 45 - 32.8% Inventory of Homes for Sale 3 7 + 133.3%-A Research Tool Provided by REsides, Inc. and the Hilton Head Area Association of REALTORS®
Harbour March
* Does not account for sale concessions and/or downpayment assistance. | Percent changes are calculated using rounded figures and can sometimes look extreme due to small sample size. March All MLS — Windmill Harbour — Current as of April 24, 2023. Data © 2023 REsides, INC. All Rights Reserved. | Sponsored by South Carolina REALTORS®. | Report © 2023 ShowingTime. 2 3 5 2 New Listings Closed Sales $200,000 $400,000 $600,000 $800,000 $1,000,000 4-201410-20144-201510-20154-201610-20164-201710-20174-201810-20184-201910-20194-202010-20204-202110-20214-202210-2022 Historical Median Sales Price Rolling 12-Month Calculation $681,000 $1,225,000 Median Sales Price* 3 7 Inventory of Homes for Sale 2022 2023 + 150.0% -33.3% + 79.9% + 133.3%
Windmill
Year to Date
Key Metrics 20222023 Percent Change 20222023 New Listings 2 5 + 150.0%7 9 Closed Sales 3 2 - 33.3% 8 2 Median Sales Price* $681,000 $1,225,000 + 79.9%$665,000 $1,225,000 Percent of List Price Received* 97.1% 100.0% + 3.0%97.5% 100.0% Days on Market Until Sale 64 45 - 29.7%67 45 Inventory of Homes for Sale 3 7 + 133.3%-A Research Tool Provided by REsides, Inc. and the Hilton Head Area Association of REALTORS®
Real Estate Market Report Windmill Harbour | March 2023 Local Market Update – March 2023
March Year to Date * Does not account for sale concessions and/or downpayment assistance. | Percent changes are calculated using rounded figures and can sometimes look extreme due to small sample size. March Windmill Harbour Current as of April 24, 2023. Data © 2023 REsides, INC. All Rights Reserved. Sponsored by South Carolina REALTORS®. | Report © 2 3 5 2 New Listings Closed Sales $200,000 $400,000 $600,000 $800,000 $1,000,000 4-201410-20144-201510-20154-201610-20164-201710-20174-201810-20184-201910-20194-202010-20204-202110-20214-202210-2022 Historical Median Sales Price Rolling 12-Month Calculation $681,000 $1,225,000 Median Sales Price* 3 Inventory of Homes 2022 + 150.0% -33.3% + 79.9% + 133.3%
Key Metrics 20222023 Percent Change 20222023 Percent Change New Listings 2 5 + 150.0%7 9 + 28.6% Closed Sales 3 2 - 33.3% 8 2 - 75.0% Median Sales Price* $681,000 $1,225,000 + 79.9%$665,000 $1,225,000 + 84.2% Percent of List Price Received* 97.1% 100.0% + 3.0%97.5% 100.0% + 2.6% Days on Market Until Sale 64 45 - 29.7%67 45 - 32.8% Inventory of Homes for Sale 3 7 + 133.3%-- -A Research Tool Provided by REsides, Inc. and the Hilton Head Area Association of REALTORS®
Year to Date * Does not account for sale concessions and/or downpayment assistance. | Percent changes are calculated using rounded figures and can sometimes look extreme due to small sample size. March All MLS — Windmill Harbour — Current as of April 24, 2023. Data © 2023 REsides, INC. All Rights Reserved. | Sponsored by South Carolina REALTORS®. Report © 2023 ShowingTime. 2 3 5 2 New Listings Closed Sales $200,000 $400,000 $600,000 $800,000 $1,000,000 4-201410-20144-201510-20154-201610-20164-201710-20174-201810-20184-201910-20194-202010-20204-202110-20214-202210-2022 Historical Median Sales Price Rolling 12-Month Calculation $681,000 $1,225,000 Median Sales Price* 3 7 Inventory of Homes for Sale 2022 2023 + 150.0% -33.3% + 79.9% + 133.3%
Windmill Harbour March
Key Metrics 20222023 Percent Change 20222023 Percent Change New Listings 2 5 + 150.0%7 9 + 28.6% Closed Sales 3 2 - 33.3% 8 2 - 75.0% Median Sales Price* $681,000 $1,225,000 + 79.9%$665,000 $1,225,000 + 84.2% Percent of List Price Received* 97.1% 100.0% + 3.0%97.5% 100.0% + 2.6% Days on Market Until Sale 64 45 - 29.7%67 45 - 32.8% Inventory of Homes for Sale 3 7 + 133.3%-A Research Tool Provided by REsides, Inc. and the Hilton Head Area Association of REALTORS®
Year to Date * Does not account for sale concessions and/or downpayment assistance. | Percent changes are calculated using rounded figures and can sometimes look extreme due to small sample size. March All MLS — Windmill Harbour — Current as of April 24, 2023. Data © 2023 REsides, INC. All Rights Reserved. Sponsored by South Carolina REALTORS®. | Report © 2023 ShowingTime. 2 3 5 2 New Listings Closed Sales $200,000 $400,000 $600,000 $800,000 $1,000,000 4-201410-20144-201510-20154-201610-20164-201710-20174-201810-20184-201910-20194-202010-20204-202110-20214-202210-2022 Historical Median Sales Price Rolling 12-Month Calculation $681,000 $1,225,000 Median Sales Price* 3 7 Inventory of Homes for Sale 2022 2023 + 150.0% -33.3% + 79.9% + 133.3%
March
Key Metrics 20222023 Percent Change 20222023 Percent Change New Listings 2 5 + 150.0%7 9 + 28.6% Closed Sales 3 2 - 33.3% 8 2 - 75.0% Median Sales Price* $681,000 $1,225,000 + 79.9%$665,000 $1,225,000 + 84.2% Percent of List Price Received* 97.1% 100.0% + 3.0%97.5% 100.0% + 2.6% Days on Market Until Sale 64 45 - 29.7%67 45 - 32.8% Inventory of Homes for Sale 3 7 + 133.3%-A Research Tool Provided by REsides, Inc. and the Hilton Head Area Association of REALTORS®
March Year to Date * Does not account for sale concessions and/or downpayment assistance. Percent changes are calculated using rounded figures and can sometimes look extreme due to small sample size. March All MLS — Windmill Harbour — Current as of April 24, 2023. Data © 2023 REsides, INC. All Rights Reserved. | Sponsored by South Carolina REALTORS®. | Report © 2023 ShowingTime. 2 3 5 2 New Listings Closed Sales $200,000 $400,000 $600,000 $800,000 $1,000,000 4-201410-20144-201510-20154-201610-20164-201710-20174-201810-20184-201910-20194-202010-20204-202110-20214-202210-2022 Historical Median Sales Price Rolling 12-Month Calculation $681,000 $1,225,000 Median Sales Price* 3 7 Inventory of Homes for Sale 2022 2023 + 150.0% -33.3% + 79.9% + 133.3% Key Metrics 20222023 Percent Change 20222023 Percent Change New Listings 2 5 + 150.0%7 9 + 28.6% Closed Sales 3 2 - 33.3% 8 2 - 75.0% Median Sales Price* $681,000 $1,225,000 + 79.9%$665,000 $1,225,000 + 84.2% Percent of List Price Received* 97.1% 100.0% + 3.0%97.5% 100.0% + 2.6% Days on Market Until Sale 64 45 - 29.7%67 45 - 32.8% Inventory of Homes for Sale 3 7 + 133.3%-A Research Tool Provided by REsides, Inc. and the Hilton Head Area Association of REALTORS®
Windmill Harbour
March
* Does not account for sale concessions and/or downpayment assistance. | Percent changes are calculated using rounded figures and can sometimes look extreme due to small sample size. March All MLS — Windmill Harbour — Current as of April 24, 2023. Data © 2023 REsides, INC. All Rights Reserved. | Sponsored by South Carolina REALTORS®. | Report © 2023 ShowingTime. 2 3 5 2 New Listings Closed Sales $200,000 $400,000 $600,000 $800,000 $1,000,000 4-201410-20144-201510-20154-201610-20164-201710-20174-201810-20184-201910-20194-202010-20204-202110-20214-202210-2022 Historical Median Sales Price Rolling 12-Month Calculation $681,000 $1,225,000 Median Sales Price* 3 7 Inventory of Homes for Sale 2022 2023 + 150.0% -33.3% + 79.9% + 133.3% Historical Median Sales Price - Rolling 12-Month Calculation 2022 2023 Windmill Harbour Real Estate Market Report 34 Information Sponsored by Lonnie Goulet 843-338-0094 lonniegoulet@gmail.com WINDMILL HARBOUR ALL MLS
Research Tool
REsides
Year to Date
A
Provided by
and the Hilton Head Area Association of REALTORS®
Local Market Update – March 2023
Real Estate Market Report
Colleton River | March 2023
Local Market Update – March 2023
Colleton River
Key Metrics 20222023 Percent Change 20222023 Percent Change New Listings 9 1 - 88.9%21 8 - 61.9% Closed Sales 2 0 - 100.0%7 6 - 14.3% Median Sales Price* $1,479,500 $0 - 100.0%$1,367,000 $1,672,500 + 22.3% Percent of List Price Received* 96.2% 0.0% - 100.0%96.3% 95.0% - 1.3% Days on Market Until Sale 69 0 - 100.0%115 136 + 18.3% Inventory of Homes for Sale 13 8 - 38.5% A Research Tool Provided by REsides, Inc. and the Hilton Head Area Association of REALTORS®
Key Metrics 20222023 Percent Change 20222023 Percent Change New Listings 9 1 - 88.9%21 8 - 61.9% Closed Sales 2 0 - 100.0%7 6 - 14.3% Median Sales Price* $1,479,500 $0 - 100.0%$1,367,000 $1,672,500 + 22.3% Percent of List Price Received* 96.2% 0.0% - 100.0%96.3% 95.0% - 1.3% Days on Market Until Sale 69 0 - 100.0%115 136 + 18.3% Inventory of Homes for Sale 13 8 - 38.5% A Research Tool Provided by REsides, Inc. and the Hilton Head Area Association of REALTORS®
March Year to Date
Historical Median Sales Price Rolling 12-Month Calculation
$1,500,000
$1,250,000
$1,000,000
Local Market Update – March 2023 9 2 1 0 New Listings Closed Sales $250,000

Colleton River $500,000
2022 2023 -88.9% -100.0% -100.0% -38.5%
$1,479,500 $0 Median Sales Price*
13 8 Inventory of Homes for Sale
$750,000
March Year to Date * Does not account for sale concessions and/or downpayment assistance. | Percent changes are calculated using rounded figures and can sometimes look extreme due to small sample size. March All MLS — Colleton River — Current as of April 24, 2023. Data © 2023 REsides, INC. All Rights Reserved. | Sponsored by South Carolina REALTORS®. | Report © 2023 ShowingTime. 9 2 1 0 New Listings Closed Sales $250,000 $500,000 $750,000 $1,000,000 $1,250,000 $1,500,000 $1,750,000

$1,750,000 4-201410-20144-201510-20154-201610-20164-201710-20174-201810-20184-201910-20194-202010-20204-202110-20214-202210-2022
Local Market Update – March 2023 Key Metrics 20222023 Percent Change 20222023 Percent Change New Listings 9 1 - 88.9%21 8 - 61.9% Closed Sales 2 0 - 100.0%7 6 - 14.3% Median Sales Price* $1,479,500 $0 - 100.0%$1,367,000 $1,672,500 + 22.3% Percent of List Price Received* 96.2% 0.0% - 100.0%96.3% 95.0% - 1.3% Days on Market Until Sale 69 0 - 100.0%115 136 + 18.3% Inventory of Homes for Sale 13 8 - 38.5% A Research Tool Provided by REsides, Inc. and the Hilton Head Area Association of REALTORS® Colleton River March
* Does not account for sale concessions and/or downpayment assistance. | Percent changes are calculated using rounded figures and can sometimes look extreme due to small sample size. March All MLS — Colleton River — Current as of April 24, 2023. Data © 2023 REsides, INC. All Rights Reserved. | Sponsored by South Carolina REALTORS®. | Report © 2023 ShowingTime. 9 2 1 0 New Listings Closed Sales $250,000 $500,000 $750,000 $1,000,000 $1,250,000 $1,500,000 $1,750,000 4-201410-20144-201510-20154-201610-20164-201710-20174-201810-20184-201910-20194-202010-20204-202110-20214-202210-2022 Historical Median Sales Price Rolling 12-Month Calculation $1,479,500 $0 Median Sales Price* 13 8 Inventory of Homes for Sale 2022 2023 -88.9% -100.0% -100.0% -38.5%
Year to Date
Key Metrics 20222023 Percent Change 20222023 Percent Change New Listings 9 1 - 88.9%21 8 - 61.9% Closed Sales 2 0 - 100.0%7 6 - 14.3% Median Sales Price* $1,479,500 $0 - 100.0%$1,367,000 $1,672,500 + 22.3% Percent of List Price Received* 96.2% 0.0% - 100.0%96.3% 95.0% - 1.3% Days on Market Until Sale 69 0 - 100.0%115 136 + 18.3% Inventory of Homes for Sale 13 8 - 38.5% A Research Tool Provided by REsides, Inc. and the Hilton Head Area Association of REALTORS® Colleton River March Year to Date * Does not account for sale concessions and/or downpayment assistance. Percent changes are calculated using rounded figures and can sometimes look extreme due to small sample size. March All MLS — Colleton River — Current as of April 24, 2023. Data © 2023 REsides, INC. All Rights Reserved. Sponsored by South Carolina REALTORS®. | Report © 2023 ShowingTime. 9 2 1 0 New Listings Closed Sales $250,000 $500,000 $750,000 $1,000,000 $1,250,000 $1,500,000 $1,750,000 4-201410-20144-201510-20154-201610-20164-201710-20174-201810-20184-201910-20194-202010-20204-202110-20214-202210-2022 Historical Median Sales Price Rolling 12-Month Calculation $1,479,500 $0 Median Sales Price* 13 8 Inventory of Homes for Sale 2022 2023 -88.9% -100.0% -100.0% -38.5%
Key Metrics 20222023 Percent Change 20222023 Percent Change New Listings 9 1 - 88.9%21 8 - 61.9% Closed Sales 2 0 - 100.0%7 6 - 14.3% Median Sales Price* $1,479,500 $0 - 100.0%$1,367,000 $1,672,500 + 22.3% Percent of List Price Received* 96.2% 0.0% - 100.0%96.3% 95.0% - 1.3% Days on Market Until Sale 69 0 - 100.0%115 136 + 18.3% Inventory of Homes for Sale 13 8 - 38.5% -A Research Tool Provided by REsides, Inc. and the Hilton Head Area Association of REALTORS®
Detached Homes Only March Year to Date * Does not account for sale concessions and/or downpayment assistance. | Percent changes are calculated using rounded figures and can sometimes look extreme due to small sample size. March All MLS — Colleton River — Current as of April 24, 2023. Data © 2023 REsides, INC. All Rights Reserved. | Sponsored by South Carolina REALTORS®. | Report © 2023 ShowingTime.
Colleton River
* Does not account for sale concessions and/or downpayment assistance. | Percent changes are calculated using rounded figures and can sometimes look extreme due to small sample size. March All MLS — Colleton River — Current as of April 24, 2023. Data © 2023 REsides, INC. All Rights Reserved. Sponsored by South Carolina REALTORS®. | Report © 2023 ShowingTime. 9 2 1 0 New Listings Closed Sales $250,000 $500,000 $750,000 $1,000,000 $1,250,000 $1,500,000 $1,750,000
Historical Median Sales Price Rolling 12-Month Calculation $1,479,500 $0 Median Sales Price* 13 8 Inventory of Homes for Sale 2022 2023 -88.9% -100.0% -100.0% -38.5%
4-201410-20144-201510-20154-201610-20164-201710-20174-201810-20184-201910-20194-202010-20204-202110-20214-202210-2022
Local Market Update – March 2023
Historical Median Sales Price Rolling 12-Month Calculation $1,479,500 $0 Median Sales Price* 13 8 Inventory of Homes for Sale 2022 2023 -88.9% -100.0% -100.0% -38.5% Key Metrics 20222023 Percent Change 20222023 Percent Change New Listings 9 1 - 88.9%21 8 - 61.9% Closed Sales 2 0 - 100.0%7 6 - 14.3% Median Sales Price* $1,479,500 $0 - 100.0%$1,367,000 $1,672,500 + 22.3% Percent of List Price Received* 96.2% 0.0% - 100.0%96.3% 95.0% - 1.3% Days on Market Until Sale 69 0 - 100.0%115 136 + 18.3% Inventory of Homes for Sale 13 8 - 38.5% A Research Tool Provided by REsides, Inc. and the Hilton Head Area Association of REALTORS® Colleton River March Year to Date * Does not account for sale concessions and/or downpayment assistance. | Percent changes are calculated using rounded figures and can sometimes look extreme due to small sample size. March All MLS — Colleton River — Current as of April 24, 2023. Data © 2023 REsides, INC. All Rights Reserved. | Sponsored by South Carolina REALTORS®. | Report © 2023 ShowingTime. 9 2 1 0 New Listings Closed Sales $250,000 $500,000 $750,000 $1,000,000 $1,250,000 $1,500,000 $1,750,000 4-201410-20144-201510-20154-201610-20164-201710-20174-201810-20184-201910-20194-202010-20204-202110-20214-202210-2022 Historical Median Sales Price Rolling 12-Month Calculation $1,479,500 $0 Median Sales Price* 13 8 Inventory of Homes for Sale 2022 2023 -88.9% -100.0% -100.0% -38.5% Historical Median Sales Price - Rolling 12-Month Calculation 2022 2023 Colleton River Real Estate Market Report 35 Information Sponsored by Jeff Hall 843-384-7941 Jammerhhi@gmail.com www.JeffHall.BeachClubRealEstate.com Familiar Faces. Trusted Advisors. COLLETON RIVER ALL MLS A Research Tool Provided by REsides and the Hilton Head Area Association of REALTORS®
4-201410-20144-201510-20154-201610-20164-201710-20174-201810-20184-201910-20194-202010-20204-202110-20214-202210-2022


4 BR, 4 1/2 BA 5th Row Ocean Home with custom finishes throughout like Red Oak and Stone flooring. Private, heated pool. Meticulously maintained and easy stroll to the Plantation Golf Club. $2,999,000 18 ANCHOR COVE COURT JUST SOLD Waterfront Hampton Lake 3 BR, 2.5 BA home w/ 3.5 car garage. Upgraded finishes throughout, sliding doors lead to screened porch & grilling patio. $1,040,000 UNDER CONTRACT 63 N. SEA PINES DRIVE The Randy Fix Team Lowcountry Real Estate RANDY FIX ABR, SFR AND CNE 843-263-8295 randyfix22@gmail.com MARISA WAGNER ASSOCIATE BROKER 843-338-2532 marisahhi@gmail.com Finding the perfect fit for you in community, home and lifestyle, on Hilton Head and in Bluffton It’s Your Move in 2023! REALTOR® 4 Bedroom, 3.5 Bath Hampton Lake home with chef’s kitchen. Spa like master bath with soothing fountain & soaking tub. Screened porch & outdoor kitchen overlooking lake. $1,575,000 JUST SOLD 33 ANCHOR COVE COURT Edward L. Brown, CRS Real Estate Professional since 1977 ed@edbrownrealtor.com • 843-384-8552 Always Looking Out for Your Best Interest Ready to Buy or Sell? Contact me! • The Best Time to Purchase • Priced to Sell & Rental Ready • Short Walk to Everything • Ocean Oriented Villa Units • With Great Rental Revenue • Contact me for more details! Ocean Oriented Investments!! $275,000 - $725,000 • Nicely Updated & Rental Ready • A Rare 5BR / 5BA Investment • GRI exceeds $150k per year!!! • Stylishly Remodeled & Furnished • Spacious Living Areas & Kitchen • Pool or Short Walk to the Beach! Palmetto Dunes/Like New Home! $1,250,000 SOLD • Well Updated & Rental Ready • Roomy 4+BR/4BA Investment • GRI exceeds $150k per year !!! • On a Large Wooded Corner Lot • New Pool & Paver Brick Deck • Walk to SP Beach/Golf/Tennis! Sea Pines – Close to the Beach! $1,100,000 SOLD
Richard MacDonald & Associates


DIRECT OCEANFRONT 4 BR VILLA! Completely remodeled villa with no detail overlooked. Updated with quartz counter tops, LVP flooring, and stainless steel appliances. Beautifully decorated and fully furnished, this is a rental machine with over $144,000 in gross rental income for 2022! Incredible 1st-floor location 4 BR/4 BA villa with 2 ocean front master suites just steps to the beach. The layout, end unit location, and use of the large yard make this one of the highest-producing rental properties in Ocean One. Amenities include oceanfront pool, grill, and firepits. $1,950,000


Great value for this spacious 4 Bedroom 3 full Baths and 2 Half Baths plus Bonus Room home with a beautiful pool overlooking a panoramic lagoon golf view. Large Living Room and Dining Room. Kitchen opens to a large Breakfast Room and Family Room. All Bedrooms are on the main level and a large Bonus Room over the garage. Quiet location at the end of a cul-de-sac. Home needs updating and is priced accordingly. $745,000

Beautiful home with over 2,800 sq. ft. on a private homesite backing up to a protected woodland. Very open floorplan with 3 Bedrooms, 3.5 Baths plus a Study and a Screened Porch. Elegant Dining Room with Butler’s Pantry. Spacious Kitchen with Granite and Stainless-Steel Appliances opening to a large Great Room and Carolina Room with Hardwood Floors. Spacious Master Suite and each Bedroom with its own private Bath. Hurry this home won’t last long. $625,000


www.CharterOneRealty.com
Richard MacDonald Richard@RMacDonald.com cell 843.384.8797 Joey Doyle JoeyDoyle@CharterOneRealty.com cell 843.290.5055 Sanders MacDonald Sanders@CharterOneRealty.com cell 843.816.4800 “I am blessed to have so many wonderful Property Owners and Past Clients which enable me to begin my 43rd year, listing and selling property here in the Low Country.” Richard MacDonald Richard MacDonald & Associates
101 OCEAN ONE VILLAS • FOREST BEACH
20 WILDBIRD LANE • PALMETTO HALL
6 ABBOTSBURY PLACE • THE HAVEN AT NEW RIVERSIDE
Moss
Real
Moss Creek
Estate Market Report Moss Creek | March 2023
Local Market Update – March 2023
Local Market Update – March 2023 A Research Tool Provided by REsides,
Inc. and the Hilton Head Area Association of REALTORS®


Local Market Update – March 2023
Local Market Update – March 2023
March Year to Date
March
Year to Date
Moss Creek
Moss Creek
* Does not account for sale concessions and/or downpayment assistance. | Percent changes are calculated using rounded figures and can sometimes look extreme due to small sample size.
March Year to Date * Does not account for sale concessions and/or downpayment assistance. Percent changes are calculated using rounded figures and can sometimes look extreme due to small sample size. March All MLS — Moss Creek — Current as of April 24, 2023. Data © 2023 REsides, INC. All Rights Reserved. Sponsored by South Carolina REALTORS®. | Report © 2023 ShowingTime. 10 3 3 10 New Listings Closed Sales $200,000 $300,000 $400,000 $500,000 $600,000 $700,000 $800,000 4-201410-20144-201510-20154-201610-20164-201710-20174-201810-20184-201910-20194-202010-20204-202110-20214-202210-2022 Historical Median Sales Price Rolling 12-Month Calculation $550,000 $805,000 Median Sales Price* 4 8 Inventory of Homes for Sale 2022 2023 -70.0% + 233.3% + 46.4% + 100.0%
Local Market Update – March 2023 Key Metrics 20222023 Percent Change 20222023 Percent Change New Listings 10 3 - 70.0%13 18 + 38.5% Closed Sales 3 10 + 233.3%10 19 + 90.0% Median Sales Price* $550,000 $805,000 + 46.4%$455,000 $740,000 + 62.6% Percent of List Price Received* 102.0% 97.2% - 4.7%99.7% 97.7% - 2.0% Days on Market Until Sale 40 98 + 145.0%59 84 + 42.4% Inventory of Homes for Sale 4 8 + 100.0%-- -A Research Tool Provided by REsides, Inc. and the Hilton Head Area Association of REALTORS®
March All MLS — Moss Creek — Current as of April 24, 2023. Data © 2023 REsides, INC. All Rights Reserved. | Sponsored by South Carolina REALTORS®. | Report © 2023 ShowingTime. 10 3 3 10 New Listings Closed Sales $200,000 $300,000 $400,000 $500,000 $600,000 $700,000 $800,000 4-201410-20144-201510-20154-201610-20164-201710-20174-201810-20184-201910-20194-202010-20204-202110-20214-202210-2022 Historical Median Sales Price Rolling 12-Month Calculation $550,000 $805,000 Median Sales Price* 4 8 Inventory of Homes for Sale 2022 2023 -70.0% + 233.3% + 46.4% + 100.0%
Key Metrics 20222023 Percent Change 20222023 New Listings 10 3 - 70.0%13 18 Closed Sales 3 10 + 233.3%10 19 Median Sales Price* $550,000 $805,000 + 46.4%$455,000 $740,000 Percent of List Price Received* 102.0% 97.2% - 4.7%99.7% 97.7% Days on Market Until Sale 40 98 + 145.0%59 84 Inventory of Homes for Sale 4 8 + 100.0%-A Research Tool Provided by REsides, Inc. and the Hilton Head Area Association of REALTORS®
Creek March Year to Date * Does not account for sale concessions and/or downpayment assistance. | Percent changes are calculated using rounded figures and can sometimes look extreme due to small sample size. March All Moss Current as of April 24, 2023. Data © 2023 REsides, INC. All Rights Reserved. | Sponsored by South Carolina REALTORS®. | Report © 10 3 3 10 New Listings Closed Sales $200,000 $300,000 $400,000 $500,000 $600,000 $700,000 $800,000 4-201410-20144-201510-20154-201610-20164-201710-20174-201810-20184-201910-20194-202010-20204-202110-20214-202210-2022 Historical Median Sales Price Rolling 12-Month Calculation $550,000 $805,000 Median Sales Price* 4 Inventory of Homes 2022 -70.0% + 233.3% + 46.4% + 100.0%
Moss
Detached Homes Only Key Metrics 20222023 Percent Change 20222023 Percent Change New Listings 10 3 - 70.0%13 18 + 38.5% Closed Sales 3 10 + 233.3%10 19 + 90.0% Median Sales Price* $550,000 $805,000 + 46.4%$455,000 $740,000 + 62.6% Percent of List Price Received* 102.0% 97.2% - 4.7%99.7% 97.7% - 2.0% Days on Market Until Sale 40 98 + 145.0%59 84 + 42.4% Inventory of Homes for Sale 4 8 + 100.0%-- --
Moss Creek
Key Metrics 20222023 Percent Change 20222023 Percent Change New Listings 10 3 - 70.0%13 18 + 38.5% Closed Sales 3 10 + 233.3%10 19 + 90.0% Median Sales Price* $550,000 $805,000 + 46.4%$455,000 $740,000 + 62.6% Percent of List Price Received* 102.0% 97.2% - 4.7%99.7% 97.7% - 2.0% Days on Market Until Sale 40 98 + 145.0%59 84 + 42.4% Inventory of Homes for Sale 4 8 + 100.0%-A Research Tool Provided by REsides, Inc. and the Hilton Head Area Association of REALTORS®
March Year to Date * Does not account for sale concessions and/or downpayment assistance. Percent changes are calculated using rounded figures and can sometimes look extreme due to small sample size. March All MLS — Moss Creek — Current as of April 24, 2023. Data © 2023 REsides, INC. All Rights Reserved. | Sponsored by South Carolina REALTORS®. Report © 2023 ShowingTime. 10 3 3 10 New Listings Closed Sales $200,000 $300,000 $400,000 $500,000 $600,000 $700,000 $800,000 4-201410-20144-201510-20154-201610-20164-201710-20174-201810-20184-201910-20194-202010-20204-202110-20214-202210-2022 Historical Median Sales Price Rolling 12-Month Calculation $550,000 $805,000 Median Sales Price* 4 8 Inventory of Homes for Sale 2022 2023 -70.0% + 233.3% + 46.4% + 100.0%
Key Metrics 20222023 Percent Change 20222023 Percent Change New Listings 10 3 - 70.0%13 18 + 38.5% Closed Sales 3 10 + 233.3%10 19 + 90.0% Median Sales Price* $550,000 $805,000 + 46.4%$455,000 $740,000 + 62.6% Percent of List Price Received* 102.0% 97.2% - 4.7%99.7% 97.7% - 2.0% Days on Market Until Sale 40 98 + 145.0%59 84 + 42.4% Inventory of Homes for Sale 4 8 + 100.0%-A Research Tool Provided by REsides, Inc. and the Hilton Head Area Association of REALTORS®
March Year to Date * Does not account for sale concessions and/or downpayment assistance. | Percent changes are calculated using rounded figures and can sometimes look extreme due to small sample size. March All MLS — Moss Creek — Current as of April 24, 2023. Data © 2023 REsides, INC. All Rights Reserved. | Sponsored by South Carolina REALTORS®. Report © 2023 ShowingTime. 10 3 3 10 New Listings Closed Sales $200,000 $300,000 $400,000 $500,000 $600,000 $700,000 $800,000 4-201410-20144-201510-20154-201610-20164-201710-20174-201810-20184-201910-20194-202010-20204-202110-20214-202210-2022 Historical Median Sales Price Rolling 12-Month Calculation $550,000 $805,000 Median Sales Price* 4 8 Inventory of Homes for Sale 2022 2023 -70.0% + 233.3% + 46.4% + 100.0% Local Market Update – March 2023 Key Metrics 20222023 Percent Change 20222023 Percent Change New Listings 10 3 - 70.0%13 18 + 38.5% Closed Sales 3 10 + 233.3%10 19 + 90.0% Median Sales Price* $550,000 $805,000 + 46.4%$455,000 $740,000 + 62.6% Percent of List Price Received* 102.0% 97.2% - 4.7%99.7% 97.7% - 2.0% Days on Market Until Sale 40 98 + 145.0%59 84 + 42.4% Inventory of Homes for Sale 4 8 + 100.0%-- -A Research Tool Provided by REsides, Inc. and the Hilton Head Area Association of REALTORS®
* Does not account for sale concessions and/or downpayment assistance. Percent changes are calculated using rounded figures and can sometimes look extreme due to small sample size. March All MLS — Moss Creek — Current as of April 24, 2023. Data © 2023 REsides, INC. All Rights Reserved. | Sponsored by South Carolina REALTORS®. Report © 2023 ShowingTime. 10 3 3 10 New Listings Closed Sales $200,000 $300,000 $400,000 $500,000 $600,000 $700,000 $800,000 4-201410-20144-201510-20154-201610-20164-201710-20174-201810-20184-201910-20194-202010-20204-202110-20214-202210-2022 Historical Median Sales Price Rolling 12-Month Calculation $550,000 $805,000 Median Sales Price* 4 8 Inventory of Homes for Sale 2022 2023 -70.0% + 233.3% + 46.4% + 100.0% Historical Median Sales Price - Rolling 12-Month Calculation 2022 2023 Moss Creek Real Estate Market Report 38 Information Sponsored by MOSS CREEK ALL MLS LAWRENCE TAYLOR (843) 338-6511 Lawrence@CharterOneRealty.com DICK PATRICK (843) 384-4020 Dick@CharterOneRealty.com ROB MOORE (843) 384-5118 robmoore@CharterOneRealty.com KIM FRANCE (513) 476-2658 KimFrance@CharterOneRealty.com A Research Tool Provided by REsides and the Hilton Head Area Association of REALTORS®
Creek
Top 1% Real Estate Agent/Team HHI/Mainland Market 10 years in a Row


#1 Agent/Team Hilton Head Plantation 28 Years in a Row


#1 Agent/Team Moss Creek 12 Years in a Row
GOLF-LAGOON VIEWS
55 N. Port Royal Drive • Port Royal

Reimagined and expanded with award winning local architect. The result is astounding and breathtaking ... soaring ceilings, tons of natural light, finishes are highest quality. Impressive floorplan, welcoming foyer, great room, gourmet center island kitchen with dining, Carolina room, office/study. All 5 bedrooms are en suite. Large laundry room on main, second laundry in primary suite. Huge heated salt pool and spa with paver patio and walks. 21 Beach Access paths throughout the residential community with one directly across the street. Club membership is OPTIONAL in Port Royal Plantation. 5BR/5.5BA/5600 Sq. Ft., $3,300,000.
GOLFVIEW
Floor plan offers Chef’s island kitchen open to FR & Carolina Rm, Great Rm, DR, 2nd floor gallery, den/study & flex space. Stately curb appeal, half moon drive, expansive rear terrace, & grill deck. Close to all this private community has to offer. 5BR/5.5BA/4406 Sq. Ft., $1,250,000.


GOLFVIEW
UNDER CONTRACT
49 Santa Maria Drive • HHP


Superbly built, pristinely maintained home w/fairway views and short walk to CCHH & Marina. Floor plan offers updated island kitchen open to FR, Casual Dining & Office Nook + great room with gas fp, DR, 4BR suites, powder room, walk-in attic storage & 2 car garage. Features incl. quartz counters, wide plank wood flooring, custom millwork & built-ins, volume smooth ceilings, walls of windows to view & expansive rear patio w/remote control awning. New roof and professionally maintained landscaping. 4BR/4BA/3117 Sq. Ft., $1,075,000.

UNDER CONTRACT
Valued priced residence with picturesque front/rear golf & lagoon views and primo high elevation, end of cul-de-sac locale just a short stroll to PR Sound, Dolphin Head Recreational Area & Pine Island Beach. Features & floor plan include kitchen open to vaulted ceiling great room, floor to ceiling brick fireplace, built-ins, ceiling fans, recessed lighting & walls of windows to view. Much desired Carolina room, casual & formal dining, den/family room + 3 spacious BR’s. Exterior offers rear patio, mature landscaping, specimen trees & lots of privacy. All with ample storage space incl. floored attic, walk in closets & 1 car garage. 3BR/2.5BA/2330 Sq. Ft., $675,000.

#1 Ranked Real Estate Company in the Lowcountry Lawrence Taylor • 843.338.6511 Dick Patrick • 843.384.4020 Rob Moore • 843.384.5118 Kim France • 513.476.2658 Info@PatrickAndTaylorTeam.com Charter One Realty • 200 Merchant Street • HILTON HEAD ISLAND, SC 29926 www.PatrickandTaylorTeam.com Whether Buyer or Seller, you deserve experienced professionals, straight answers and knowledgeable Real Estate advice. Call us today to find out more about the most comprehensive “White Glove” Real Estate Experience offered in the HHI/Mainland Market. 2 Sanderling Court • Moss Creek Much desired, rarely available, full size tidal marsh and creek view lot on quiet cul-de-sac street in private Moss Creek! Experience daily panoramic sunrises and sunsets, regular dolphin sightings, fishing and kayaking off your back yard, etc. All framed by majestic live oaks and close to all this amenity rich community has to offer. You’ve dreamed about this view… here is your chance to live the dream! $450,000. DEEPWATER/ MARSHVIEWS 2NDROWOCEAN/ GOLF 41 Cat Brier Lane • Moss Creek One of Moss Creek’s signature properties. Features & finishes incl. soaring ceilings, built-ins, 3 fireplaces, wood flooring, granite counters, custom cabinetry, walls of windows to golf view, walk-in attics, new roof.
12 Sugar Pine Lane • HHP
Experience the Amazing Wexford Lifestyle!


Wexford is a highly acclaimed residential gated community with luxurious amenities and an inviting, friendly atmosphere. Beyond the harbor, golf, tennis, clubhouse, new community pool complex and pickleball courts, Wexford offers an energetic and welcoming community. At Wexford, you can enjoy a variety of sporting and social events that bring neighbors together or join one of the member-run clubs and groups. Wexford offers members an unrivaled lifestyle experience - it’s much more than a place to call home.

One of Wexford greatest assets is the 37-acre lock-controlled marina. It is one of only three on the east coast. Wexford’s impressive harbor can accommodate boats up to 70’ with 24/7 access to deep water. It’s the perfect place to dock a jet ski, sailboat, or your dream yacht! Call me for a community tour or to view any available properties island-wide.
22 Plumbridge Lane • Wexford
Welcome to one of the finest harbor homes in Wexford! Fabulous architectural design, beautifully built with quality throughout, well appointed, and nicely maintained. This home affords all amenities imaginable. Chef’s kitchen, expansive and luxurious primary suite, office/ study, wine cellar, fitness room, 10 car climatized garage, raised pool and jacuzzi, private 70’ boat slip, and so much more! Offering 5 ensuite bedrooms, 6 full baths, 1 half bath and over 7500 heated sq ft. Situated on 1.5 lots on a quiet cul de sac in highly acclaimed residential community of Wexford. $3,900,000

OCEAN FRONT
Premium panoramic views from this harborfront home in highly acclaimed Wexford community! This custom home boasts approx 6000 htd sq ft of exceptional quality, thoughtful design, & impressive custom millwork. There is room for everyone here with 5 bedrooms, all with ensuite baths, 2 bunk rooms that share a bath, an additional full bath on the ground level, plus 1 half bath on the first floor. Breathtaking harbor views from multiple outdoor living spaces, theater, office, elevator, 2 laundry rooms, heated pool & jacuzzi, poolside grotto with wood burning fireplace, gardening room, 3 car garage with golf cart bay, plus your private 70’ boat dock. $3,400,000


5 Alder Lane • South Forest Beach


One of just a few Oceanfront homes for sale on HH! This 4003 sq ft, 6 BR, 5 BA home is a rental machine! Recently remodeled and beautifully decorated with an open-concept cook’s kitchen. Multiple ocean view decks for dining/ entertaining, rooftop sundeck with breathtaking views by day or night, takes oceanfront living to a new level! Billiards/game room with private bar! Private pool and private boardwalk with a surf deck lounge leads to one of the Top 10 Beaches in the World! Unique home replete with high-end finishes. Furnished & ready to rent or occupy. $3,790,000

59 Bridgetown Road • Wexford
Island Resident since 1982, full time Realtor since 1993... Steve Timperman has the Island knowledge & experience you need! Steve Timperman REALTOR/BROKER 843.384.8988
SteveTimperman.com Steve@CharterOneRealty.com @ hhi.realestate Steve Timperman - Hilton Head Island Real Estate Call Steve Timperman, 843.384.8988 Your Hilton Head Realtor
|
WEXFORD WEXFORD
