Existing home sales inch up; pending sales stall
National Association of Realtors News release
WASHINGTON, D.C. —
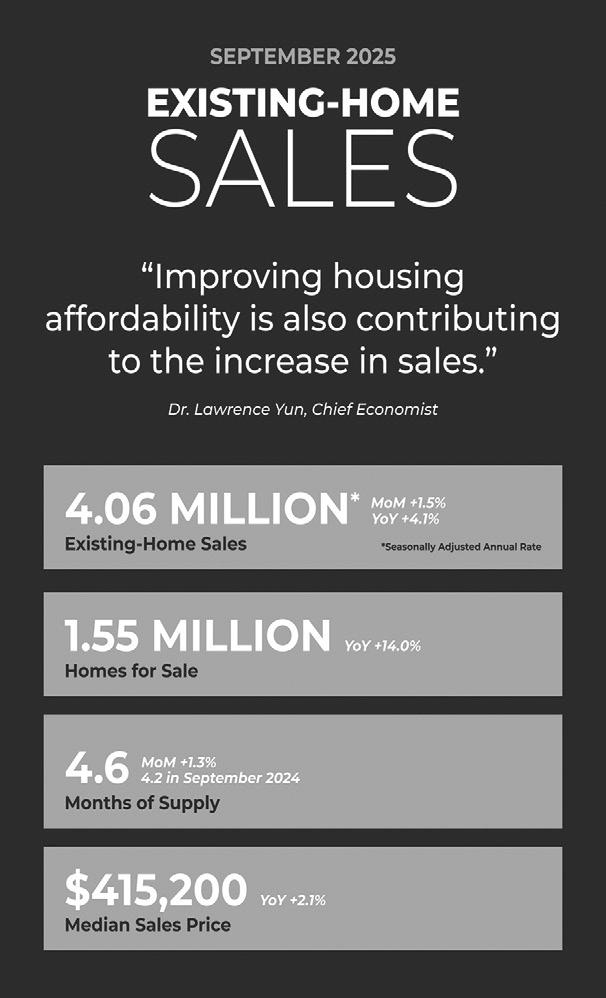
Existing-home sales increased by 1.5% month-over-month in September, according to the National Association of Realtors Existing Home Sales Report. The report provides the real estate ecosystem, including agents and homebuyers and sellers, with data on the level of home sales, price and inventory.
Month-over-month sales increased in the Northeast, South and West, and fell in the Midwest. Year-over-year, sales rose in the Northeast, Midwest and South, and remained at in the West.
“As anticipated, falling mortgage rates are li ing home sales,” said NAR Chief Economist Dr. Lawrence Yun. “Improving housing a ordability is also contributing to the increase in sales.”
“Inventory is matching a veyear high, though it remains below pre-COVID levels,” Yun added. “Many homeowners are nancially comfortable, resulting in very few distressed properties and forced sales. Home prices continue to rise in most parts of the country, further contributing to overall household wealth.”
National snapshot
Total existing home sales for
September
• 1.5% increase in existinghome sales month-over-month to a seasonally adjusted annual rate of 4.06 million.
• 4.1% increase in sales yearover-year.
Inventory in September
• 1.55 million units: Total housing inventory, up 1.3% from August and up 14.0% from September 2024 (1.36 million).
• 4.6-month supply of unsold inventory, no change from August and up from 4.2 months in September 2024.
Median sales price in September
• $415,200: Median existinghome price for all housing types, up 2.1% from one year ago ($406,700) — the 27th consecutive month of yearover-year price increases.
Single-family and condo/ co-op sales
• Single-Family Homes in September — 1.7% increase in sales to a seasonally adjusted annual rate of 3.69 million, up 4.5% from September 2024. $420,700: median home price in September, up 2.3% from last year.
• Condominiums and Co-ops in September — No change month-over-month or year-over-year; sales remain at a seasonally adjusted annual rate of 370,000 units. $360,300: Median price, down 0.6% from September 2024.
no change year-over-year.
• $619,100: Median price, up 0.4% from September 2024.
Realtors Confidence Index
• 33 days: Median time on market for properties, up from 31 days last month and 28 days in September 2024.
• 30% of sales were rsttime homebuyers, up from 28% in July and 26% in September 2024.
• 30% of transactions were cash sales, up from 28% a month ago and unchanged from September 2024.
• 15% of transactions were individual investors or secondhome buyers, down from 21% last month and 16% in September 2024.
Regional snapshot
Northeast
• 2.1% increase in sales month-over-month to an annual rate of 490,000, up 4.3% year-over-year.
• $500,300: Median price, up 4.1% from September 2024.
Midwest
• 2.1% decrease in sales month-over-month to an annual rate of 940,000, up 2.2% year-over-year.
• $320,800: Median price, up 4.7% from September 2024.
South
• 1.6% increase in sales month-over-month to an annual rate of 1.86 million, up 6.9% year-over-year.
• $364,500: Median price, up 1.2% from September 2024.
West
• 5.5% increase in sales month-over-month to an annual rate of 770,000, with
in buyer tra c over the next three months, up slightly from 19% last month and down slightly from 21% one year ago. Meanwhile, 19% expect an increase in seller tra c, unchanged from last month and down slightly from 20% in September 2024.
“Contract signings matched the second-strongest pace of the year. However, signings have yet to fully reach the level needed for a healthy market despite mortgage rates reaching a one-year low,” said Yun. “A record-high stock market and growing housing wealth in September were not enough to o set a likely so ening job market.
• 2% of sales were distressed sales4 (foreclosures and short sales), unchanged from August and September 2024.
Mortgage rates
6.35%: The average 30-year xed-rate mortgage in September, according to Freddie Mac, down from 6.59% in August and up from 6.18% one year ago.
Pending sales data
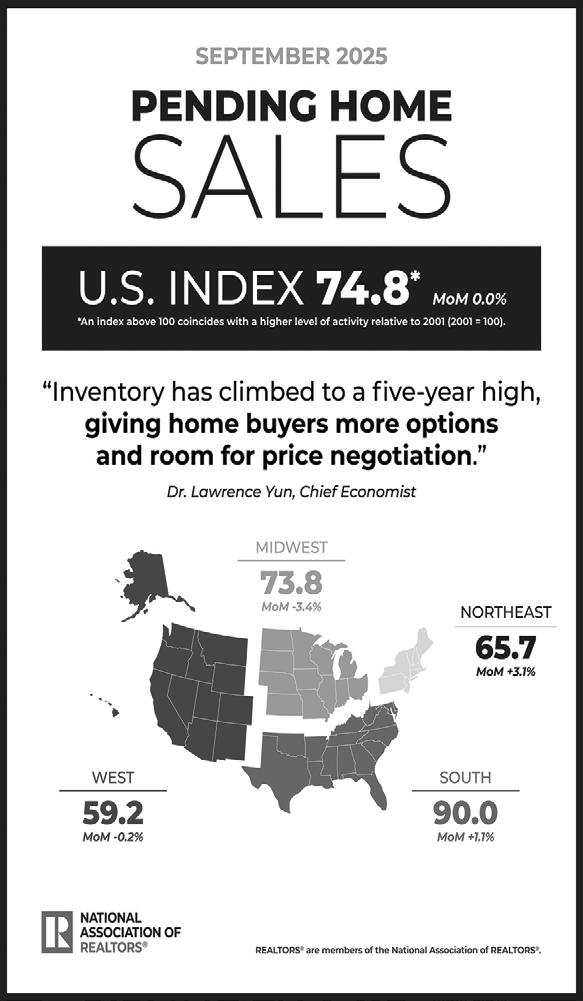
Pending home sales in September showed no change from the prior month and fell 0.9% year over year, according to the NAR Pending Home Sales Report. The report provides the real estate ecosystem, including agents and homebuyers and sellers, with data on the level of home sales under contract.
Month-over-month and year-over-year pending home sales rose in the Northeast and South but declined in the Midwest and West.
September’s Realtors Con dence Index survey shows that 20% of NAR members expect an increase
“Inventory has climbed to a ve-year high, giving home buyers more options and room for price negotiation,” Yun added. “Looking ahead, mortgage rates are trending toward three-year lows, which should further improve a ordability, though the government shutdown could temporarily slow home sales activity.”
September regional pending home sales
Northeast
• 3.1% increase month over month
• 0.5% increase year over year
Midwest
• 3.4% decrease month over month
• 1.5% decrease year over year
South
• 1.1% increase month over month
• 0.9% increase year over year
West
• 0.2% decrease month over month
• 5.3% decrease year over year
Courtesy graphs
YOURGUIDETO PROPERTY LISTINGS
12601 Greater Cameron Park
12602 El Dorado Hills
12601 Greater Cameron Park
12603 Shingle Springs
12602 El Dorado Hills
12604 Rescue, Luneman
You may also find it helpful to browse listings by the type of real estate you are interested in buying. To find the geographic location, look at the classification heading and locate the matching zone number on the El Dorado County Map.
You may also find it helpful to browse listings by the type of real estate you are interested in buying. To find the geographic location, look at the classification heading, and locate the matching zone number on the El Dorado County Map.
To find property by geographic location, use the following reference table. Each category is separated by the zone number, type of real estate, and location in El Dorado County.
TABLEOFCONTENTS by type of listing
Residential Homes
Mobile Homes in Parks
Vacant Land
Information contained in Home Source MLS Listings are accessed each week, neither Home Source, Mt Democrat or McNaugthon Media /Publishing nor its authors guarantees the accuracy or completeness of any information published herein. Home Source, Mt Democrat or McNaugthon Media nor its authors shall be responsible for any errors, omissions, or claims for damages, including exemplary damages, arising out of use, or with regard to the accuracy or sufficiency of the information contained in Home Source. All rights reserved.
Page 22-25
Page 25-26
Page 26-27
All properties are listed by price, address, acreage, listing number, and the Realtor’s office number. If you would like more information about a property, call the relevant office number for that listing.
To find a property by geographic location, use the following reference table. Each category is separated by the zone number, type of real estate, and location in El Dorado County. Properties are sorted by price, in ascending value.
12605 Latrobe, Shingle Springs South
12603 Shingle Springs
12701 Greater Placerville
12604 Rescue, Luneman
12702 El Dorado, Diamond Springs
12605 Latrobe, Shingle Springs South
12703 Pleasant Valley, Placerville South
12701 Greater Placerville
12704 Somerset, Mt. Aukum, South County
12702 El Dorado, Diamond Springs
12705 Coloma, Lotus
12706 Greenstone, Gold Hill West
12703 Pleasant Valley, Placerville South
12707 Mosquito, Swansboro
12704 Somerset, Mt. Aukum, South County
12801 Camino, Cedar Grove
12705 Coloma, Lotus
12802 Pollock Pines
12706 Greenstone, Gold Hill West
12803 American River Canyon
12707 Mosquito, Swansboro
12901 Georgetown, Garden Valley
12902 Cool, Pilot Hill
12801 Camino, Cedar Grove
12802 Pollock Pines
12803 American River Canyon
12901 Georgetown, Garden Valley
12902 Cool, Pilot Hill
12903 North County
12601 RESIDENTIAL HOMES GREATER CAMERON PARK
PRICESTREETADDRESSBDBASFACLISTING#OFFICE #
2300003394Cimmarron219800.01850028867916-933-1400
2650003529Ross 221664 50021477530-622-0131
2799003293Amethyst211272 40074000530-677-7801
2999003381La Canada321210 50014180916-933-4500
3119002693Hopi 221376 50028462916-452-4557
3245003262Heights Drive221506 50028808916-939-5300
3950002693La Canada321469 50015709530-672-4500
3970003141Modoc 3216330.33050015353530-676-8900
4095002417Sandpiper3216000.20050031732530-676-2354
4200003097Cambridge322188 50011310530-672-4500
4390003427Oxford 3216220.33050019552530-676-8600
4399003200United 321536 50024838530-677-7801
4480003750Sheridan3217220.30050024081530-626-3333
4540003577Christa 321705 50033872916-404-2900
4655003451La Canada Dr.4219400.34050025853916-941-3830
5000002438Mellowdawn3220120.24050004250530-676-8600
5100003623Kimberly4218660.34050023612530-676-8600
5250003022Cayente4220880.18050018659530-672-4500
5390002535Country Club3324490.28050027400916-638-1177
Listed by Local Agents
650000416Oeste 422600
6500003617Ventana422600
6500003625Ventana422600
This representation is based in whole or in part on data supplied by MetroList©. All information provided by seller/other sources has not been verified by broker. All interested persons should independently verify accuracy of above information. Copyright ©2002 – MetroList Services, Inc.
6750003621Foxmore4228130.64650002498916-933-8700
6900003329Covello 5327480.30050030434916-239-4200 6990004076Plateau4332220.24050018785530-676-8600 747700548Crazy Horse4228240.51040078954530-676-8600 7690003565Sudbury3346241.06050011648530-295-8440 7990003445Raben 3238000.23050026085916-965-3300 9600002521Greens Landing3235670.20040086632916-355-0202 9795003089Boeing 4444260.47950004750530-676-8600 12750004351McNeil 3226987.77050026561916-933-1400
5399003580Archetto 3220250.14050029654916-933-3998 5490003041Stanford 5230000.28050019188916-608-4563
5590003232Stonehurst3219580.16750016674916-879-0974
560000138Slate Ridge2226120.39650016111916-355-7000
5690003903Mossview4219300.26050027204916-939-5300
5750002056Bailey 3218670.50050029720916-774-6700
5750003015Merriam 4222000.30050026969530-676-2376
5790004655Tramezzo3222500.29350029366916-393-0825
5900005013Taylor 3326160.17450033305916-939-5300
595000216Knapp 4224010.19050018827916-355-0202
5990003585Park 4329990.28050014496530-672-4500
5999002085Moonstone4325800.33550029586916-933-1400 5999993200Stanford 3229270.40050023977916-933-4500
6000003065Birmingham4220180.29150032628916-933-8700
6190001157Oak Tree422559 40082036916-933-1400
6190006036Brogan 4224500.19250032887415-867-2675
629000506Prairie Falcon5333860.19150019418530-676-2376 6325001104Bevinger 3226590.21150027062916-939-6633
6350001636Daunting
3
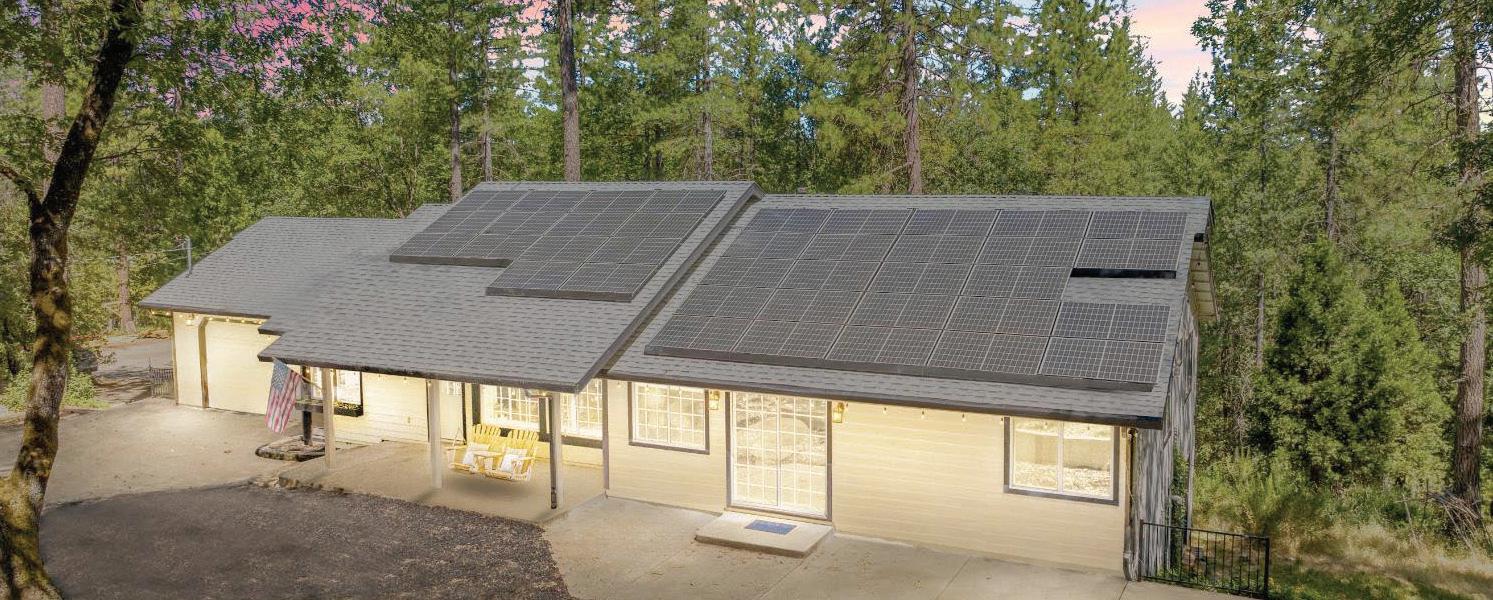
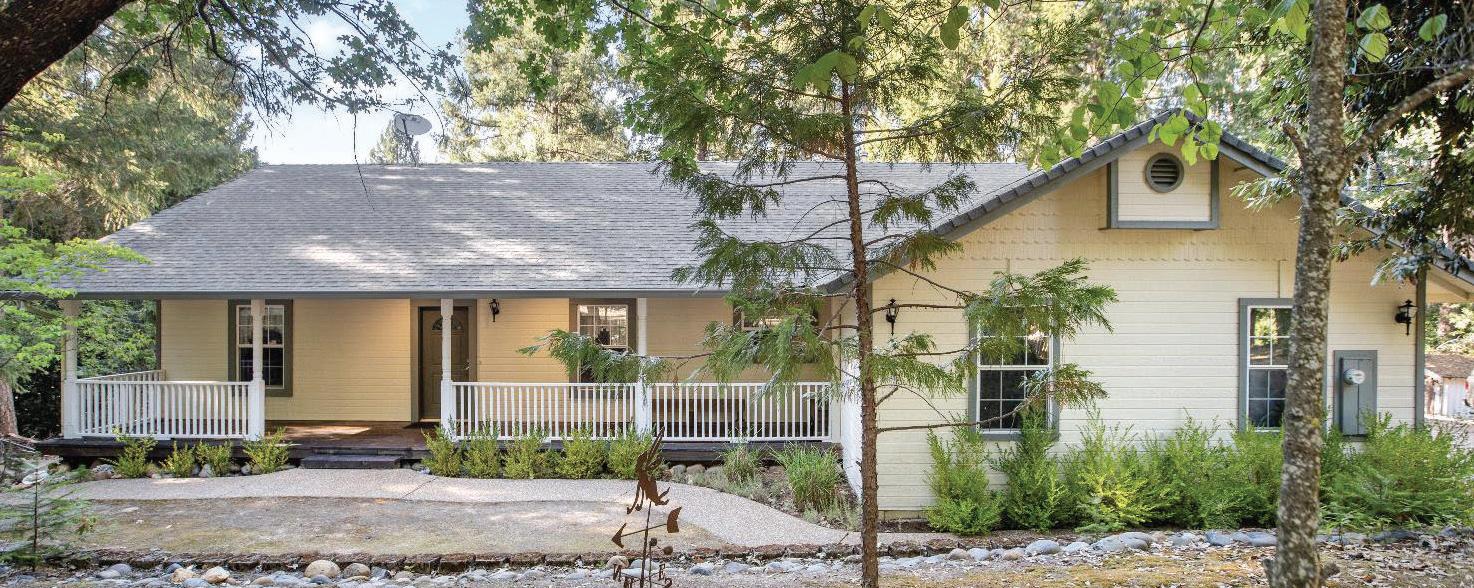
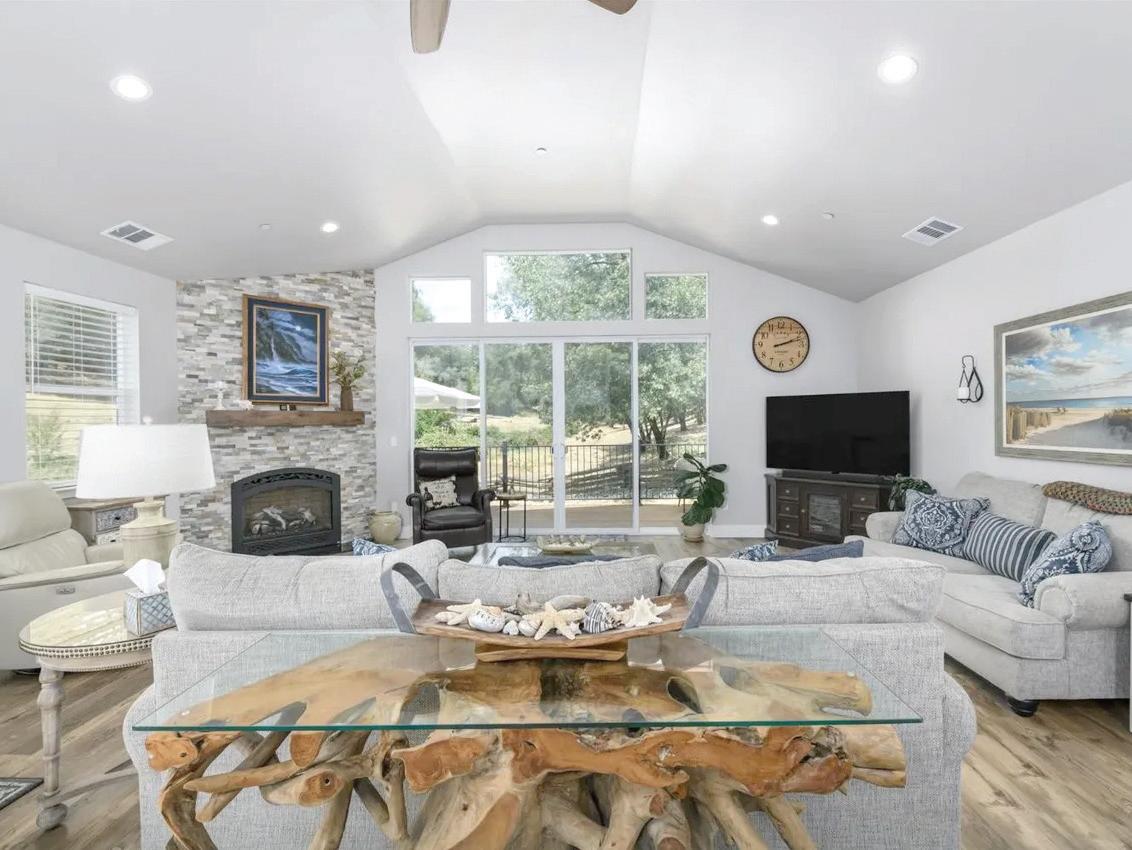
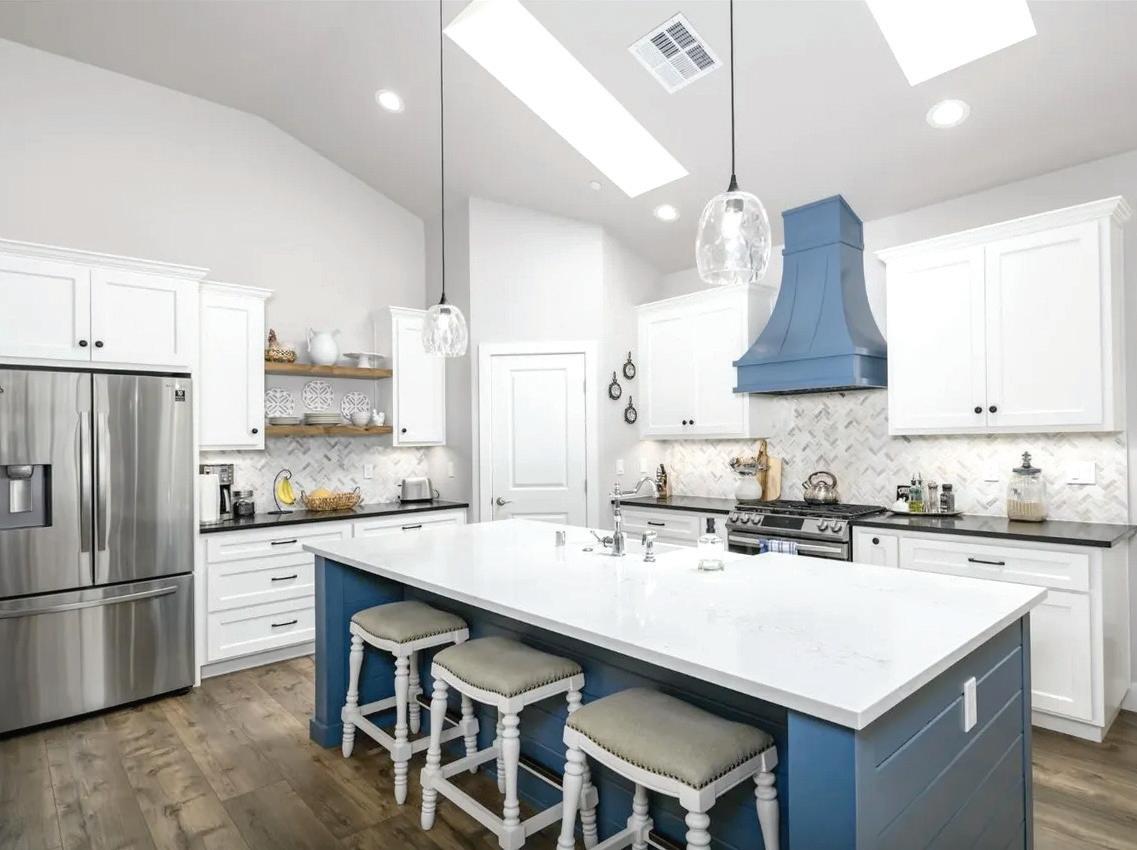
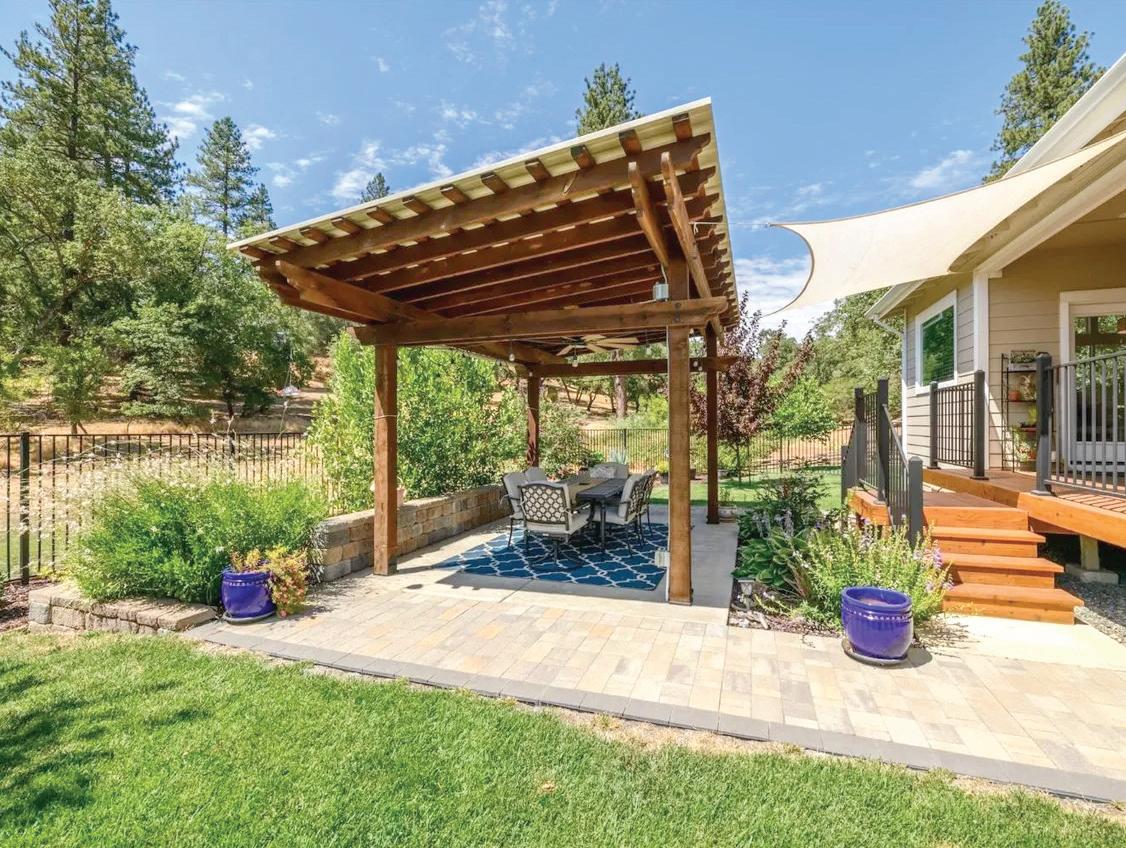
LIVABILITY IN THIS STUNNING 2022 CUSTOM HOME! $1,099,500 • MLS#225099175
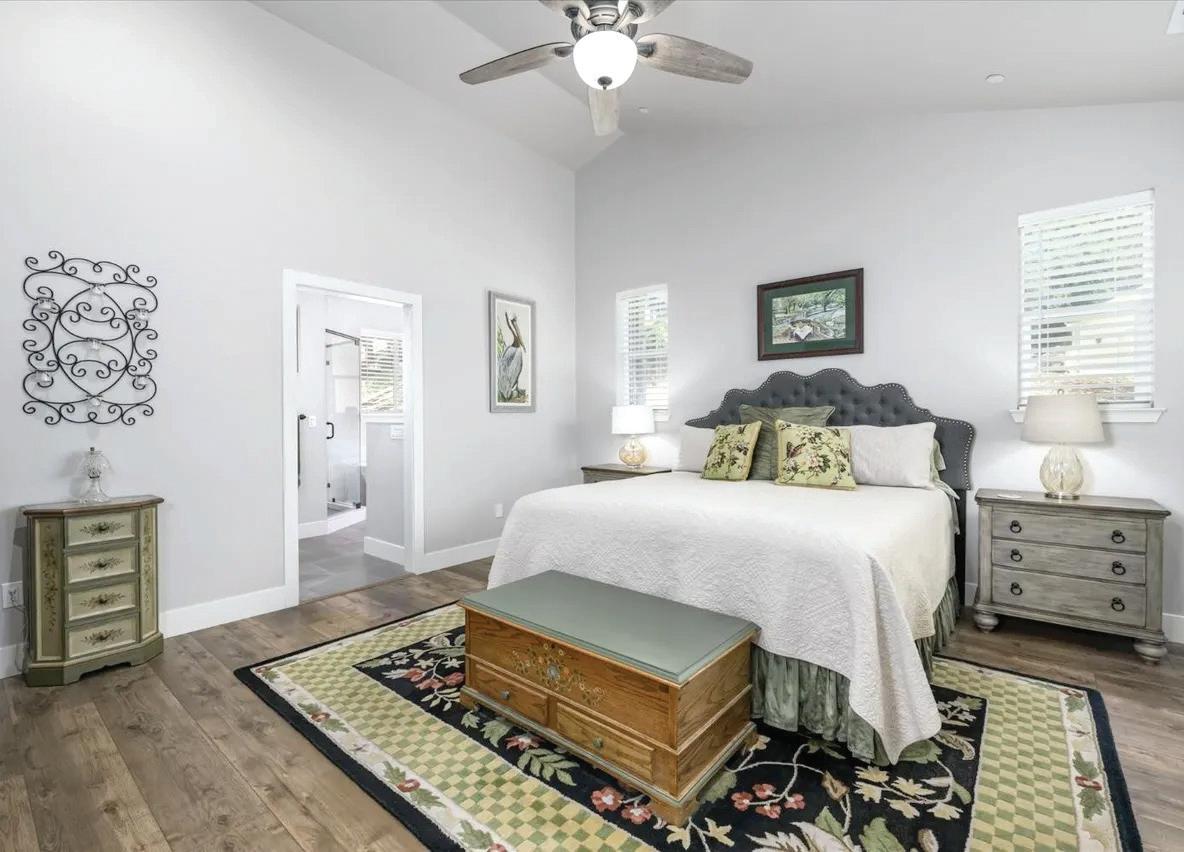
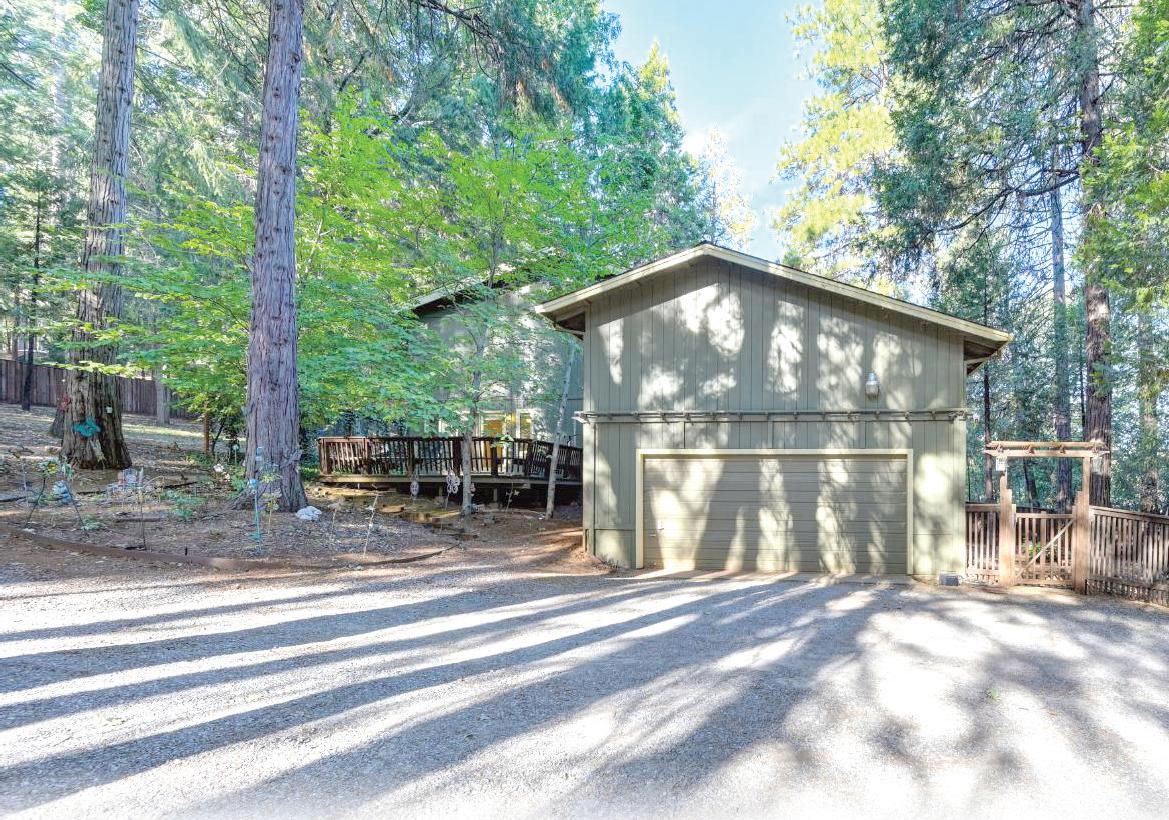
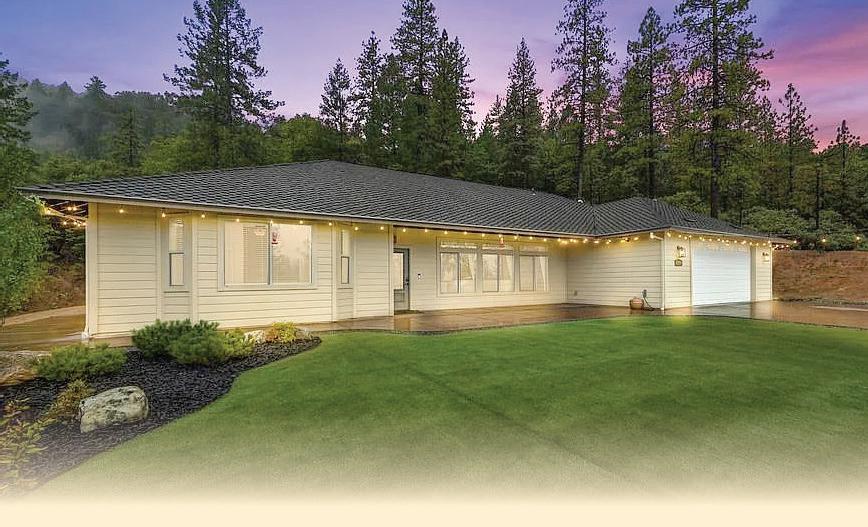
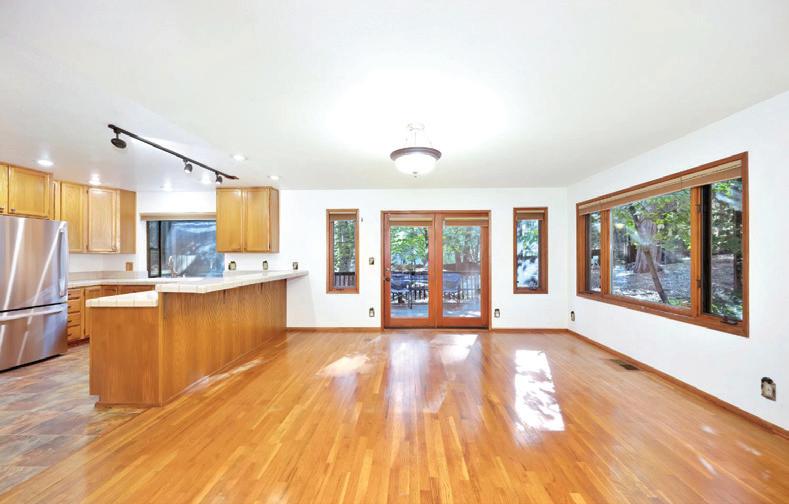
home in Placerville’s desirable Sleepy Hollow Ct. Set on nearly an acre, this elegant beds, 2 baths, cathedral ceilings, and oversized windows that frame views of a seasonal chef’s kitchen impresses with quartz counters, custom white cabinetry with stunning blue stainless appliances, wine refrigerator and a large pantry. e private primary suite features bath with soaking tub and oversized shower. Energy-e cient with approx. 5kW owned Generac generator! ere’s RV parking with 50 amp power & sewer hookup as well. e garage includes 9’x9’ doors for taller vehicles. Enjoy outdoor living on the covered patio or deck. e detached ADU o ers exceptional quality with 2 beds, 1.5 baths, designer nishes, solar, mini-splits, an oversized 2-car garage, carport, and RV setup. With a total of 3333 SF living space, that is only $330 a square foot! Minutes to town, yet feels like private retreat.
$825,000
$825,000
$829,000
$850,000
$850,000
Villagio Dr 4 3 (3 0) 2907 0.16 225083083
$870,000 6906 Saratoga Estates Dr 4 3 (2 1) 2296 0.1607 225013892 $875,000 5057 Mertola Dr 3 3 (3 0) 2723 0.13 224110705
$875,000 3545 Landsdale Way 4 3 (2 1) 2645 0.29 225131100 $879,000 3452 Tah Nee Way 4 3 (3 0) 2963 0.33 225135610
$1,450,000 3058 Ridgeview
$965,000
$989,000 2059 Beckett Dr 4 4 (3 1) 3177 0.22 225116969
$989,000 4849 Danbury Cir 4 4 (3 1) 3403 0.69 225089179
$990,000 5200 Piazza Pl 5 4 (3 1) 4015 0.38 225012114
$991,550 6890 Saratoga Estates Dr 4 4 (3 1) 2976 0.1606 225092604
$999,999 5529 Aspen Meadows Dr 3 3 (2 1) 2762 0.28 225102393
$1,019,000 4107 Milano Ct 4 3 (3 0) 3292 0.3 225135041
$1,038,000 309 Summerfield Ct 5 4 (4 0) 3408 0.19 225122772
$1,041,710 1207 Seneca Cir 4 4 (3 1) 2976 0.1625 225095898
$1,050,000 4035 Meadow Wood Dr 4 3 (3 0) 2876 0.17 225134974
$1,059,000 1806 Brandywood Way 5 4 (4 0) 3632 0.31 225084456
$1,079,000 2322 Brannan Way 5 5 (4 1) 3487 0.19 225104408
$1,090,000 1873 Brandywood Way 4 3 (3 0) 3104 0.29 225131142
$1,095,000 4281 Marble Ridge Rd 5 3 (3 0) 4062 10.02 225115159
$1,098,000 6043 Southerness Dr 4 4 (3 1) 2686 0.18 225039485
$1,099,000 3505 Brandt 4 3 (3 0) 2571 0.42 225134183
$1,099,000 3456 Archetto Dr 4 4 (3 1) 2832 0.17 225111896
$1,100,000 954 King Richard Ct 4 3 (3 0) 2920 0.27 225134289
$1,100,000 5192 Piazza Pl 4 4 (3 1) 3989 0.37 225044165
$1,115,000 1998 Driftwood Cir 4 3 (3 0) 2872 0.32 225105213
$1,124,000 615 Blue Oak Ct 4 4 (4 0) 3060 0.43 225082206
$1,135,000 1601 Pheasant Ln 4 3 (3 0) 2606 15.96 225130996
$1,150,000 2022 Ahoy Ct 4 4 (3 1) 3700 0.39 225085684
$1,150,000 2264 Ashford Pl 4 3 (2 1) 2618 0.47 225112589
$1,198,000
$1,199,000
$1,199,999
12703 RESIDENTIAL HOMES
PLEASANT VALLEY, PLACERVILLE SOUTH