ROYAL MARKET WATCH
FORT MYERS (NEIGHBORHOOD), LEE COUNTY
MARCH 2025
FORT MYERS - MARCH
Charli,
As of 04/23/2025
Welcome to your latest Royal Market Report, with up-to-date real estate data for a specific market area.
The Market Report offers insight into residential real estate sales activity and regional trends. It complements our Royal Property Detail Report, giving you a broader look at the real estate market. If you are interested in receiving the Property Detail Report for a more specific area, please let me know. I would be happy to set that up for you.
The market summary below lets you see sales activity for the prior month and year, along with current and past year-todate statistics. The graphs cover several different aspects of the real estate market. Note how some of the charts break out trends by price increments. Don't hesitate to contact me if you would like more information on your current market.
MIKE MCMURRAY
Realtor®
License: 587669
Office: 239.333.3674
Cell: 239.850.7888
mike@mcmurrayandmembers.com
http://mmcmurray.royalshellrealestate.com
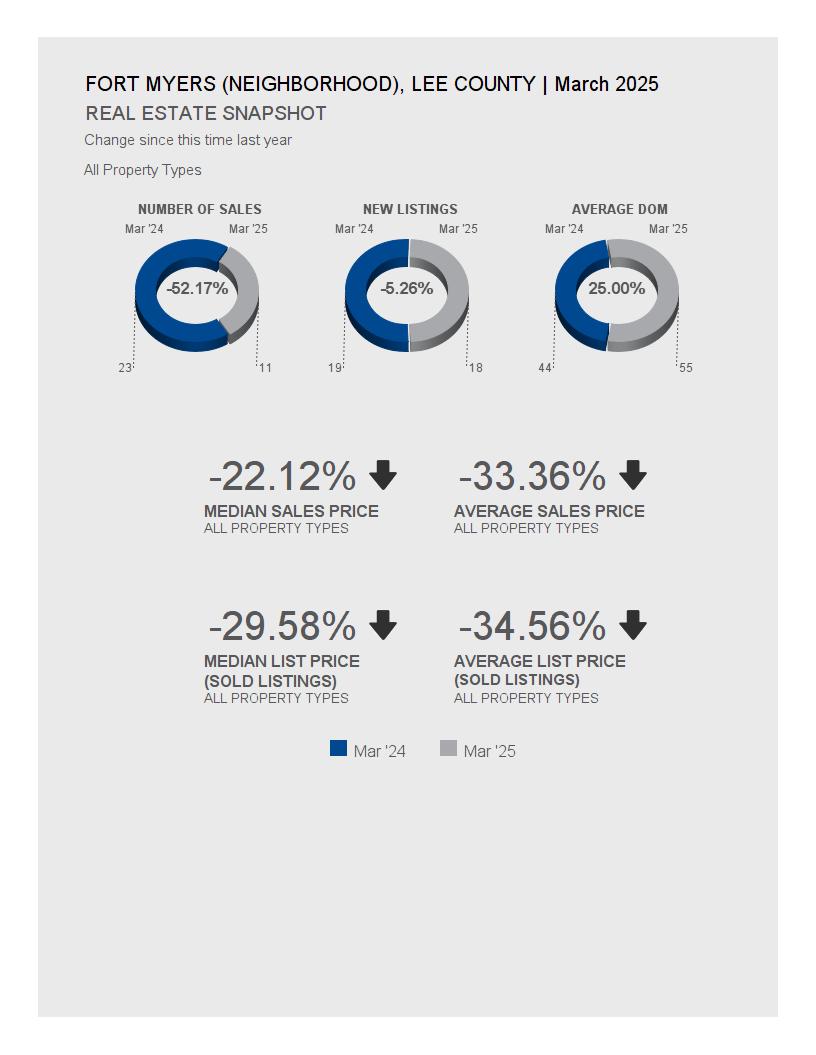
Fort Myers (neighborhood), Lee County
MARKET SUMMARY
MARCH 2025 | ALL PROPERTY TYPES
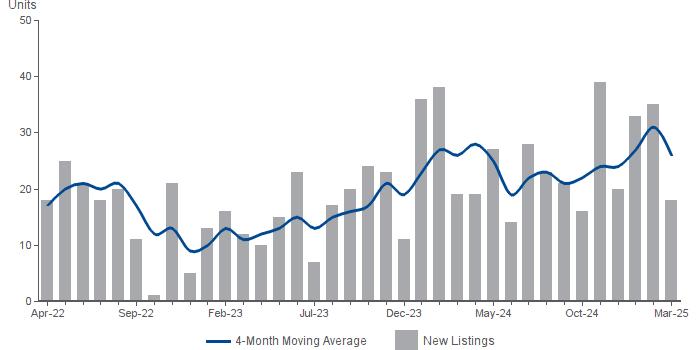
NEW PROPERTIES
MARCH 2025 | ALL PROPERTY TYPES
Number of new properties listed for sale during the month
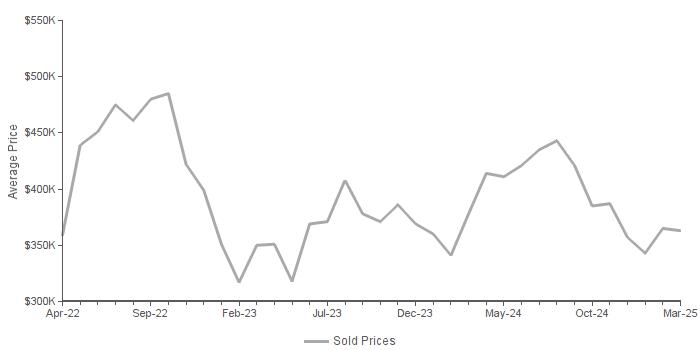
AVERAGE SALES PRICE
MARCH 2025 | ALL PROPERTY TYPES
Average price for sold properties (6-Month Moving Average)
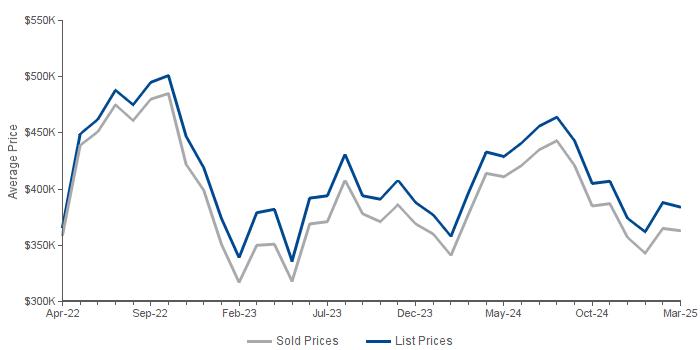
AVERAGE SALES/LIST PRICE
MARCH 2025 | ALL PROPERTY TYPES
Average list price compared to average sold price of properties sold each month (6-Month Moving Average)
Myers (neighborhood), Lee County
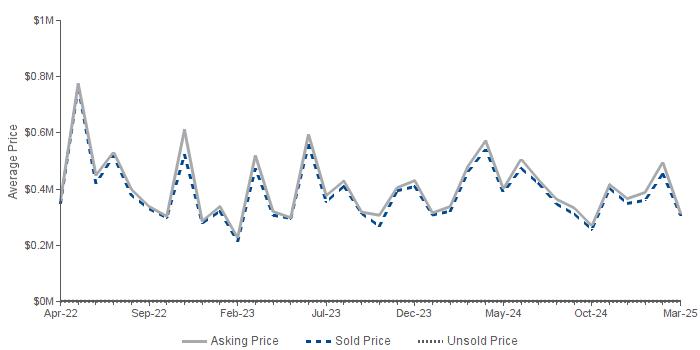
AVERAGE ASKING/SOLD/UNSOLD PRICE
MARCH 2025 | ALL PROPERTY TYPES
Asking Price | the average asking price of sold properties
Sold Price | the average selling price
Unsold Price| the average active list price
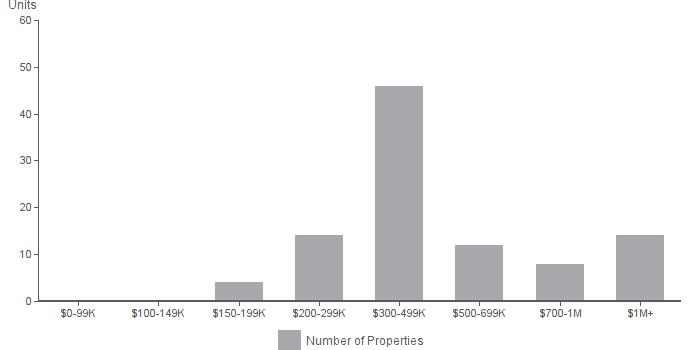
PROPERTIES FOR SALE
MARCH 2025 | ALL PROPERTY TYPES
Number of properties currently listed for sale by price range
Fort Myers (neighborhood), Lee County
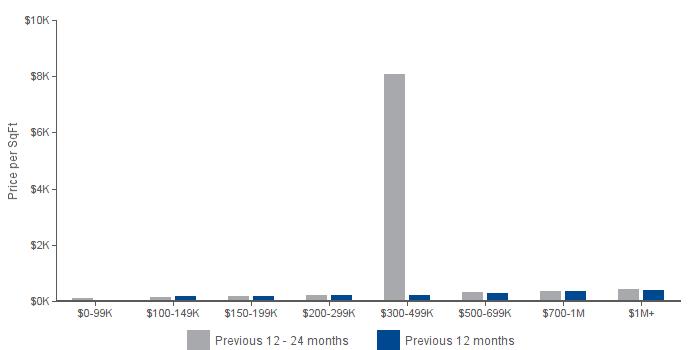
AVERAGE SALES PRICE PER SQFT
MARCH 2025 | ALL PROPERTY TYPES
Average Sales Price per SqFt for previous two years
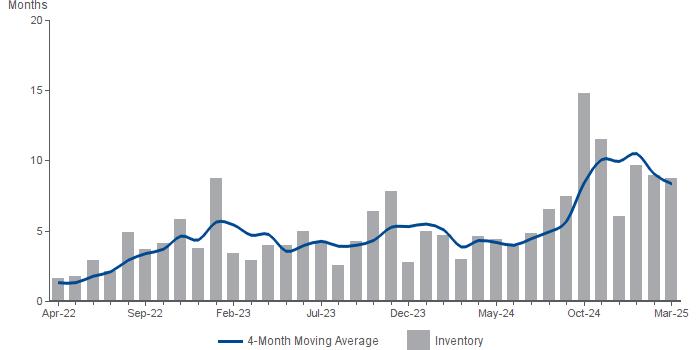
MONTHS SUPPLY OF INVENTORY
MARCH 2025 | ALL PROPERTY TYPES
Properties for sale divided by number of properties sold
AVERAGE SALES PRICE AND AVERAGE DAYS ON MARKET
MARCH 2025 | ALL PROPERTY TYPES
Average Sales Price| Average sales price for all properties sold.
Average Days on Market | Average days on market for all properties sold.
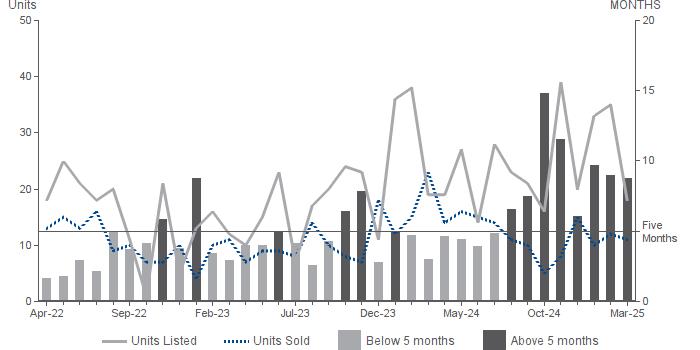
MONTHS SUPPLY OF INVENTORY
MARCH 2025 | ALL PROPERTY TYPES
Months Supply of Inventory | Properties for sale divided by number of properties sold.
Units Listed | Number of properties listed for sale at the end of month.
Units Sold| Number of properties sold.
The statistics presented in the Royal Market Watch are compiled based onfigures anddatagenerated by Burrow Services,Inc. for thebenefit ofRoyal Shell Real Estate. Due to possible reporting inconsistencies, Days on Market (DOM), average prices and rates of appreciation should be used to analyze trends only. Due to MLS reporting methods and allowable reporting policy, this data is onlyinformational andmay notbecompletely accurate. Data maintained by the MLSs may not reflect all real estate activity in the market. All information should be independently reviewed and verified for accuracy. Properties may or may not be listed by the office/agent presenting the information.
Copyright ©2025 Royal Shell Real Estate.
Information not verified or guaranteed. If your home is currently listed with a Broker, this is not intended as a solicitation.