Recent interest rate cuts have been aimed at stimulating economic growth with banks adjusting mortgage rates accordingly, but higher property prices and cost-of-living pressures are still holding some buyers back
Sydney’s property market is experiencing a slower sales pace as more listings come to market, but activity is likely to improve with anticipated future rate cuts easing pressure in the lending environment
Winter/25
Sydney Residential
Despite the slowdown, property prices continue to edge upward, supported by limited housing supply, rising buyer sentiment, and expectations of further price growth
Until considerably more homes are built and made available in the rental pool, rents are likely to keep climbing, adding to the pressure of many household budgets
The Economy Key Drivers
Interest Rate
3.85%
In May 2025, the Reserve Bank of Australia (RBA) lowered the interest rate target 25 bps to 3 85% Many banks followed this direction and adjusted their mortgage lending rates accordingly. Interest rates significantly influence the cost of borrowing money, which in turn affects the willingness and ability to apply for a home loan. The RBA forecasts the target could be 3 40% by the end of 2025, and 3 20% in 2026 When interest rates are lowered, borrowing becomes cheaper, which can stimulate demand for residential property and drive economic growth
Unemployment Rate
4.3%
Employment levels influence people’s ability to initially purchase a home and then the ongoing mortgage repayments servicing the loan The unemployment rate in Australia was 4 3% in March 2025, which is considered a healthy, balanced labour market given the rate falls within the ideal range of 4% to 5% The RBA forecasts the unemployment rate to rise by the end of 2025 to 4.3%, then remain relatively steady in 2026
Economic Growth
1.3%
Economic growth remains a key driver because it fuels job creation, boosts incomes, and increases demand across property markets Australia recorded economic growth at 1.3% in 2024, following stronger performance of 3.1% in 2022 and 1 5% in 2023 Looking forward, the RBA forecasts economic growth to lift to 2.1% in 2025 and 2.2% in 2026. Ideally, sustainable economic growth is considered to be around 2% to 3%
Population Growth
2.0%
Population growth increases housing demand as more people require places to live, putting pressure on existing housing supply and infrastructure. The Sydney annual population growth slowed to 0 8% in June 2022 as a consequence of slower migration throughout the pandemic, then rebounded to 2 8% in 2023, to record 2 0% growth in 2024 The ABS have projected the long term population growth for Sydney at 1.4%.
Source: McGrath Research, RBA, ABS
Residential Sales Update
Sales -28%
Residential sale transactions in Sydney tallied to 20,014 in the first quarter of 2025, a downward movement of 28% from the previous quarter Over the past year, the total number was 3% lower, reaching 108,289 sales. This was influenced by the total number of listings being 11 9% higher in the four weeks ending March 2025 when compared to the equivalent period last year. Other factors include the tighter lending environment with fewer people qualifying for loans and market anticipating a further reduction in interest rates by the end of the year.
Total Number of Sales
Sydney
Auctions
1,110
Across Sydney, 1,110 property auctions were held in the week ending 30 March 2025 According to CoreLogic, 59 2% of the homes were sold under the hammer. This was higher than one quarter ago at 54 8%, when 927 auctions were held By comparison, the same quarter last year saw 68 8% sold, from 414 auctions. Clearance rates above 70% suggest strong demand and a seller’s market, while a rate below 60% indicates weaker demand and a buyer’s market
59.2%
Auction Clearance Rate
Sydney
Source: McGrath Research, APM
Source: McGrath Research APM
Source: McGrath Research, CoreLogic
Residential Sales Update
Duration 71 days
Sydney homes took an average 71 days on market - from the time they were listed to the day they went under contractin the March 2025 quarter This duration was 56 days the quarter before and 65 days one year ago Historically, houses have sold faster than apartments and this was no different in the past quarter Houses averaged 66 days to sell in Q1 2025, which was 16 days longer than in Q4 2024 and 10 days more than in Q1 2024 Apartments took an average 78 days to sell, being 13 days longer than the previous quarter and 1 day more than a year ago A low number of days on market mean homes are selling fast with more desirable properties, while a high number of days suggests a slower market with above market values
Average Days on the Market
Source: McGrath Research, APM
New Listings
Newly advertised property listings in Sydney were 14 1% higher in the month of March 2025 than the equivalent period last year. This trended above the Australian average of 4 5%
Listings
Sydney’s total number of listings in the month of March 2025 were 11 9% above the equivalent period last year By comparison, total listings were 5.1% higher across Australia. Sydney,
Source: McGrath Research, CoreLogic
Source: McGrath Research, APM
Residential Prices Update
Median Price
$1,311,000
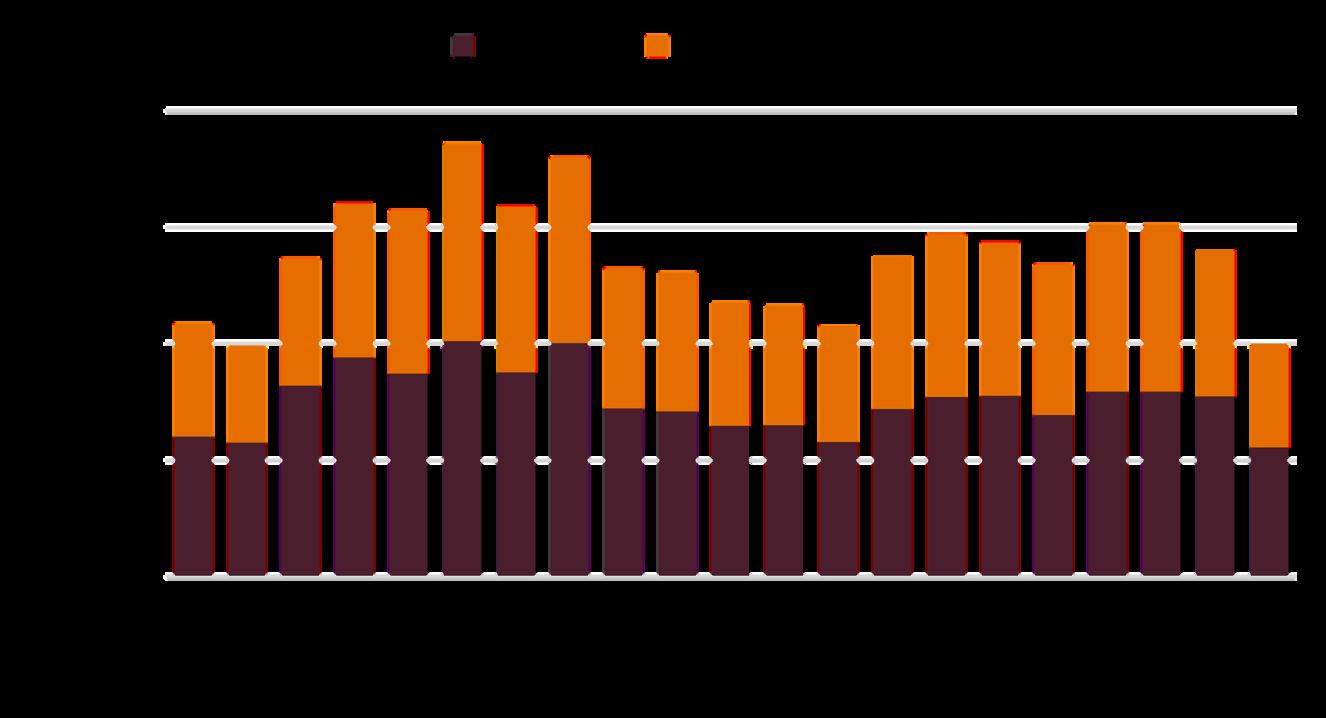
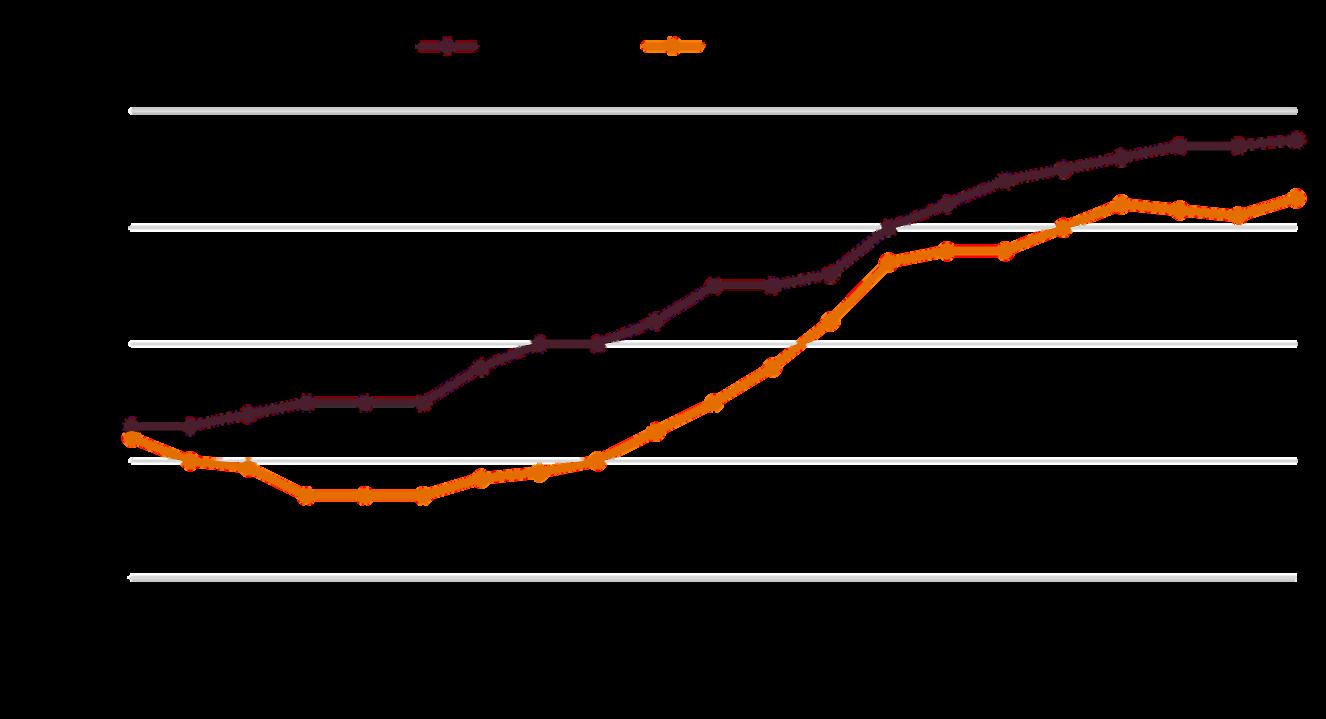
Tracking median property prices provides a benchmark for homebuyers for market performance and helps identify emerging trends Residential property prices rose by 3 4% in the year to March 2025, with a 1.3% increase recorded in the most recent quarter This brought the Sydney median value to $1,311,000, reflecting a steady upward trajectory in housing demand and resilience in the market. Median house prices, at $1,691,500, are now trending at more than double the value of apartments at $823,500 in Q1 2025 House prices grew 1 7% from a quarter ago and 4 0% over the year Over the same quarter, apartments rose by 0.4% and 1.9% in the past year
Change in Median Prices
Sydney
Source: McGrath Research, APM
Price Outlook
+4%
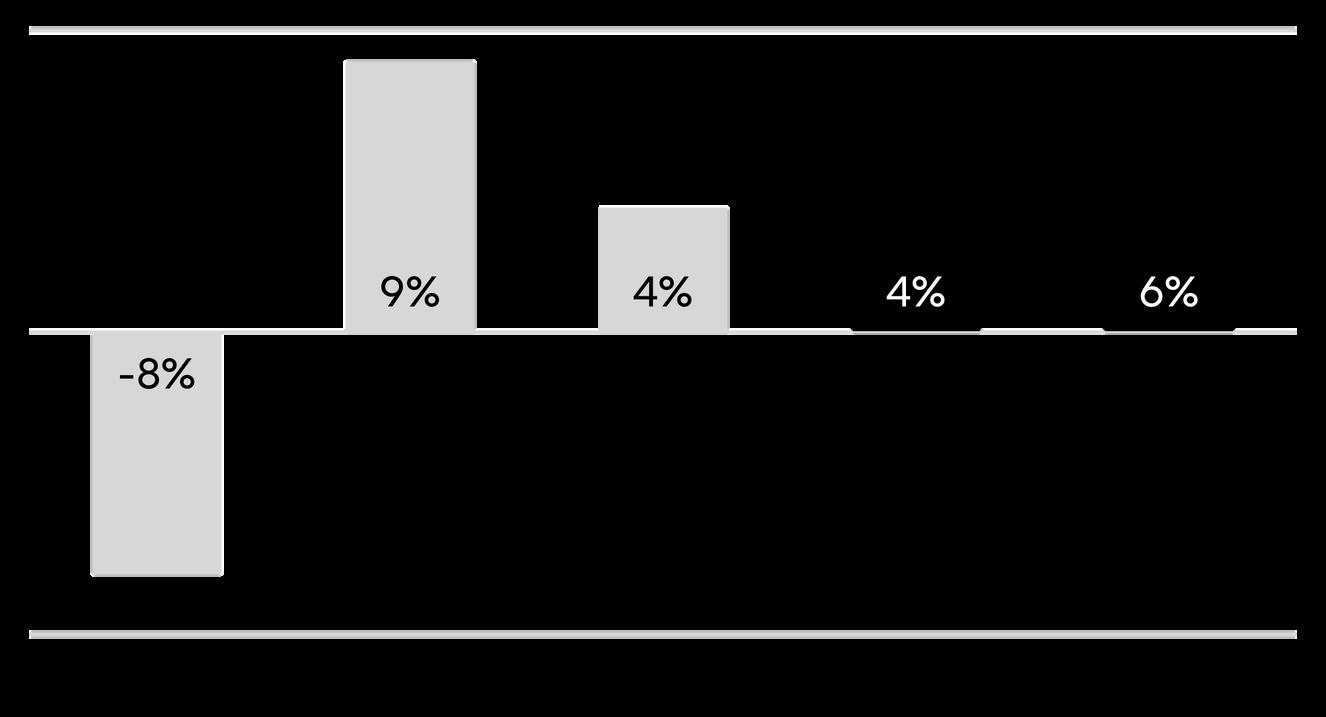
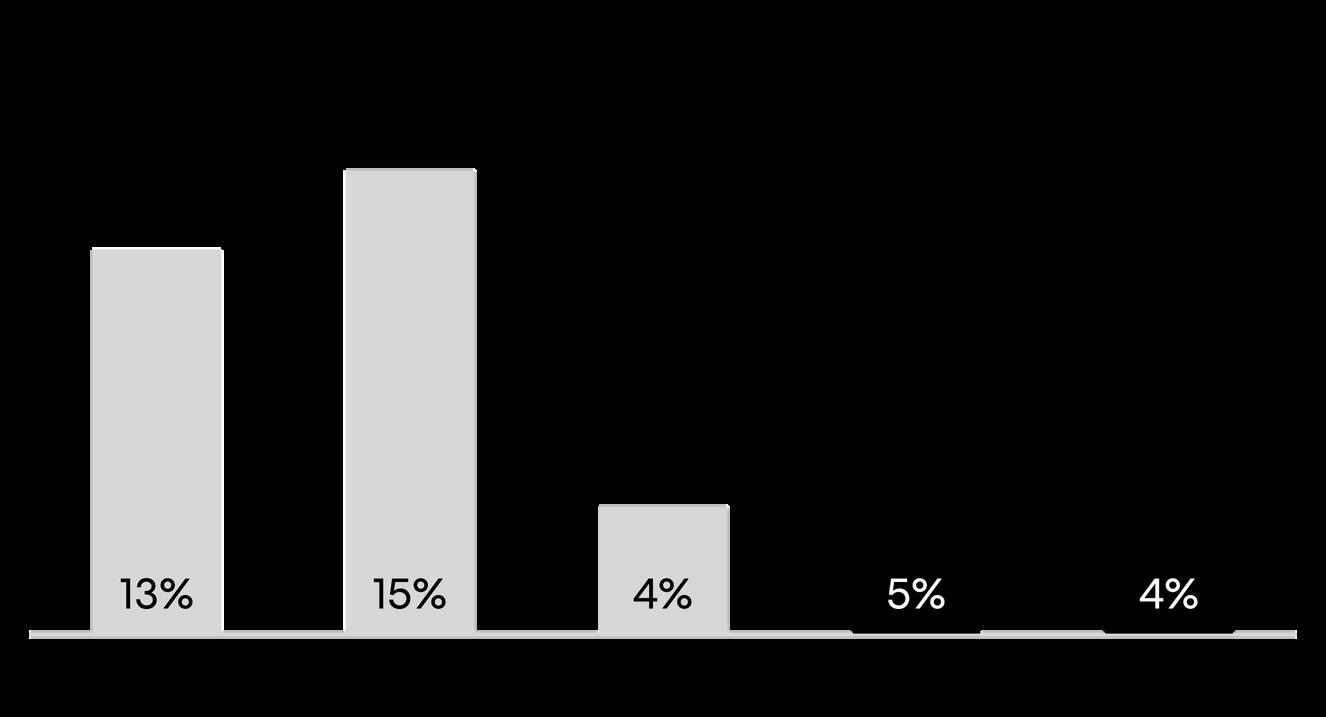
Looking ahead, McGrath Research anticipates residential property prices to increase by 4% by the end of 2025, followed by a stronger 6% rise in 2026 These projections reflect ongoing demand from limited housing supply, lowered interest rates and improving consumer confidence, suggesting a steady recovery in the housing market over the next two years
Forecast for Median Prices
Sydney
Source: McGrath Research
Source: McGrath Research, APM
Residential Rents Update
Changes in rental vacancy can have a significant impact on the residential property market, influencing both rental prices and property values. Sydney residential rental vacancy was recorded at 2 0% in Q1 2025, rising 10 bps in the quarter and in total, 50 bps over the past year Generally, 3% vacancy is considered a balanced market between rental supply and demand Below this benchmark is considered to be an undersupplied pool of rental homes
Change in Residential Rental Vacancy
Sydney
Source: McGrath Research REINSW
Yield
+11 bps
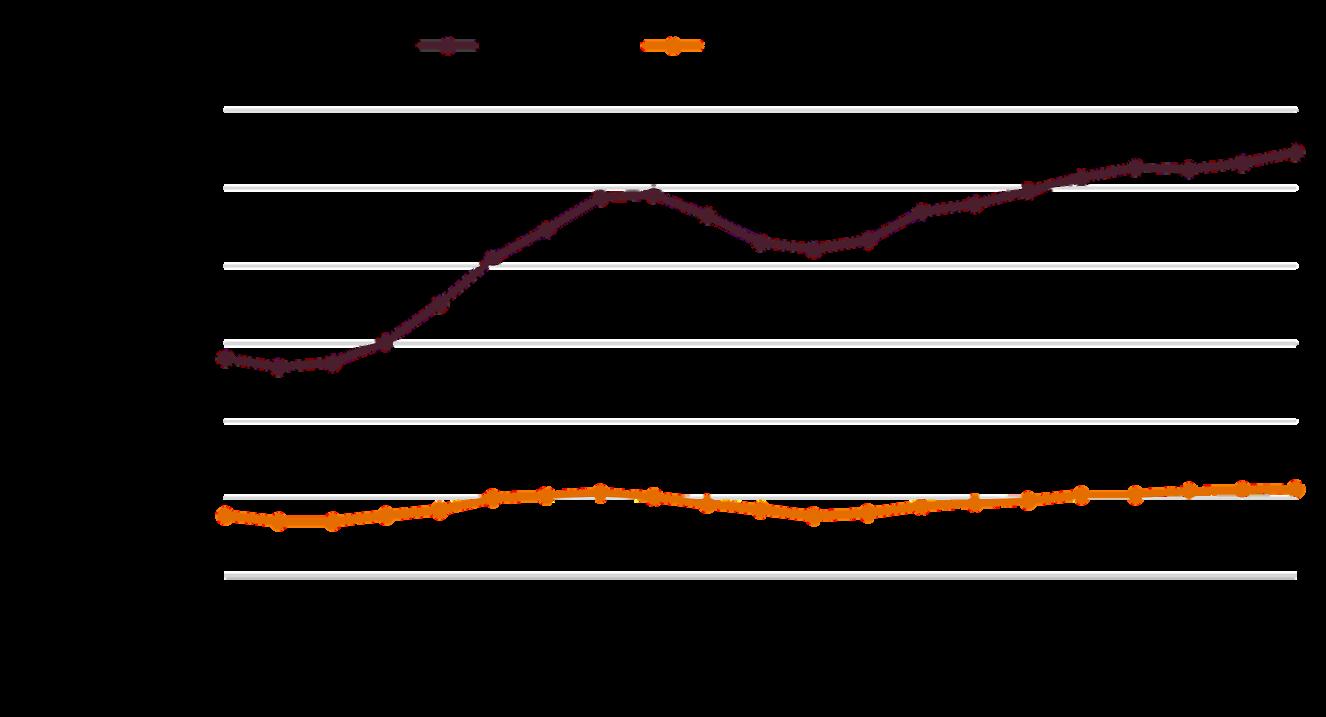
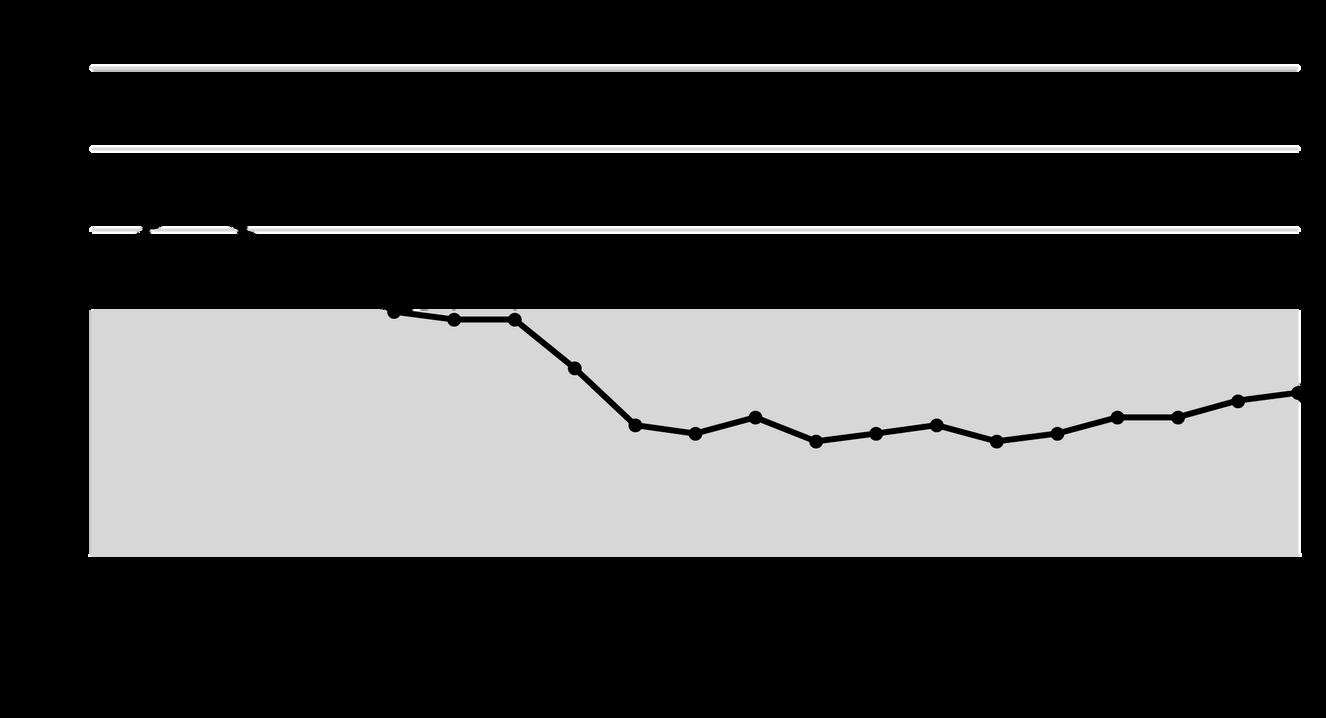
Gross rental yields are a good initial measure of comparing the return of a property investment before expenses are deducted A range of 4 00% to 5 00% is considered good for many properties located in a capital city, while below this, may indicate high property prices relative to rent, or low rental demand Sydney residential gross rental yields rose 11 bps in the Q1 2025 quarter to be 3 75%, while this was 1 bp less than a year ago. Apartment yields (4.71%) consistently outperform house yields (3 01%) in most markets House yields rose 4 bps in Q1 2025 but compressed by 2 bps over the past year, while apartment yields were 19 bps higher in this past quarter but remained steady from a year ago
Change in Gross Rental Yield
Sydney
Source: McGrath Research APM
Source: McGrath Research, APM
Residential Rents
Median Weekly Rent $755
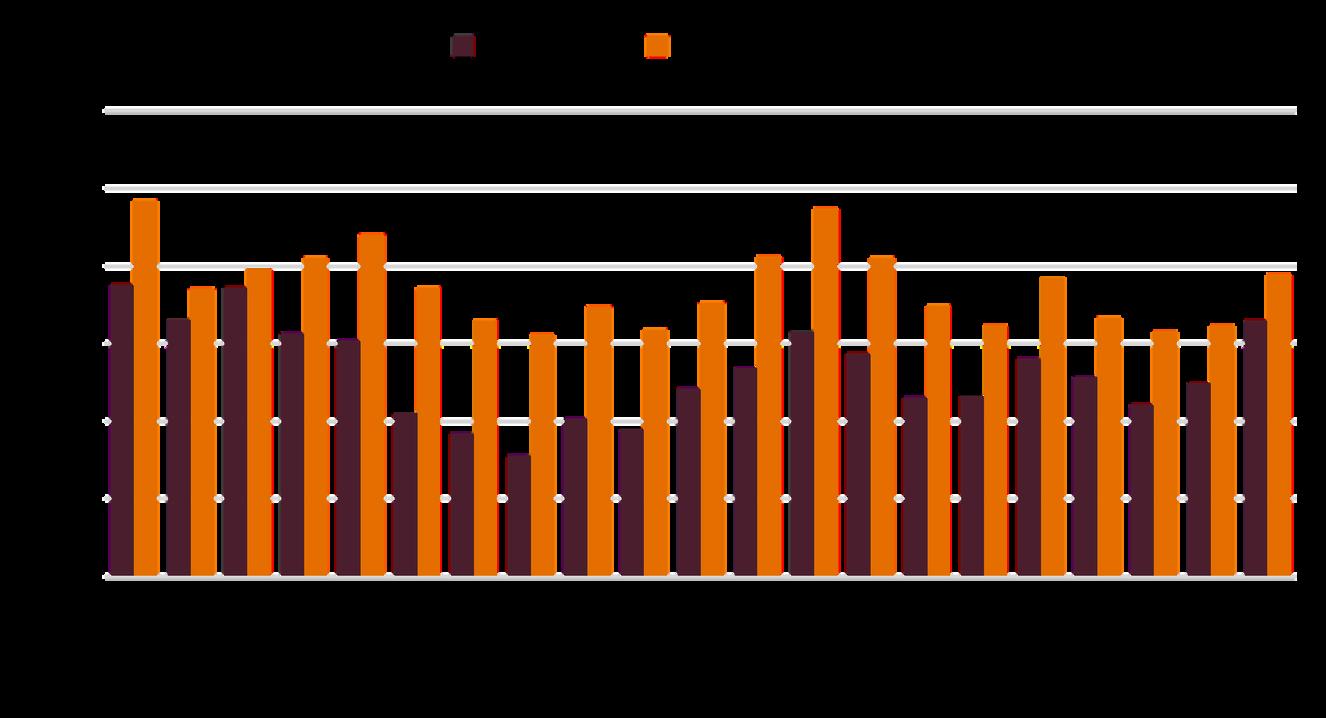
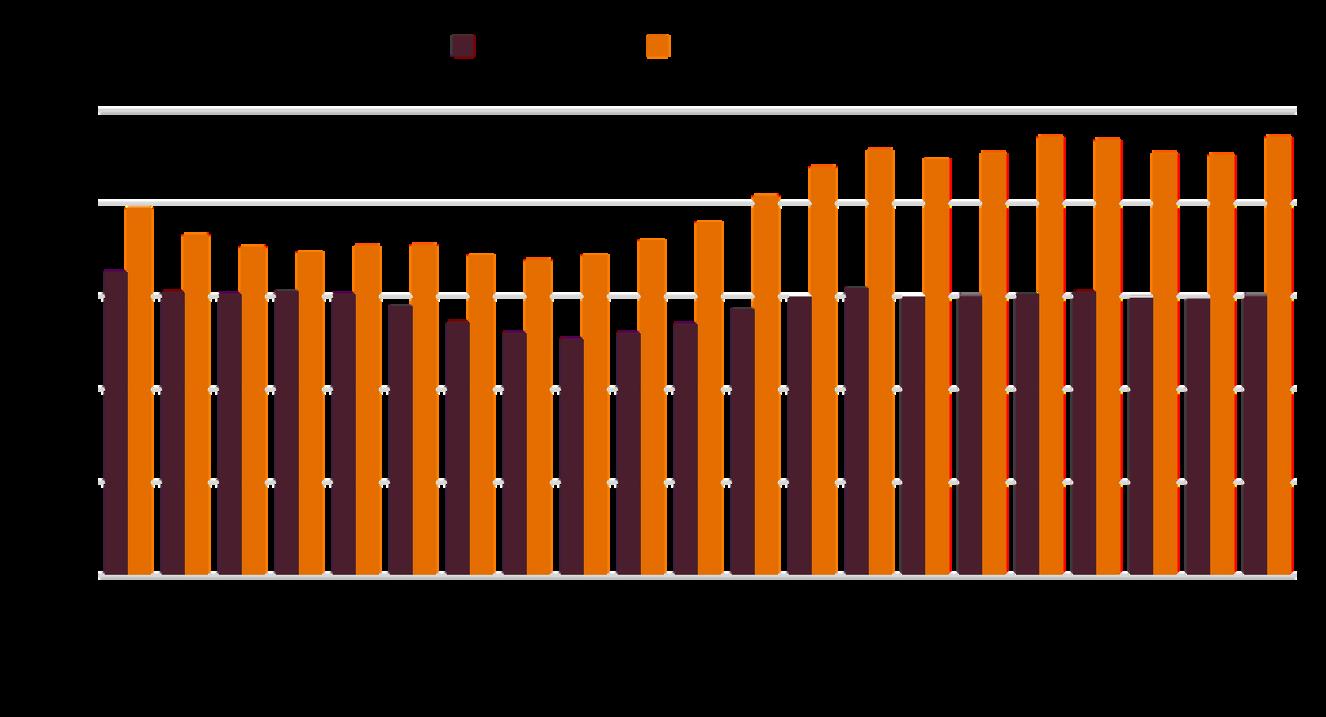
Low vacancy and high migration are keeping rents elevated across Sydney. Residential rents rose 1.3% in Q1 2025, while rents increased by 3 4% over the past year, to stand at $755 per week Median weekly house rents were $50 higher than apartments, growing by 0.6% in Q1 2025 to $775 per week, with 3 3% growth over the past year Apartment weekly rents, at $725, rose 2 1% in Q1 2025 and in the past year by 3 6%
Change in Median Weekly Rents
Sydney
Rental Outlook +5%
While Sydney continues to experience solid population growth, tight rental supply and delayed new housing completions, McGrath Research forecast sustained upward pressure on rents of 5% at the end of 2025, with a further 4% rental growth likely in 2026
Forecast for Median Rents
Sydney
Source: McGrath Research,
Source: McGrath Research
Source: McGrath Research APM
Sydney Sydney refers to the Greater Capital City Statistical Area or ‘Greater Sydney’ as defined by the Australian Bureau of Statistics