Belgrade
May 17th , 2013
Classification of KPI
Monitoring P&L KPI’s
Summary
The Driving Force in International Trade and Retail
An Overview of the Corporate Structure
Foundation of Corporate Culture Employer of some 280,000 People Around the World
METRO GROUP
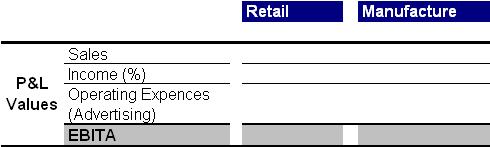
Retail vs. Manufacturing
Classification of KPI
Monitoring P&L KPI’s
Summary
Retailers are gaining profit on quantities
Short P&L details
Suppliers and customers
Method of reporting earnings is the same
Product costing vs. Trading Goods
Low cost vs. “Investing in sales”
EBIT is main KPI for measuring Company’s performance
METRO GROUP
Retail vs. Manufacturing
Classification of KPI
Monitoring P&L KPI’s
Summary
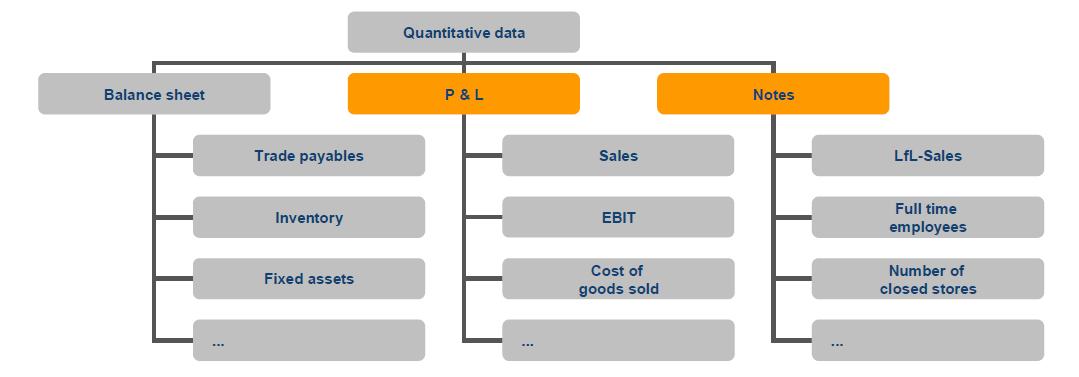
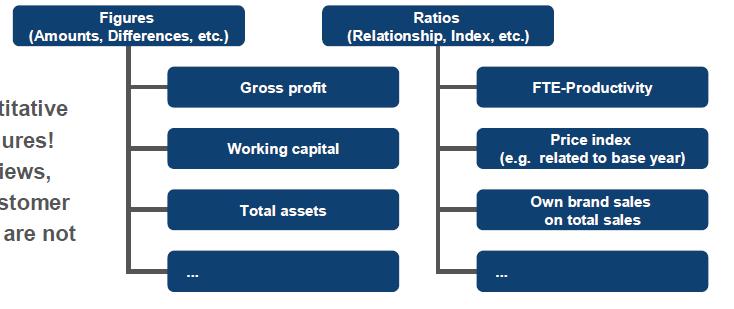
Classification of KPI
• Quantitative KPI derived from Financial Statements!
• Qualitative KPI (derived by Interviews, Monitoring, Surveys, etc.) like customer satisfaction or employee attitude
Number of NSO
METRO GROUP
Classification of KPI
Monitoring
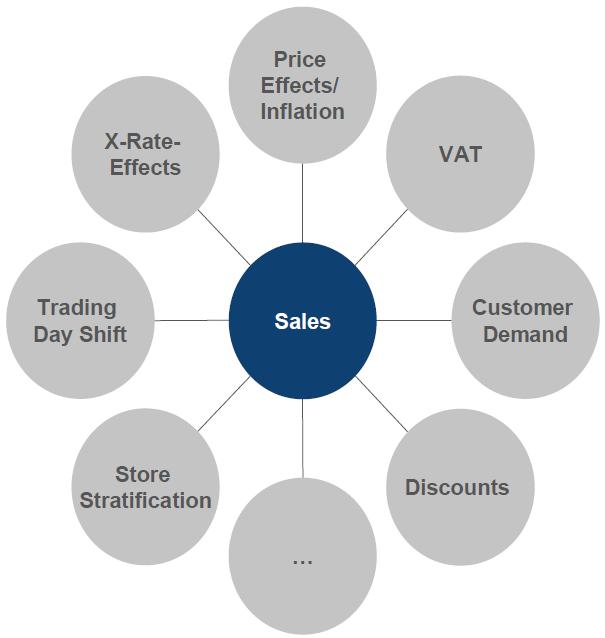
Influence factors on Sales
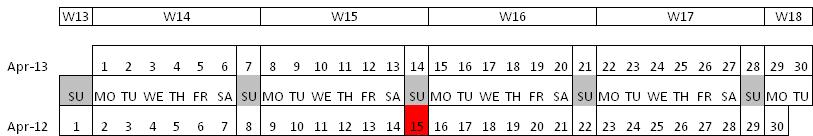
Sales - Trading day shift Do we earn more sales on Wednesdays or Saturdays?
Example: Day Effects of April 2013
Sales of Tuesday will contribute to 2013 instead sales of Sunday Ortodox Easter in 2012 leads to additional Sunday in 2013
Sales - Trading day shift (I)
In 2012 two Big effects in April: Easter and 1st of May
Bank Holiday effect = (Actual sales of weekday / Ø-sales of weekday) - 1
Sum effect abs. 2012: Holiday effect * Average weekday sales in 2012
Choose months for individual periods Serbia April April Country Start month End month
Sum effect abs. 2013: Holiday effect * Average weekday sales in 2012 Combined effect (Day constellation & Bank Holiday effect)
2013 (simulated): Sum of Ø-sales per weekday per month in 2012
•Problem 1: Holidays do sometimes not affect the whole country.
•Problem 2: Holidays do in some countries not indicate closed stores.
•Problem 3: Bridge days do sometimes compensate potential sales losses (especially food).
•Problem 4: No time period shifts (e. g. Easter effects).
„Head-Terms“, direct related to the article Not traceable to article
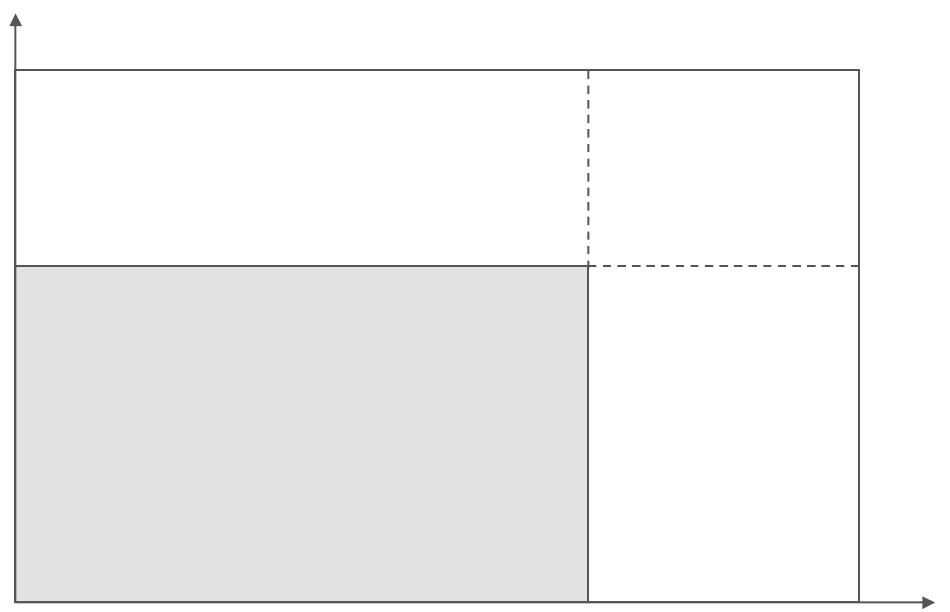
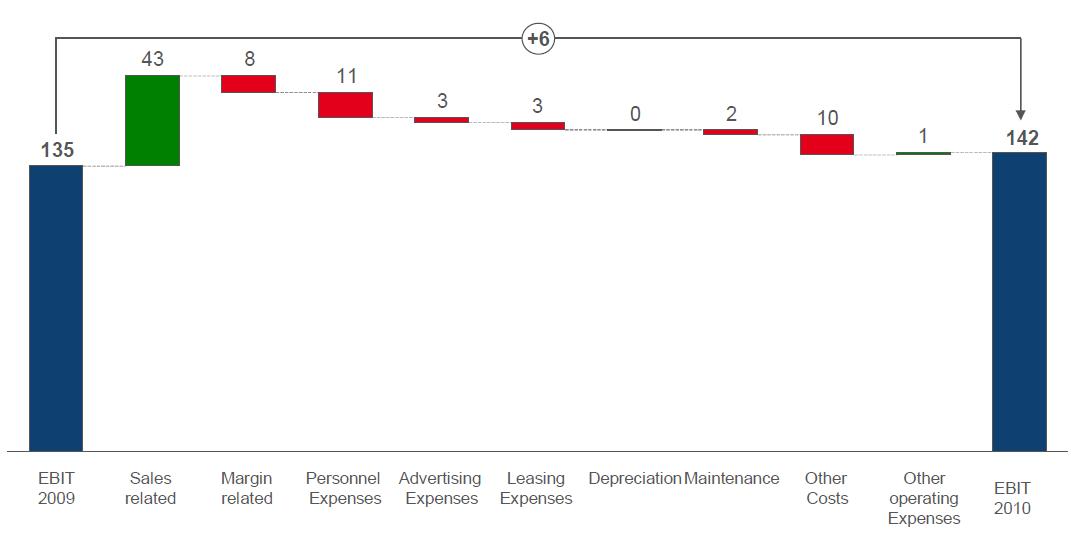
Calculation of income variances Income Variance
Income: t0: 8,8% x 1.000 = 88 € Margin in % o.s. t1: 10,2% x 1.300 = 132,6 € : 44,6 €
10,2%
Margin-related variance:
Sales-related and marginrelated variance: (10,2% - 8,8%) x 1.000 = €14 8,8% t0
Sales-related variance: t1 (10,2% - 8,8%) x (1.300 -1.000) = 4,2 (1.300 – 1.000) x 8,8% = €26,4
Example: Discount Impact
ABC Trading company has weekly sales of 500 € (quantity 500 with a price of 1 €).
The gross profit margin is 20%.
For one week there is a special promotion campaign which is offering 5% discount.
What is the necessary quantity growth to reach the same gross profit as before?
Example: Discount Impact
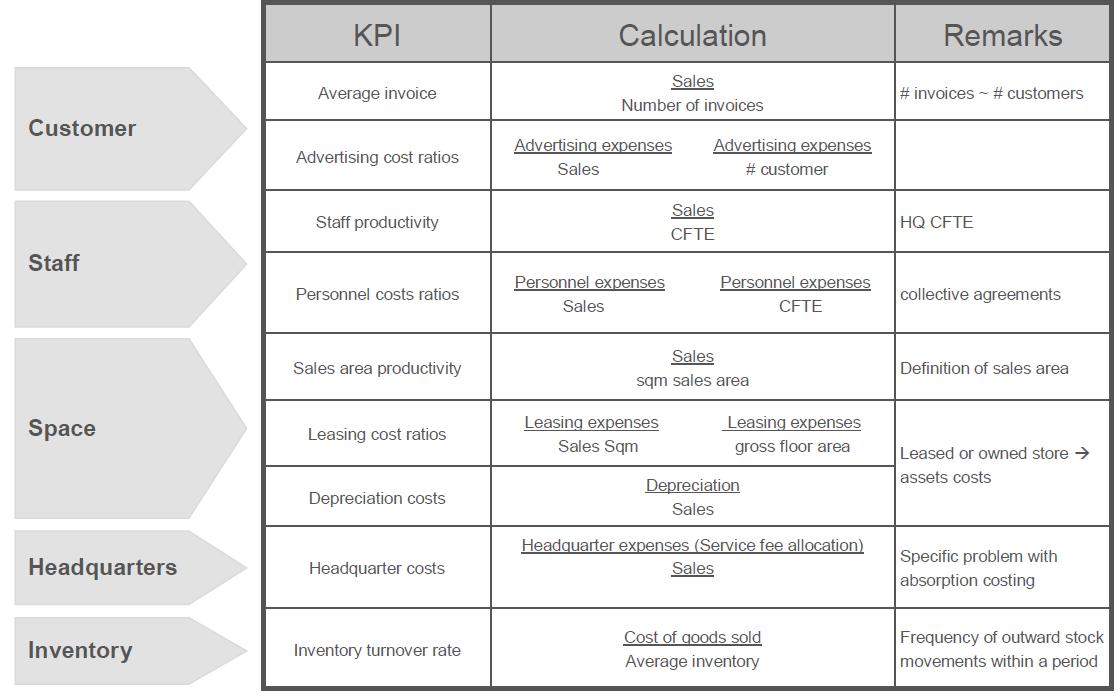
Selected sales, margin and cost related KPIs
METRO GROUP
Retail vs. Manufacturing
Classification of KPI
Monitoring P&L KPI’s
Summary
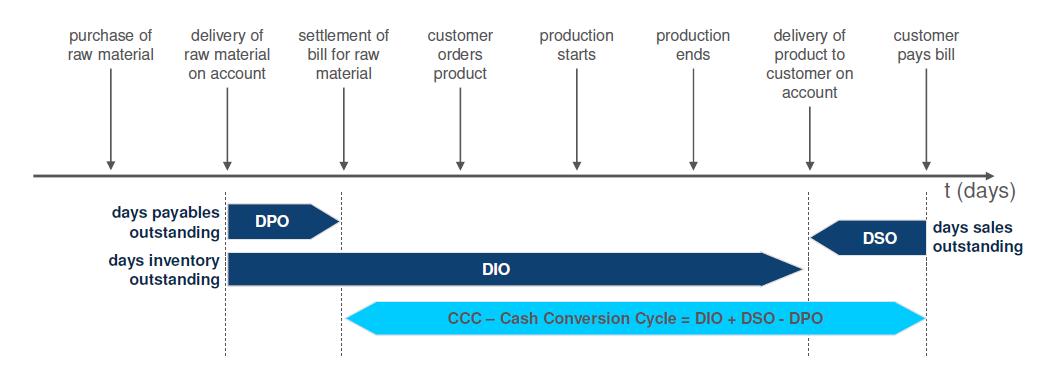
Cash Conversion Cycle (CCC) – Manufacturing Company.
Cash Conversion Cycle (CCC) – Manufacturing Company.
The Cash Conversion Cycle refers to the number of days, the capital is “locked” in the company. The shorter the better.
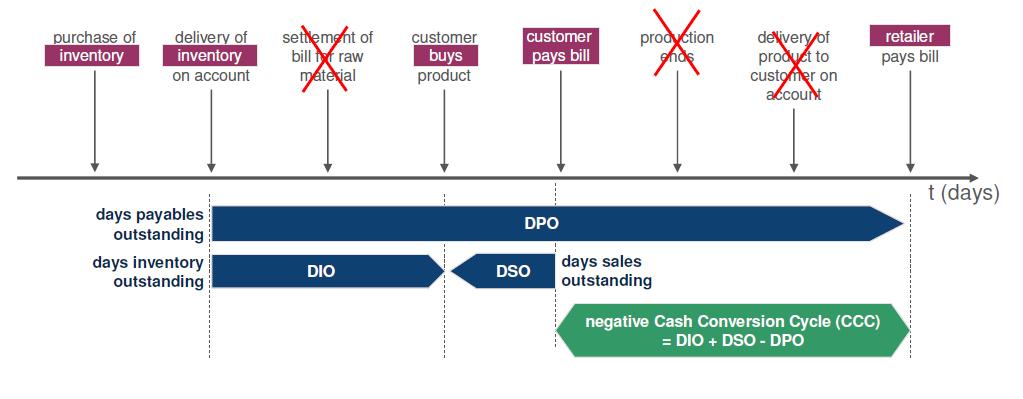
Cash Conversion Cycle (CCC) – Retail Company.
Cash Conversion Cycle (CCC) – Retail Company.
= DIO + DSO DPO
•The Cash Conversion Cycle of a retail company is ideally negative.
•The retailer pays his bill after the customer has bought the product.