A Commercial Real Estate Publication at the Intersection of Information and Innovation
The AI Advantage
Kyle Matthews’ Toolkit for Winning CRE in 2026 & Beyond
A Commercial Real Estate Publication at the Intersection of Information and Innovation
The AI Advantage
Kyle Matthews’ Toolkit for Winning CRE in 2026 & Beyond
Top 10
Multifamily Markets for 2026
Retailers Driving National Growth
Multifamily in Transition Supply Imbalances, Capital Re-Engagement, & a New Underwriting Era


Emerging

Reawakening

Publications Leanne
McKenna


Research
Daniel


The AI Advantage
Kyle Matthews’ Toolkit For Winning CRE in 2026 & Beyond
Tenant Radar 10 Retailers Driving National Growth

Multifamily Supply Paradox Too Much, Too Fast

Top 10 Multifamily Markets For 2026

Institutional Capital Returns to Multifamily

The New Underwriting Playbook What’s Driving Multifamily Decisions for 2026?
As I reflect on our journey over the last decade, I’m filled with gratitude for your trust, your loyalty, and your role in helping us grow into one of the nation’s leading names in commercial real estate. Last year we shared the next chapter in that journey, one that’s as much about honoring our legacy as it is about shaping our future.
Matthews Real Estate Investment Services™ will simply be known as Matthews™.
This rebrand was more than a name change. We’ve long operated as a modern, agile, tech-forward company. Now, we’ve simply put a name to what we’ve already become: a firm built for the speed and complexity of today’s market, without ever compromising the expertise, hardwork, and clientfirst mindset that defines Matthews™.
The world is evolving and so is commercial real estate. As technology reshapes how business is done and expectations around speed, access, and intelligence grow, we knew it was time to evolve the Matthews™ brand to better reflect the company we are building. A brand that’s bold, streamlined, and digital-first, rooted in deep market expertise and a forward-thinking approach.
Dropping “Real Estate Investment Services” from our name allows us to express a more focused, modern identity—one that better resonates with our clients, our agents, and the markets we serve.
We also refreshed our visual identity. Our new darker blue palette communicates a deeper sense of strength, confidence, and sophistication, while still staying true to who we have always been. It’s a subtle but meaningful change that aligns with the energy and direction of the Matthews™ brand.
This darker tone mirrors our unwavering commitment to excellence and bold thinking. It sets the stage for innovation while underscoring our promise to deliver value, integrity, and long-term success in every interaction.
While our look and name evolved, our mission remained constant: to be the most trusted, hardestworking, and tech-driven firm in the business.
We still and always will be hyper-focused on client success. Relentless in pushing boundaries. And rooted in the relationships that got us here.
Thank you for being part of our story. The future of Matthews™ is bold, dynamic, and just getting started. We’re honored to have you with us along the way.
With appreciation,


PROPERTIES
DEALS
INSIGHTS

TRANSFORMING
How We Prospect, Market, & Close


DELIVERING Instant Market Clarity with Precision-Curated Insights


Brokerage is evolving, and today’s top producers are leaning into better tools and smarter systems not to reinvent the business, but to elevate how they operate. AI and modern systems now enable brokers to identify the right opportunities faster, stay consistently engaged with their relationships, and walk into every conversation better prepared. As the market becomes more competitive and information-rich, the brokers who master these tools will operate with clarity and efficiency, which compounds into stronger deal flow over time. The following Q&A with Kyle Matthews explores how these shifts are shaping the way brokers work, compete, and win.


“Winning smarter means ruthless efficiency. It’s about eliminating 80% of the work that doesn’t help produce revenue,” Matthews says.

Productivity now hinges on action, not accumulation. Speed isn’t just an advantage—it’s the differentiator between a deal that closes and one that stalls.
“In 2025, the smart broker isn’t the one who spends six hours building the perfect property analysis. It’s the one who uses modern tools and spends the other 5.5 hours prospecting. Winning smarter is about leveraging technology to automate timeconsuming, low-effort work, freeing up that primetime cognitive energy for originating new business.”
By 2026, AI is no longer a toy; it’s the ultimate assistant. This shift from passive to proactive brokerage is where AI delivers its greatest value.
“I expect AI to be our broker’s prospecting engine. It should be sifting through public records, loan maturity data, and market trends to build a “hot list” every single morning. It should be telling my broker, ‘This owner is 80% likely to sell in the next 12 months. Here’s their contact info.’”
He continues:
“AI’s job is to tee up the ball. The broker’s job is to hit the ball. The technology does the heavy lifting. This allows them to move from reactive brokerage (waiting for a call) to proactive deal-making, all while freeing up time to call their agent network for offmarket intel.”

In practical terms, brokers aren’t just reacting to the market anymore—they’re anticipating it. Instead of spending hours assembling fragmented intelligence, brokers start their day with a curated set of opportunities that actually matter. They’re not chasing leads; they’re prioritizing the ones most likely to convert.
This shift also transforms how brokers approach clients. Rather than relying on broad outreach, they can open conversations with specific, data-backed insights that immediately differentiate them. When a broker shows up with clarity on a seller’s timing or a buyer’s emerging criteria, they demonstrate value from the start. Those who embrace these tools consistently show up earlier, better informed, and more confident, qualities that compound quickly and directly influence deal volume.
“Technology doesn’t create deal flow. Brokers create deal flow. Technology’s job is to create the system for consistency,” Matthews says.
“A good tech AI tool never forgets. It turns a chaotic list of contacts into a systematic prospecting machine. It should automatically log calls, schedule the 90-day follow-up, and prompt a broker when a relationship is going cold. Consistent deal flow is the direct result of consistent, disciplined activity. Technology is simply the tool that removes friction and excises from that process.”
One of the biggest challenges for brokers isn’t effort—it’s the sheer volume of tasks and relationships competing for their attention. AI cuts through that noise by simplifying follow-up, organizing outreach, and ensuring that nothing slips through the cracks.
By systematizing these touchpoints, AI supports a steady, predictable pipeline and gives brokers a clear, real-time view of their business. With this clarity, they can prioritize the highest-value activities each day rather than reacting to to urgent tasks.
Ultimately, technology reinforces the habits that top producers already rely on: timely follow-up, consistent outreach, and structured relationship management. When AI handles repetitive administrative work, brokers regain bandwidth to focus on conversations, insights, and client interactions that actually move deals forward.
“This is about the long game. Innovation isn’t about the next shiny object,” Matthews says.
“Every cold call, every agent lunch, every piece of intel my team gathers, that is our data. The innovation I care about is the platform that makes it effortless for Matthews™ agents to capture that data.”
The brokers who consistently outperform are the ones who treat each interaction as part of an ongoing progression: conversations documented, follow-ups tracked, and market signals organized in a way that compounds their understanding of the business. True innovation builds the structure that supports this compounding effect with minimal effort on the broker’s part.


When this information is captured automatically, brokers gain clearer visibility into where relationships stand, which owners are moving closer to a decision point, and where their attention will generate the most momentum. It replaces the uncertainty that once defined slower parts of the cycle with clarity and direction. Patterns become easier to recognize, timing becomes easier to judge, and pipelines become more predictable.
What matters most isn’t the pace of technological change, but the platforms that integrate seamlessly into a broker’s workflow, empowering them to stay organized, make informed decisions quickly, and build long-term leverage through better data. Sustainable deal flow comes from sustainable systems, and innovation is what keeps those systems operating at the speed the market now demands.
This brings it all together.
“Winning with AI means augmenting producers, not replacing them,” Matthews says.
“AI handles the science of brokerage: ‘Who to call,’ ‘When to call,’ ‘What property data to reference.’ This frees brokers to master the art of brokerage: the tonality of the call, the ability to build rapport in 30 seconds, the intuition to navigate an objection meeting.”
He adds:
“The broker who wins with AI is the one who treats it as their personal team, allowing them to increase their volume of high-quality, human-to-human connections.”
AI creates real lift by removing the need to split attention between research and outreach. Brokers start their day with precision, organization, and timing already built in, allowing them to pour their full energy into the conversations and decisions that move deals forward.
Those who excel in this environment use AI to sharpen their instincts rather than replace them. They begin each day with clarity on priorities such as who to call, what to reference, and where to focus, turning that clarity into stronger relationships, more consistent activity, and ultimately more closings.
At its core, brokerage remains a relationship-driven business. AI doesn’t change that. What it changes is a broker’s capacity to show up better prepared, more often, and with deeper insight. When technology removes the noise, brokers have more room for the work clients actually feel: presence, expertise, and human connection.
“ “

GlobeSt.com — the commercial real estate industry’s trusted national brand—delivering essential insights and strategic intelligence across every region and property sector. We offer high-impact visibility for marketers through trusted editorial, nationally recognized events, and dynamic digital platforms. Backed by a legacy of industry leadership, we connect and engage owners, investors, lenders, developers, and brokers with the information and opportunities that drive CRE forward.
Our trusted team of industry experts is dedicated to delivering the key insights, in-depth analysis, and proven best practices essential for commercial real estate owners, investors, developers, brokers, and finance professionals. We’re here to celebrate innovation and success, providing our readers with digestible, actionable information that transforms complex trends into real-world applications—ensuring you stay ahead of the curve.
GlobeSt’s vibrant event portfolio features a mix of local and national forums tailored to tackle the most pressing challenges across sectors like Healthcare, Multifamily, Net Lease, and Women of Influence. Connect, network, and learn from industry leaders in an inspiring environment designed to drive your business forward. Don’t miss out on your chance to navigate the future of commercial real estate with confidence!

Reaching more than 300,000 CRE professionals across all markets, sectors and business disciplines, GlobeSt.’s unique integrated business model allows us to deeply understand the dynamic real estate industry and the evolving needs of our audience. Join our community today!

Following the pandemic, the multifamily sector entered a period of strength driven by a rapid unfreezing of household formation. Vacancy rates plummeted to record lows as demand outpaced available units, fueling double-digit rent growth across many metros. This exceptionally strong fundamental performance sent a clear signal to developers and investors, sparking a massive wave of new development and recordbreaking sales figures. Capital flooded into the sector, initiating the largest construction pipeline seen in decades as the market rushed to meet the insatiable demand for housing.


The momentum shifted as the Federal Reserve began an aggressive series of interest rate hikes to combat inflation. On the demand side, economic uncertainty made renters more price-sensitive and cautious, causing absorption to moderate just as the record levels of new supply began to deliver. This supply-demand mismatch flattened rent growth in many areas, and even turned rent trends negative in the most high-supply markets. Simultaneously, the high cost of capital made financing new projects prohibitively expensive for developers. But now, new construction starts have ground to a halt, likely leading to medium-to-long term undersupply, once the market absorbs the 2024 and 2025 built inventory.
Beyond the operational shifts, rising interest rates caused a dramatic contraction in the capital markets. As borrowing costs surged past cap rates, the math for acquiring properties no longer worked at previous valuations, causing sales activity to fall as owners and sellers couldn’t get on the same page. Owners with existing low-interest debt held onto their assets rather than refinancing or selling into a down market, while buyers retreated due to negative leverage. This created a significant pricing gap between buyers and sellers, resulting in a prolonged period of transaction stagnancy while the market waits for rate stability. But, as we enter 2026, there are a lot of signs pointing to a major rebound for multifamily investment.
Source: Matthews™ Research, CoStar Group, Inc.
While the initial shock of inflation dominated headlines early in the decade, households actually have seen their earnings grow faster than inflation for most of the decade. Average hourly earnings growth continued to outpace inflation, widening the spread that had turned positive two years prior. By mid-2025, nominal wage growth held just below 4% while inflation cooled to the mid-to-high 2% range. This sustained period of real wage growth meant that renters, despite economic fear, have actually strengthened their finances over the last three years.
The average American’s balance sheet remains historically strong. A key metric to watch is the Household Debt Service Ratio, debt payments as a percentage of disposable personal income. Throughout 2025, this ratio hovered near 11.2%, a healthy level significantly below the peaks seen prior to the 2008 financial crisis. This data indicates that renters are not over-leveraged; even with higher interest rates on credit cards and auto loans, the consistent growth in disposable income has kept the monthly burden of debt manageable, preventing the wave of delinquencies that many analysts had incorrectly forecasted.
Source: Matthews™ Research, Federal Reserve
Perhaps the most defining characteristic of 2025 was the massive disconnect between how renters felt and how they actually performed. Consumer sentiment indices remained stubbornly low throughout the year, reflecting deep-seated nervousness about a potential recession. However, the economic pain renters feared largely failed to materialize. Unemployment has remained in the mid-4% range, a level that is considered balanced historically, and consumer spending continued to show surprising durability. Renters prepared for a hurricane that never made landfall, resulting in a dynamic where caution curbed positivity.
In 2026 we expect to see an increase in household formation, largely driven by the continued cutting of interest rates by the Federal Reserve and the impact that will have on the broader economy and labor market. If economic expectations turn positive, renters have the financial firepower to make 2026 a year where multifamily markets tighten significantly.


The primary catalyst for the 2026 outlook is the improvement in the cost of capital. As interest rate cuts work their way through the system, the cost of debt is finally receding, making leveraged returns attractive once again. This shift is expected to trigger heightened buy-side competition as capital that has been on the sidelines moves to deploy before the window of opportunity closes. The influx of bidders will likely halt the expansion of cap rates, causing yields to flatten and potentially compress in high-demand areas. We also expect a return to solid asset appreciation in the multifamily tranche, driven by both improving performance and lower lending rates.
The Federal Reserve forecasted they would cut rates once next year during their December meeting, but media economists are expecting 3 or 4 rate cuts in 2026. We believe the most likely scenario for next year is a 50-basis point reduction to the Federal Funds Rate. It should be noted that due to Powell’s term ending next spring, it is more likely these current Fed projections are too conservative than too aggressive.
The combination of accessible financing and rising asset values is expected to break the investment logjam. We forecast a roughly 10% to 15% jump in transaction volume in 2026 compared to 2025. This increase represents a release of pent-up liquidity from institutional and private investors who have been waiting for the bid-ask spread to close. As confidence in the new valuations solidifies and lenders increase their allocations, the market is expected to transition from a 3-year period of stagnation to a period of more active deal flow.

BY DAVID FERBER, CPA
After several cautious years, institutional investors, large, professionally managed funds such as private equity groups, pension funds, and insurance companies, are decisively returning to the multifamily market. In the first quarter of 2025 alone, U.S. multifamily investment totaled $28.8 billion, with institutions representing a substantial portion of that volume. Momentum accelerated through mid-year and into the fall, with apartment sales rising 13% year-overyear in the third quarter to $43.8 billion. Together, these figures underscore a renewed confidence in multifamily fundamentals and the broader capital markets.
Source: RCA
$50B
$40B
$30B $20B
$10B
$0
Evidence of this institutional re-engagement is already visible across the public REIT landscape, where capital deployment has meaningfully increased. AvalonBay Communities (AVB) has completed $618.5 million in year-to-date acquisitions, including the purchase of six Dallas-Fort Worth communities totaling 1,844 units for $431.5 million, a clear signal that major operators are once again pursuing scale in high-growth markets.
Similarly, Equity Residential (EQR) executed one of the largest multifamily trades of 2025, acquiring a stabilized Atlanta portfolio of 2,064 units for approximately $533.8 million at a 5.1% acquisition cap rate. The move marks the company’s strategic re-entry into key Sunbelt markets and aligns with its thesis that fundamentals in select growth metros are strengthening.
These transactions validate what private-market investors are beginning to experience in real time: capital is flowing back into multifamily,
Institutional capital doesn’t just participate in the market, it helps define it. These investors establish pricing benchmarks, influence underwriting standards, and restore liquidity when they reengage. As large funds return, their activity helps narrow bid-ask spreads, reprice assets more accurately, and reignite stalled deal flow.
They also serve as early indicators of sentiment. When institutions retreat, it often precedes a broader slowdown. When they return, it signals that investors once again see an opportunity worth pursuing. For 2026, this renewed participation suggests that the worst of the correction may be behind the multifamily sector.
Institutional activity effectively sets the tone for the entire industry. Their re-entry signals that confidence is rebuilding and valuations are stabilizing. As more funds re-engage, competition for quality assets will likely increase, gradually pushing prices upward,


Between 2022 and 2024, rising interest rates and tightening credit made financing more expensive and constrained deal flow. Sellers held out for 2021-level pricing, while buyers needed discounts to offset higher borrowing costs. Economic uncertainty, slower rent growth, and rising construction expenses compounded hesitation on both sides. Multifamily transaction volume declined more than 50% from 2021 to 2023, then began rebounding in 2024 as pricing reset.
Source: Forbes
Transaction volumes fell sharply as many funds shifted from acquisitions to asset management. Some firms focused on operational improvements, while others simplified their portfolios, selling topperforming properties to raise liquidity. For a time, sitting on the sidelines felt safer than overpaying in an unpredictable market.
That caution began to ease as prices reset and underwriting discipline took hold. Property values adjusted to more sustainable levels, rent growth stabilized, and buyer competition thinned, giving patient, well-capitalized investors a clear window to re-enter. Today, institutions are positioning for long-term ownership, emphasizing stability over speculation.
The map of institutional investment in 2025 looks more balanced than in previous cycles.
Sunbelt and Growth Markets: Metros such as Dallas, Atlanta, Tampa, and Nashville continue to draw attention for their job and population growth. However, investors are far more selective than in past years, steering clear of submarkets facing oversupply or softening rent trends. Several of the sector’s strongest performers are signaling improving fundamentals, with UDR’s CEO noting that “third-quarter operational results… exceeded our expectations and drove our second FFOA per share guidance raise of 2025.” This growing confidence reinforces why capital continues to gravitate toward markets where performance momentum is beginning to firm.
Secondary and Midwest Markets: Secondary metros including Kansas City, Columbus, and Raleigh are gaining traction for their relative affordability and resilient fundamentals. In the Midwest, places like Indianapolis, Minneapolis, and Omaha, stable performance, limited new supply, and strong occupancy are reinforcing investor confidence.
Coastal Gateways: Some institutions are cautiously returning to traditional gateway markets such as New York, Northern New Jersey, and Boston, but mainly for core, stabilized assets where pricing has reset and cash flow is durable. What’s notable about
Sunbelt
Secondary and Midwest Markets
Coastal
this cycle is how targeted that re-entry has become within the gateway universe. The PwC/ULI Emerging Trends 2026 rankings place the broader NYC ecosystem among the most institutionally favored areas in the country, with Jersey City emerging as a top national market to watch (ranked #2 overall) and Northern New Jersey also landing in the leading tier of U.S. markets. For multifamily, the survey sentiment skews positive toward apartment acquisitions in North Jersey, reinforcing that institutions see the North Jersey/Jersey City corridor as a neargateway location where renter demand, commuter connectivity, and long-term liquidity still justify fresh allocations.
Sales Volume ($M)
Source: RCA


Newer, high-quality properties in prime locations remain the cornerstone of institutional portfolios. Typically built within the last five years and supported by strong employment and income demographics, these assets offer consistent cash flow and low operational risk. Institutions value these assets for their predictability and inflation resilience, often using them as portfolio anchors. For example, a newly delivered high-rise in a prime urban employment corridor, featuring rooftop amenities, coworking suites, and EV-charging stations, can maintain exceptionally high occupancy and command premium rents due to strong demographic fundamentals.
Class B assets have become strategic targets for value creation. Pricing for this segment has corrected more sharply than for newer assets, allowing institutions to drive returns through operational execution rather than market timing. The focus is on steady repositioning over several years, moderate rent growth through modernization while maintaining affordability relative to new construction.
Properties serving middle-income renters continue to attract institutional attention. Undersupply in this segment and limited new construction make it one of the most resilient asset classes. These investments align with ESG priorities while offering consistent performance across cycles. Recent REIT activity in Q3 2025 underscores the trend, with several public funds increasing exposure to workforce housing due to strong occupancy and dependable rent collections.

In 2026, institutions are closely tracking interest rates, rent growth, employment trends, and new construction activity. With greater stability emerging across these indicators, the year is shaping up to be the next phase of capital deployment, defined by selective acquisitions, creative financing, and disciplined, fundamentals-driven expansion.
The overarching message remains clear: institutional investors are not pursuing quick wins. They are building portfolios engineered for resilience, emphasizing stable income and long-term value creation. Their renewed engagement reinforces a lasting truth, multifamily continues to be one of the most reliable asset classes in commercial real estate. Investment strategies are being anchored in fundamentals that outlast cyclical volatility. Markets with expanding job bases, steady population inflows, and limited new supply are capturing the most attention.
Institutions are also focused on durability, assembling portfolios that perform through full cycles rather than just during upswings. This requires prioritizing cash-flow consistency, maintaining prudent leverage, and emphasizing operational excellence. The mindset for 2026 is deliberate and measured: grow steadily, manage risk thoughtfully, and avoid the excesses that characterized the last expansion.


In a rare bipartisan move, Congress has permanently extended the New Markets Tax Credit (NMTC) program, one of the most effective yet underutilized tools in commercial real estate. For developers and investors focused on redevelopment, adaptive reuse, and community-oriented projects, this is a milestone moment. Here’s a breakdown on why it matters.


Created under the Community Renewal Tax Relief Act of 2000, the NMTC program is a federal incentive designed to attract private capital into low-income and underserved communities.
Administered by the U.S. Department of Treasury’s Community Development Financial Institutions (CDFI) Fund, the program allows private investors to receive federal tax credit for equity investments made through Community Development Entities (CDEs). In turn, these CDEs deploy that capital into qualified projects that stimulate job creation, local business growth, and neighborhood revitalization.
Since its inception, NMTC has spurred over $120 billion in investments nationwide. The program supports developments ranging from retail and healthcare facilities to industrial, educational, and mixed-use projects that might not otherwise secure conventional financing.
It was previously renewed every few years, and the NMTC’s future was often uncertain, discouraging long-term planning. The new permanent status eliminates that policy risk and transforms it into a stable, strategic financing mechanism for projects.


At the heart of the NMTC ecosystem are CDFIs or CDEs, mission-driven financial institutions that specialize in serving low-income or underserved communities. These entities include community development banks, credit unions, loan funds, and venture capital funds certified by the U.S. Treasury.
Through the CDFI Fund, developers and investors qualify for federal support such as grants, technical assistance, and tax credits, enabling them to structure below-market financing. For investors, aligning with a CDFI means access to long-term capital that blends impact with profit potential. Unlike the past, when NMTC renewals required periodic congressional approval and created uncertainty, this permanence removes policy risk and opens the door for long-term planning.
The NMTC provides investors with a 39% federal tax credit on their qualified investment, claimed over seven years–5% annually for the first three years, and 6% for the next four.
In practice, this credit serves as “soft equity,” filling funding gaps, lowering sponsor equity requirements, and improving project viability in markets where rents or redevelopment economics might otherwise fall short. Overall, it generates meaningful tax savings for investors.

Feature New Markets Tax Credit (NMTC)

Purpose
Investor Benefit
Capital Flow
Primary Motivation
Ideal Project Types
Geographic Scope
Time Horizon
Stimulate community development through subsidized financing to projects in low-income communities that cannot attract traditional capital
39% federal tax credit over 7 years (offsets income tax)
Investments made through certified Community Development Entities (CDEs)
Impact-driven: Focus on community development, job creation, and local revitalization
Retail redevelopments, healthcare facilities, industrial/mixed-use, schools
Low-income census tracts (often overlapping with OZs)
7-year compliance period
Program Status Permanent
Opportunity Zones (OZ)
Encourage long-term private investment through capital gains tax incentives
Deferral of existing capital gains; potential elimination after 10-year hold
Direct equity investments through Qualified Opportunity Funds (QOFs)
Profit-driven: Focus on capital appreciation and long-term gain exclusion
Multifamily, commercial, and mixed-use developments with strong appreciation potential
Federally designed Opportunity Zones
10-year investment hold for full tax exclusion
Authorized through 2028
Layering NMTC and OZ capital creates a hybrid structure that delivers both social and financial returns. NMTC funding lowers equity needs and boosts project feasibility, while OZ equity enhances long-term investor upside. Together, they enable projects that might not otherwise “pencil” while amplifying community impact.

Consider a small business expanding into a low-income opportunity zone. By combining NMTC financing with Opportunity Zone (OZ) incentives, the owner can craft a highly efficient capital stack:
1 2
CDFI/NMTC
A $1 million NMTC investment generates $390,000 in federal tax credits.
An outside investor contributes equity using deferred capital gains, potentially eliminating those taxes entirely after a 10-year hold.
3
The remainder is covered by bank debt and a modest owner contribution.
The result? A fully financed redevelopment that supports job creation, community growth, and strong investor returns–all while revitalizing an underserved corridor.


• The project must be located in a federally designated low-income census tract
• Ideal for projects generating jobs, services, or essential infrastructure
Submit applications to CDEs /CDFIs with allocation authority. Evaluation focuses on community impact, feasibility, and sponsor experience.
Combine NMTC equity with:
• Senior debt
• Sponsor equity
• CFI/NMTC funding
• State or local incentives
NMTC investors (often large banks or insurers) purchase the credits for equity, and the CDE manages compliance throughout the seven-year credit period.
Pro Tip
Start conversations early. CDEs allocate on a mission-alignment basis, and once annual allocations are spoken for, opportunities vanish quickly.
The permanent extension of the NMTC reshapes the investment landscape for community redevelopment. When paired with Opportunity Zone incentives, it creates an exceptionally powerful, tax-efficient capital stack that aligns financial return with measurable social impact.
For CRE investors and developers, this is a rare alignment of profitability and purpose, an opportunity hiding in plain sight.

Lleyton Buscher
lleyton.buscher@matthews.com (919) 750-3309
Jake Lurie
jake.lurie@matthews.com (813) 488-0853


By Geoffrey Arrobio

Let’s start at the top with a quote from the U.S. Department of Energy Secretary Chris Wright:


As the saying goes, “follow the money.” The data center sector, including its entire infrastructure, is said to be on track for approximately $7 trillion of capital investment by 2030, as reported by McKinsey & Company Global Management, with an estimated $500 billion for 2026 alone.
Most, if not all, of “big tech” is invested or investing in this space (Apple, Microsoft, Oracle, Alphabet, Meta, and the list goes on). It’s a tremendous amount of capital, and this administration is doing everything in its power to “win the race” over China, India, and others to secure its buildout and end-product.
The question becomes which states and submarkets will benefit from these buildouts? The answers may be surprising.
Virginia, Texas, and Georgia are currently in the lead. However, the Pacific Northwest, Arizona, Nevada, and even Kansas City, MO, are hot on the heels of the initial three states.
Kansas City, MO, is in the planning stages of a $100 billion project near the Kansas City Airport. Even Google is getting into the game in eastern Iowa by
petitioning to reopen and recommission the Duane Arnold nuclear reactor, located in Fayette Township, Linn County, and using the surrounding area for an AI data center.
The reasons as to “why” these states are being chosen can be explained rather simply: cheap land, affordable electricity, and in place pro-growth development policies which can streamline the buildout process (unlike the California permitting process, for example). The electrical components of these centers are extremely important, as is the location. Not only do these centers use massive amounts of power, but they also require constant cooling, which in turn drains significant amounts of power, taking grid power away from the surrounding area. There are different ways to solve the electrical issue.
With the estimated $7 trillion of investment capital over the next five years, investors should follow these buildouts for opportunities in retail, hospitality, industrial, medical office, and multifamily sectors. These centers are run by people (and Nvidia CPUs) and will need support services and housing availability within the surrounding campuses for the foreseeable future. Note that both AMD and Qualcomm are also targeting this space.

Data Center Demand Capacity by County

(Source: visualcapitalist: Mapped: The Massive Network Powering U.S. Data Centers
Unfortunately, not everyone will be a winner in this game. Many critics argue that the evolution of AI will lead to massive job losses, degrade human critical thinking, and result in a monopolistic enterprise. However, as witnessed with the Dot.com bubble in 2000, similar issues will occur in this sector—not everyone can be a winner.
Dramatic strides in the digitization of everything going forward are on the horizon. The journey won’t be smooth, but the long-term net future positive outweighs the short- to medium-term negatives, including the “misallocation of capital” for some companies. With new plans announced every week for a new datacenter somewhere in the U.S., it’s prudent for investors to focus on where the momentum is heading.
For example, “Data center developer Crusoe has struck a deal with US Blue Energy to secure power of up to 1.5 GW for a nuclear-powered AI Campus located at Port of Victoria, Texas, expecting its first delivery of nuclear power electricity by 2031.”
The biggest driver of not only data centers/AI, but also economic well-being, is access to affordable energy. Data centers require non-intermittent power, as the flow of electricity must be static 24/7, to ensure accurate data processing. Wind and solar cannot offer 24/7 baseload power, forcing companies and municipalities to supplement their energy sources with nuclear power and natural gas turbine providers to provide continuous, 24/7 power.
As Goldman Sachs stated, we are now in the “Terawatt Era”. To put nuclear energy density into context, nuclear fission is a very high-density power source. 1 uranium fuel pellet, the size of a fingernail, creates as much fission energy as 17,000 cubic feet of natural gas, 120 gallons of oil, and 1 ton of coal. In addition, nuclear reactors (big or small) have a significantly smaller land footprint compared to wind and solar energy sources and can last for up to 100 years. As nuclear and natural gas expand to support data centers, surrounding areas may see renewed investment in industrial and infrastructure assets.

The U.S. and most of the industrialized nations (aside from Germany) are all on the precipice of major nuclear energy buildouts. Not just for data center demand, but also to meet current demand (pre data center development).

China alone is building 10 to 12 major nuclear plants per year, while the U.S. has only built two major nuclear reactors over the past 30 years (Vogtle 3 & 4, located in Georgia in 2023, with AP 1000 units - Westinghouse/Cameco). The U.S. is trailing China for carbon-free, clean baseload nuclear energy; however, as of October 28, 2025, that has changed. The United States Government, Cameco, and Brookfield Asset Management have announced at least $80 billion investment for the building of new large reactors across the U.S. (AP1000 units). These new buildouts will help create new high-paying jobs and energy security. Small Modular Reactors (SMRs) will also be added to the energy mix, providing “bolt-on” clean electric power and heat for hospitals, manufacturing plants, and in some instances replacing coal-fired plants. This technology is in its infancy; however, Terra Power (Bill Gates), NuScale, BWXT, X-Energy, Rolls-Royce, and others are nearing the testing of their SMR prototypes for mass manufacturing within the next three to five years.
Many other primary and secondary industrial countries, including Saudi Arabia, Poland, Sweden, the United Kingdom, and India, have plans or are expanding their nuclear power portfolios. As noted above, the German Green Party has dismantled Germany’s industrial base over the past five years by closing its fully functional nuclear power plants to focus on wind and solar energy. That mistake has led to the drastic decrease in industrial production within


Upstream covers finding, developing, and mining uranium deposits. These companies secure land, run the mines, and provide the raw materials.
Mining & Development Exploration


The U.S. government sees the best return in upstream companies, since mining is the least lucrative stage of the supply chain.
Midstream companies convert and enrich uranium, turning raw ore into reactor-ready fuels like UF₆ and HALEU.
Midstream has three segments, but the most actively traded stocks are in enrichment and isotopes.
Enrichment/ HALEU

Isotope Separation


Royalty and trust companies offer leveraged exposure to uranium prices, earning passive income from production or stored material without owning or running mines.

(Source: TannersTrades)


Downstream companies build and run nuclear plants, turning enriched uranium into steady baseload power.
SMRs/ Next Gen Equipment/ Components


Utilities/ Power Gen

Utilities use enriched uranium in their nuclear portfolios, with some relying on it more than others. Duke uses some of GLE’s laser-enriched uranium.
Next Gen tech refers to Silex and GLE, which enriches uranium using laser technology. Next Gen Tech Support

Germany and the European Union. There is ongoing discussion of reversing these “green policies” and turning the fully functional units back on, as the German economy is the largest GDP producer within the EU. It remains to be seen whether policies in Germany will shift toward re-endorsing nuclear power generation and lowering the cost of electricity for their industrial base.
The takeaway is that all forms of affordable and reliable energy are needed to help manufacturing bases remain competitive (keeping costs low) and to support daily life. Real estate investors will have the opportunity to strategically invest within these demand-driven areas of new buildouts. Data centers and reactors (both large and small) will employ hundreds, if not thousands, of people.


The support category includes spent-fuel storage, engineering, construction, components, and turbine and grid systems.
And if the U.S. can lower the cost of BTUs for everyone, we can maintain a competitive edge globally.
Above is a visual of the nuclear ecosystem. While not shown in its entirety, it provides a visual explanation of how this space works, from fuel exploration and enrichment to fabrication, and ultimately to the end users. As seen below, the cycle is more complex than oil and gas energy producers yet follow a similar path. It’s important to understand that about 90% of the current nuclear fleet in the U.S. receives its fabricated nuclear fuel from Russia, as we have outsourced everything over the past 30 years. Now that the government has banned imports from Russia, Energy Secretary Wright, with the help of the NEC, is pushing forward the regulatory framework to “onshore” the entire fuel cycle.


In the 1960s and 1970s, the U.S. was the largest nuclear fuel fabricator worldwide; that expertise was relinquished years ago (as hydrocarbons were cheaper to extract) and is now being rebuilt in response to rising energy demand. That in itself is a very challenging mission. Yet, it is taking place throughout the U.S. States like Texas, Utah, Idaho, and Wyoming are now at the forefront of these efforts, not only for uranium discovery and extraction, but also for fabrication and enrichment. These ecosystems need support systems, and therein lies future commercial real estate opportunities.
To address the concern about “nuclear waste,” or “tails” as it is known in the industry (spent fuel).
1. SMRs are very efficient and can run at decreased power levels at the same time, meaning the spent fuel or tails are negligible.
2. Larger reactors like the AP 1000 consume millions of pounds of uranium via fabricated fuel, and there also remains a very large stockpile of spent fuel/tails within the U.S. However, with Quantum Laser Technology (QLE) or ASPI Isotopes and Silex, these stored waste stockpiles can be re-enriched into working fuel stockpiles, drastically decreasing the storage capacity for waste.
One material poised to disrupt the marketplace over the next 5 to 10 years, and will actually improve everything it encounters, including commercial real estate, is pure SP2 bonded 100% crystalline graphene.
Graphene has been known for some time; however, until recently, graphene has been made from graphite, which does not provide the properties that true SP2-bonded graphene provides. Pure graphene, and in this case made by Hydrograph Clean Power, is 99.8% pure crystalline graphene.
What does that mean and why is this important?
Well, this crystalline pure graphene material (not derived via graphite), but from a proprietary
combustion process using acetylene, will be transformative for a host of industries. This material can improve material tension strength when applied or mixed by a function of “X”. In addition, this material is electrically conductive due to its pristine lattice composition and thin layering.
Staying within the commercial real estate sector, what advantages can this material improve? When added to cement, this material can increase compressive strength by 10% to 40% and its tensile strength by 50%. The cement material is reported to have 4X reduction in water permeability. This enhanced durability will dramatically extend the lifespan of infrastructures, thereby providing longterm cost reductions associated with maintenance, repair, and replacement.
By adding graphene to wood materials, it will drastically increase its tension strength and fire life safety characteristics. These material enhancements, once adopted, should drastically lower insurance premium costs, as these materials can withstand a much higher degree of wear and tear, including heat, pest invasion, water damage (such as mold) and in some cases, natural disasters. Other ways this material can be applied include solar panels, roofing materials, flooring, asphalt, and battery nodes, which can increase longevity and conductivity.
Not only will graphene be used in most building materials (paints, solvents, rubber, plastics, wood, cement, etc.,) it will also greatly enhance battery storage, medical monitoring, food storage (containers), nuclear power plants, automobiles, clothing, and almost everything we touch. Imagine if you didn’t have to replace your oil every 5,000 miles or tires every 40,000?
• When added to plastics, this material will enhance the service life of plastic by 8x (think industrial users).
• When added to lubricants, there is an 80% decrease in mechanical wear and reduced friction. Pure graphene can be added to computer chips, drastically lowering heat transference and increasing CPU speeds, think quantum computing.

When added to electrodes, battery life increases by 47%, increasing efficiency, performance, and storage. The application spectrum for this material is endless, let alone what the U.S. Department of War can use it for:
• Aircraft surfaces and structure
• Submarines
• Body armor
• Radar
• Electronics
• Missile systems


ELECTRON MOBILITY
As high as 200,000 cm²/V·s, much higher than silicon.

THINNESS
A single layer of graphene is just 0.345 nm.

TRANSPARENT
Single-layer graphene transmits approximately 97.2% of light.


UV RESISTANCE
Blocks harmful UV rays by up to 70%.

HIGH SURFACE AREA
As much as 2,630 m²/g – very high surface area.

ELECTRICAL RESISTANCE
Graphene electrical resistivity of just 0.2 × 10 - ⁶ Ω·cm.
STIFFNESS
Young’s modulus 0.95 to 1.1 TPa, some of the highest ever measured.

THERMAL CONDUCTIVITY
Highest ever measured at ~4000 W/m·K.

FLEXIBILITY
Graphene can stretch up to 25% of its original length.

IMPERMEABILITY
Blocks all other elements, even hydrogen.

STRENGTH
Graphene has a strength of 130 GPa, higher than steel.
There are many exciting advances taking place that are merging technology, materials, energy, and commercial real estate to advance efficiency, prosperity, safety, and competitiveness. The next five years will be an exciting period of time as these sectors all merge to play a bigger part within the U.S. economic landscape. As always, do your own due diligence and keep informed as much as possible as these trends and themes unfold. There are many exciting opportunities out there for those who like to dig in and be in the know.


Coffee shops have emerged as a “third place,” neither home nor work, where customers have the option to grab a drink, or use the location to relax, work, and enjoy their free time.
Recent National Coffee Association data shows that in 2025, 66% of American adults drink coffee daily, and consume an average of three cups per day. Specialty coffee consumption has reached a 14-year high, with 46% of American adults having specialty coffee in the past day, surpassing traditional coffee consumption.
As demand for premium coffee experiences intensified, national and regional operators are finding room to thrive, even in saturated markets already dominated by major chains, like California. Coffee tenants continue to expand rapidly across the state, with Southern California noting increased developments from coffee retailers. These tenants are actively seeking spaces that range from 1,000 to 4,000 square feet, attracting national brands and local operators.
For shopping center landlords, securing a quality coffee tenant can increase traffic and enhance the value of their center. Demographics and location are top priorities for coffee tenants with signalized intersections, strong car counts, and pedestrian inflows being factors that improve a coffee shop’s success. Outparcels or pads remain highly desirable, offering convenience and visibility. Drive-thru locations, end caps, and even select inline spaces are increasingly in demand as operators look to capture center traffic and attract more consumers.
While shopping pads and drive-thru locations are favorable, mixed-use spaces also prove beneficial for coffee shops. The ground-floor component creates vibrant street-level activity, and the mix with office and/or multifamily guarantees demand. For coffee shop operators, securing space within a mixed-
use property allows for access to residents, office workers, and everyday consumers, guaranteeing built-in customers and traffic upon opening.
Footprint sizes for coffee shops across the region vary widely depending on format. Small kiosk/drive-thru concepts note locations under 1,000 square feet, while freestanding locations can reach up to 4,000 square feet.
Starbucks, in particular, leads national coffee tenants with the most locations in California. The coffee giant has a strong focus on Southern California, with 155 locations in Los Angeles, 131 stores in San Diego, and over 100 across Orange County. In order to maintain its positive performance in the region, Starbucks has begun new initiatives across its stores, including renovating locations to align with the Back to Starbucks plan. CEO Brian Niccol launched the initiative in September 2024 to bring more customers back to stores across the country. New features of the plan include lounge seating, warmer lighting, and reintroducing ceramic mugs for in-store orders. The goal of this plan is to create a community feel within their locations. A new site with these features has already opened in Los Angeles at the intersection of Sunset and Palisades Village.
Source: Placer.AI, January 2019-October 2025
Dutch Bros has become one of the fastestgrowing national coffee chains across Southern California. The tenant first began operations in 2022 when it opened a location in San Diego County. Since then, it has spread to cities like Barstow, Apple Valley, Victorville, Baldwin Park, and Palmdale. Dutch Bros is planning its move in the Los Angeles metro, with a store under construction near the University of Southern California campus. The location will be similar to its other stores featuring a walk-up window, and it is expected for completion by year-end 2025. Other new sites for Dutch Bros across Southern California include Carson and Temecula, with both shops already approved for construction.
Source: Placer.AI


Regional coffee shops attract consumers seeking high-quality products, with goods like specialty beverages or artisan-roasted beans. Younger consumers, like Gen Z, often drive visits as they are willing to pay more for premium, trending goods. These locations offer a unique setting that reflects the local population, attracting consumers that seek an authentic and community-focused experience. While national operators offer a convenient visit, regional operators create competition by prioritizing quality, community, and exclusive experiences.
California is home to the greatest number of coffee shops across the country, with local tenants playing a significant role in the state’s coffee performance. Regional coffee tenants most often lease 800- to 1,500-square-foot spaces with in-line or end-cap formats, as seen with regional operator Better Buzz. The coffee chain, which started as a coffee cart in San Diego, has become a staple in Southern California. Most of its locations are found in San Diego and Orange County, reaching as north as Fullerton. Upon its success in Southern California, the company has also expanded to Nevada and Arizona, with its first out-of-state store located in Phoenix. Better Buzz has around 40 locations across the three states, and it plans to double its size in the next few years.
Regional tenants that feature Vietnamese coffee are also aiding coffee shop activity. The nation’s coffee began to grow internationally in the 1990s when it became one of the world’s largest coffee producers. Since then, it has maintained its popularity for creating a unique coffee culture for consumers in the Southern California market. Trung Nguyen Legend Café, originally from Vietnam, began U.S. operations in 2023 with its Westminster location. The company is still growing across Southern California, with Matthews™ recently securing a 2,700-square-foot space for them in Huntington Beach. The coffee shop sought this location because of the end cap, visibility, patio and large seating area, as well as the community impact.

Source: ScrapeHero


Blk Dot Coffee has also expanded the presence of Vietnamese coffee in Southern California. The company is a family-run business with a focus on providing traditional Vietnamese coffee, as well as some food items. Its first location opened at the Orange County Google offices in 2015, and has had a strong presence across the county ever since. Locations range from areas like Irvine, Newport Coast, Fountain Valley, and Long Beach, with many of its stores placed in shopping centers to take advantage of high foot traffic levels.
Tierra Mia Coffee opened its first location in 2008, and has since expanded its reach to both Los Angeles and Orange counties. Known for roasting its coffee and baking their pastries in store, as well as serving Latin specialty drinks and unique latte art, the company has now grown to 20 stores.
The national coffee market is projected for continued growth as consumers seek coffee shops for a third place experience. The U.S. coffee market size was estimated at $47.8 billion in 2024, and is forecast to grow at a CAGR of 9.5% to 2030. By providing free Wi-Fi, coffee shops continue to attract work-from-home employees, as well as create an environment for other consumers to relax and socialize.
Further growth across the sector will be aided by consumers seeking more unique flavors and highquality products. This movement is advantageous for local operators as they can adjust menus to provide enticing options not found at national brands. To stay competitive, national tenants are prioritizing loyalty programs and drivethru convenience, while local tenants leverage community connection and handcrafted goods to maintain performance levels.

Matthews™ Capital Markets (MCM) is a fully integrated and dedicated financing division of Matthews™, providing capital solutions ranging from $500,000 to $100 million for all property types across the U.S. Through long-standing lender relationships, we have the ability to customize and structure financing solutions that best suit our clients’ needs.
From Funding to Close, Matthews™ Provides a One-Stop Shop


Higher interest rates. Rent caps that limit increases. Rising insurance premiums. These forces aren’t just background noise in today’s multifamily market—they suggest that markets are once again factoring risk back into pricing. Valuations now hinge on the volatility of a property’s underlying cost structure and its flexibility to grow revenue. Before COVID, pricing followed a predictable hierarchy, as cheap financing and aggressive rent growth pushed values higher. In turn, cap rate spreads compressed, reducing price dispersion across quality tiers.

Today, that pricing logic has eroded into a renewed focus on risk-based pricing and wider dispersion amongst asset classes and location fundamentals. Cap rates have held firm amid higher expenses, regulatory limits, and more disciplined rent-growth assumptions. CoStar Group Inc.’s forecast projects modest movement with cap rates stabilizing at 6% through 2026, signaling that the valuation reset is being priced into fundamentals rather than a quick return to cheap debt. Cap rates remain tiered by asset quality, with Class A and B assets clustering in the low-to-mid 5% range while Class C properties often price around 6%.


The recalibration of valuations between 2023 and 2026 centralizes on the disruption of NOI. Insurance instability, above-yield borrowing costs, and stringent rent control each distinctly strain income performance, widening the bandwidth of operating outcomes investors must price, and pushing cap rate dispersion across asset quality and markets.
Insurance costs have become a defining variable. Premiums rose about 28% year-over-year as of early 2024, according to Yardi Matrix’s national multifamily expense data, which showed a cumulative increase of 129% since 2018. Premiums remain structurally elevated relative to pre-pandemic levels, with projections tapering to 3-6% through 2026.
As multifamily insurance premiums increasingly outpaced total operating expenses, average insurance costs climbed from about $278 to $636 per unit, materially eroding NOI.
In many portfolios, Yardi Matrix’s data shows these insurance-driven increases have pushed operating expenses up roughly 30-40% above pre-pandemic levels, tightening NOI margins and expanding the “pricing band” investors require, especially for older Class C assets in disaster-exposed markets where volatility is highest.
Wider borrowing spreads have translated into more conservative pricing, often requiring greater yield cushion and/or price adjustment, and cap rates have been slow to compress as investors prioritize cash-flow certainty over rate-cut expectations.
Even with continued rate cuts expected by late 2026, pricing remains anchored to property-level risk and NOI sustainability under higher borrowing costs. As a result, negative-leverage deals should continue to fade throughout 2026, with investors demanding durable yield.

Myth: Value-add pricing will normalize once rates fall.
Reality: The value-add spread is being driven less by rates and more by execution uncertainty, including higher all-in improvement costs and less reliable rentpremium capture.
Historical and Forecast Average U.S. Multifamily Cap Rates
Pricing Impact: Investors are assigning a larger risk premium to transitional business plans, keeping value-add yields wider and basis expectations tighter.
Between 2021 and 2026, the national average cap rate is projected to move from a low of 4.90% to a stabilized 6.00%. This shift in fundamentals is driven by a transition to more conservative underwriting, with the $237,000 average price per unit in 2026 reflecting a 1.10% annual rent growth assumption, compared with the more aggressive 9.00% growth seen at the 2021 market peak.
Rent regulation introduces a structural mismatch between rising operating costs and capped revenue growth. Hard rent ceilings prevent owners from adjusting income to keep pace with inflation, tax increases, or insurance expenses, creating a predictable drag on scalable cash flow. Concurrently, rent-controlled properties typically trade at liquidity and pricing discounts, reflecting the regulatory risk embedded in their operating profiles.
Even modest rent resets allow owners to absorb cost pressures better, giving these properties a measurable pricing premium in today’s environment. The divide between regulated and unregulated income streams has become one of the most persistent valuation gaps between 2023 and 2026.
Revenue flexibility has become a central factor in valuation. Market-rate assets can adjust rents to absorb higher taxes, insurance, and operating costs, preserving NOI stability and attracting tighter yields.
Rent-controlled properties, by contrast, face capped income growth while expenses continue to climb, creating a structural drag on long-term performance. Trepp Research shows that multifamily property values declined roughly 30% in New York City following HSTPA and that rent-controlled assets in Los Angeles and the San Francisco Bay Area trade at discounts to unrestricted peers, with Bay Area tenants staying up to 20% longer—slowing rent resets and revenue growth. Investors price these constraints with wider yields, lower liquidity, and deeper discounts.
In 2026, investors continue to price this constraint through wider yields, lower liquidity, and deeper discounts.
Rent-Regulated vs. Market-Rate
Source: CoStar Group, Inc. | Q4‘ 25
Cap Rate: 6.4%
Sale Price / Unit: $171,927
Positioning: Trades at wider yields and discounted pricing due to regulated rent growth
Cap Rate: 6.1%
Sale Price / Unit: $233,197
Positioning: Higher pricing supported by rent-reset flexibility and deeper liquidity
Rent-regulated multifamily trades at a 30 bps higher cap rate, which translates into 26% lower pricing per unit. The higher required yield compensates for restricted rent growth and limited rent reset flexibility, which constrain NOI upside and make it harder to absorb rising operating costs.

Rent-regulated multifamily continues to trade at a meaningful valuation discount relative to market-rate assets nationally.


Uniform pricing spreads have come and gone, and the market has returned to a tiered pricing structure. Investors are particularly meticulous, assigning substantial differences between asset quality, revenue flexibility, and geographic resilience.
Pricing differences between Class A and Class C assets are contingent on the stability of the property type. Class A properties tend to show more predictable NOI, lower operating expense volatility, and modern building systems that reduce unexpected capital needs. That stability supports tighter pricing and more consistent liquidity.
At the opposite end of the spectrum, Class C assets are often characterized by aging infrastructure, longer repair cycles, elevated insurance exposure, and higher turnover rates, all of which introduce greater execution risk and greater performance variability. Investors now incorporate a broader risk premium in pricing.
In 2026, investors continue to price this constraint through wider yields, lower liquidity, and deeper discounts.
Myth: Class A and Class C spreads will tighten back to pandemic levels.
Reality: Risk differentiation was temporarily muted between 2022 and 2024, when debt was cheap and aggressive growth assumptions compressed spreads across quality tiers. As that anomaly fades and the hierarchy of asset classes returns, RCA reports that the spread between Class A and Class C now ranges from 150 to 200 basis points, restoring a risk hierarchy more in line with historical norms.

Pricing Impact: Spreads are likely to remain wider as long as operating costs and revenue outcomes remain volatile, particularly in Class C, where aging systems, insurance sensitivity, turnover, and capital expenditures introduce greater variability.
Myth: Stabilized assets are insulated from volatility.
Reality: Even Class A properties can see NOI pressure when rent growth stalls and operating costs move higher, limiting nearterm upside versus value-add execution.
Pricing Impact: Investors increasingly underwrite wider going-in yield cushions for stabilized deals when expense uncertainty rises, widening dispersion versus assets with clearer NOI growth pathways.

The widening gap between asking and effective rents, particularly as quality declines, underscores how concessions and price sensitivity are shaping real revenue outcomes, with weaker absorption in Class C reinforcing downside risk in lower-quality stock.
Geographic fundamentals have also reasserted themselves in pricing. Suburban assets generally benefit from stronger household formation, steadier occupancy, and reduced concession pressure, supporting more defensible income profiles and steadier valuations.
Urban assets face different dynamics, including slower rent growth, higher concession packages, elevated turnover, and increased competition from new supply in many core metros. These headwinds support wider yields and more conservative underwriting.
The suburban-urban spread reflects investors’ focus on relative risk and transaction depth. CoStar data shows suburban cap rates modestly above urban levels, indicating investors may still require additional yield for suburban assets even when operating performance is more stable.


This Gulf Coast growth market illustrates how quickly multifamily pricing can separate when operating costs rise and supply accelerates, making it one of the most telling barometers for today’s valuation environment.
• Premiums up 30-70% since 2022
Source: FannieMae
• Older assets are seeing 15-20% Operating Expenses (vs. 8% national avg)
Source: FannieMae
• Class C assets absorb the steepest surcharges due to aging systems and elevated claims history
Rent Fundamentals
• Effective rents flat to negative in several submarkets
• Renewal spreads compressing
• Rising vacancy in new deliveries
Wide dispersion in NOI trajectories
Wider pricing cushions required
• ~45,000 units projected to deliver from 2024-2026
Source: CoStar Group, Inc.
• Urban cores face the most extended lease-up timelines
• Concessions up 8–12% YoY across Class A in 2024-2025
Source: FannieMae
• Class A-Class C differential: 175-225 bps
• Suburban assets trade 50-100 bps tighter than urban
• Class C discounts deepest due to OpEx + CapEx exposure
Suburban stability priced at a premium
Even with near-term pressure from supply and insurance-driven operating expenses, Houston’s long-term growth outlook remains intact. Population and job gains continue to expand the renter base, supporting demand as the current delivery wave works through lease-up.

• Suburban assets win because occupancy and concessions fluctuate less, not because they’re “hot”
• Urban assets face wider valuation ranges due to supply, turnover, and concession cycles
• Class A: stability benchmark
• Class B: execute and churn risk premium
• Class C: greater OpEx variability, CapEx burden, and turnover risk result in the widest cap rate levels
• Cap rate compression will be slow and uneven, as pricing is driven by operational risk, rather than macro relief
• The Class A/C spread remains structurally wide as aging stock absorbs higher insurance, CapEx, and turnover risk
Multifamily pricing has shifted toward what can actually be defended at the property level. In an environment defined by cost pressure and uneven demand, valuations reward assets that keep income steady and expenses predictable, and penalize those with wider operating variance. Reading the market now requires focusing less on broad narratives and more on the mechanics that determine whether NOI holds or erodes.
Looking ahead, the reset is likely to remain selective and spread-driven. Properties with flexible revenue, resilient systems, and stable tenant behavior will continue to command a clear pricing premium, while assets with heavier operating drift should face persistent valuation pressure and wider yields. Success in this cycle comes from aligning strategy with what is durable, measurable, and repeatable as the market continues to reprice risk.
Daniel Withers
daniel.withers@matthews.com (818) 923-6107
Luke Matthews
luke.matthews@matthews.com (281) 809-4006
Nathan Shields
nathan.shields@matthews.com (346) 326-8993


After two years of rate-driven paralysis, the freeze is over, and the next wave for the healthcare real estate market has begun. The sector established a clear market floor in the second half of 2025, with cap rates leveling around 7%. The bid-ask gap between buyers and sellers is narrowing as stakeholders realign on pricing, triggering a significant rebound in transactional activity across the sector.
Healthcare real estate is anchored by strong fundamentals that help it withstand broader market slowdowns, with occupancy nearing 93% across the top 100 metros and performance driven by the predictability of
Healthcare real estate operates on a distinct rhythm from the broader market, driven not by volatility but by the steady, real-time demand for patient care and accessible treatment. By 2030, one in five Americans will be over the age of 65, embedding long-term, non-cyclical demand directly into the medical real estate sector, according to the U.S. Census Bureau.
An aging population isn’t a trend.
It’s a demographic certainty driving the need for expanded clinics, specialists, & ongoing care.
The shift toward distributed care is redefining where medicine happens, as healthcare undergoes a broad rebrand away from hospitalcentric delivery and toward models that prioritize convenience, flexibility, and care closer to home. Outpatient clinics, surgery centers, and specialty practices now handle procedures once limited to hospitals at operating costs 30-60% lower, making them the preferred setting for both patients and providers, according to a JAMA Network study. It’s a system built around people in their everyday life, powered by adaptable clinics rooted in the communities they serve.
physician and healthcare group tenancy, according to PwC’s Medical Office Real Estate Outlook. That durability is supported by long lease terms, steady patient volumes, and limited new supply as high construction costs sideline many developers, while Future Market Insights projects the U.S. outpatient clinics market is projected to grow from about 44.3 billion in 2025 to roughly 67.4 billion by 2035, setting the stage for the next leg of the medical real estate cycle.
2026 is the turning point; but timing will determine who leads the cycle & who chases it.
Amid accelerating demand for outpatient and specialty clinics, the market is now running into a shortage of high-quality medical space. With construction costs still elevated, most developers remain sidelined, creating tight supply conditions just as tenant demand accelerates. That scarcity gives existing property owners real pricing power. Strategic partnerships are expected to account for only 10-15 healthcare projects breaking ground in 2026, including new behavioral health facilities in smaller markets, rural cancer treatment centers, university-affiliated hospitals, community health hubs paired with recreation amenities, and specialized units such as regional burn centers.
Capital that spent the last two years on the sidelines is beginning to move again, with underwriting steadying and debt costs no longer swinging week-to-week. Investors are stepping back in with clearer expectations, and their return signals renewed confidence as pricing stabilizes and debt becomes predictable. This tightening supply, paired with the sector’s resilient fundamentals, is drawing fresh interest from REITs and institutional buyers, elevating outpatient medical office buildings and intensifying competition for high-quality clinical assets as early-cycle capital begins to reemerge.
Source: CoStar Group, Inc.
Moderate absorption & limited deliveries keep vacancy nearly flat through 2028, signaling demand pressure & an undersupplied market.
Modern care delivery is generating clear momentum in certain specialties, while others are stabilizing through consolidation or adapting to reimbursement pressures. Outpatient-oriented, cash-flow-stable, and platform-backed specialties will take the lead as the next cycle unfolds.
Growth Leaders
Strongest Demand, Tightest Cap Rates
• ASCs: More procedures migrating from hospitals
• Imaging: Diagnostics rising across all specialties
• Urgent Care: Convenience-based, steady
• Dialysis: Essential-care, zero elasticity
Why it matters: Early compression drivers will anchor the first wave of institutional capital.
Scarcity-Driven Upside
• Behavioral Health: Payer-mix attention required, but demand surging
• Dental/Oral Surgery: DSO consolidation strengthening credit
Why it matters: Limited supply & resilient demand push rents higher and widen spreads.
Credit Bifurcation
• Aesthetics/Med Spas: Cash-pay, high margin, platform roll-ups
• Dermatology/Plastic Surgery: Demand steady, credit tied to scale vs. boutique operations
Why it matters: Pricing hinges on operator scale & backing as platform-backed groups trade tighter.
Shifting Credit Profiles
• Urology, Ophthalmology, Dermatology: MSO roll-ups reshaping credit consistency
• Oncology & OB/GYN: Reimbursement pressure pushing system-backed lease tenancy
Why it matters: These segments won’t set pricing, they will redefine credit strength & underwriting.

Essential-care specialties trade in tight bands, reflecting strong credit, high renewal probability, & limited relocation risk. ASCs, imaging, & dialysis anchor lower yields, while urgent care & behavioral health cap rates are slightly wider but remain firmly within core medical ranges.
Elective specialties rely on discretionary spending, which creates wider pricing spreads and more volatility. Those backed by scale or private equity/MSO platforms perform far better, while standalone boutiques see higher cap rates that reflect their revenue swings.
Source: BGL & CO 2025 Healthcare Real Estate Mid-Year Market Update
As institutional owners control over $537 billion in assets, according to RevistaMed’s 2025 report, the next market cycle presents a unique opportunity for private practitioners and physician-owned groups to leverage ownership and exert a new degree of influence over the sector’s evolution.
Ownership transforms the practice location into an economic engine, supporting growth today and enhancing valuation tomorrow.
Owning the facility gives physicians the flexibility to expand services, add providers, and modernize layouts, while predictable occupancy costs provide stability to reinvest in operations and support longterm growth. As physicians near succession or retirement, a well-structured lease to the real estate entity becomes key to preserving value; renewing or adjusting that lease 12-18 months ahead of a sale— and securing successor providers or MSO support— helps solidify income and boost buyer confidence.
Elective & consumer-driven specialties trade at wide cap rate ranges, reflecting greater revenue variability, higher discretionary exposure, & a broader spread in operator credit quality.
Liquidity tools like sale-leasebacks and 1031 exchanges let physicians unlock equity without disrupting care. In a sale-leaseback, the physician sells the building and stays under a new long-term lease, which buyers underwrite closely. Before pursuing a transaction, physician-owners should ensure lease terms meet market standards and align the deal with their long-term practice goals.
Owners, developers, & investors should evaluate their assets before cap rate compression & institutional competition reduce margins.
Essential Market Signals & Strategies to Track over the Next 12-18 Months
Cap rates are stabilizing and will likely compress as institutional capital re-engages. As bid-ask spreads tighten, competitive pressure will rise quickly, making early positioning essential to secure strong pricing and yield.
Monitor shifts in credit quality as consolidation accelerates in specialty sectors. Aligning with platform-backed groups or health systems will reinforce stability and mitigate reimbursementdriven volatility.
New construction remains minimal, and the scarcity will continue to push rents upward while accelerating lease-up for high-quality outpatient assets. Any 2026-27 deliveries will benefit from this imbalance.
ASCs, imaging, urgent care, and dialysis will anchor low-cap-rate demand. Behavioral health and dental/oral surgery continue to show strong rental upside due to undersupply. Elective segments will vary widely depending on operator scale and platform credit.
Rising construction costs make execution a competitive edge. Developers and owners who deliver on time and tailor spaces to clinical workflows will earn better rents and retention.
Expect increased utilization of sale-leasebacks, 1031 exchanges, and joint-venture structures as physicians and private groups leverage real estate to support expansion, liquidity planning, and succession strategies in the new cycle.
Shock
Capital takes a step back; pricing discovery begins. Rebuild
Momentum returns, setting up for 2025-26 activity. Expansion
Early movers lock in yield before competition rises. Maturity
Market stabilizes; long-term income dominates.
Reset
Market finds footing; investors re-engage.
(949) 432-4513
Transition
Confidence returns; bid-ask gap narrows.
(310) 955-5834
Competition
Institutional surge compresses yields.
(949) 432 4517


By David Treadwell
The U.S. multifamily market finds itself at an inflection point. On a national level, the country remains structurally undersupplied relative to long-term housing demand. Many median income. Yet, at the same time, many major multifamily metros are grappling with elevated vacancy, slowing rent growth, and over building. This contradiction has raised demand or merely a temporary imbalance in


The core paradox shaping today’s market is the coexistence of a national housing shortage with localized oversupply in a handful of major metros. Between 2023 and 2025, high-growth markets experienced an unprecedented surge in multifamily deliveries. Developers responded to the postpandemic signals, rapid household formation, record-low vacancy, and double-digit rent growth, by launching the largest construction pipeline in decades. However, this supply was delivered in a highly concentrated manner.
Rather than evenly addressing the national housing shortfall, new construction clustered in select metros and largely targeted the Class A segment. While population growth and job creation in these markets remained healthy, they were not sufficient to absorb the volume of new units immediately upon delivery. The result has been a lag between supply delivery and demand absorption that has weighed on nearterm fundamentals.
Source: Matthews™ Research, RealPage

The current imbalance is most acute in a handful of large, high-supply Sunbelt markets where new deliveries have clearly outpaced near-term demand. Austin stands out as the most severe case, with falling occupancy, sharp rent resets, and elevated concessions reflecting a prolonged period of capital overshooting fundamentals. DFW and Atlanta follow in scale, where massive delivery volumes have overwhelmed absorption despite long-term population and employment growth, limiting pricing power and keeping vacancy elevated. Phoenix remains the classic supply-stress market, as
post-pandemic development materially exceeded household formation, forcing operators to prioritize occupancy over rent. Denver, while smaller, is increasingly constrained by flat employment growth, removing a key demand backstop and prolonging oversupply conditions. While these markets retain strong long-term growth narratives, the data clearly shows that near-term fundamentals remain under pressure, with normalization dependent on sustained absorption and a meaningful slowdown in new supply, despite positive employment gains.
Vacancy rates across many supply-heavy markets have risen by roughly 100 basis points or more over the past 12 to 18 months, with stabilized vacancy generally hovering in the mid-to-high 7% range. In 2026, vacancy is expected to tighten an additional 30 to 50 basis points, driven primarily by stabilized assets rather than newly delivered properties still in lease-up. Once concessions, bad debt and non-paying tenants are factored in, economic vacancy is often materially higher.
Class A properties, in particular, face extended lease-up timelines, and aggressive incentives are often more economical than allowing physical vacancy to spike. Concessions have become a defining feature of the current leasing environment. Across many Sunbelt markets, operators are offering six to eight weeks of free rent not only on new leases but increasingly on renewals as well.
What was once a tactical lease-up strategy has evolved into a widespread tool for occupancy preservation. Rising delinquency and missed payments also reflect nearterm affordability stress rather than a collapse in renter demand, underscoring the cyclical nature of the current environment and reflecting the late-cycle dynamics of oversupply.
National rent data reinforces this interpretation. According to CoStar Group, U.S. rents declined month-over-month in November 2025 at the steepest pace in more than 15 years (0.18%), extending a run of flatto-negative monthly growth. While headlines focus on the weakness, these metrics are consistent with a market digesting temporary supply, rather than entering a prolonged downturn. Rent growth is expected to fall in the 2% to 3% range by year-end 2026.
Concession Rate
Source: Matthews™ Research, RealPage
Source: CoStar Group, Inc. | November 2025


Elevated construction costs, limited availability of construction financing, and materially tighter underwriting standards since 2023 have caused new starts to fall dramatically. Additionally, permitting activity across most major metros points to an increasingly thin pipeline, with new deliveries set to decline meaningfully in 2026. Markets that overshot the most, such as Austin, Phoenix, Nashville, Dallas, and Denver, are likely to experience a longer absorption runway.
In contrast, much of the Midwest and parts of the Northeast, where new supply has been more measured, appear positioned to stabilize sooner. Importantly, any increase in construction activity sparked by improving capital market conditions will begin from a historically low baseline, limiting the risk of another supply surge before 2027 at the earliest.
Source: Matthews™ Research, RealPage
Source: Matthews™ Research, U.S. Census


As supply pressure eases, the timing of recovery will hinge on three key demand indicators that historically precede tightening fundamentals:
1.
Population growth, particularly among prime renting age cohorts.
2.
Job growth, with emphasis on professional and service-sector.
3. Net in-migration
Despite near-term softness, migration into many Southeast markets remains positive, reinforcing long-term demand durability even as rent growth pauses. Once equilibrium is reached, rent growth is expected to resume at a modest but sustainable pace, while concessions gradually burn off as occupancy normalizes.

2 min 9 sec

2 min 53 sec

Source: USITC
Show Previous Year Ranking)

While the outlook is constructive, several risks could push the absorption-equilibrium timeline further out. Prolonged weakness in consumer balance sheets, rising delinquency, or increased renter “doubling up” could slow household formation. Affordability pressures have pushed some renters to delay household formation, take on roommates, or temporarily move back in with family. Job losses or slower hiring in supply-heavy markets would also extend lease-up periods. That said, these risks remain cyclical rather than structural and are unlikely to derail the long-term demand backdrop.

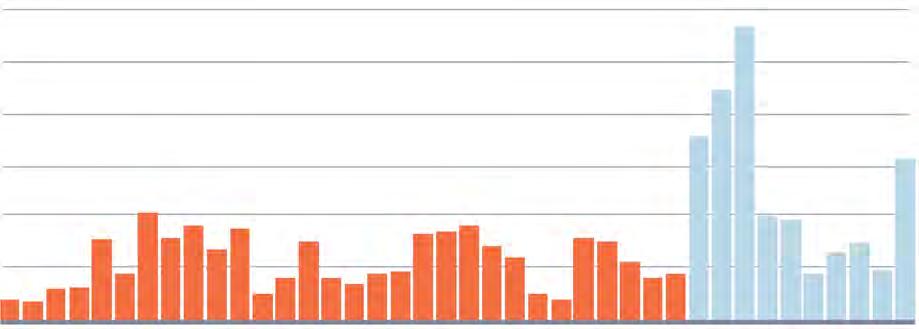

Source: Matthews™ Research, Real Capital Analytics, Federal Reserve
Capital markets conditions are quietly improving. Both short- and long-term interest rates are expected to drift lower through 2026, settling into a new equilibrium in the 4%-5% range rather than returning to the ultra-low rates of the prior decade. This shift should unlock pent-up transaction volume, narrow bid-ask spreads, and drive refinance activity for assets with 2025-2027 maturities.
Many owner decisions today remain maturitydriven. Borrowers without near-term loan expirations continue to defer transactions, contributing to suppressed sales volume. As financing costs ease and valuation expectations stabilize, this logjam is likely to break. Transaction activity is expected to increase meaningfully in 2026, supported by improving lender sentiment and expanded agency allocations.
Lower short-term rates will also reduce the cost of floating-rate construction loans, encouraging selective new starts. Importantly, any new development will deliver into a materially tighter market, rather than exacerbating oversupply.
For investors, the current window offers an opportunity to acquire assets ahead of meaningful fundamental improvements. As bidask spreads narrow, transaction velocity should increase, particularly for well-located assets with near-term upside.
Developers face a narrower but more rational window beginning in late 2026 and 2027. Projects initiated during this period are more likely to deliver into a balanced market with healthier rent growth.
Operators stand to benefit from stabilizing occupancy, declining concessions, and the ability to push rents modestly. A more predictable expense environment and improved access to capital should support NOI growth and balance sheet repair.
Bottom Line: The multifamily market is recalibrating. As supply pressure fades and capital markets heal, 2026 is shaping up to a critical inflection point that resets the sector for its next cycle of sustainable growth.


2026 2026


By
the Numbers 2025 YTD | Source: Matthews™ Research
$8.3B Sales Volume
3.0% Vacancy Rate

$404.5K Average Price Per Unit
7.0% Annual Rent Growth

New York’s multifamily sector remains one of the tightest and most resilient leasing markets in the country, supported by strong fundamentals and sustained investor interest.

Manhattan continues to assert itself as the premium rental market with effective rents surpassing pre-pandemic highs, while Brooklyn has evolved into a primary economic hub, attracting a younger, renter base that’s driving competition across the borough.
Year-to-date total sales volume in New York has reached $8.3 billion, paired with an average price per unit of $404,500, reflecting continued confidence in the market despite elevated borrowing costs. Performance remains competitive with a 5.3% cap rate, underscoring New York’s status as a high-barrier metro.
While investors have retreated from Manhattan’s most expensive core submarkets, capital is aggressively targeting high-yield opportunities in areas like Harlem and the Financial District, where redevelopment potential and discounted pricing remain compelling. The borough’s cap rates have stabilized between 6.0% and 6.3%, with per-unit pricing rising for six
5.3% Cap Rate
14,850 Units Annual Net Absorption
consecutive quarters, signaling the early stages of recovery. Brooklyn has also seen sales accelerate, with institutions accounting for a growing share of activity. Cap rates have compressed modestly, now aligning with Manhattan in the low 6%- range, while pricing remains elevated for waterfront assets.
Operating conditions continue to outperform national benchmarks. The market’s 3.0% vacancy rate is well below the U.S. average, driven by structural undersupply, muted construction, and stableinmigration.
Manhattan’s limited construction is hampered by construction costs and regulatory hurdles, causing a sharp drop in building filings. This is keeping the borough’s vacancy rate low, and is expected to fall to roughly 2.4% by 2026. Brooklyn, despite experiencing the highest level of completions in more than a decade, maintains one of the lowest vacancy rates nationally at 2%, supported by demographic tailwinds and demand for larger floor plans.
These dynamics have propelled strong rent momentum market wide. Annual growth sits at 7.0%, with Manhattan expected to post gains near 6.8% by year-end 2025 and Brooklyn recording 6.7% growth alongside a cumulative 44% rent increase since 2019.
Demand remains healthy across all boroughs, evidenced by 14,850 units of annual net absorption, supported by a strengthening labor market. New York City is projected to add 38,000 jobs in 2025, and in-person office attendance (particularly in Manhattan) has surged to 95% of its 2019 levels. The workers returning to office is amplifying demand for centrally located, premium rental housing. Looking ahead to 2026, slow entitlement processes, ongoing supply constraints, and durable demand drivers will continue to support low vacancy and positive rent growth. Manhattan’s long-term development opportunities increasingly lie in conversions, valueadd repositioning and niche submarket plays, while Brooklyn’s most compelling strategies focus on delivering larger, family-sized units through reconfigurations of existing small stock.

The recent election of Mayor Zohran Mamdani introduces increased attention around affordability and tenant protection policies, including the discussion of a rent freeze for stabilized units. While these proposals may influence sentiment at the margins, the market’s global prominence, economic depth continue to anchor its long-term performance.
“Maintaining quality of life in Manhattan is a demand driver that has been top off mind for developers and investors alike. Police Commissioner Jessica Tisch has agreed to remain in her role, and under her leadership the NYPD recently reported the fewest shooting incidents for the month of October since records began in 1957. Promoting both public safety and private sector investment will be key in ensuring New York City’s prosperity for the years to come.”


The San Francisco Bay Area is entering 2026 on new footing, reasserting itself as one of the nation’s most dynamic multifamily markets. Supported by a powerful combination of tech-led job creation, population stabilization, and strengthening investor confidence, demand has reinvigorated investment.
Across the region, demand is being reshaped by the rapid expansion of the AI ecosystem. San Francisco is experiencing a sharper and more immediate surge in activity driven by AI firms expanding office footprints and accelerating hiring. In comparison, San Jose’s performance is tied to Silicon Valley’s long-standing economic gravity and a renter base shaped by decades of exceptional wage growth and high barriers to homeownership.

“AI companies (databricks, openAI, and anthropic being a few of the many) have pushed office vacancy way down and helped increase multifamily rent growth. [In addition,] San Francisco’s unemployment rate compared to the rest of California, was around 3.5% [with] California’s above 5%. This has helped bring private and institutional buyers back to the market.”
-Jack Markey, Associate
San Francisco posted $2.3 billion in annual sales volume, with assets trading at an average of $428,000 per unit and cap rates compressing to 4.5%, signaling investors’ increasing willingness to price in near-term rent acceleration tied to AI-driven demand. San Jose recorded $1.9 billion in sales, with average pricing at $488,000 per unit and slightly higher cap rates at 4.6%.
While San Francisco is seeing faster cap rate compression amid strong bidding for well-located product, San Jose continues to attract capital seeking stability, income durability, and access to one of the wealthiest and most credit-stable renter populations in the nation. Across both metros, the investment narrative is improving, but San Francisco’s upside thesis is more growth-oriented, while San Jose’s is grounded in consistency and long-term absorption. Operating conditions are tightening throughout the Bay Area. San Francisco’s vacancy rate fell to 3.3% and annual rent growth reached 5.3%. This strength is supported by renewed population gains, limited new supply, and an inflow of high-income workers in the AI sector. The market’s acute supply-demand imbalance is highlighted by the absorption of 4,094 units outpaced deliveries.
San Jose posted slightly higher vacancy at 3.6%, paired with 3.1% annual rent growth and a similar 4,191 units of net absorption. This is one of the strongest demand performances the metro has recorded in the past decade.
Supply levels remain constrained across both metros, though San Francisco faces the most severe development limitations. Rising construction costs, zoning restrictions, and protracted entitlement timelines continue to suppress new starts, allowing demand to outpace completions and strengthening landlords’ pricing power.
San Jose’s supply environment, while also tight, is less structurally constrained. The metro’s pressure comes from decades of undersupply relative to household formation and for-sale housing costs that consistently rank among the highest in the country. With mortgage rates near 7% and home prices continuing to climb, San Jose now has the nation’s
largest rent-versus-own affordability gap, pushing new households directly into the renter pool and reinforcing long-term multifamily stability.
Looking ahead to 2026, the AI sector plays a pivotal role in reshaping the market’s trajectory and both cities are well positioned. The expanding cluster of major AI and tech firms has fueled renewed office activity, contributed to a 1.3% uptick in population, and supported what is shaping up to be the strongest demand cycle since before the pandemic. Constrained supply, tech-driven job creation, and mounting investor interest positions the Bay Area as one of the top multifamily markets to watch, particularly for those looking to capitalize on the momentum of the burgeoning AI economy.
Source: Matthews™ Research, CoStar Group, Inc.
Jack Markey

jack.markey@matthews.com (925) 482-5143


By the Numbers
2025 YTD | Source: Matthews™ Research
Rate
The Boston MSA enters 2026 as one of the most stable and opportunity-rich multifamily markets in the country, supported by strong population gains, a deep reservoir of high-earning renters, and a rapidly expanding tech, life sciences, and employment base.
Unlike many Sunbelt metros that are still absorbing a surge of new construction, Boston’s fundamentals benefit from a more measured supply pipeline, despite strong employment pull. Major employers, including Meta, Google, and Amazon, continue to scale engineering and R&D operations across the market, attracting high-earning renters and reinforcing the metro’s appeal as a premier innovation hub. This strength helped drive $3.1B in sales volume, average pricing of $499,000 per unit, which is nearly double the U.S. average, and a market cap rate of 5.1%.
34% of transaction volume over the previous five years involved public and institutional buyers. Within the same period, private capital accounted for 65% of seller volume and nearly half of buy-side volume. The delta between the average sale price of $13.6 million and trailing four quarters’ median sale price of $2.4 million, suggests that while public and institutional players continue to be involved in a smaller amount of large deals, smaller private buyers account for the majority of deal activity.


5,982 Units
Across the market, leasing has remained steady with annual net absorption reaching 5,982 units. The vacancy rate is about 200 basis points below the national rate of 8.4%, at 6.5%. These conditions indicate that new and existing renters are quickly filling available units, and underscores the structural demand.
At the same time, Boston’s renter preferences are shifting decisively toward higher-tier apartments. While rent growth has decreased from 2022 doubledigit, rents remain among the highest nationally and growth exceeds the U.S. average. Class A units maintain the highest rents and continue to post meaningful absorption. This trend, combined with steady investor activity and a development pipeline increasingly concentrated in desirable urban nodes, reinforces the market’s long-term stability.
With a highly educated, growing population and sustained demand from the region’s thriving tech and innovation sectors, Boston is poised for tightening fundamentals and improved rent performance in 2026. While political attention around housing affordability remains heightened, with discussions around rent stabilization drawing close scrutiny, market conditions remain fundamentally sound.

Renter Appetite for Class A Apartments is Evident, Outpacing Class B Absorption
Source: Matthews™ Research, CoStar Group, Inc.
Boston’s Net Poulation Sees Spike in Last Three Years
Source:


By the Numbers
2025 YTD | Source: Matthews™ Research


Chicago’s multifamily market enters 2026 as one of the most undersupplied and demand-driven major metros in the country. Demand continues to outpace new supply, with the region absorbing roughly 7,500 units in 2025, well above the 4,800 units delivered in the same period, pushing vacancy down to 3.5%.
This supply imbalance is expected to intensify in 2026 as only 10,000 units remain under construction, representing just 1.8% of total inventory, far below the national average and the market’s longterm average. With scheduled deliveries projected to fall to some of the lowest levels since 2012, Chicago is set for continued vacancy compression and rent gains.
Rents are accelerating across every submarket and asset class. Annual rent growth reached 3.7% market-wide, with premium Class A properties posting a stronger 4.0% increase as renters demonstrate a pronounced “flight to quality” in a constrained supply environment.
Demand remains strong in Downtown Chicago and the North Lakefront, accounting for more than onethird of total absorption and continuing to benefit from their concentration of employment, transit access, and amenity-rich neighborhoods.
Investment activity mirrors this optimism: sales volume has risen sharply to $3.8B in 2025, cap rates average 6.7%, and premier assets often trade at even tighter yields as investors price in ongoing rent growth and stable occupancy.
Major employers across finance, consulting, healthcare, manufacturing, and life sciences continue to deepen their presence, while transformative projects such as the Illinois Quantum and Microelectronic Park further elevate Chicago’s position as a tech and research hub. This enhances the market’s ability to attract and retain a highearning renter pool.
Together, these forces of a high-income renter pool, strong absorption, and limited new supply, position Chicago as one of the nation’s top-performing multifamily markets heading into 2026.

Bryan Kunze bryan.kunze@matthews.com (773) 261-8384
Source: Matthews™ Research, CoStar Group, Inc.

Deliveries Decreased Significantly Over the Last 12 Months
Source: Matthews™ Research, CoStar Group, Inc.

By the Numbers
2025 YTD | Source: Matthews™ Research
$1.7B
Sales Volume


$330K
5,846 Units Annual Net Absorption 5.3% Cap Rate 4.3% Vacancy Rate
Miami enters 2026 as one of the nation’s most demographically advantaged multifamily markets, supported by strong fundamentals and one of the deepest in-migration pipelines in the country.
The region continues to attract high-income households, young professionals, and remote workers drawn to Miami’s tax advantages, lifestyle appeal, and growing corporate presence. More recently, highincome policy refugees are anticipated to leave New York and choose Florida markets like Palm Beach and Miami. This adds a new layer of durable, upperincome demand that will help solidify the rent floor and support the next phase of growth.
These powerful demographic forces helped fuel 5,846 units of net absorption in 2025, keeping vacancy at a healthy 4.3% despite substantial new deliveries across the metro. While rent growth moderated to 0.7% in 2025 due to the heavy wave of new deliveries, Miami is expected to regain momentum in 2026 as supply pressure eases and
demand continues to deepen. Much of the elevated pipeline is beginning to taper, setting the stage for improved performance as thousands of new units lease up and population inflows remain robust.
Investor activity remains strong, with $1.7B in sales volume, an average price per unit of $330,000, and cap rates holding at 5.3%, signaling sustained confidence in Miami’s long-term growth trajectory.
Miami’s expanding finance, technology, hospitality, and healthcare sectors, reinforced by ongoing corporate relocations and international investment, continue to diversify the local economy and strengthen the renter base.
With absorption outpacing expectations, vacancy tightening, and supply set to normalize, Miami enters 2026 with the foundation for renewed rent growth and sustained investor interest, placing it firmly among the top multifamily markets to watch.
Source: Matthews™ Research, CoStar Group, Inc.
Source: Matthews™ Research, MovingPlace
Philadelphia, Camden & Wilmington
Miami, Ft. Lauderdale & West Palm Beach
Bridgeport, Stamford & Danbury
Washington, Arlington & Alexandria
Kirya Joel, Poughkeepsie & Newburgh
Allentown, Bethlehem & Easton
Los Angeles, Long Beach & Anaheim
Trenton & Princeton
Boston, Cambridge & Newton
Orlando, Kissimmee & Sanford
Tampa, St. Petersburg


By the Numbers
2025 YTD | Source: Matthews™ Research
$16.5B Sales Volume
6% Vacancy Rate

$174.5K Average Price Per Unit
0.6% Annual Rent Growth
Atlanta enters 2026 from a position of emerging strength as the market begins to stabilize after several years of historically elevated supply. Despite vacancy averaging 6% in 2025 and rent growth holding at a modest 0.6%, the metro posted a substantial 20,576 units of net absorption, signaling renewed momentum as demand once again outpaced new deliveries.
Investor confidence remained firmly intact, with $16.5B in multifamily sales, an average price per unit of $174,500, and cap rates at a competitive 5.2%, underscoring long-term conviction in the region’s demographic and economic fundamentals.
The market’s near-term challenges, primarily elevated vacancy and competitive lease-up conditions, are beginning to recede. The development pipeline is contracting sharply, with expected 2025 deliveries down roughly 40% from the prior year’s peak, marking a decisive shift toward more balanced supply conditions. This moderation is pivotal: for the first time since 2021, absorption is poised to consistently keep pace with, and potentially exceed, new supply.
Demand drivers remain firmly entrenched. Metro Atlanta continues to outperform in population and household growth, supported by a broad-based employment ecosystem spanning logistics, education and health services, technology, and professional services.
20,576 Units
Even as certain office-using sectors cooled in 2025, the region’s overall economic profile remained resilient, ensuring a steady inflow of renters seeking relative affordability and proximity to expanding job centers. Growth nodes such as Midtown, West Midtown, and North Fulton continue to benefit from ongoing corporate relocations and high-skill employment announcements.
Atlanta’s strong absorption, moderating construction pipeline, and durable economic base position the metro for a meaningful inflection in 2026.

“We’re optimistic that we will see an increase in transactional velocity in 2026.”
-Connor Kerns & Austin Graham, First Vice Presidents & Associate Directors
With rent growth expected to return to positive territory by mid-year and investor appetite remaining elevated, Atlanta stands out as one of the nation’s most compelling multifamily markets heading into the next cycle.
Atlanta Multifamily Demand Nears Pandemic-Era Peak
Source: Matthews™ Research, CoStar Group, Inc.
Atlanta Multifamily Transaction Volume
Source: Matthews™ Research, CoStar Group, Inc.
connor.kerns@matthews.com


By the Numbers

2025 YTD | Source: Matthews™ Research

Vacancy Rate
Washington, D.C. enters 2026 with strengthening multifamily fundamentals supported by one of the most stable, recession-resistant demand bases in the country. The region experienced a temporary pause in rent growth in 2025 due to elevated deliveries, yet leasing performance remained exceptionally resilient. The market absorbed a substantial 7,709 units over the last year, pushing vacancy down to 4.1% and reaffirming the region’s depth and durability.
Investor activity remained robust, with $4.4B in sales volume, an average price per unit of $313,000, and cap rates holding at 5.6%, reflecting long-term confidence in the metro’s steady leasing velocity and strong income stability.
Demand continues to be anchored by the region’s diversified economic foundation. Federal government agencies, legal services, education and research institutions, and professional and business services collectively sustain one of the country’s most reliable employment ecosystems. These sectors not only support consistent household formation but
also create a resilient base of high-credit renters who value proximity to major job centers, transit infrastructure, and urban amenities.
Even as portions of the national economy softened in 2025, D.C.’s employment profile remained steady, enabling the market to absorb new supply at a pace that outperformed expectations.
Looking ahead to 2026, D.C.’s outlook is bolstered by several key tailwinds. Supply growth is set to moderate from its recent highs, reducing pressure on vacancy and setting the stage for a more balanced leasing environment. Population and job growth remain concentrated in high-income, urban neighborhoods with sustained demand for quality rental housing.
The market’s ability to quickly absorb new units in 2025, combined with its structurally stable employment base and durable renter demographics, positions Washington, D.C. for above-average investment appeal as it heads into 2026.

Source: Matthews™ Research, CoStar Group, Inc.
Source: Matthews™ Research, CoStar Group, Inc.


By the Numbers
YTD | Newark & Hudson County | Source: Matthews™ Research


Northern New Jersey’s multifamily market is shaping up for a standout 2026 as it benefits from powerful cross-currents of demand, ranging from New York City spillover to robust local household formation and an increasingly affluent renter base.
After another year of exceptional performance the market enters 2026 with some of the enters 2026 with robust fundamentals. Net absorption reached 4,329 units, easily outpacing new supply and driving vacancy down to just 3.0%. Vacancy tightened across every major submarket over the past year, falling 150 basis points in Newark, 190 basis points in Jersey City, and 90 basis points in Hoboken.
Rent growth surged to 6.2% in 2025, one of the strongest increases among major U.S. metros. Hudson County commands rents $1,200 to $1,500 above Newark due to superior transit access to Manhattan. Yet relative affordability still favors New Jersey, a dynamic that is likely to intensify if New York expands rent regulations.

Rent growth has not recorded negative performance since 2017, marking Northern New Jersey asone of the very few metros to post consistent gains throughout the pandemic and recovery period.
With $1.1B in sales volume, $314,000 average price per unit, and cap rates at 5.7% reflect a market that offers both near-term momentum and long-term durability. Should new rent controls be implemented in NYC, demand is expected to shift even more aggressively into Northern New Jersey’s nonregulated stock, accelerating rent growth and further tightening occupancy. Employment conditions further reinforce the market’s trajectory. While statewide job growth has appeared modest, Northern New Jersey’s economy tells a more robust story of diversification and resilience. Education and health services, along with the trade, transportation, and utilities sectors tied to the Port of Newark-Elizabeth, create a massive, stable base of employment.
Northern New Jersey is also nearing the peak of its construction cycle. Nearly 7,700 units were delivered over the past 12 months, yet developers have started just 5,500 units over the same period.
Looking ahead, Northern New Jersey is poised to maintain this strength in 2026 as several tailwinds converge. Limited construction activity across most submarkets will keep supply pressures minimal, allowing rents to continue rising from a position of already tight occupancy.
At the same time, ongoing in-migration from Manhattan, driven by relative affordability, new luxury development in places like Jersey City and the Gold Coast, and expanding transit-oriented districts, is expected to sustain deep demand for high-quality rentals. Northern New Jersey enters 2026 with a compelling foundation for continued outperformance.


Source: Matthews™ Research, CoStar Group, Inc.


David Ferber david.ferber@matthews.com
(551) 888-0042


By the Numbers
2025 YTD | Source: Matthews™ Research

$2.2B
Sales Volume
4.1% Vacancy Rate

$403K
Average Price Per Unit (0.2%)
Annual Rent Growth
San Diego enters 2026 with one of the most stable and supply-constrained multifamily landscapes on the West Coast. In 2025, the market absorbed 4,763 units, enough to keep vacancy at a tight 4.1% despite a recent wave of deliveries, as a 20-year high of roughly 5,600 units have been completed so far this year.
Although annual rent growth temporarily dipped 0.2%, the region’s underlying demand drivers remain among the strongest in the nation. These drivers include a high-income workforce, continued population gains, and a steady influx of renters priced out of homeownership in one of the nation’s least affordable for-sale housing markets.
Investor confidence mirrors these fundamentals, with $2.2B in sales volume, an average price per unit of $403,000, and cap rates at 4.7%, signaling longterm optimism about the market’s trajectory.
Conditions are set to strengthen further in 2026 as construction activity begins to moderate and the market rebalances. Much of the elevated supply
Annual Net Absorption 4.7% Cap Rate
4,763 Units
delivered in 2024–2025 has already seen strong lease-up, particularly in coastal and infill submarkets where land scarcity and restrictive zoning limit future development. In addition, developers have notably pivoted towards smaller units.
With fewer projects breaking ground and structural barriers keeping pipeline growth in check, vacancy is expected to tighten further over the next year. At the same time, the region’s expanding life science, defense, biotech, and technology sectors continue to attract high-earning talent. These dynamics point to a market poised for renewed rent growth, sustained occupancy strength, and competitive investor interest in 2026.
Michael Kasser
michael.kasser@matthews.com (619) 382 3750

San Diego Multifamily Supply & Demand Dynamics
Source: Matthews™ Research, CoStar Group, Inc.
San Diego Developers Pivot Towards Smaller Units
Source: Matthews™ Research, CoStar Group, Inc.
By the Numbers
2025 YTD
| Source: Matthews™ Research


Orange County continues to distinguish itself as one of Southern California’s most resilient multifamily markets, supported by exceptionally tight vacancies, durable renter demand, and a pronounced “flight to quality” that is reshaping leasing trends.
The county benefits from structural supply constraints, high household incomes, and steady population drivers—all of which position it for strong performance in 2026. The median household income is almost $120K compared to the national average of about $89K, as the labor market continues to attract new residents. Orange County boasts an unemployment rate of -0.09% in comparison to the US rate of 0.54%. Investor sentiment remains confident despite elevated borrowing costs. Sales activity reached $917M in 2025, supported by sustained institutional interest. At $453,000 per unit, Orange County remains among the nation’s most expensive apartment markets, with pricing reinforced by limited land availability and consistent buyer competition. Cap rates hold firm at 4.4%, among the lowest in the country, underscoring the depth of capital targeting high quality, well-located assets.
Operationally, the market is anchored by a 4.2% vacancy rate, which is materially below the national average and supported by steady demand from employment centers in Irvine, Costa Mesa, and the coastal submarkets.

Even with moderate annual rent growth of 1.3%, absorption remains healthy, with 4,725 units absorbed, nearly matching new deliveries. Importantly, the market’s “flight to quality” trend continues to favor newly built, amenity-rich Class A properties, which are capturing a disproportionate share of leasing activity as high-income renters pursue upgraded, amenity-rich products in a limitedsupply environment.
With development heavily concentrated in Irvine and minimal new supply elsewhere, Orange County is poised to maintain tight occupancy levels into 2026.

“With this flight to quality, we are seeing more and more deals sell with negative leverage. We believe this to be a testament to the strength of Orange County multifamily.”
-Mark Bridge, Executive Vice President
With a constrained pipeline, rising household incomes, and rebounding in-migration, Orange County is positioned for firmer rent growth and strengthening investment performance in 2026. As supply remains concentrated in only a handful of submarkets while demand deepens across the county, the market is set to maintain its standing as one of the most competitive and stable multifamily markets in the nation.
Source: CoStar Group, Inc.
OC
Source: CoStar Group, Inc.


BY


The industrial sector has seen a significant change following the post-pandemic surge, which resulted in an oversupply of large-scale distribution centers that are 200,000 square feet or greater. Developers responded to the e-commerce boom and low interest rates, and added a record-breaking 1.8 billion square feet of industrial supply across the U.S. since 2020. The new additions outpaced demand as the pandemic slowed down, which led to climbing vacancy rates in the big-box segment.
As the market struggled to absorb this massive influx of large product, developers and investors shifted their focus on small- to mid-sized industrial properties, specifically those ranging from 5,000 to 50,000 square feet. This smaller-scale, or "smallbay," product remains incredibly tight, with a national vacancy rate near historical lows around 3% to 4%, demonstrating its resilience and importance to last-mile logistics, small businesses, and tradefocused users. The shift highlights a key trend in the evolving industrial sector. While large warehouse development slows, with a vacancy rate around 6%, the demand for smaller, flexible facilities is driving a building boom that reflects the diversity of activity across industrial.
A variety of tenants are seeking properties between 5,000 to 50,000 square feet. The demand represents a move away from traditional heavy manufacturing toward specialized, knowledge-based services and high-tech operators. This user base includes
Additionally, these small- to mid-sized spaces are essential for the growth of modern tech firms. Startups in robotics, drone technology, and specialized R&D require flexible, functional space for prototyping, light assembly, and system testing without the massive footprint of a traditional factory. This newer user base often prefers shorter lease terms than the 10- to 15-year commitments of large distribution centers, allowing for the agility to scale operations quickly with buildouts as their technology matures.
Across the country, the Sunbelt states, as well as markets with high population growth and limited supply, are experiencing the most acute demand and lowest availability. While urban centers like Los Angeles and New York’s outer boroughs remain tight, high-growth metros across the country, including Phoenix’s East Valley, Houston, Atlanta, and Central Florida, are seeing particularly low vacancy rates for this product type. The national availability for industrial spaces under 50,000 square feet


The structural scarcity and increased demand for industrial spaces under 50,000 square feet are hindered by construction costs. While overall industrial construction prices have stabilized from their pandemic peaks, the cost per square foot for smaller, multi-tenant industrial projects is higher than for large big-box distribution centers. Small industrial properties recorded an average sales price of $142 per square foot, increasing by 17% over the previous year. In contrast, large industrial projects averaged around $75 per square foot, a lower level that dropped by 4.2% in one year.

This disparity is driven by factors like more extensive site work, complex utility infrastructure, a greater number of individual tenant build-outs, and increased costs for specialized labor. The expense of small-bay construction, coupled with high land costs in infill locations, creates significant barriers to entry for developers, limiting new supply and pushing a variety of highly-qualified tenants into further competition for the existing, limited inventory.

Users are prioritizing well located spaces with shorter term lease flexibility so they can operate without longterm commitment


Investors, on the other hand, want those same spaces secured with longer term leases to create predictable income and support pricing.
The San Francisco Bay Area is a prime example of the high demand and scarcity driving the small-bay industrial market’s outperformance. The Bay Area is a prominent metro for its land limitations and consistent demand from high-value, specialized companies. These factors create an environment where the price per square

foot and rental rates for the sub-50,000square-foot segment have demonstrated greater stability and often faster growth than large-scale facilities, which have seen more volatility due to oversupply in other national markets. The essential need for local logistics, high-tech R&D support, and vital trade services means tenants are willing to pay a premium to secure space close to the metro’s talent and consumer base.
This demand is increasingly fueled by next-generation tenants. While traditional logistics remain active, the region has seen an influx of AI and robotics firms securing smaller footprints for computer power and flex lab setups, often displacing traditional tenants. One example is the metro’s Peninsula submarket. Here, land is the most limited because it is home to several R&D, life sciences, and specialized tech operators, and the area often outpaces Silicon Valley in conversion activity. These users require older industrial stock that can be repurposed to meet high electrical power and specialized utility needs.
Meanwhile, the Oakland/East Bay submarket provides a lower-cost option. Fueled by activity at the Port of Oakland and last-mile distribution requirements, small-bay facilities here are essential for fabrication, local logistics, and distribution that serve other locations across the metro. Further south, San Jose/Silicon Valley is seeing increased demand driven by advanced R&D and manufacturing support services, with data center growth also adding to these expansions. While new additions here are consuming significant industrial land for large, power-intensive facilities, the demand also creates a large domain of support and technical services that rely on flexible, smaller industrial spaces.
*up to 50,000 SF | Source: CoStar Group, Inc.
The small-bay segment demonstrates the essential, high demand backbone of modern industrial. Unlike the largeformat sector, which grappled with postpandemic oversupply, the small-bay market is characterized by essential demand outpacing scarce supply. With a variety of tenants, from specialized R&D firms and high-tech startups to local contractors and last-mile logistics providers, their operations require proximity to urban centers. While new, Class A small-bay facilities command premium rents, the competition is increasingly driving smaller businesses to seek more affordable Class B and C industrial properties. This flight to quality underscores a core structural issue—the limited supply of small-bay facilities.
belall.ahmed@matthews.com (925) 718-7522
Developers are beginning to explore solutions, like multi-story industrial construction in land-constrained urban markets. While this model is effective for maximizing floor space on a small footprint, its high construction cost means it can only deliver high-end, Class A product, which does not meet demand. The gap between this new, high-cost supply and the consistent need for affordable flex and Class B/C space suggests that the small-bay segment will remain the most increasingly sought-after industrial asset for the foreseeable future.


The U.S. retail market is undergoing a major reset. National tenant profit margins have been shrinking, and many large retailers are struggling to remain efficient and profitable. Higher interest rates, tighter capital, and rising operating costs have forced legacy chains to consolidate, with as many as 80,000 retail stores projected to close by 2026, according to the global finance and research firm, UBS.


The contraction of corporate retail has dismantled decades of monotony, opening the door to a more modern and dynamic retail scene. As consumer behavior evolves and demand is shaped by technology and global influence, the line between commerce and culture continues to blur, creating space for a new generation of agile, experiential tenants.
WAY
For much of the 20th century and into the early 2010s, American consumer culture was fairly uniform. Your standard shopping experience was filled with the same chains and tenants that ultimately created a homogenized experience. The digitalization of consumerism has become a fundamental anchor in reprogramming the way people engage with brands and what they expect when they enter a space.
The pandemic accelerated that reset. It systemically changed what people value, how they spend their time, and what they expect from retail. The rise of e-commerce instilled a sense of instant gratification in consumers. That convenience didn’t go away, but it did change how people think about physical space. Now, when someone decides to leave home, it has to be for something that feels purposeful.

You can see it in the data. E-commerce sales have skyrocketed from $571 billion in 2019 to about $1.22 trillion in 2024, with projections reaching $1.45 trillion by 2026, growing at an annual rate of nearly 9%, according to the U.S. Census Bureau.
But rather than replacing brick-and-mortar, that growth has forced it to evolve.

PHYSICAL STORES NOW SERVE A COMPLETELY DIFFERENT PURPOSE; THEY’VE BECOME TOUCHPOINTS FOR EXPERIENCE, COMMUNITY, AND BRAND IDENTITY.
On the other side of the board is social media, which has completely democratized discovery. It’s a global gateway with on-demand access, creating a more curious and expressive consumer who expects something different every time. Social platforms are now the mainstream forum intersecting identity, storytelling, and consumer influence in real-time. Over 60% of traditional shoppers now regularly visit brand websites or social channels before purchase, according to Salsify’s 2025 Consumer Research Report.

The result? The market’s now defined by experimentation and immersification of the retail experience. Concepts evolve faster, collaboration is the standard, and physical space has become a laboratory for connection, where brands test, learn, and adapt in response to an audience that craves constant novelty. In this new landscape, authenticity outperforms scale. The retailers gaining momentum are the ones who treat their stores as living, shareable expressions of culture.
Social Commerce Sales ($B) Scrolling to New Heights
Source: Statista ’25-’29 Projections
$2,000
$1,500
$1,000
$500

Social media isn’t just shaping taste anymore; it’s replacing storefronts. As discovery and checkout blur into one seamless moment, social commerce sales in the U.S. are expected to surge from $821 billion in 2025 to nearly $1.7 trillion by 2029.


As Consumer Expectations Evolve and Legacy Models Fall Behind, HOW ARE THOSE PRESSURES TRANSLATING INTO THE WAVE OF BANKRUPTCIES AND LARGE-SCALE STORE CLOSURES?


CONSUMER BEHAVIOR MOVED FASTER THAN CORPORATE RETAIL COULD ADAPT.
For decades, large national chains relied on scale—more stores, more exposure, more leverage with landlords and lenders. They gambled on perpetual consumerism demand, relying on debt to fuel growth. Expansion came easy when capital was cheap, so they signed long-term leases and took on substantial occupancy costs under the assumption that demand would remain consistent. But today? Well, that predictability is gone.
The problem is structural. Most legacy retailers are burdened with outdated infrastructures, supply chains, store operations, and IT systems that weren’t built for the pace of change. The default risk for U.S. firms rose to 9.2% at the end of 2024, the highest level since the 2008 financial crisis,
according to Moody’s 2025 Asset Management Research report. Those credit pressures have hit retail especially hard, echoing the strain of a broader economic recalibration.
We’ve already seen 59 large retail bankruptcy filings in the first half of 2025, nearly 50% higher than the long-term semiannual average, according to Coresight Research. Major operators like Joann, Macy’s, Rite Aid, Walgreens, and Foot Locker are consolidating, restructuring, or closing altogether. S&P Global reports that companies this year are facing a 64-basis-point contraction in profit margins, despite rising revenue expectations, largely due to higher costs across labor, materials, and logistics. It’s the perfect storm for insolvency.
2024 vs. 2025 Retail Store Expansion and Contraction Trends
Source: Coresight Research
Number of Stores


something decent to eat. People are willing to drive past convenience if it means connection, culture, or quality. Consumers are also driven by making health-conscious decisions, whether it be avoiding seed oil or seeking organic and natural products. Regional tenants tend to be more agile and better attuned to customer trends than corporate chains.
These changing market forces have also raised Chapter 11 filings to their highest level in eight years. Yet, this reset is clearing inefficiencies and making way for leaner, data-driven operators who focus on speed, cultural connection, and financial sustainability. The result is a retail landscape that is more dynamic and agile than ever before.

AMERICAN CONSUMERS ARE SHIFTING TOWARDS FOODS THAT ENHANCE ENERGY, FOCUS, AND GUT HEALTH


Source: Prepared Foods | 2025
5 IN 10 SHOPPERS ACTIVELY SEEKING HIGH-PROTEIN FOODS 4 IN 10 PRIORITIZE CLEAN-LABEL PRODUCTS

WE’RE SEEING LOCAL AND REGIONAL OPERATORS NOT ONLY SURVIVE BUT OUTPERFORM IN SPACES ONCE DOMINATED BY NATIONAL CHAINS. WHAT’S DRIVING THEIR SUCCESS, AND
The tenants backfilling these spaces aren’t placeholders; they’re operators who understand their communities and build brands around the nuances of their market. They move fast, experiment, and don’t wait for corporate approval to try something new. That agility is their advantage.
The regional operators leading this wave understand marketing in a way legacy brands never had to. They didn’t have to adapt to the digital era—they’re integrated by proxy. These are founders who grew up on social media, who treat every location as both a business and
a content engine. They’re utilizing storytelling, local influencers, and community engagement to transform what was once traditional retail into cultural real estate. Their customers aren’t just shopping, they’re participating in the brand.
This new generation of tenants moves fast and connects deep. They know how to create spaces that resonate, coffee shops that double as creative hubs, fitness studios that feel like social clubs, and restaurants that build identity as much as they sell food. That connection is what corporate expansion models can’t replicate.
Michael Pakravan’s Retailers to Watch Regional Retailers Turning Local Flavor into Lasting Brand Power.


HOW LANDLORDS EVALUATE VALUE. FOR A LONG TIME, CREDIT WAS THE GOLDEN METRIC. BUT FROM A CAP RATE PERSPECTIVE, PERFORMANCE IS NOW OUTWEIGHING PEDIGREE.
A regional concept that drives consistent foot traffic and community engagement can outperform a national nameplate that’s lost cultural traction. The real question landlords are asking now isn’t “Who can pay the most rent?” It’s “Who can keep this center relevant, busy and sexy?”
StormBurger, a regional restaurant that repurposed a former Church’s Chicken, increased sales fivefold, not because the menu was revolutionary, but because the brand felt alive. They utilized social media, local partnerships, and genuine storytelling to create something people wanted to rally behind.
Two of the hottest tenant segments are pilates and coffee, both of which address the post-COVID need for connection and consistency. Pilates is about self-investment and belonging; coffee is about ritual and community. They’re everyday anchors that bring people in and keep them coming back.


fragment the big boxes, diversify risk, and extend dwell time. They make centers feel dynamic again.
What’s happening now is that landlords are rethinking the definition of “value.” The strongest centers today aren’t just collections of leases; they’re curated ecosystems. The focus is on energy, synergy, and demographic diversity.

A GREAT TENANT ISN’T THE ONE WITH THE BIGGEST CREDIT ANYMORE; IT’S THE ONE WHO BRINGS THE MOST LIFE TO THE PROPERTY. THESE OPERATORS ARE BUILT ON RELATIONSHIPS.
And that’s where these regional operators excel.
MICHAEL PAKRAVAN michael.pakravan@matthews.com (310) 919-5737


By Matthews™ CEO & Founder, Kyle Matthews
matthewsreisresearch.substack.com


Whether you have owned a shopping center for 15+ years or have recently acquired a legacy property, here are some ways modernizing your asset can revitalize its appeal and long-term value.
Retail investment has reignited, as the sector posted one of its strongest quarters in Q3 2025 with sales volume up 33.4% YOY to $17.2 billion, according to a recent RCA analysis. Nearly half of this activity came from shopping center acquisitions alone. As retail investment demand increases, investors are turning their attention to legacy shopping centers held by families or individual owners, often for generations. Many of these properties, having been owned for 15-20 years, feature older lease structures, rents that have not been recently adjusted, and/or limited professional management. By implementing new leases, tenants, and operational efficiencies, new and existing owners can unlock hidden value and reawaken the opportunity these assets have held onto for generations.


By updating an asset’s lease structure to include NNN structures, rent escalations, CAM recoveries, etc., it will pass the majority of property-related expenses (i.e. taxes, insurance, and maintenance) to tenants. This creates a highly predictable, stable source of income for landlords. Replacing/optimizing outdated agreements will also generate significant financial and operational benefits. Many of these properties have tenants in place with belowmarket rents. An updated lease structure minimizes the potential for risks associated with fluctuating operational costs and ensures a reliable cash flow; critical for investors seeking passive involvement and efficient asset management.
profile and draw broader customer traffic. At the same time, direct access to existing tenants allows them to understand local needs and community preferences, making it possible to introduce a synergistic mix of service-oriented tenants that enhance convenience and relevance for shoppers. This dual approach of combining strategic national leasing with thoughtful local service additions can refresh the tenant mix, increase foot traffic, and ultimately maximize the value of the property while maintaining its longterm legacy.
Property enhancements such as façade improvements, signage upgrade, lighting and landscaping can take a property to the next level, completely repositioning these shopping centers, both visually and competitively. These visual updates elevate an asset’s perceived value and attract retailers seeking vibrant, high-visibility retail environments by reinstating the center’s investment potential. By strategically investing in property enhancements, owners can transform legacy shopping centers into not only high yielding, but exciting and captivating places for customers to dine and shop.


Leveraging deep industry relationships, managers of large portfolios have a unique opportunity to implement active, professional management systems.
Experienced managers proactively manage tenant risk, renew leases early, and adjust rents to market conditions, reducing vacancies and strengthening collections. Through tenant engagement and strategic mix planning, professional oversight builds a vibrant, stable base that enhances long-term asset value. Properties that proactively engage tenants early see renewal rates improve from 80% to 92% with targeted incentives.
Active management leverages market data to guide rent and tenant decisions to keep properties aligned with consumer trends and competitive dynamics for optimal revenue. Professional teams, with the right resources, can also implement custom budgeting,
Renovated Shopping Centers Capture Premium Rents and Are Not Slowing Down
Source: Matthews™ Research, CoStar Group, Inc.
$23
$20
$17
$14

Rennovated 2015-CurrentAll
Investors who can support generational transitions in ownership and operations provide liquidity and simplified estate management for legacy owners, while unlocking new growth and operational potential. This creates opportunities for structures like UPREIT contributions (§721 exchanges), allowing sellers to defer taxes while providing ongoing income via distributions, access to professional management and economies of scale, and the opportunity to participate in future appreciation. This structure can be especially advantageous for estate planning, allowing owners to preserve and transfer wealth efficiently, while turning a management intensive property into a more passive, long-term investment.
The Southeast region offers a rare combination of stability and untapped upside in generational shopping centers owned by individual operators. By strategically reinvesting, through modern lease structures, targeted property upgrades, and professional management, investors can unlock hidden value and significantly enhance NOI. This opportunity goes beyond simple repositioning; it represents a chance to redefine the future of community retail, both regionally and nationally, by creating vibrant, sustainable shopping destinations that meet evolving consumer needs. Those who move swiftly to acquire, modernize, and professionally operate these assets will be well positioned to generate strong returns and long-term appreciation while shaping the retail landscape for

Consumers demand more than just products; they want inviting environments, convenience, and a clear sense of place that generational centers have the potential to provide. Revitalizing these assets to keep up with rising demand presents a profitable opportunity for investors.
Here are the facts:
The New Visit Pattern
12-15% 8-10%
shorter average dwell time more store trips since 2023
Grocery-anchored centers now exceed pre-pandemic traffic levels, led by California and Washington.
As consumer expectations evolve, foot traffic patterns reveal that shoppers are more active yet increasingly time-conscious, favoring retail environments that deliver convenience, efficiency, and experiential value in every visit.
3.5% + conversion gain with staff engagement training – (BLS)
As automation and convenience reshape shopping, the human element remains a critical advantage—engaged, service-driven teams elevate the in-store experience, deepen loyalty, and drive measurable sales gains.
Hospitality is becoming the differentiator in everyday retail.
A shopping center in Georgia increased occupancy from 99% 88%
after focusing on serviceoriented tenants (such as salons, pet-care, chiropractic) alongside traditional anchors – (ICSC)
In today’s evolving retail landscape, centers with an optimized blend of national anchors with service- and experience-oriented tenants, outperform peers and attract substantially more shopper stops per visit.
Today’s retail revival is consumer-led. Shoppers crave speed, experience, and connection, creating a powerful tailwind for investors modernizing legacy centers with professional management, strong tenant curation, and upgraded experiences.
Ashleigh Liguori
ashleigh.liguori@matthews.com (864) 766-4451
Jeff Enck
jeff.enck@matthews.com (470) 704-8872
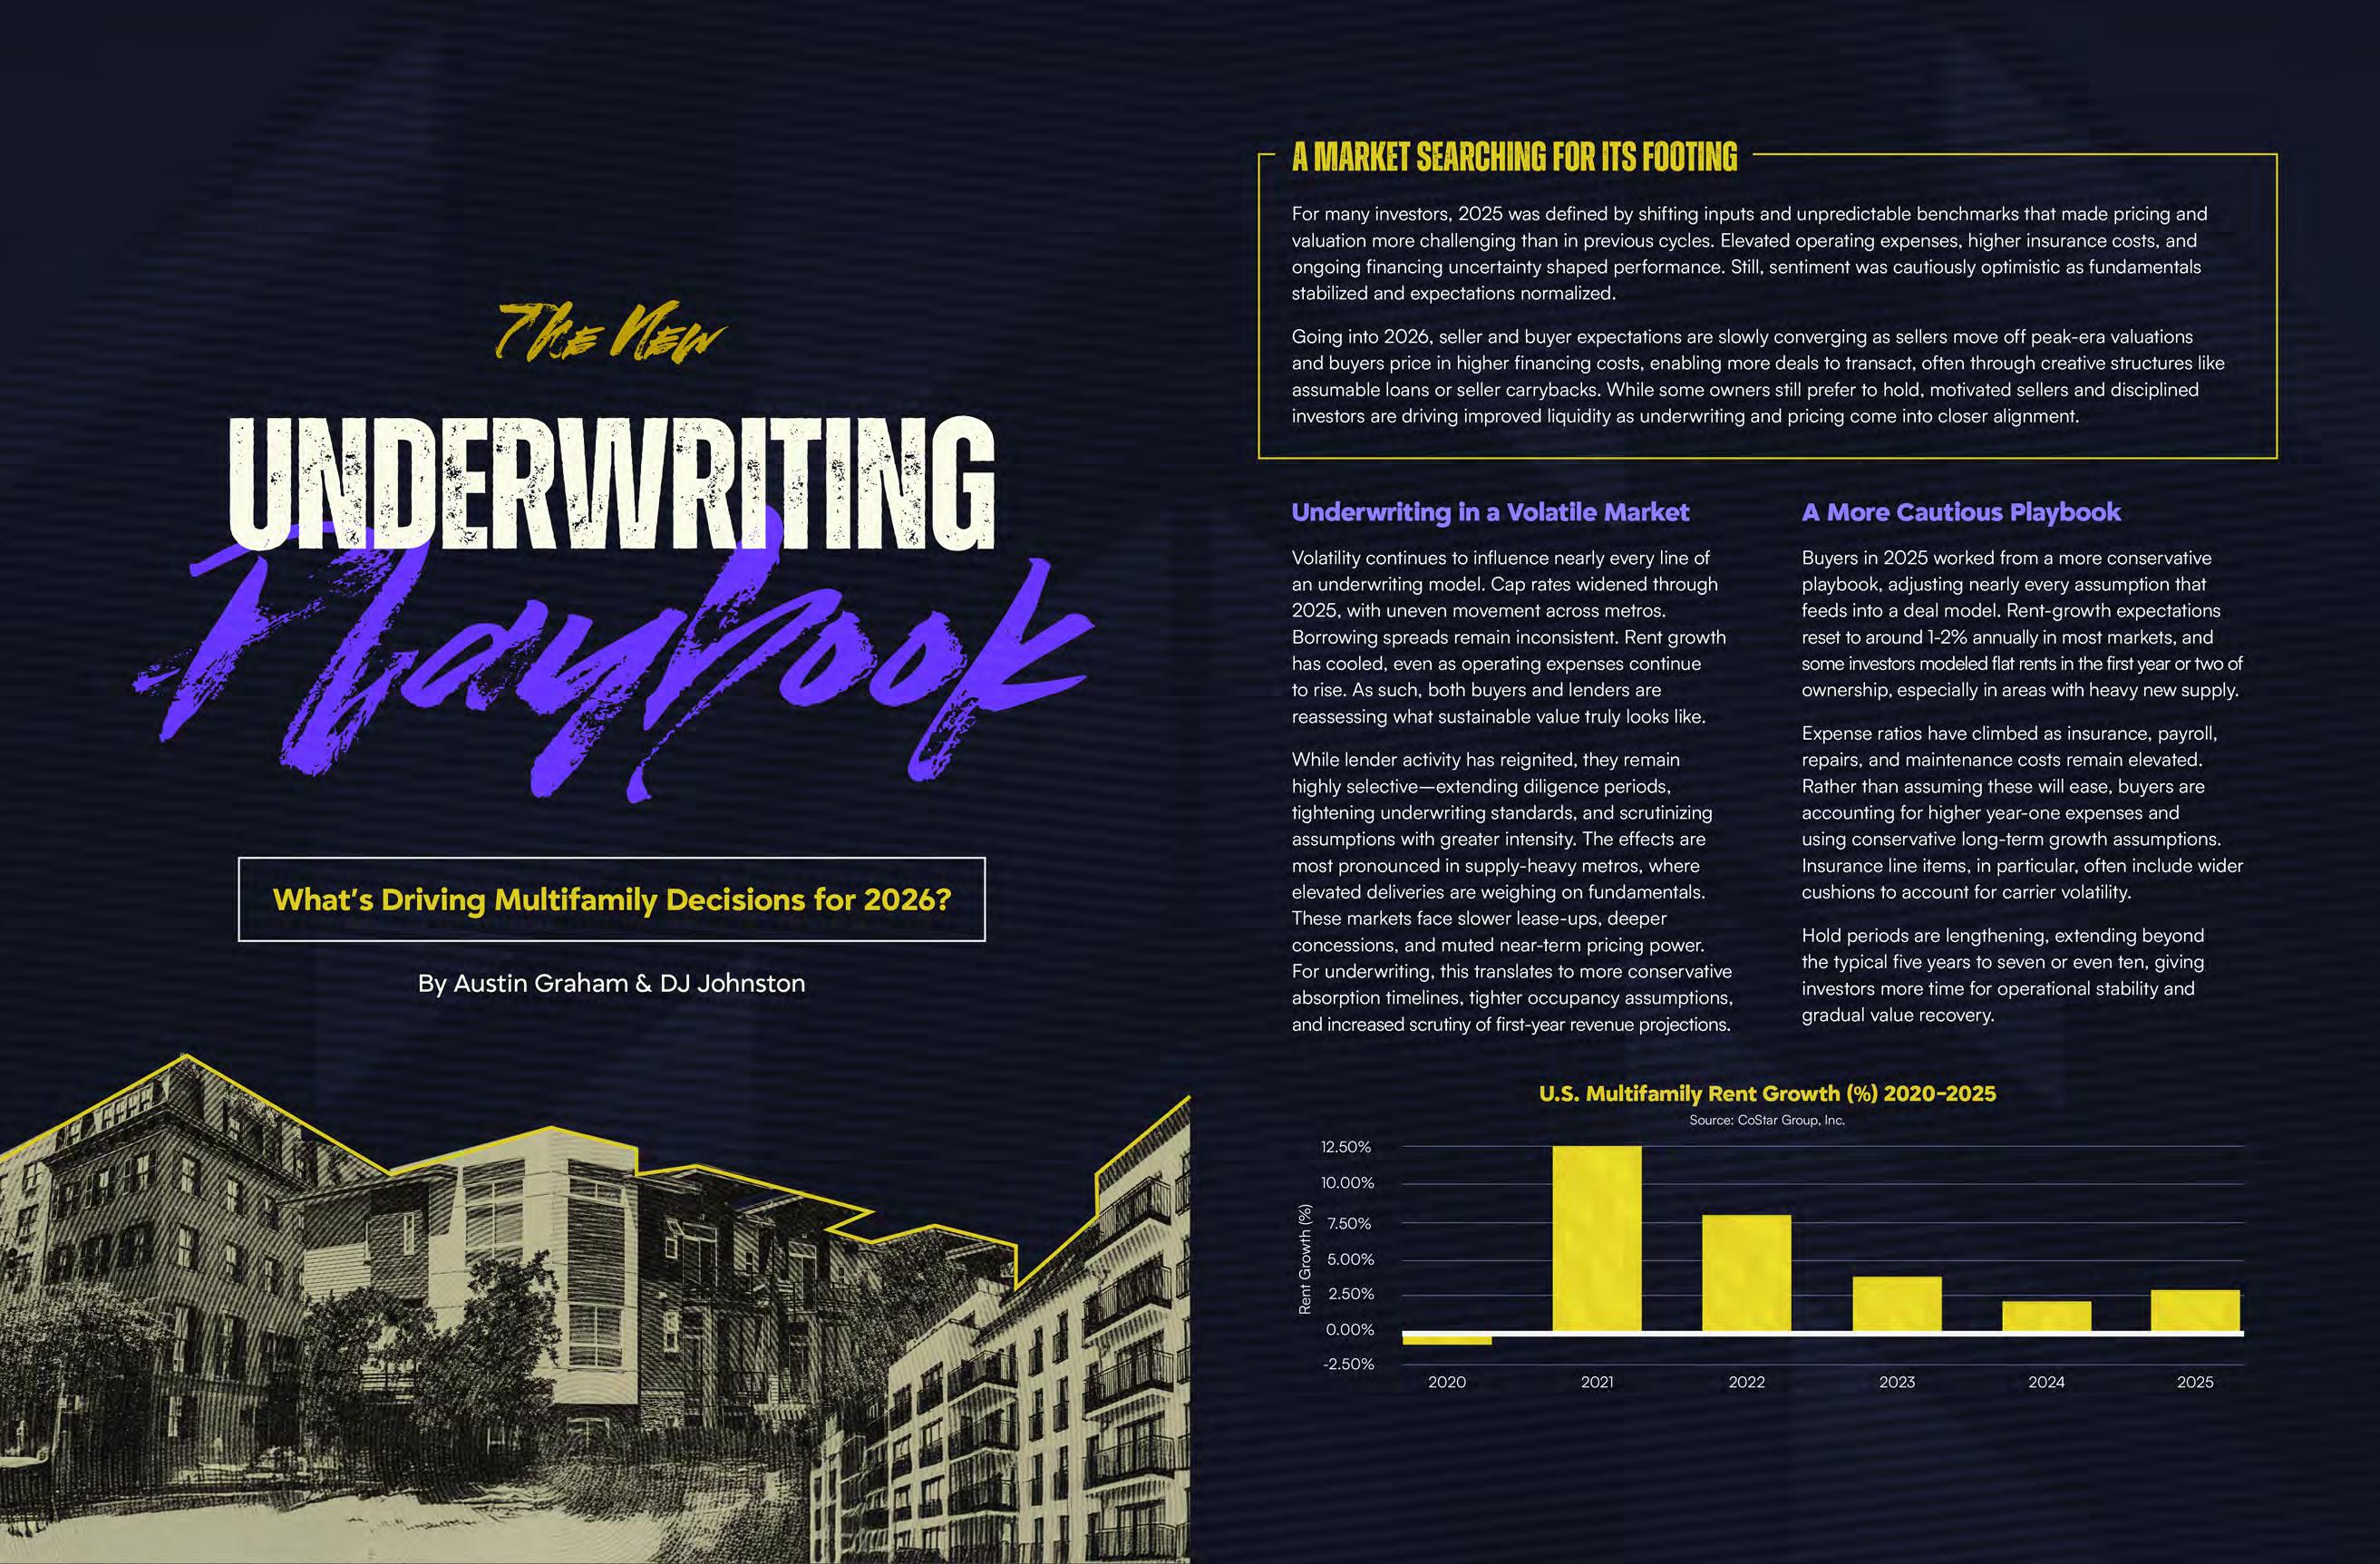

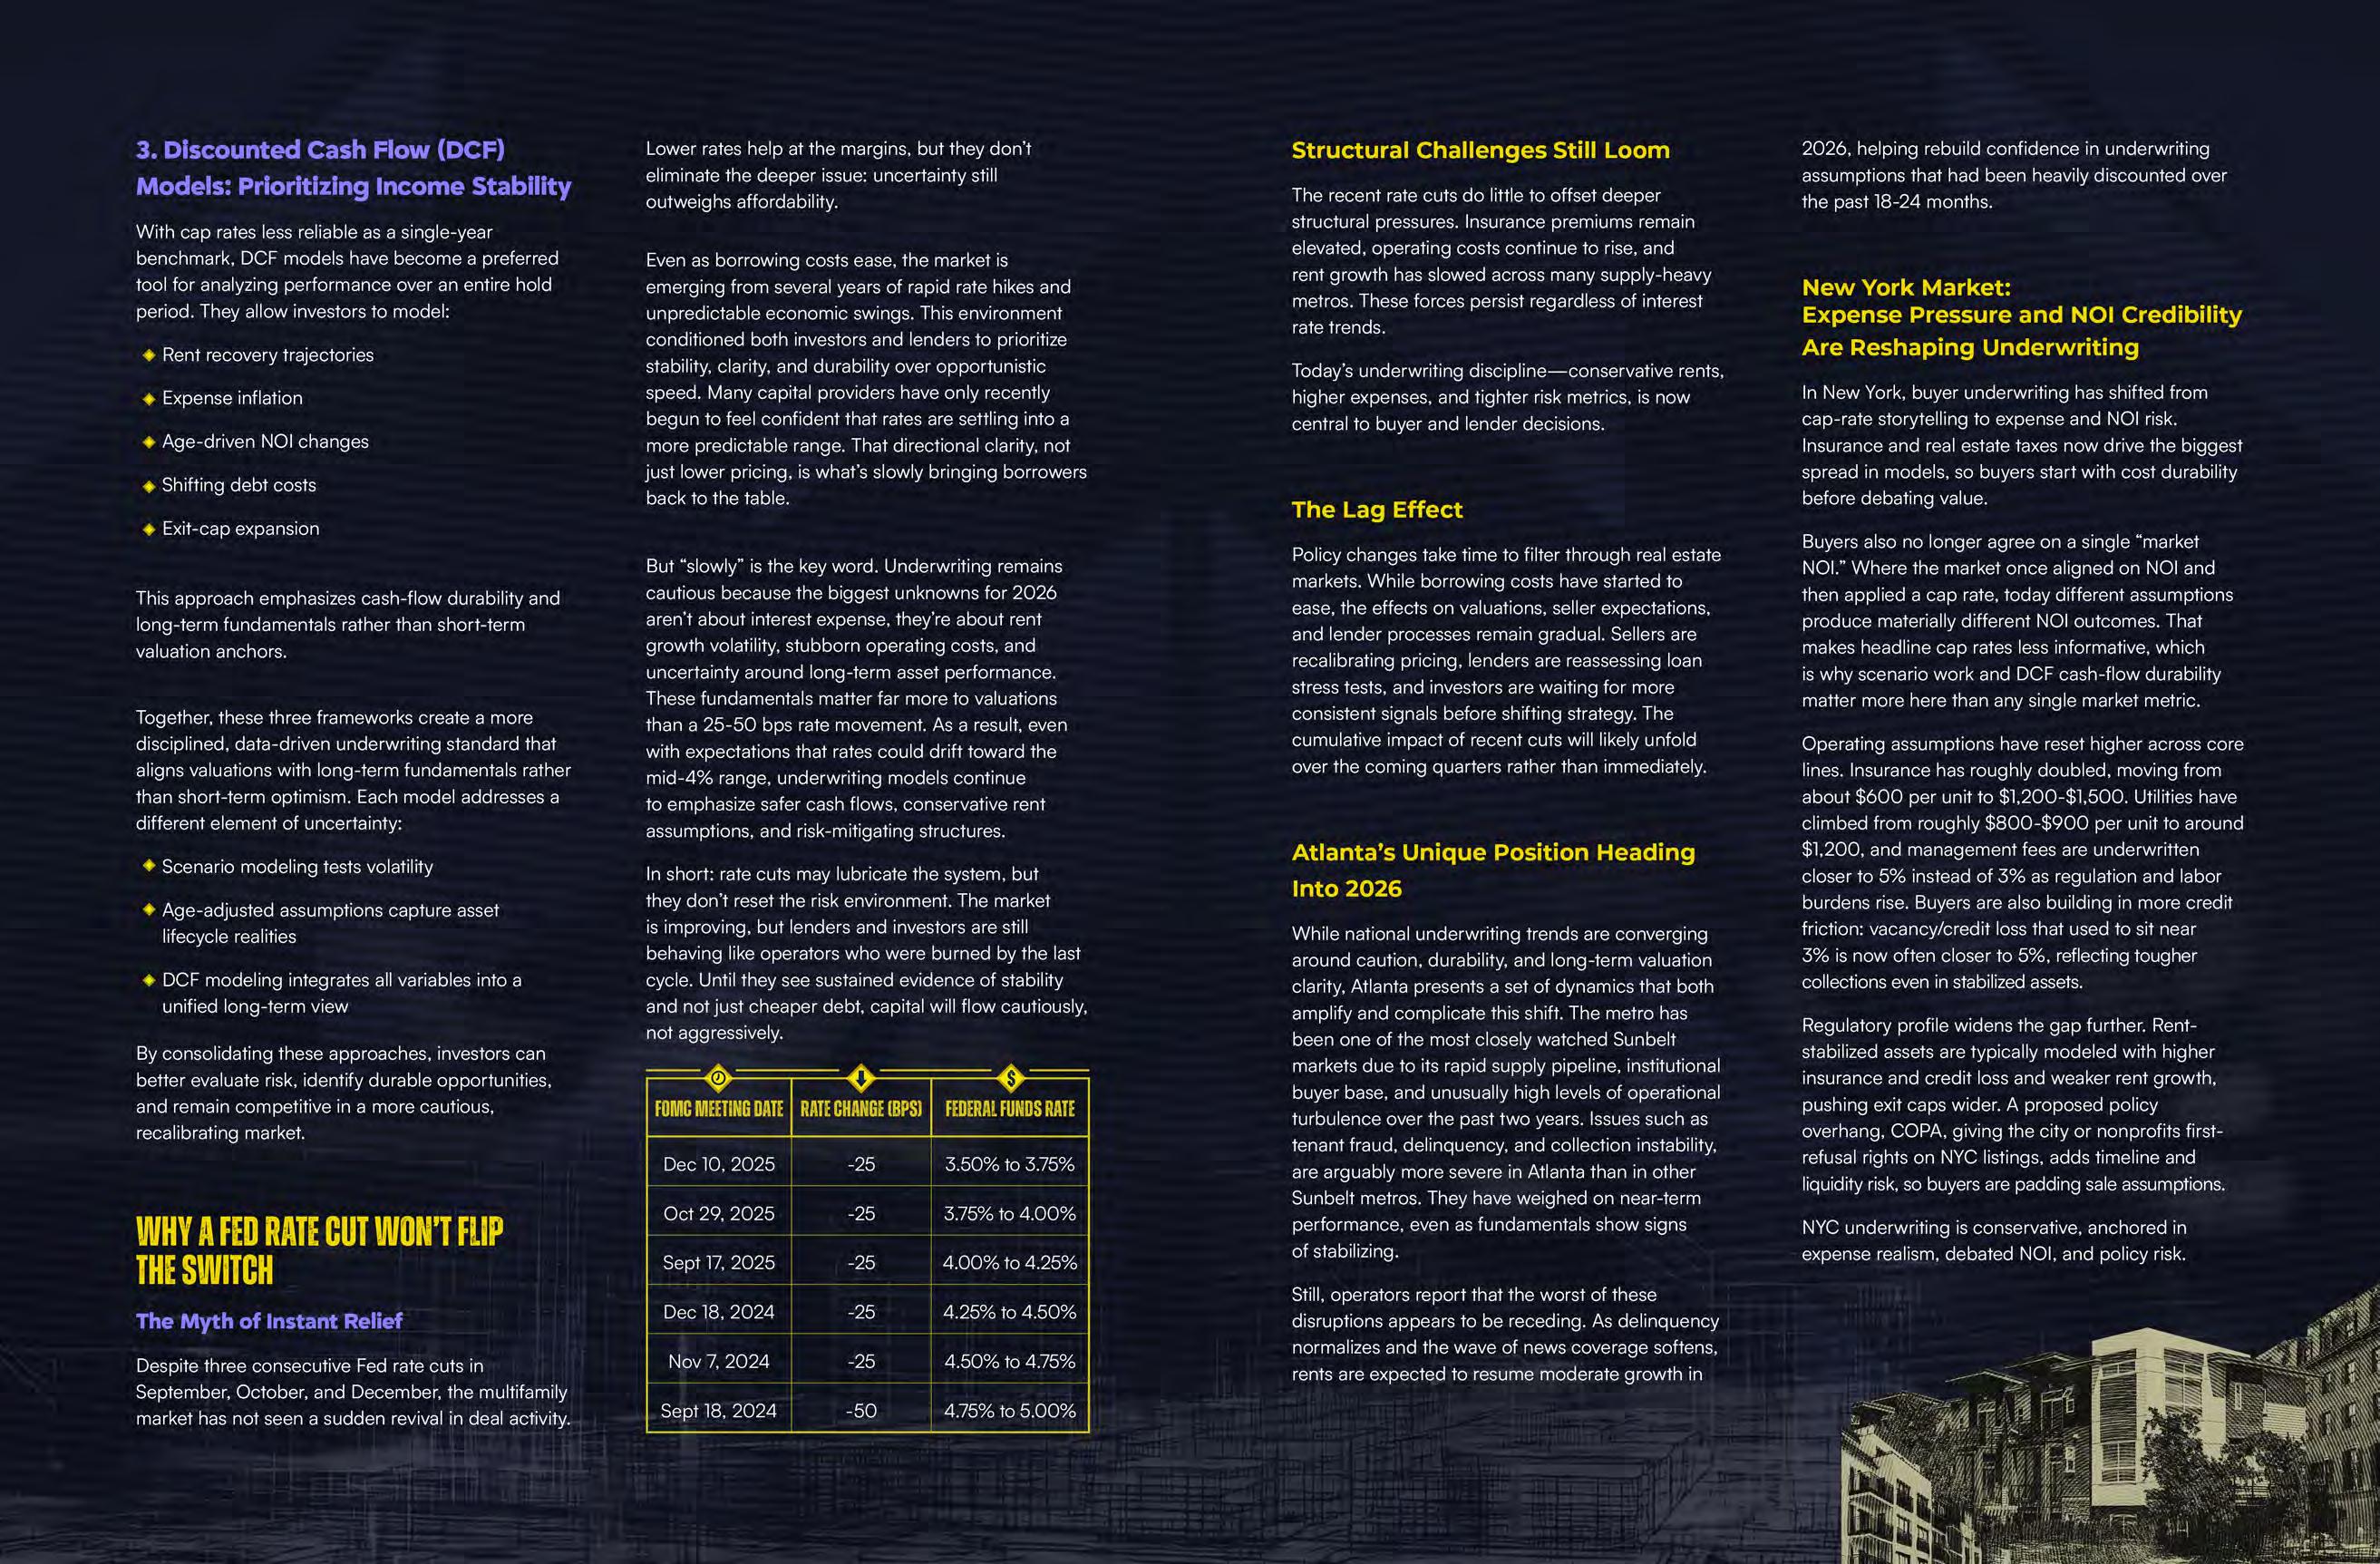


Despite a wave of store closures at the beginning of 2025, retail recorded an absorption comeback in the second half of the year. The median timeframe to lease fell to under seven months, a historic low, with high-quality locations leasing in less than five months. Leasing volume throughout 2025 was dominated by smaller-format and in-line spaces, followed by properties over 25,000 square feet.
This report highlights top tenants to watch through 2026. These tenants vary from small-format to largeformat properties, and have demonstrated the ability to grow despite economic headwinds and maintain stability in order to best serve consumers.
U.S. Retail Bounced Back in H2 2025
Source: CoStar Group, Inc. | 2020-Q4 2025 QTD


Grocers Aid Shopping Center Performance
Discount Chains Thrive on Consumer Demand
Daniel Gonzalez

7-Eleven’s New Look Will Rupli
The Expansion of Take 5 Oil Change
Dillon Mata


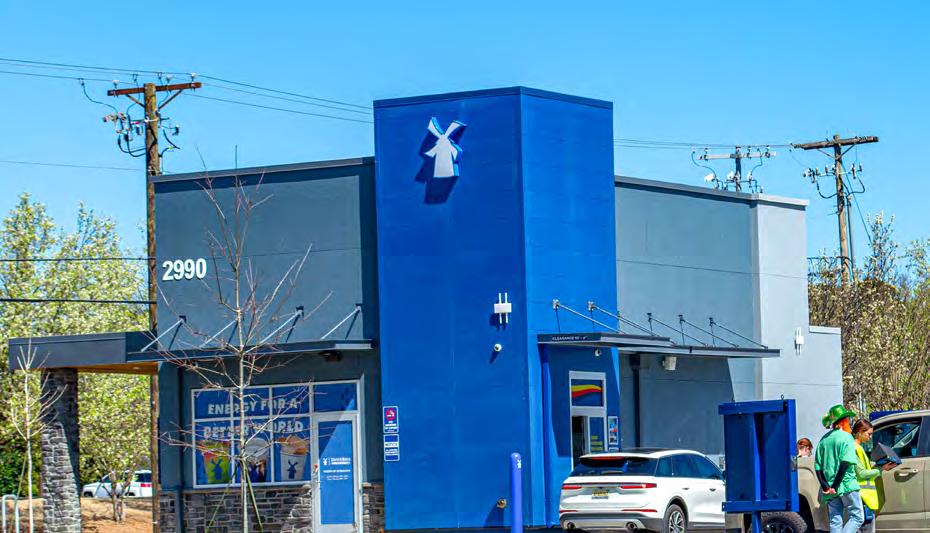

Originally from Oregon, Dutch Bros began operations in 1992. The popular coffee chain has since branched out to several states, including Florida, Georgia, Louisiana, South Carolina, Ohio, and Indiana. Now, Dutch Bros is growing in the Midwest and East Coast, expanding operations in Virginia, Missouri, and Illinois.
Since 2019, Dutch Bros visits are up nearly 300%, partly due to its smaller starting footprint. The brand benefits from a broader rise of grab-and-go dining and short visits, which dominates U.S. food service behavior. The small-format, drive-thru focused model also matches consumer preferences for speed and convenience. This format aligns the most with Gen Z, which drives the majority of visits at Dutch Bros locations.
Dutch Bros’ expansion goals include doubling its footprint by 2029, which would lead it to record 2,029 locations by that year—one of the most aggressive growth plans in the coffee sector. The chain also projects reaching $2.6 billion in revenue and $197.4 million in earnings by 2028. This plan would require 21.8% yearly revenue growth and a $140.2 million increase in earnings from the current $57.2 million. In order to achieve this momentum, Dutch Bros plans on growing its food offerings, focusing on mobile ordering, and launching consumer packaged goods to increase its appeal.
Dutch Bros Records 270% Growth in Monthly Visits From 2019-2025
Source: Placer.ai | January 2019-October 2025

Daniel Gonzalez daniel.gonzalez@matthews.com (305)


The popular fried chicken chain exceeded its goal of opening 100 stores in 2024 and opened 118 restaurants instead. Its topperforming locations have been Dallas-Fort Worth, Orlando, and Atlanta, with suburban strip centers and drive-thru sites recording the most traffic.
High visits per revenue contribute to aboveaverage restaurant profitability relative to many other fast casual and QSR concepts. Raising Cane’s recorded visits grew from about 189.5 million in 2019 to 490.3 million in 2024, almost double the foot traffic in five years. The chain also stands out from other competitors as a majority of locations are company-owned. When current leadership joined, about 25% of locations were franchised. Today, only about 3% are franchised, a rare structure in the QSR sector.
As Raising Cane’s grows, its long-term goals include having over 1,600 restaurants across the U.S. New additions will be focused on New Jersey, Connecticut, Delaware, Ohio, Florida, Washington, D.C., and New York. To meet its goals, Raising Cane’s is prioritizing building restaurants in high-traffic areas, as well as developing more drive-thru sites. Other moves include growing its presence in stadiums, airports, and near college campuses. One example is its addition in Seattle’s University District, which is slated to open in early 2026 and will also be one of the chain’s first locations in Washington.
Raising Cane’s Dominates Visits within National Chicken QSRs
Source: Placer.ai | YTD, January 2025 to November 2025


Since opening as a full-service Mediterranean restaurant in 2006, CAVA has become a QSR chain with 439 locations across 29 states. Its growth has been focused on adding sites in suburban markets, and increasing its drive-thru lanes and digital ordering to boost foot traffic. With this movement, CAVA is on track to reach its goal of at least 1,000 locations by 2032
CAVA acquired Zoës Kitchen in 2018 for $300 million to aid its growth plans. Conversions for the acquired locations began in 2020, and more than 250 sites were transformed. Other growth methods include the investment in AIassisted prep and kitchen display systems to improve guests’ experiences and increase visits. CAVA has also added new menu options to grow consumer appeal, like the addition of grilled steak and chicken shawarma.
With CAVA focusing its growth on suburban markets, its visitor demographics set the tenant up for success in its expansions. Since 2019, CAVA noted the median household income for its visitors decreased from around $120K to $95K in 2025. The decline demonstrates how the chain is increasingly targeting middle-income families in the suburbs. Additionally, CAVA’s focus on suburban areas has aided its operations to prioritize speed and convenience. The addition of drive-thrus in its suburban stores dropped its dwell time to 28 minutes in Q3 2025. This new dwell time is significant as it demonstrates CAVA’s ability to serve its customers that dine in, together with those that get their order to go.
CAVA’s Dwell Time Reflects Efficiency and Suburban Prioritization
Source: Placer.ai


While the U.S. houses more than 13,000 McDonald’s locations, the chain plans to open 900 new restaurants by 2027. Its new additions will be focused on suburban and exurban areas that record population growth. The chain first announced its strategy for growth in 2020, with its focus on the three D’s: digital, delivery, and drive-thru.
The digital growth method includes the implementation of the “MyMcDonald’s” mobile app. Customers will have the option to join a loyalty program and order food for pickup via MyMcDonald’s. The app will also aid the delivery segment of the chain’s growth plans as users can order food to their homes, and the company’s partnership with Uber Eats and DoorDash will create additional delivery options.
With about 95% of its U.S. locations featuring a drive-thru, McDonald’s has begun testing new ways to make the ordering process more convenient at these sites. Enhancements to its drive-thru restaurants include a pickup lane for online orders. As pickup orders are separate from the regular lane, these formats reduce confusion and shorten wait times. The commitment to upgrading the physical format increases the value of the real estate by improving site efficiency, transaction capacity, and overall revenue potential per location.

McDonald’s Annual Revenue Performance
Source: Stock Analysis


In order to achieve its long-term goal of opening 1,400 locations nationwide, Sprouts recently grew its headquarters in Phoenix to aid its expansion efforts and also began adding stores across the metro. Apart from growing in its home state, Sprouts is targeting the Midwest and Northeast for expansions. New additions in both regions will be added in 2026 and 2027.


As part of its expansion plan, Sprouts has focused on opening stores within 250 miles of a distribution center to create efficient supply chains. Locations near distribution centers lead to a quicker delivery, ensuring that the produce and goods are fresh for arrival at the store. In order to attract more customers, Sprouts is prioritizing new stores in areas with a high population density. The grocer also launched Sprouts Rewards in summer 2025—a loyalty program to maintain and expand its consumer base.
The long-term goal of opening 1,400 stores creates substantial demand for new retail space, driving up property values and securing long-term leases for landlords in high population density areas where Sprouts is prioritizing its sites. Its real estate strategy of clustering new stores within 250 miles of a distribution center makes these specific locations more desirable and valuable to developers and investors. This focus on supply chain efficiency minimizes operational risks for the tenant, ensuring the store remains consistently profitable, which translates to stable rental income and a high-quality anchor tenant that increases foot traffic and value for surrounding retail properties.


The discount grocer increasingly developed new locations across the country in recent years, due to its customer appeal for lowerpriced goods and its acquisition methods. Aldi’s major acquisitions occurred in 2023 when it bought Southeastern Grocers, which included Winn-Dixie and Harveys Supermarket stores. All of the acquired locations are expected to be fully transformed to the Aldi brand by 2027
Together with the acquired stores, Aldi plans on opening more than 800 locations nationally by 2028. Its primary areas for growth are the Southeast, Northeast, and West Coast. Aldi has begun remodeling and updating its existing stores to improve customers’ experiences and reach its expansion goal. Updates across the grocer include expanding the product assortment, with a significant increase in fresh food options to meet evolving consumer demand.
Between 2019 and 2024, while overall grocery foot traffic increased by 11%, Aldi’s surged by more than 51%, demonstrating rapid acceleration in consumer adoption. Through November 2025, its U.S. stores attracted 865 million visits, making it one of the most visited grocers nationally, despite only having around 2% of U.S. grocery market share. With doubledigit growth in foot traffic, Aldi is a powerful anchor for shopping centers. For investors, its long-term NNN leases and corporate-owned models offer a stable, low management, and reliable income stream.

Placer.ai | YTD, January 2025 to November 2025
Discount Chains Thrive on Consumer Demand


Consumers have increased their visits to Five Below for its variety of lower-priced products, including toys, apparel, snacks, accessories, and more. As visits have risen, Five Below has shifted its long-term goal to opening 3,500 stores by 2030. The retailer is focusing its efforts on entering new markets like the Pacific Northwest, with eight locations across Washington and one in Oregon.
To increase its product options, the retailer has implemented the “Five Beyond” concept across its stores. This method includes selling products priced between $5 and $10, including tech goods, clothing, and home decor. Five Below has also begun investing in building distribution centers across the country to aid its growth, with one of the newest facilities located in Buckeye, Arizona.
With the high cost of goods, Five Below is set to benefit from consumers searching for lowerpriced items. With customers attracted to Five Below for its value-driven and expansive product assortment, the tenant will continue to enhance the overall value and desirability of its respective shopping center.

Five Below Sets Bold Goal
3,500 stores by 2030
With more than 20,000 stores nationwide, Dollar General is one of the top-performing discount stores. About 20% of its total locations have been developed since 2020, with the chain adding around 900 stores each year. However, Dollar General decelerated growth in 2024, but rose again in 2025 with the addition of about 500 stores. Looking ahead, the chain plans on opening 575 stores in 2026
Part of Dollar General’s successful expansions can be attributed to its Project Elevate initiative. The movement involves remodeling around 2,250 existing locations to enhance merchandise and the store’s location, as well as fully remodeling about 2,000 sites. Dollar General has allocated over $1 billion in order to support its growth. Another new refinement method is same-day delivery. Dollar General is testing out this service across 75 locations and plans to expand it to thousands of its stores if results prove to be successful.
Expansions have resulted in significant rent increases. Across new stores, rents rose by 15.05% in 2024, due to the remodeling initiative, persistent inflation, and the price to build. Dollar General stores on the West Coast recorded the greatest jump in rents, with rent averages of $190,125 in 2025. However, new stores will boost investor appeal by including 15-year NNN leases with 5% escalations every five years


Remodeling of
2,250 stores outpaces Dollar Tree’s remodel of 2,000 locations

7-Eleven is transforming its locations to become more modern, increasing consumer appeal. The remodeled sites will feature a larger product assortment and expanded food and beverage options, including in-store restaurants and seating areas, with the goal of enhancing customers’ experiences and boosting sales.
With this movement in mind, 7-Eleven aims to open around 1,300 stores in North America by 2030, adding 200 locations per year. Another part of the goal will be the debut of 500 new food-focused stores opening between 2025 and 2027. These locations are dubbed “New Standard” stores, and will include features like increased fuel offerings and convenient digital payment methods for goods. New Standard stores will also feature a 7-Eleven branded QSR, like Laredo Taco, as well as freshly made grab-and-go offerings like breaded chicken salads and smoked turkey sandwiches, along with 7-Eleven’s famed egg sandwiches.
The newly-opened stores with this format have already proved their success. In August, Seven & i Holdings Co. President and CEO Stephen Dacus said these new locations were bringing in 45% higher sales per store than the retailer’s traditional stores. As the revamped format continues to attract more customers, 7-Eleven will vacate around 1,000 of its stores built before 2000 in order to prioritize the growth of New Standard locations.
An additional part of 7-Eleven’s growth plan is extending its reach to serve truck drivers across the country. Its first truck stops began operating in 2021, and current sites include over 392 Speedway locations and select 7-Eleven stores across 26 states, with plans to grow to over 500 locations. These properties will cater to logistics companies by offering fuel card programs like its Mastercard that will provide discounts for businesses to track fuel expenses, together with amenities for truck drivers.


Take 5 Oil Change has steadily risen in franchise ranking, climbing from No. 42 in 2022 to No. 27 in 2025 on Entrepreneur’s fastest-growing franchises list. The Louisiana-based firm has attracted consumers for its promise to fulfill a convenient drive-thru, five-minute oil change, which has led to more than 1,200 locations nationwide under its parent company, Driven Brands.


Take 5’s growth began with its purchase of Fast Track Oil Change Centers in 2019, acquiring 27 stores. Now, Driven Brands has stated its goal is to double the number of Take 5 locations by early 2029. A significant portion of recent additions are developed by franchisees who have signed agreements for hundreds of new stores.
Throughout 2025, several notable trends shaped the tenant’s performance and market positioning. Franchise brands reported a 2.3% decline in revenue, driven by a reduction in the weighted average royalty rate, while acquisition activity around Take 5 Oil Change sites remained strong. This activity was largely fueled by bonus depreciation, which continued to attract investors seeking accelerated first-year tax advantages. Pricing for these assets has held steady, with corporate-guaranteed leases trading around a 5.92% cap rate since early 2024 and franchisee-backed stores trading 30 to 35 basis points wider. Operationally, the tenant’s adjusted EBITDA margin fell by 85 basis points in Q3 2025 compared to the prior year, reflecting increased store-level expenses and the impact of ongoing growth initiatives.
For investors navigating the automotive net lease sector, Take 5 offers a rare mix of stability, scalability, and upside. In a market that rewards clarity and fundamentals, few brands are moving as fast as Take 5. Its growth and proven model speak for themselves, and with strong credit, solid residual value, and market liquidity, these assets continue to stand out as prime investment opportunities.


The performance of these 10 national retailers underscores the resilience and strategic growth defining the retail sector. Despite a challenging start to 2025, the market rebounded strongly, demonstrating that consumer demand remains robust for convenience, value, and experience. From the aggressive drive-thru and digital-focused expansion of QSR chains, to the targeted new market focus of grocers like Sprouts and Aldi, a clear pattern emerges: the tenants driving national growth are those prioritizing adaptability, efficiency, and customers’ experiences. For investors, developers, and landlords, monitoring the footprints of these companies will be essential to capitalizing on the sector’s continued upward trajectory.


2024–2025 in Context
The last two years tested self-storage more than any period since the Great Financial Crisis. Across 20242025, elevated borrowing costs and a persistent bid-ask gap cut transaction volume and pushed the sector into price discovery. Public REIT results show the reset clearly:
By Q3 2025, national same-store revenue and NOI fell year-over-year, while operating expenses stayed high, led by property taxes and property insurance.
Occupancy softened as move-ins slowed. Across 2025, REIT portfolios ran lower than the same quarters in 2024, but stabilized around 91%-92% on average each quarter. In oversupplied markets, operators leaned on discounting to maintain leasing velocity.
HIGH DELIVERY Regions Vs. STABILIZED Regions
High-Supply Markets Resetting vs. Disciplined Markets Stabilizing
The downturn has not hit all regions evenly. Markets that added the most supply during the pandemic expansion are now working through the toughest reset. Yardi Matrix data show several fast-growth metros expanded inventory by low-to-high teens over the last three years, including mid-single-digit growth in the last twelve months alone. Those highdelivery markets have posted some of the steepest rent declines; by mid-2025, several large metros were seeing street-rate drops in the 3%-4% range as new supply met slower demand growth.
Disciplined, need-based markets stabilized earlier, and the Midwest sits at the front of that group. National asking rates turned positive again in late 2025. October’s national street-rate index was about 0.7% above the prior year, and move-in rents exceeded move-out rents for the first time this cycle. With more limited new supply and steadier demand, the Midwest enters 2026 in a stronger relative position.


Supply remains the clearest differentiator, and the Midwest continues to exhibit structural discipline. Most major Midwest metros are running below national delivery averages. Columbus illustrates measured growth:
Deliveries equaled about 1.2% of inventory in 2024, and in 2025 roughly 62,580 square feet of new supply came online, while the market still sits near 4.5 square feet per capita.
supply-constrained relative to the national high-delivery cohort; new starts remain limited compared with metros that carried mid- to highsingle-digit shares of stock under construction at points this cycle.
Midwest markets are adding units, but they do so from a smaller per-capita footprint and at a slower pace than the country’s highest-growth development markets, many of which expanded inventory by ~10%-20% in short bursts. That contrast best demonstrates the region’s lower development risk.

Cleveland remains tight on a per-capita basis even after a delivery uptick, underscoring how small the absolute base is. Detroit has also stayed
September 2025 YOY Rent Change for Main Unit Sizes
Source: CoStar Group, Inc. | 2020-Sep 2025
Needs-Based Demand
Demand quality provides the second stabilizer. In the Midwest, storage usage relies less on cyclical migration patterns and more on persistent household needs:
Smaller living footprints, life-event churn, and steady small-business use.
Cleveland and Columbus already illustrate the point (apartments average 790 and 881 square feet, respectively). Other Midwest metros show the same “space-light” profile with Detroit averaging 728 square feet, while Chicago’s newer units rank among the smallest large-metro footprints at 797 square feet.
National comparisons sharpen the story. Many high-growth metros still deliver meaningfully larger apartments on average, often in the mid-900s square feet range, versus low-900s in the Midwest, even after downsizing trends in select cities.
Population trends add another layer of stability. Midwest household growth has stayed modest but steady (e.g., Cleveland +0.7% YoY, Columbus -0.7%).
That profile supports a reliable, less cyclical storage customer base through rate cycles, unlike markets where demand swings with migration volatility.
Smaller Midwest living spaces + stable household churn create a more durable demand stream than markets dependent on fast-cycle population surges.
Stabilization Signals
Operational performance across the Midwest looks more like normalization than contraction. National street rates bottomed in 2025 and have inched higher since; Yardi Matrix’s National Self-Storage Advertised Street Rate Index (the national average advertised asking rent per square foot) stood ~0.7% above October 2024. Core Midwest metros are even higher up, with Chicago rents up roughly 2.1% annually and Minneapolis around 2.9%.
Occupancy has remained healthy even as leasing softened nationally. REIT net move-ins minus move-outs fell to a five-year low in 2025, but pricing improved:
Move-in rents exceeded move-out rents for the first time this cycle, and the rent gap between new and existing customers narrowed to ~40% from ~60% a year earlier.
That shift signals returning pricing traction without requiring a meaningful occupancy trade-off.
Expense growth is cooling on a year-over-year basis. Same-store operating expenses are still rising, but the pace slowed in Q3 2024 versus Q3 2023, with ExtraSpace at +1.9% YoY, Public Storage at +2.6% YoY, and NSA at +1.2% YoY, even as taxes and repairs remain elevated. As inflation moderates and insurance stabilizes, operators are pushing efficiency through centralized call centers, automated leasing, dynamic pricing, and lean staffing.
Capital markets are thawing, and supply-disciplined Midwest metros are benefiting early. Community banks and credit unions have re-engaged with stabilized storage assets as underwriting visibility improves. Deal structures have adapted to bridge valuation gaps:
Seller financing, preferred equity, and assumable low-rate loans show up more often, alongside longer diligence windows and earn-out frameworks.
Liquidity is returning selectively, and capital is flowing first to markets where cash flow does not depend on aggressive rent assumptions.

Investor sentiment has shifted toward resilience. Buyers now prioritize assets that can hold cash flow through uncertainty instead of chasing peak-growth submarkets. Infill Midwest locations fit that profile because supply pressure stays modest and demand remains durable. Moderate rent rebounds in Chicago and Minneapolis reinforce that these metros can outperform national averages without the volatility tied to oversupply cycles.
Portfolio strategy also drives allocation. Many institutional groups built heavy exposure to high-delivery markets during the pandemic run-up, so Midwest acquisitions now hedge development risk elsewhere. Private investors, typically more flexible on deal size and comfortable underwriting in higher-rate environments, often re-enter first and set the tone for broader capital redeployment.
After a turbulent cycle, the Midwest appears positioned to lead the early phase of self-storage recovery. Moderate pipelines, density-supported demand, and structurally tight inventory insulate these metros from the oversupply dynamics still weighing on the nation’s highest-delivery markets. With street rates positive year over year, move-in pricing improving, and expense growth decelerating, the 2026 setup favors investors who pivot toward constrained infill Midwest assets where returns depend on disciplined execution, not rent spikes.
Russell Handelman
russ.handelman@matthews.com (872) 260-5752


The unanchored strip center sector has entered a new era! One that is not only defined by early adopters or contrarian thinkers, but by institutional validation, operational sophistication, and sustained performance across nearly every major U.S. market. What began years ago as a fragmented category dominated by private owners has now become a distinct property type with its own ecosystem of REITs, fund managers, operators, and capital partners.
To explore this next chapter, Matthews™ hosted its second annual strip center roundtable, moderated by Jeff Enck, Senior Vice President of Shopping Centers at Matthews™. Joined by Kyle Stonis, Pierce Mayson, and Boris Shilkrot, Enck convened 13 of the largest owners and operators to carry on discussions from where last year’s event left off.
In 2024, the industry debated whether unanchored strip centers truly warranted the attention they received. In 2025, the niche has continued to mature and interest in the unanchored strip center space has only grown. Institutions are deploying capital, operators are expanding footprints, and retail tenants in unanchored strips are performing well despite an environment still shaped by shifting consumer behaviors and challenges with capital markets.
The discussion opened with a familiar question: Is the thesis behind unanchored retail still holding? Can a shopping center without an anchor remain competitive? The confidence was unmistakable.
John Cattonar of Curbline, now the first publicly traded REIT dedicated exclusively to unanchored strip center retail, offered the clearest affirmation.
“We wanted to create a pure-play REIT that had first-mover advantage,” he said, recalling Curbline’s October 2024 debut. “In the last twelve months, we’ve bought almost a hundred shopping centers for just under $900 million. We’re operating these centers for less than 10% over NOI each year (compared to 20%-25% for power centers), we have less than 1x debt-to-EBITDA, and we have $800 million of liquidity. So when you ask if the thesis has been validated–yes, at least at Curbline.”
Cattonar’s remarks set the tone for the panel: what was once an emerging thesis has now become an established one—validated by performance, capital markets, and now the public market. Several operators noted that tenant demand, occupancy, and leasing velocity have reached levels that would have been unthinkable during the “retail apocalypse” era of a few years ago.
Kristen Neyland from Crow Holdings echoed this sentiment, pointing to their recent recapitalization.
“We completed a major recapitalization of our portfolio—almost 200 assets totaling 4.5 million
square feet. Our NOI is growing, leasing and operating metrics are strong, and we drew interest from global investors. It absolutely reinforces what we’ve been building for ten years and speaks to the power of scale and investor interest in this product type.”
This asset class is legitimate, scalable, and overall is an institutional-worthy strategy. “These deals, Curbline going public and Crow’s recap in ‘23, have helped provide that institutional attention [to the space],” said Dusty Batsell of Baceline Group. “This has brought a lot of validation, but we still feel like there’s a lot more opportunity moving forward.”
Others pointed to operational complexity as the driver of long-term advantage. “The reason we started buying strips at the time was the price point, it was below what a REIT would buy but above what a wealthy investor would buy,” said Derek Waltchack of Shannon Waltchack. They developed a core competency of managing these centers, and learned early on that managing strips is not for the faint of heart. “You’ve got credit tenants, but you also have mom-and-pops. You have to build a management competency. And now, as institutions step in, they’re learning what we learned twenty years ago.”


“SO WHEN YOU ASK IF THE THESIS HAS BEEN VALIDATED–YES.”

The next question turned to capital raising: has the broader embrace of essential-service strip centers made fundraising easier? For many, the difference was dramatic.
“Yes,” said CenterSquare’s Robert Holuba. “When we started ten years ago, had I known how hard it was going to be to raise capital for retail, I probably would’ve never embarked upon the journey. But Today, I had breakfast with some multifamily developers who told me how difficult their fundraising environment is with performance challenges and fundamentals. Meanwhile, we’re out raising programmatic joint ventures with public pension funds.”
Holuba described the firm’s trajectory in three places. Early on, in 2016 and 2017, it was like a hypothesis… capitalizing on the negative sentiment of retail. 2.0 was coming out of COVID, it became an aggregation strategy with smaller dollar amount Now phase 3.0, it’s a bigger more prestigious iteration of buying with institutional capital.
It’s evident that this shift didn’t happen by accident. It happened because performance forced recognition. And, one of the most unconventional fundraising stories comes from Don Tepman, also known as “The Strip Mall Guy.” His social media presence has evolved into a surprisingly potent capital channel.
“Our average check size from a social media lead is north of half a million dollars,” he said. “That’s an investor who is sophisticated…But they have built familiarity with me, just by following me day-to-day [on social media]. It definitely opens up doors that otherwise wouldn’t be open.” However, he points out that social media doesn’t replace track record. It only complements it. “What keeps me up at night is not fundraising, it’s finding that next deal.”
Other panelists go on to explain that today, the fundraising pitch has changed, you don’t need to convince people to invest in the asset class anymore (which used to be 80% of the pitch).
“THERE ARE NEW INVESTOR TYPES THAT WE’RE SEEING, BUT THE ABILITY TO SHOW WHAT WE HAVE PRODUCED AND HOW ASSETS ARE PERFORMING GOES A LONG WAY [SPEAKING LOUDER THAN ANY PITCH],” SAID ANTHONY FANIZIO FROM LAST MILE.
The conversation then expanded to discuss how investor profiles have changed. Some groups are now fielding interest from institutional LPs who see strip centers as a stable, incomefocused counterweight to more volatile asset classes. Others find that demonstrating strong performance in earlier funds has unlocked access to larger and more diverse capital pools.
For some, such as Bond Street REIT and KM Realty, capital raising is increasingly tied to innovative structures such as the 721 UPREIT. These allow private owners to contribute assets into a REIT vehicle in exchange for operating partnership units. This is a powerful strategy in a fragmented sector full of long-time owners who want tax deferral but also want to stop operating their own centers.
“Our growth has been through the high net worth individuals, we’ve rejected institutional equity so far,” said Randy Keith of KM Realty.
“An UPREIT is a great exit strategy for individuals who own 1 to 20 shopping centers, whereby they can defer taxes and exchange into a REIT.” He explains that they aren’t easy, but they solve a real problem for private owners. If they want to grow the right way, UPREITs will become a major part of that strategy.
The debt markets played a significant role in the conversation, particularly as interest rates have begun to soften. After two years of elevated borrowing costs and limited lender appetite, many panelists said they were pleasantly surprised by recent debt executions.
“Banks have really stepped up in a number of ways on everything from spreads, structure and flexibility,” said John F. Morgan, Jr of SouthCoast Centers. With bank debt you can operate with more agility and right now they’re competing. Randy Keith added that they have started dealing more with banks, which has helped with spreads, but there’s certainly more competition than the more regional banks.
North Pond Partners’ Taylor Brown, noted that rates have influenced underwriting but have not fundamentally altered their acquisition philosophy. “Our vehicle’s an open-ended fund, so we’re not focused on IRR the way some are,” he said. “But yes, we’re modeling lower interest rates”
The group was divided on what falling rates might mean for inventory. Some expect more selling from private owners who no longer feel trapped by ultralow existing debt. Others believe that vacancy, not rates, is the real catalyst.
“I think vacancy drives volume more than the rate story,” Don Tepman said. “When a mom-and-pop owner has a sudden vacancy, fear sets in. They don’t know how to backfill and that’s when they sell.”
Several panelists predicted an uptick in modest vacancy as certain consumer categories soften–particularly lower-income households facing inflation pressure. “We’re already seeing some
tenants close earlier than expected,” said one participant. “We’ve had a few businesses shut in mid-term because their economics just shifted. So yes, vacancy may creep up. But for strong operators, that’s an opportunity.”
Enck asked the panel: is the lack of product the number one challenge in the space today?
Strip Center Roundtable-PRINT_singlepage
Bond Street REIT’s Luke Fox, “For us, yes lack of product has been a challenge, but we’re still finding opportunity in the market.” He also notes that private owners who have held properties for decades who are still on the fence about selling, that educating them on pricing and process can be slow. “There’s product out there but it’s figuring out where there’s inherent value from what is being spun out.”
Some argued that compressed cap rates and strong fundamentals still entice sellers—just not in significant volume. Others believe that as rates normalize and certain centers experience modest vacancy, the logjam may break. But the group agreed that product scarcity underscores a larger reality: operators must be proactive, patient, and prepared to execute quickly. As Cattonar referenced, they’ve built a team at Curbline that can gather data and make decisions in a few hours because that’s what competing for product requires today.


THE SECTOR IS NO LONGER SEEKING RECOGNITION— IT’S SHAPING ITS OWN FUTURE.
“VACANCY DRIVES TRANSACTION VOLUME MORE THAN THE RATE STORY.”

“OPERATIONAL INTENSITY IS THE REAL COMPETITIVE ADVANTAGE.”
OPERATIONS DRIVE OUR GEOGRAPHY MORE THAN MACRO TRENDS.”

“HIGH-QUALITY STRIP ASSETS ARE NEARLY IMPOSSIBLE TO REPLACE.”

One of the strongest themes emerging from the conversation was leasing. Nearly every operator reported exceptional occupancy levels and strong spreads.
“We’re at 97% occupancy,” Cattonar said. “Our renewals have been 20% on a straight line basis, and new leases have been a 40% spread.” This doesn’t happen unless demand is deep and broad. Neyland shared similar results. “Right now we are at 94%-95% leased, and just this year we have already renewed 85% of our tenants. This tells us that there’s very strong demand and not a lot of available space. And that’s naturally going to put upward pressure on rents.”
Yet, panelists emphasized that not all categories are equal. Boutique fitness, though popular, often hits a ceiling due to class-size constraints. Certain emerging fast-casual concepts, especially those backed by private equity, may expand too quickly and collapse under their own weight. “When you see the same bowl concepts and chicken concepts chasing ‘best space at highest rent,’ you worry,” said one panelist. “Some will survive. Many won’t.”
Danizio added that sustainability depends on understanding each tenant’s economics. “Can a tenant really go from $25 per square foot to $35 per square foot? For some uses, absolutely. For others, it’s just not viable.” The mark-to-market opportunity remains compelling, but only for operators willing to study each tenant individually, not rely on market averages.
Adam Greenbaum from AGW Partners shares that a majority of the properties they’ve bought have been from owners who have owned the property for 10 to 20 years, sometimes as high as 50 years. “It’s interesting to study what these longstanding owners think about their tenants. We’ve noticed that with the non-credit tenants, rents tend to be very low, remaining term short, and the landlord participates in no inducement costs.” Especially in markets like New York, rents can be upwards of five to ten times higher, but evictions take 18 to 24 months. He said that “having deep, meaningful relationships with
tenants and staying connected throughout the lease term, helps with making the centers have more overall activity.”
Enck transitioned the discussion to outparcel strips, which often command the highest rents in the market. But are these rents sustainable?
Holuba described a recent portfolio of two-tenant outparcels with Starbucks endcaps—an anomaly rather than a strategic direction. “These assets usually trade to 1031 buyers at low cap rates,” he said. “It’s hard to compete for them consistently.”
Riverwood’s founder, Ron Chanin, spoke from a developer’s perspective. “Currently it’s extremely difficult to develop,” he said. Land costs, construction costs, capital markets are all pushing rents to levels that may not be sustainable long term. “The last major development we completed would not pencil today.”
Others argued that the economics of drive-thrus and mobile ordering have changed the calculus. “Cava, Chipotle, Starbucks, they’re doing volumes now that would have been unheard of ten years ago,” one panelist noted. “Underwriting must evolve.”
Still there was broad agreement that retail located “on the road” that’s visible, accessible, and convenient, performs better than shadow-anchored space set back behind a large box.
“Conventional wisdom was that the value of your shops, wherever it was in the shopping center, was based on the performance of the anchor behind it. And what we did during COVID was analyze cell phone data,” said John Cattonar. “What we learned was that less than 10% of traffic to an outparcel tenant goes into the anchor behind it.”
The other thing he pointed out was that retention has been very high, even where maybe they thought internally the rents were a little higher than what the market was when the tenant came to take an option or renewal.


The panel turned to geography. Tepman shared the most flexible view. “I look at where there are good deals. It’s not about the market, it’s about deals.” He made the point that if the fundamentals are there, he’s interested, whether it’s Indiana or California.
Batsell took a different approach.”I would say we are pretty specific in terms of our geography, but it has a lot to do with operations.” Baceline Group looks more for Solid B centers, which require a lot of hands-on management. “We reorganized our operations to make sure that we are within a two- to three-hour drive of every property with boots on the ground so that we could provide a hands-on touch.”

Stonis noted that many institutions initially believed they could build in-house operating capacity, but the reality has tempered their ambitions. “We’ve met with the biggest institutional groups over the last couple of years,” he said. “They would come in saying, ‘We want to buy unanchored strips and manage them ourselves.’ But fast forward twelve months—and that program isn’t going to work for them. So now we’re seeing LP capital sneaking in. They’re partnering with the operators who’ve already figured it out.”
Shannon Waltchack continues expanding methodically into new regions, while AGW Partners has pursued a strategy shaped by tenant relationships, especially in markets like Atlanta where they see meaningful value-add potential.
Riverwood, with decades of experience, remains highly selective and development-minded. “We’ve had many offers to buy portions of our portfolio,” said Chanin, “but replacing these assets with something of equal quality is almost impossible.”
The group agreed that strip centers demand a level of operational intensity. Matthews’ own Kyle Stonis added a dose of realism about the growing institutional interest in unanchored strip centers. “There are a lot of groups trying to get into the space,” he said. “But as Ron and others have pointed out, the operations of an unanchored strip are massive. The amount of management, leasing, and capital you have to deploy is tough for institutional groups to execute right now.”
Crow Holdings maintained a lean but deep in-house bench and outsources property management and leasing to local partners. “It’s important to us to have dedicated local boots on the group expertise,” said Neylan. “With 2,000 tenants, you need partners who understand every nuance of the submarket.”
Southcoast Centers has brought nearly operations in-house, outside of leasing. “It has a lot of benefits to be able to control the whole process and have standards and our systems communicate,” said Morgan. “You either have to outsource it and be committed to that, or be committed to doing it yourselves.”
Others discussed the limits of traditional leasing models. For small-bay space, commissions are often too small to justify proactive outreach from third-party brokers. The group unanimously agreed: operational intensity creates competitive advantage. Scale only works when operations do. Others emphasized that scaling is about processes, not just people. Without systems, data, discipline, and repeatability, growth becomes dangerous rather than profitable.
Luke Fox of Bond Street highlights the importance of staying ready. “Opportunities appear quickly,” he said. “We prioritize the fundamentals of our thesis and remain prepared to act. That’s how you scale in an environment where product is scarce.”
The final business-oriented discussion addressed disposition strategies. CenterSquare plans to sell select assets annually. “Real estate needs to return capital to investors,” Holuba said. “Commercial real estate has seen a tremendous slowdown on return of capital back to investors, and it’s caused problems. Selling even five to ten assets a year helps maintain liquidity and keeps our platforms healthy.”
Others like Riverwood, see little reason to sell when high-quality assets are irreplaceable. “The problem is you’re going to exchange out and end up with assets that are not nearly as good as what you’re selling.”
This divergence reflects the broader variety of strategies in the room–income-focused, value-add, open-ended core-plus, REITstyle aggregation, and long-term hold.
The conversation closed with predictions.
Cattonar offered an unequivocal view. “At the asset level not much changes. As long as you buy great real estate that has leasable units, it will continue to perform.” But he noted that institutional ownership will increase dramatically.


The headlines this room has created have shined a spotlight on this sector. Institutions that once ignored strip centers are now being asked, ‘what’s your strategy to get into unanchored retail?’ that demand will reshape valuations.
Others pointed to the resilience of tenant demand. As one panelist noted, “in the sectors we all operate in (Salons, medical, QSR, daily needs...) there’s always a new entrepreneur ready to take space. That’s the beauty of this business.”
Some warned of risks, including oversaturation of certain categories, private-equity-driven expansion of unproven brands, and potential macroeconomic pressures on lowerincome consumers. But the overall sentiment was clear: the long-term outlook remains strong.
The panel briefly touched on artificial intelligence. Some operators have begun using AI for property management tasks, data analysis, or marketing–but with caution.
This year’s roundtable revealed an industry that has grown more confident, more sophisticated, and more institutional in its approach. The sector is no longer fighting for recognition; it is shaping its own landscape. Unanchored strip centers have proven themselves as durable, efficient, high-performing assets with a long runway of opportunity ahead.
As capital flows deepen, operations become more advanced, and platforms refine their growth strategies, the next era of the strip center market will be defined not by contrarian bets, but by professional excellence, disciplined execution, and an increasingly institutional backbone.
If 2024 was about validating the thesis, 2025 is about setting the course. And based on the insights from this year’s panelists, the trajectory is decidedly upward.
jeff.enck@matthews.com