
DEVELOPMENT OF HIGH STIFFNESS POLYPROPYLENE FOAM AS AN ALTERNATIVE TO POLYETHYLENE FOAM GRADES
Aldo Quaratino, Matrix Polymers, Jake A. Kelly-Walley, Matrix Polymers.
Abstract
The development of a high stiffness Polypropylene (PP) foam for use within the rotational moulding industry has been investigated by Matrix Polymers. The scope is to offer a stiffer and more advanced alternative to the current Polyethylene (PE) foams which are on the market. Matrix Polymers want to push the boundaries of current products and combine new technologies to produce a new material. DifferingcompositionsofCBA(chemicalblowingagents), various dry blends and compounds have been tried alongside experiments into the CBA reaction time and expansion ratios. The availability of K-kord temperature logging equipment, developed by 493K for in-tool temperature analysis, has been utilized alongside JUST RITE temperature labels, static oven machines and a rotational Ferry machine to develop the new material. All of the above has improved our understanding into the astonishing potential of this new material. Offering this product to the rotational moulding industry would be greatly beneficial to rotational moulders from around the world in a variety of applications, we understand the limits of rotational moulding as the lack of suitable polymers. This is something that Matrix continues to challenge.
Introduction
The scope of this project is to replace PE (polyethylene) foams with stiffer and better performance PP (polypropylene) foam grades. Current PE foam grades are used throughout a wide range of industries whether that be commercial, recreational or private. As a result of the success and appeal of the PE foams there are a vast array of uses. Some of these uses include, engineering storage tanks and racing boat hulls to experimental and innovative design products. The introduction of a PP foam to the rotational market could unlock potential properties and desired material performance that significantly improve a products performance.
Currently within roto-moulding/rotational moulding, the market is dominated by PE. This greatly restricts the moulder and the designer as to what they can achieve from their products. Regarding the foam sector of Roto-molding this is even more heavily dominated by PE. In order to unlock the full potential of the partnership between polymer foams and rotational moulding, research into other foaming materials compared to PE must be undertaken. Despite this, polymer engineers are governed heavily by
the temperatures regarding the reaction of chemical blowing agents whilst also considering polymer melt temperatures. The common difficultly is that the activation temperature of the reaction is usually low enough that the reaction could occur during the extrusion process. As a result, blowing in the barrel of the extruder can occur, meaning the polymer is degraded and the extruder left damaged.
Typically, with respect to polymer foams there are two major components, the polymer and the chemical blowing agents (CBA). The CBA reacts at a specific temperature to produce gases, this causes blowing of the polymer or expansion. The CBA is compounded into the polymer. Once pelletized or ground into powder form, the powder can then be rotationally moulded. During processing, the polymer will become molten - gradually coating the internal surface of the mould upon rotation Sequentially, the CBA reaction will then occur - the gases will form bubbles/voids bynucleating the polymer, inturn increasing the thickness and decreasing the density. The nucleated polymer will then enter the cooling cycle where the material will crystallize and a foamed structure produced.
Variables affecting the cell structure (the appearance and the uniformity of the air cavities) and cell size are believed tobethe following;compoundingordryblending, PIAT (peak internal air temperature), CBA composition, cooking time, duration at reaction temperature and viscosity/rheology of the polymer. The variables affect the level of foamingand how the polymer foams therefore they have animmediate effect on the expansionratio (expansion calculated from densities) and the void fraction (the percentage of the polymer filled with voids).
The gases responsible for the expansion from the CBA are typically CO2 and N2. Both endothermic and exothermic reactions can take place when decomposition of the CBA occurs. The active components within the CBA can range from Azodicarbonamide to Citric Acid and Sodium Bicarbonate [2], however this information is often not given to the customer by the additive supplier.
This workaimstoexperimentwiththecreationofanew PP foam, using different techniques to assess the expansion with formulations that are available to the polymer engineer. This problem is being tackled from an industrial point of view with specific applications and uses in mind.
Materials
Throughout this work a variety of materials have been used to try and find a product that would be beneficial to the market. The materials have been used in various combinations, whether that be in dryblends or compounds (Table 1) List of Materials used throughout work.
Material Description
Foam A Existing Polyethylene Foam
PP A Standard PP
PP B Standard PP
PP C New PP
CBA A Chemical Blowing Agent (EXO)
CBA B Chemical Blowing agent (ENDO)
An existing PE foam grade which is used and trusted within the roto-industry was used alongside the PP grades (A, B and C) invarious dryblends. The PP densities around 0.905 g/cm3 and melt temperatures between 159-165°C. The MFI of PP grade A, B and C are 25, 15 and 2.5 g/10minsrespectively.ThePEfoamis acompounded foam containing CBA (A) which has a reaction temperature of 170°C. On the other hand, CBA (B) has a reaction range between185-220°C, whichis more suitableforthe use with PP due to the higher reaction temperature. The majority of the work completed involves PP (C) and CBA (A) after the preliminary investigation. The DSC from the PP (C) is shown below in Figure 1.
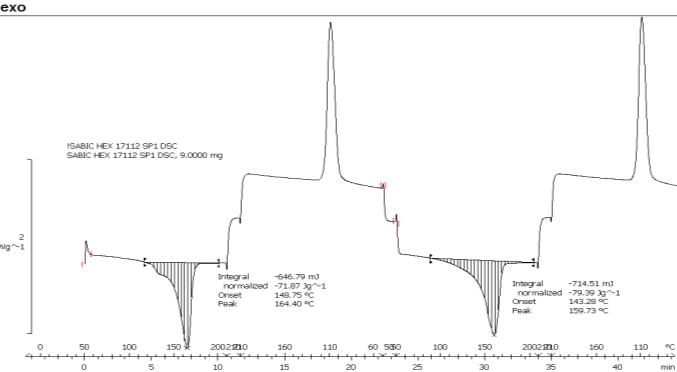
(Figure1)DSCresultforPP(C)the mosttested polymer throughout this work.
In addition to the DSC of the material that is new to Matrix Polymers, the zero-shear viscosity assessment of all three PP grades can be seen below in Figure 2, a more visual representationthat canbe coupled withthe MFI. The frequency sweep displays the result from the Matrix inhouse Rheometer. As expected, the PP(C) has the highest viscosity followed by (B) and (A). This was interpreted from the viscosity plotted against the angular frequency at 190°C.
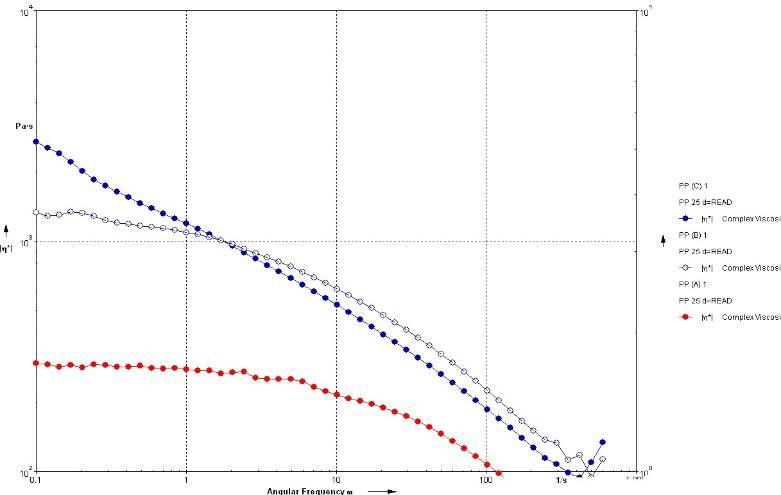
(Figure 2) ZSV Viscosity results from PP materials used.
Initial Experimental Methods
Initially, the PP (A, B and C) was dry blended with PE Foam (A), this was on a 50/50%wt basis. The foam was moulded on top of a super-linear layer. The samples were moulded in a standard Matrix Polymers hex bin, at a shot weight of 600g super-linear and 700g of the relative foam.
(Figure 3) Temperature profile of rotational moulding for PP (A) and Foam (A) dry blend.
The PP (B) and Foam (A) dry blend was noticeably similar in the results of the moulding and the temperature profile produced. The PE Foam (A) was then moulded to compare the expansion visually. The result from the Foam (A) were different to the dry blends, the expansion was far superior.Duetothis workbeingapreliminaryinvestigation the expansion wasn’t quantified but examined visually. This was to understand what the standard ofthe PE was and to what level the PP foam needs to perform. The images of the 3 different nucleated polymers can be seen below. During the rotational moulding process on each occasion a PIAT (peak internal air temperature) of 205-212°C was reached after the foam shot had been added. This was determined with the K-kord software.
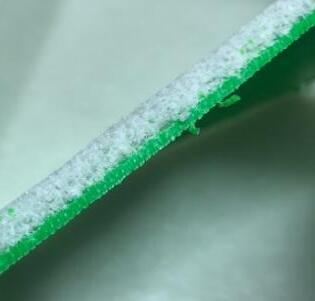
(Figure 4) PP(A) and Foam (A) blended on a 50/50wt%.
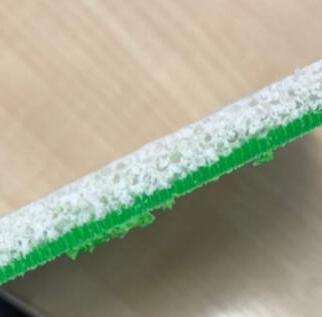
(Figure 5) PP (B) and Foam (A) blended on 50/50wt%.
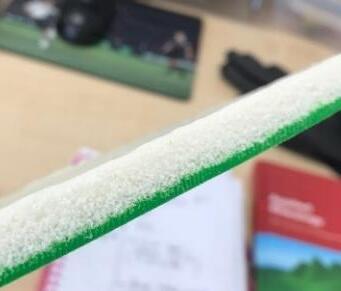
(Figure 6) Foam (A) 100wt%.
From Figures 3 and 4 the cell structure is much more open and has a lesser degree of densification than that achieved byFoam(A) in Figure 5. The desired result is that of Foam (A) in Figure 5, but achieved with a PP base polymer. The dry blends shown in Figures 3-4 were not successful as a result of the dry blending with PP. It was clear that the mixtures of the PP and PE had limited adhesion to the super-linear surface. Once small flexural stress was applied the PP dry blends could be delaminated from the super-linear layer. The new PP(C) was also dry blended at the same composition with the Foam (A). The PP (C) is believed to have been designed for applications with CBAs. Please note that the PP (C) was in pellet form rather than powder, therefore the dry blend was a powder and pellet blend. The results were slightlybetter than PP (A and B) dry blends with denser foaming as can be seen in Figure 6. There was still delamination but not as severe as the other PP dry blends.

(Figure 7) PP (C) dry blended with Foam (A) 50/50wt%.
Dry blends, as can be seen from the trials are not suitable for intended applications therefore conclusion was drawn that dry blends were not successful enough to consider a solution for the PP Foam Separation was experienced in the foam layer, presenting a heterogeneous layer of PP and PE separation. The PP blends did produce a stiff foam layer and as a result compounding. The most promisingPP grade which is PP (C) was selected to be used in further compounding investigations.
Main Experimental Methods
This stage was reached as a result of the preliminary research and investigation which was completed. The description was that a compounded PP foam was the most appropriate method to achieve the foaming structure that was required. Similar analysis suggests that compounding PP foams is the only successful procedure [2].
At the Matrix Technical Centre, UK the compounding was carried out and this was undertaken on a twin-screw lab extruder. PP(C) was compounded with CBA (B). The composition can be seen in Table 2.
(Table 2) Composition of the compounded PP foam.
Components
PP (C)
CBA (B) – low composition
Additional Additives
Antioxidants
Oil
Zinc Stearate
Since the data published for CBA (B) reaction temperature ranges between 185-220°C it was important that the extruder didn’t reach these temperatures otherwise the CBA would decompose and release the blowing gases into the extrusion process. This could damage the extruder and the polymer would be unsuitable for moulding due to being pre-blown. Below in Table 3 are the conditions from the first experimental extrusion run. Considering the reaction temperature of 185-220°C the first temperature used was167°C whichisthe melttemperatureofthePP(C). The change in temperatures and observations can be seen below.
(Table 3) Experimental extrusion conditions and observations.
167°C 300 rpm 25 rpm
160°C 300 rpm 25 rpm
CBA blown, strands snapping in bath.
CBA blown, strands snapping in bath.
150°C 500 rpm 25 rpm CBA slightly blown, strands snapping when attempting to tag on to pelletizer
150°C 500 rpm 20 rpm CBA improvement on blowing, more ease when trying to attach to the pelletizer
In the process of finding the optimum compounding conditions, problems with the pre-blowing (decompositions of the CBA whilst in the barrel of the extruder) were experienced. The first attempt at 167°C showed that the polymer was already nucleated and blown upon inspection this improved fractionally with the decreased temperature. The optimum was reached at 150°C and the screw speeds which can be seen in Table 3. Despite achieving the most appropriate conditions only around 50g of the sample was obtained. Therefore the compounding was repeated at these conditions. The polymer was pulled through by hand within the second extrusion and then pelletized thereafter. This was much easier than a continuous feed into the pelletizer.
The compounded sample was then tested for expansion. Before grinding, an understanding of the potential expansion was obtained by carrying out a hex bin moulding on the PP(C) and CBA (A) – this compound will now be referred to as PP Foam (A) herein. This was completed with a static oven and some basic temperature monitoring JUST RITE stripes as well as a moulding trial on a Ferry carousel rotational moulding machine. The result from the mouldings internal surface can be seen below in Figure 8 followed by the cooking cycle temperature profile, Figure 9.

9) Temperature profile for cooking of PP Foam
Initial impressions from the internal surface of the moulding was very irregular, this was expected due to the pellet form. However, Matrix were impressed with the expansion and stiffness, the two major targets for this product. The temperature profile is comparable to the PP dry blends and is what was expected.
An understanding of the reaction length is key to understand the quantity of gas produced and therefore the expansion ratio and void fraction. The Matrix in-house static oven was used on the PP Foam (A) to quantify expansion over a length of time at a fixed temperature. The oven was set at 220°C and four 12g samples were added into the oven with foil casing in a standard baking tray. The samples werethenremovedafter 25,45,65and85minutes. The performance of the foam was best at 45 minutes, the samples before this interval hadn’t fully melted out and those after had oxidized, they became more degraded with a greater time spent in the oven. The later samples were more yellow in appearance. It was also noticeable that the expansion decreased with time exposed to the heat of the oven. The explanation for this is that the polymer had oxidized and became too viscous to hold the gases until crystallization occurred, but also that the gas supply from the decomposition reaction of the CBA had gone to completion. As a result, a repeat experiment around the optimum performance time of 45 minutes was undertaken.
The experiment was repeated at the same oven temperature but samples were removed at 35, 40, 45, 50, 55and60minutes. Onthisoccasiontheexpansionand void fraction were quantified alongside the previous data collected. The process for which this was calculated was as follows.
Results and Discussion
Theexpansionratio wascalculated aftercookingofthe samples. The determination of the expansion ratio used the expression shown in equation 1.
(1) �� – Expansion Ratio of Foam
���� – Foam Density determined by Densitometer*
���� – Base polymer density from TDS – 0.9050 g/cm3
*The density of the foam was measured using a densitometer following the ISO 1183 standard.
From the expansion ratio, the void fraction was determined. The void fraction is defined as the percentage of the polymer body that isn’t occupied by the polymer. The equation is listed as Equation 2. All parameters have been defined previously.
������������������������(%) =(1 1 ��) ×100 (2)
The greater the expansion ratio - the larger the void fraction, as it can be seen they are dependent. Higher the yield of gaseous products from the reaction should provide greater thickness or expansion
The results of the expansion and void fraction in relation to the cooking time can be seen below in Table 3.
(Table 4) Expansion ratio and void fraction results for static oven testing of PP Foam (A).
Baking time against Expansion Factor
From the results it is clear that there is a “reaction operating window” this is where the reaction cooking time produces the greatest expansion. From Table 4 and Figure 10 belowitcanbeseenthat inthisexperiment the operating window is between 40-60 minutes. Obviously, this will be different within the Roto-moulding process and with the polymer in powder form. However, it has proven that expansion cannot be maintained after the reaction has gone to completion.
(Figure 10) Baking time relationship with expansion ratio achieved.
The result can be explained with the help of the possible reactions taking place for the CBA. Since the TDS (technical datasheet) stated that the reaction decomposition is between 185-220°C and that the reaction is an endothermic reaction [2]. This suggests that the active blowing agent within the CBA (B) is citric acid perhaps coupled with sodium bicarbonate. The products of the reactions and published effective gases on the data sheet are also identical. Therefore the reactions below give a good indication of the decomposition which is occurring, despite perhaps not being the exact reaction [2]
Equation 3 - Decomposition Reaction for Sodium Carbonate CBA (1)[2]
Equation 4 - Decomposition Reaction for Citric Acid
CBA (1)[2]
Equation 5 - Decomposition Reaction for Citric Acid
CBA (2)[2]
The reaction can be used to explain the expansion ratio changing over time, from the graph in Figure 10, it is clear that the articles produced before 40 minutes had not expanded as much as those identified by the dotted lines in the reaction operating window. This is because the reaction temperature might not have been reached or the reaction had only just been activated. The articles that have been identified in the reaction operating window, this is where the reactants from Eq 3, 4 and 5 would not have been fully consumed therefore gases would have been produced until crystallizationand cooling. As a result the foamed structure was maintained after crystallization. The cooked samples that lie outside of the operating window (after 60 minutes) the CO2 and H2O would have stopped being produced but the foam expansion ratio would also have been
compromised by the oxidation of the polymer. The lack of gas being produced can clearly be seen as the foam shrinks after removal from the oven, and the void fraction decreases. A well-cooked sample at 45 minutes and an overcooked sample at 85 minutes can be seen below in figure 11

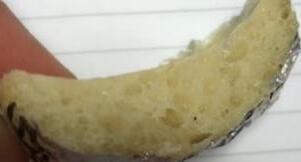
11) 45 (left) minute and 85 (right) minute static oven articles.
The findings will be able to be applied to the rotational moulding process and has furthered understanding into the reaction, however the times and temperature will not be able to be applied directly.
Another observation for the static oven articles that can be made is the cell density. The most appropriate way to assess, analysis and compare this between the samples is with the use of microscopic photography. A computer assisted microscope was used to achieve images of the structure. The images obtained are displayed within Figures 12 and 13 below. Only the optimum (40 min) and 60 min are presented.
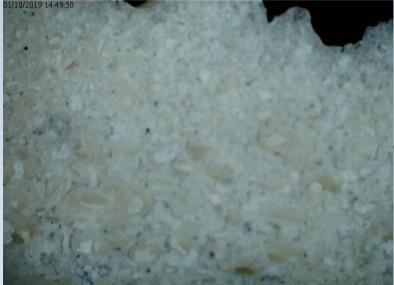
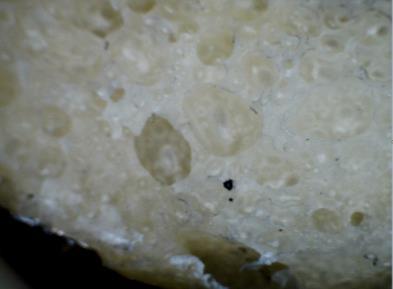
From the image in Figures 12 and 13, taken at the same magnification, the cell structure achieved by the 40 minute sample has a greater degree of densification than that of the 65 minute structure. As the articles are cooked longer the cell size becomes more open as cell walls breakdown when the gases supply deteriorates. This causes larger voids which continue to increase in size as more cell walls
collapse. This could be found on the other samples which were cooked for longer suggesting this is what has happened. The larger voids resemble the one outlined on Figure 13
The greater the densification of the foam means a tighter structure which is associated with greater stiffness and impact strength. Large voids are considered weaknesses throughout the polymer, therefore undesirable
The PP Foam pellets were ground using liquid nitrogen and an Orenda AF Lab pulveriser, then roto-moulded using a Ferry carousel rotational moulding machine, however the expansionofthe 700gfoaming shot was not as desired. The expansionofthe foamwas not well distributed andblowing was sectional throughout the part. Once again the 700g shot weight of foam was moulded on top of a 600g superlinear grade. Despite the poor moulding performance the stiffness was good. The internal surface can be seen below in Figure 14.
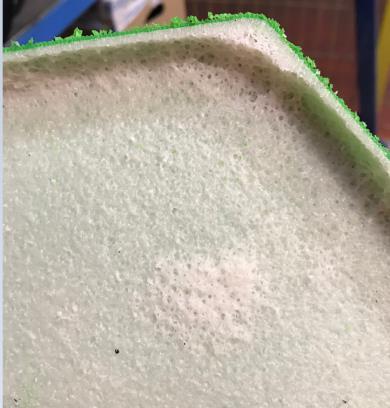
(Figure 14) Internal surface – initial PP foam formulation.
In order to improve the blow of the foam the composition of the CBA was increased from low composition to a greater composition, the improved formulation for the foam can be seen below in Table 5.
(Table 5) Composition of the compounded PP foamTrial 2.
Components
PP (C)
CBA (B) – greater composition
Additional Additives
Antioxidants
Oil
Zinc Stearate
The second formulations obtained much better blowing from the PP foam. The foam was processed at various conditions where the PIAT of the foam are presented in Table 6.
(Table 6) Processing conditions of the PP Foam –PIAT on second shot. Foam
T1
T2
T3
Above 230°C
204°C
218°C
Images of the cross sections for the processed material can be seen to have blown as desired as illustrated by Figure 15 and 16
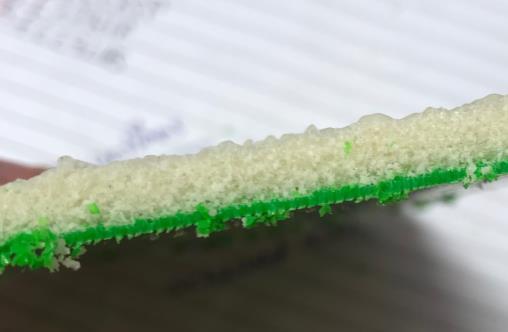
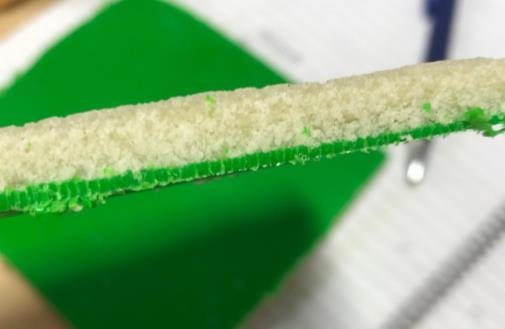
From the images it is clear that the primary aim to produce a PP foam for the Rotational moulding industry has been achieved. The cell structure of the material is very dense, with a small cell dimeter, this is demonstrated in Figure 17 No large cavities can be seen which would weaken the cross-section.
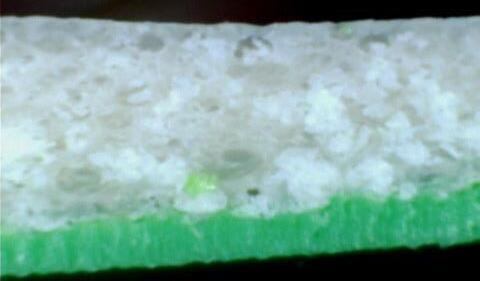
Based on the internal layer of the super linear grade the expansionachieved bythePP foamwasbetween,2.21-2.32 times dependent on processing conditions.
The aim of this investigation was to develop a new polypropylene foamgrade, throughtestingwithvariousdry blended formulations and static oven analysis of the materialandunderstandingofPPfoamhasbeendeveloped Compounded formulation was used with a new PP grade on the market to develop this new material.
Conclusion
From the testing and analysis carried out at the Matrix Polymers’ Technical Centre the development of a new polypropylene foam grade as well as an understanding of the new material was achieved after experimenting with an array of different approaches
The use of a dry blended approach, using standard PP and an existing PE foam did not produce desirable results. The greatest problems experienced in this case was delamination from the out layer, poor foaming, and separation of polymer within the foam layer (heterogeneous), despite this stiffness when incorporating the PP foam was promising.
Analysis of the PP foam was completed using static oven and JUST RITE temperature stripes. The resulted showcased the potential of the PP foam formulation presented onTable 2 (lowcomposition CBA). The analysis with the static oven help identify that the expansion would reduce with an extended cooking time. An understanding was achieved that the gases produced from the decomposition reaction would diffuse out of the molten polymer. This was completed to gain knowledge of processing conditions and the how the material performs in a zero shear stress environment. Upon processing, the material did not performance as desired with an uneven internal surface (Figure 14). An increase in the CBA composition within the polymer from low composition to the higher composition saw an increase in the expansion from the formulation in Table 2.
The formulation presented in Table 5 achieves the scope of this development. The images within Figure 15 and 16 showcase the material in two differing processing conditions. In both cases the material has performed as desired. The foam has been processed and therefore a polypropylene foam deemed suitable for the rotational moulding process, achieving an expansion of around 2.25 times, has been achieved. For any further questions please contact the authors of the research work, they would be happy to answer any questions which you might have regarding this work.
References
1. Mohebbi. A., Mighri. F., Ajji. A. & Rodrigue. D. (2015) Current Issues and Challenges in Polypropylene Foaming: A Review. Cellular Polymers, 34 (6), 299-338.
2. Reglero Ruiz. J.A., Agassant. J.F., Sadik. T. & Pillon. C. (2015) Polymer foaming with chemical blowing agents: Experiments and modelling, Polymer Engineering and Science. 2018-2029
