Mark Boehmig
Realtor, GRI, CLHMS
(941)807-6936
markboehmig@michaelsaunders.com
MarkitSoldFL.com
Mark Boehmig
Realtor, GRI, CLHMS
(941)807-6936
markboehmig@michaelsaunders.com
MarkitSoldFL.com
Published: May 2024*
Property Types: Single Family Home - All Property Statuses
Price Range: $0 - No Limit SQFT Range: 0 - No Limit
Bedrooms: 0 - No Limit Full Baths: 0 - No Limit
Half Baths: 0 - No Limit Year Built: 0 - No Limit

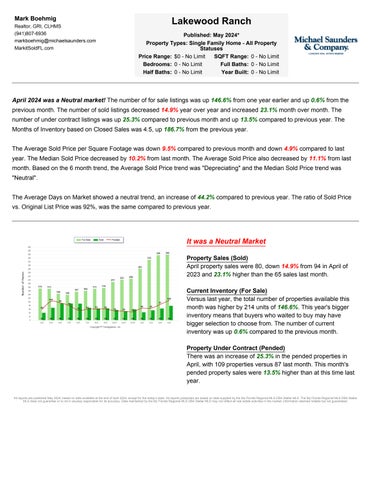
April 2024 was a Neutral market! The number of for sale listings was up 146.6% from one year earlier and up 0.6% from the previous month. The number of sold listings decreased 14.9% year over year and increased 23.1% month over month. The number of under contract listings was up 25.3% compared to previous month and up 13.5% compared to previous year. The Months of Inventory based on Closed Sales was 4.5, up 186.7% from the previous year.
The Average Sold Price per Square Footage was down 9.5% compared to previous month and down 4.9% compared to last year. The Median Sold Price decreased by 10.2% from last month. The Average Sold Price also decreased by 11.1% from last month. Based on the 6 month trend, the Average Sold Price trend was "Depreciating" and the Median Sold Price trend was "Neutral".
The Average Days on Market showed a neutral trend, an increase of 44.2% compared to previous year. The ratio of Sold Price vs. Original List Price was 92%, was the same compared to previous year.
It was a Neutral Market
Property
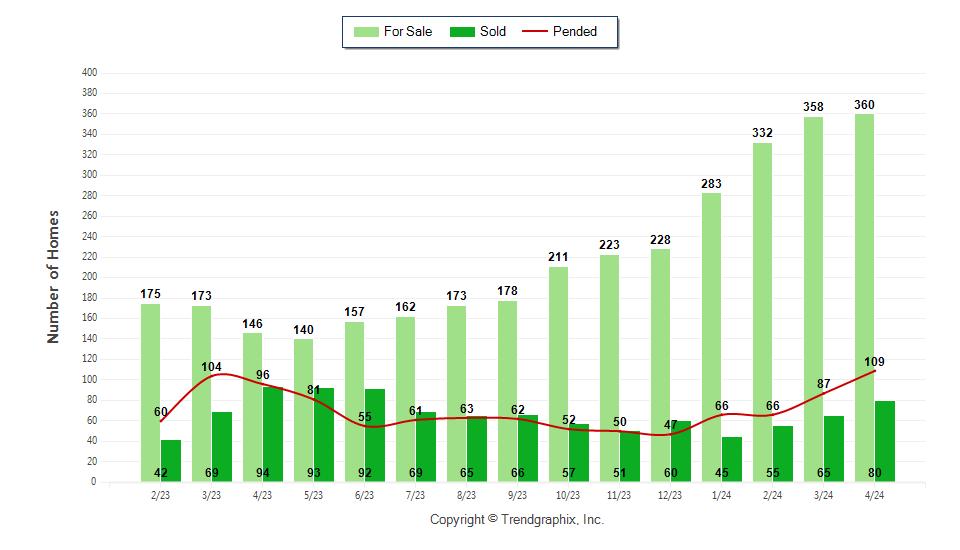
April property sales were 80, down 14.9% from 94 in April of 2023 and 23.1% higher than the 65 sales last month.
Versus last year, the total number of properties available this month was higher by 214 units of 146.6%. This year's bigger inventory means that buyers who waited to buy may have bigger selection to choose from. The number of current inventory was up 0.6% compared to the previous month.
There was an increase of 25.3% in the pended properties in April, with 109 properties versus 87 last month. This month's pended property sales were 13.5% higher than at this time last year.
Mark Boehmig
Realtor, GRI, CLHMS
(941)807-6936
markboehmig@michaelsaunders.com
MarkitSoldFL.com
Published: May 2024*
Property Types: Single Family Home - All Property Statuses
Price Range: $0 - No Limit SQFT Range: 0 - No Limit
Bedrooms: 0 - No
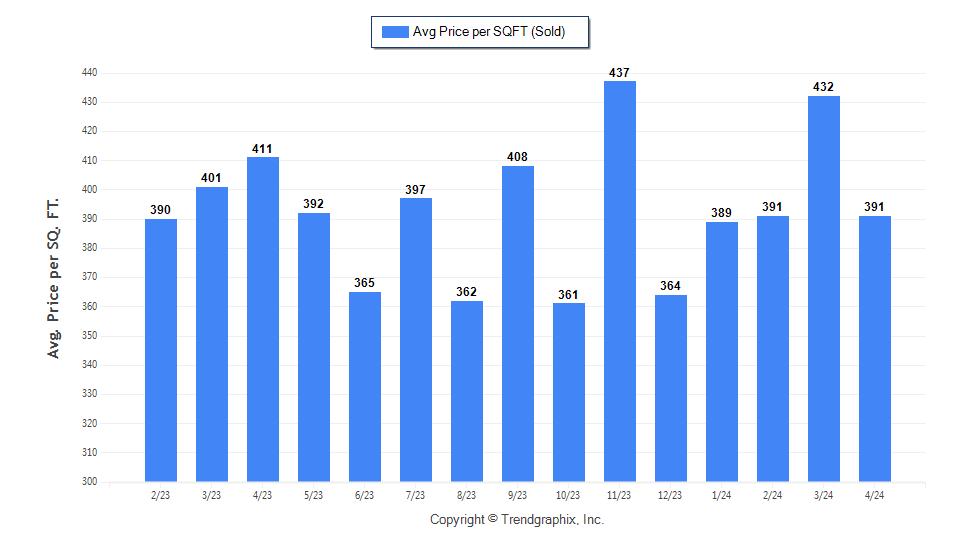
The Average Sold Price per Square Footage was Neutral*
The Average Sold Price per Square Footage is a great indicator for the direction of property values. Since Median Sold Price and Average Sold Price can be impacted by the 'mix' of high or low end properties in the market, the Average Sold Price per Square Footage is a more normalized indicator on the direction of property values. The April 2024 Average Sold Price per Square Footage of $391 was down 9.5% from $432 last month and down 4.9% from $411 in April of last year.
* Based on 6 month trend – Appreciating/Depreciating/Neutral
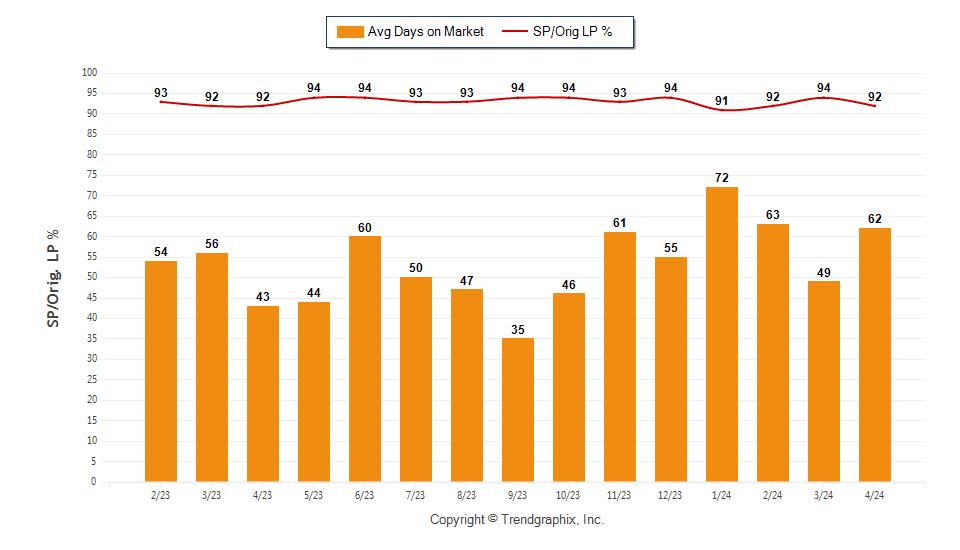
The average Days on Market (DOM) shows how many days the average property is on the market before it sells. An upward trend in DOM trends to indicate a move towards more of a Buyer’s market, a downward trend indicates a move towards more of a Seller’s market. The DOM for April 2024 was 62, up 26.5% from 49 days last month and up 44.2% from 43 days in April of last year.
The Sold/Original List Price Ratio Remains
The Sold Price vs. Original List Price reveals the average amount that sellers are agreeing to come down from their original list price. The lower the ratio is below 100% the more of a Buyer’s market exists, a ratio at or above 100% indicates more of a Seller’s market. This month Sold Price vs. Original List Price of 92% was down 2.1% % from last month and the same as in April of last year.
* Based on 6 month trend – Upward/Downward/Neutral
** Based on 6 month trend – Rising/Falling/Remains Steady
Mark Boehmig
Realtor, GRI, CLHMS
(941)807-6936
markboehmig@michaelsaunders.com
MarkitSoldFL.com
Published: May 2024*
Property Types: Single Family Home - All Property Statuses
Price Range: $0 - No Limit SQFT Range: 0 - No Limit
Bedrooms: 0 - No
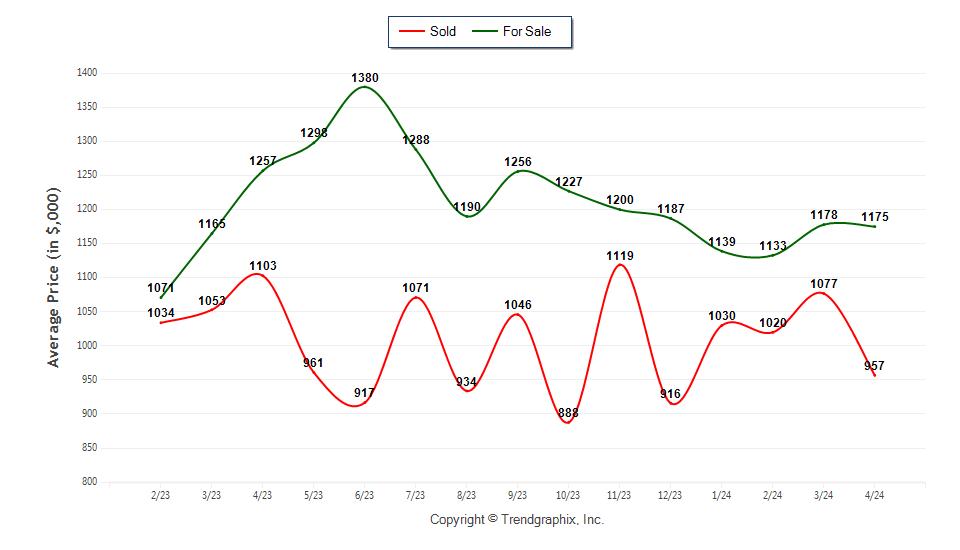
The Average For Sale Price was Neutral*
The Average For Sale Price in April was $1,175,000, down 6.5% from $1,257,000 in April of 2023 and down 0.3% from $1,178,000 last month.
The Average Sold Price was Depreciating*
The Average Sold Price in April was $957,000, down 13.2% from $1,103,000 in April of 2023 and down 11.1% from $1,077,000 last month.
The Median Sold Price was Neutral*
The Median Sold Price in April was $808,000, down 4.6% from $847,000 in April of 2023 and down 10.2% from $900,000 last month.
* Based on 6 month trend – Appreciating/Depreciating/Neutral
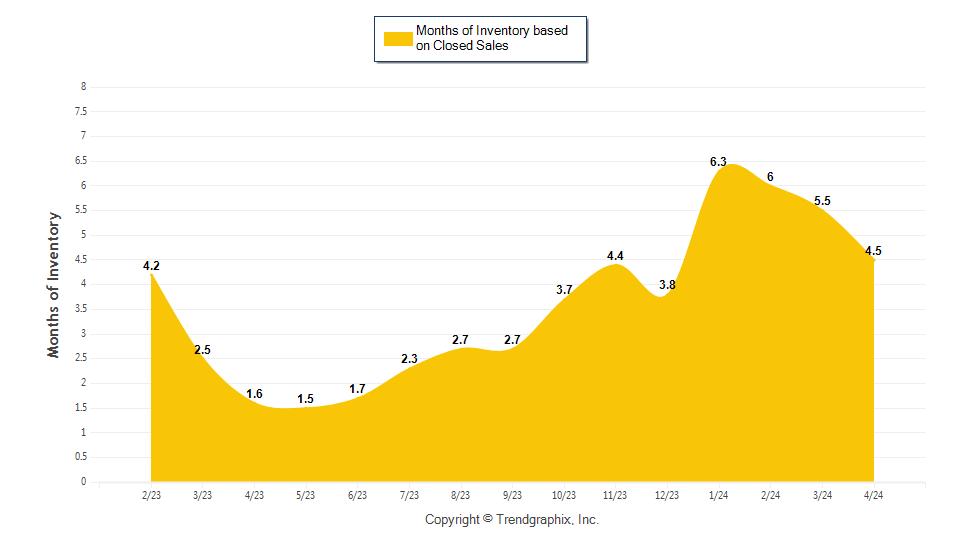
It was a Neutral
A comparatively lower Months of Inventory is more beneficial for sellers while a higher months of inventory is better for buyers.
*Buyer’s market: more than 6 months of inventory
Seller’s market: less than 3 months of inventory
Neutral market: 3 – 6 months of inventory
Months of Inventory based on Closed Sales
The April 2024 Months of Inventory based on Closed Sales of 4.5 was increased by 186.7% compared to last year and down 18.2% compared to last month. April 2024 was Neutral market.
Months of Inventory based on Pended Sales
The April 2024 Months of Inventory based on Pended Sales of 3.3 was increased by 118.4% compared to last year and down 19.4% compared to last month. April 2024 was Neutral market.
Mark Boehmig
Realtor, GRI, CLHMS
(941)807-6936
markboehmig@michaelsaunders.com
MarkitSoldFL.com
Published: May 2024*
Property Types: Single Family Home - All Property Statuses
Price Range: $0 - No Limit SQFT Range: 0 - No Limit Bedrooms: 0 - No
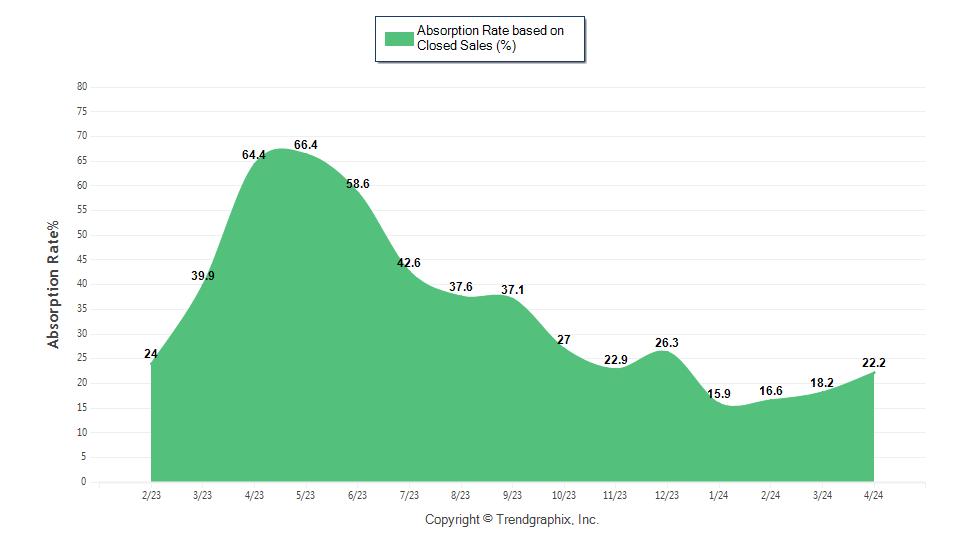
Absorption Rate measures the inverse of Months of Inventory and represents how much of the current active listings (as a percentage) are being absorbed each month.
*Buyer’s market: 16.67% and below Seller’s market: 33.33% and above
Neutral market: 16.67% - 33.33%
Absorption Rate based on Closed Sales
The April 2024 Absorption Rate based on Closed Sales of 22.2 was decreased by 65.5% compared to last year and up 22% compared to last month.
Absorption Rate based on Pended Sales
The April 2024 Absorption Rate based on Pended Sales of 30.3 was decreased by 54% compared to last year and up 24.7% compared to last month.