
Facts and TrendsTM - Published November 2022*
No Limit
Limit
of Homes For Sale vs. Sold vs. Pended
Curnt vs. Prev Month Curnt vs. Same Month 1 Yr Ago Curnt vs. Same Qtr 1 Yr Ago Oct. 22 Sep. 22 % Change Oct. 22 Oct. 21 % Change Aug. 22 to Oct. 22 Aug. 21 to Oct. 21 % Change For Sale 552 535 3.2% 552 121 356.2% 552 121 356.2% Sold 170 130 30.8% 170 195 -12.8% 485 581 -16.5% Pended 144 112 28.6% 144 163 -11.7% 418 473 -11.6% TODAY’S STATS Current vs. Prev MTD Current vs. Same MTD 1 Yr Ago Current vs. Prev YTD 11/1/22 - 11/8/22 10/1/22 - 10/8/22 % Change 11/1/22 - 11/8/22 11/1/21 - 11/8/21 % Change 1/1/22 - 11/8/22 1/1/21 - 11/8/21 % Change For Sale 546 538 1.5% 546 84 550% 546 84 550% Sold 29 47 -38.3% 29 33 -12.1% 1730 2182 -20.7% Pended 26 29 -10.3% 26 53 -50.9% 1534 1955 -21.5%
2022 is a Neutral market**
For Sale in October 2022 is 552 units. It is up 3.2% compared to last month and up
in October 2022 is 170 units. It is up 30.8%
last month
down
under Contract in October 2022 is 144 units. It is up
down
market: more than 6 months of inventory based on closed sales. Seller's market: less than 3 months of inventory based on closed sales. Neutral market:
months of inventory based on closed sales.
Location: Zip 34202, Zip 34211 Property Types: All Res. Proptype - All Properties - All Properties - All Property Statuses Price Range: $0 -
SQFT Range: 0 - No Limit Bedrooms: 0 - No Limit Full Baths: 0 - No
Half Baths: 0 - No Limit Year Built: 0 - No Limit Number
(Aug. 2021 - Oct. 2022) Prepared for you by: Mark Boehmig
October
Home
356.2% compared to last year. Home Closed
compared to
and
12.8% compared to last year. Home Placed
28.6% compared to last month and
11.7% compared to last year. **Buyer's
3 - 6


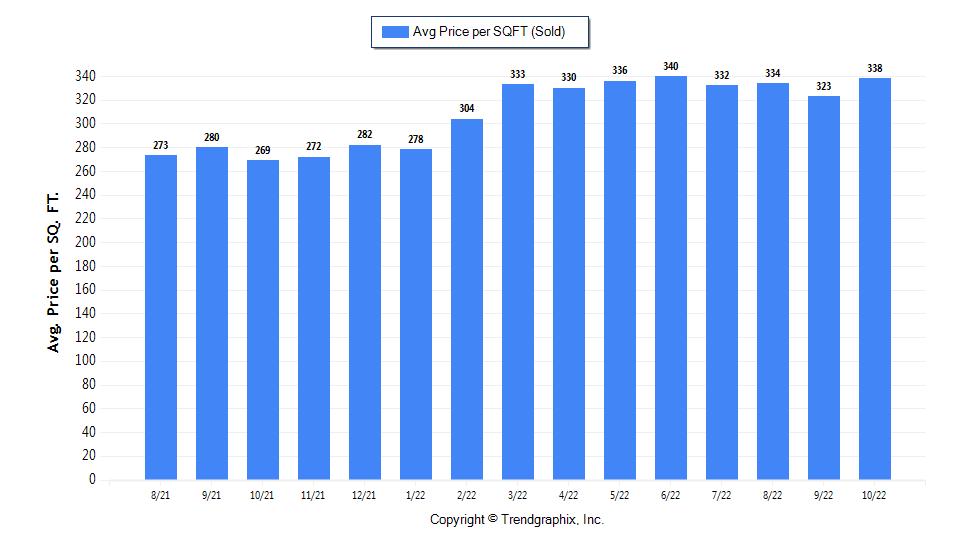
Facts and TrendsTM - Published November 2022* Location: Zip 34202, Zip 34211 Property Types: All Res. Proptype - All Properties - All Properties - All Property Statuses Price Range: $0 - No Limit SQFT Range: 0 - No Limit Bedrooms: 0 - No Limit Full Baths: 0 - No Limit Half Baths: 0 - No Limit Year Built: 0 - No Limit Average Price per SQFT (Sold) (Aug. 2021 - Oct. 2022)
Curnt vs. Prev Month Curnt vs. Same Month 1 Yr Ago Curnt vs. Same Qtr 1 Yr Ago Oct. 22 Sep. 22 % Change Oct. 22 Oct. 21 % Change Aug. 22 to Oct. 22 Aug. 21 to Oct. 21 % Change Avg. Sq. Ft. Price (Sold) 338 323 4.6% 338 269 25.7% 332.45 273.9 21.4% TODAY’S STATS Current vs. Prev MTD Current vs. Same MTD 1 Yr Ago Current vs. Prev YTD 11/1/22 - 11/8/22 10/1/22 - 10/8/22 % Change 11/1/22 - 11/8/22 11/1/21 - 11/8/21 % Change 1/1/22 - 11/8/22 1/1/21 - 11/8/21 % Change Avg. Sq. Ft. Price (Sold) 345 394 -12.4% 345 264 30.7% 327 253 29.2% October 2022 Average Sold Price per Square Footage is Neutral** Average Sold Price per Square Footage in October 2022 is $338. It is up 4.6% compared to last month and up 25.7% compared to last year. **Based on 6 month trend - Appreciating/Depreciating/Neutral.
Prepared for you by: Mark Boehmig


Facts and TrendsTM - Published November 2022*
Location: Zip 34202, Zip 34211
No Limit
No Limit
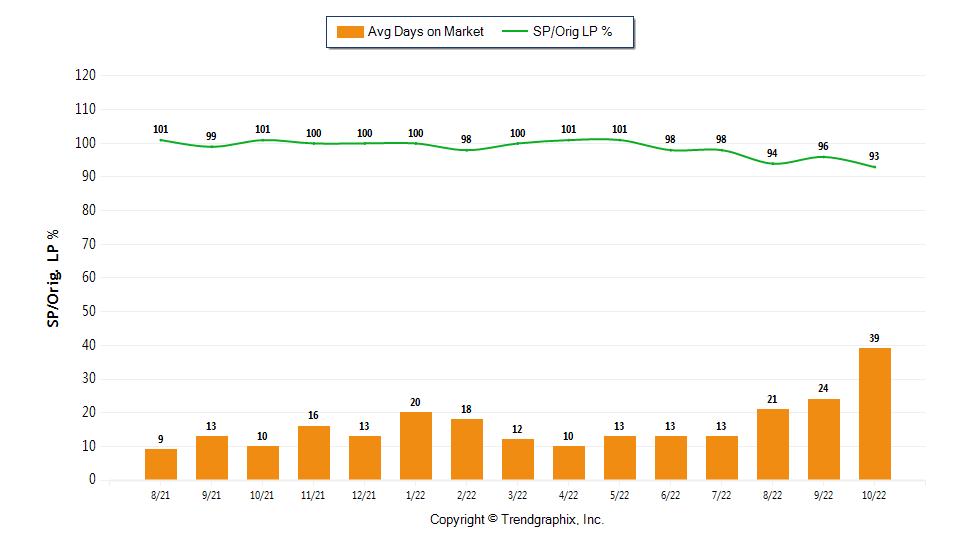
Days On Market & SP/Orig LP %
Curnt vs. Prev Month Curnt vs. Same Month 1 Yr Ago Curnt vs. Same Qtr 1 Yr Ago Oct. 22 Sep. 22 % Change Oct. 22 Oct. 21 % Change Aug. 22 to Oct. 22 Aug. 21 to Oct. 21 % Change Avg Days on Market 39 24 62.5% 39 10 290% 28 11 154.5% Sold/Orig LP Diff. % 93 96 -3.1% 93 101 -7.9% 94 100 -6% TODAY’S STATS Current vs. Prev MTD Current vs. Same MTD 1 Yr Ago Current vs. Prev YTD 11/1/22 - 11/8/22 10/1/22 - 10/8/22 % Change 11/1/22 - 11/8/22 11/1/21 - 11/8/21 % Change 1/1/22 - 11/8/22 1/1/21 - 11/8/21 % Change Avg Days on Market 33 32 3.1% 33 14 135.7% 18 26 -30.8% Sold/Orig LP Diff. % 96 94 2.1% 96 102 -5.9% 98 100 -2%
2022 Average Days on Market trend is Rising**
Days on Market in October 2022 is 39. It is up 62.5% compared to last month and up 290% compared to last year.
2022 Sold/Original List Price Ratio is Falling**
List Price % in October 2022 is 93%. It is down 3.1% compared to last month and down 7.9% compared to last year.
on 6 month trend - Rising/Falling/Remains Steady.
Property Types: All Res. Proptype - All Properties - All Properties - All Property Statuses Price Range: $0 -
SQFT Range: 0 - No Limit Bedrooms: 0 - No Limit Full Baths: 0 -
Half Baths: 0 - No Limit Year Built: 0 - No Limit Avg
(Aug. 2021 - Oct. 2022) Prepared for you by: Mark Boehmig
October
Average
October
Sold/Original
**Based
Average
Location:
Property

Average

Facts and TrendsTM - Published November 2022*
Zip 34202, Zip 34211
Types: All Res. Proptype - All Properties - All Properties - All Property Statuses Price Range: $0 - No Limit SQFT Range: 0 - No Limit Bedrooms: 0 - No Limit
Full Baths: 0 - No Limit Half Baths: 0 - No Limit Year Built: 0 - No Limit
Price of For Sale and Sold
Curnt vs. Prev Month Curnt vs. Same Month 1 Yr Ago Curnt vs. Same Qtr 1 Yr Ago Oct. 22 Sep. 22 % Change Oct. 22 Oct. 21 % Change Aug. 22 to Oct. 22 Aug. 21 to Oct. 21 % Change Avg. Active Price 752 728 3.3% 752 1005 -25.2% 742 1023 -27.5% Avg. Sold Price 807 745 8.3% 807 611 32.1% 774 619 25% TODAY’S STATS Current vs. Prev MTD Current vs. Same MTD 1 Yr Ago Current vs. Prev YTD 11/1/22 - 11/8/22 10/1/22 - 10/8/22 % Change 11/1/22 - 11/8/22 11/1/21 - 11/8/21 % Change 1/1/22 - 11/8/22 1/1/21 - 11/8/21 % Change Avg. Active Price 743 723 2.8% 743 1096 -32.2% 743 1096 -32.2% Avg. Sold Price 818 924 -11.5% 818 546 49.8% 767 589 30.2%
(Aug. 2021 - Oct. 2022) Prepared for you by: Mark Boehmig
Sale
October 2022 Average For
Price is Neutral**
Sale Price (in thousand) in October 2022 is
It is up
last month
down
Average For
$752.
3.3% compared to
and
25.2% compared to last year.
Sold Price
Neutral**
October 2022 Average
is
Sold Price (in thousand) in October 2022 is
is up
month
on 6 month trend - Appreciating/Depreciating/Neutral.
$807. It
8.3% compared to last
and up 32.1% compared to last year. **Based


Facts and TrendsTM - Published November 2022*
No Limit
No Limit
of Inventory Based on Closed Sales
Curnt vs. Prev Month Curnt vs. Same Month 1 Yr Ago Curnt vs. Same Qtr 1 Yr Ago Oct. 22 Sep. 22 % Change Oct. 22 Oct. 21 % Change Aug. 22 to Oct. 22 Aug. 21 to Oct. 21 % Change Months of Inventory (Closed Sales) 3.2 4.1 -21.9% 3.2 0.6 419% 3.5 0.5 555.4% TODAY’S STATS Current vs. Prev MTD Current vs. Same MTD 1 Yr Ago Current vs. Prev YTD 11/1/22 - 11/8/22 10/1/22 - 10/8/22 % Change 11/1/22 - 11/8/22 11/1/21 - 11/8/21 % Change 1/1/22 - 11/8/22 1/1/21 - 11/8/21 % Change Months of Inventory (Closed Sales) 5 3 67.7% 5 0.7 633.5% 3.3 0.4 724.3%
market**
of Inventory based on Closed Sales in October 2022 is 3.2. It is down 21.9% compared to last month and up 419% compared to last year.
market: more than 6 months of inventory based on closed sales. Seller's market: less than 3 months of inventory based on closed sales. Neutral market: 3 - 6 months of inventory based on closed sales.
Location: Zip 34202, Zip 34211 Property Types: All Res. Proptype - All Properties - All Properties - All Property Statuses Price Range: $0 -
SQFT Range: 0 - No Limit Bedrooms: 0 - No Limit Full Baths: 0 -
Half Baths: 0 - No Limit Year Built: 0 - No Limit Months
(Aug. 2021 - Oct. 2022) Prepared for you by: Mark Boehmig
October 2022 is a Neutral
Months
**Buyer's
Location: Zip 34202, Zip 34211
Property Types: All Res. Proptype - All Properties - All Properties - All Property Statuses
Price Range: $0 - No Limit
SQFT Range: 0 - No Limit Bedrooms: 0 - No Limit
Full Baths: 0 - No Limit Half Baths: 0 - No Limit Year Built: 0 - No Limit
Date 8/21 9/21 10/21 11/21 12/21 1/22 2/22 3/22 4/22 5/22 6/22 7/22 8/22 9/22 10/22
For Sale 86 106 121 84 67 57 65 81 126 232 358 568 564 535 552
New Listing 208 182 231 165 184 190 200 230 221 295 276 463 221 143 195 Sold 200 186 195 190 220 128 168 196 165 210 187 159 185 130 170 Pended 170 140 163 159 122 191 142 158 149 158 111 177 162 112 144

Months of Inventory (Closed Sales) 0.4 0.6 0.6 0.4 0.3 0.4 0.4 0.4 0.8 1.1 1.9 3.6 3 4.1 3.2
Months of Inventory (Pended Sales) 0.5 0.8 0.7 0.5 0.5 0.3 0.5 0.5 0.8 1.5 3.2 3.2 3.5 4.8 3.8
Absorption Rate (Closed Sales) % 232.6 175.5 161.2 226.2 328.4 224.6 258.5 242 131 90.5 52.2 28 32.8 24.3 30.8
Absorption Rate (Pended Sales) % 197.7 132.1 134.7 189.3 182.1 335.1 218.5 195.1 118.3 68.1 31 31.2 28.7 20.9 26.1
Avg. Active Price 1097 983 1005 1096 953 1131 1265 1217 1144 947 889 761 745 728 752
Avg.
Facts and TrendsTM - Published November 2022*
All reports are published November 2022, based on data available at the
of October 2022, except for the today’s stats. All reports presented are based on data supplied by the My Florida Regional MLS DBA Stellar MLS. The My Florida Regional MLS DBA Stellar MLS does not guarantee or is not in anyway responsible for its accuracy. Data maintained by the My Florida Regional MLS DBA Stellar MLS may not reflect all real estate activities in the market. Information deemed reliable but not guaranteed.
Sold Price 582 668 611 624 637 638 705 797 787 759 812 813 763 745 807 Avg. Sq. Ft. Price (Sold) 273 280 269 272 282 278 304 333 330 336 340 332 334 323 338 Sold/List Diff. % 101 100 101 101 101 100 99 101 101 101 100 99 98 99 97 Sold/Orig LP Diff. % 101 99 101 100 100 100 98 100 101 101 98 98 94 96 93 Avg Days on Market 9 13 10 16 13 20 18 12 10 13 13 13 21 24 39 Median Active Price 722 630 617 605 609 669 725 811 759 700 675 623 595 573 570 Median Sold Price 470 550 515 521 550 542 560 639 641 640 736 655 607 626 643
end


