8 minute read
Bubbles; Efficient Markets and Behavioral Finance


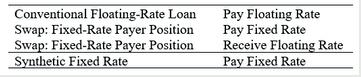
with payments made six months later. The semiannual interest rates are determined by dividing the annual rates (LIBOR and 3.5%) by two. Exhibit A shows the interest payments on each settlement/payment date based on assumed LIBORs on the effective dates. In examining the table, several points should be noted. ng-rate (fixed-rate) to minimize the borrower’s debt position’s exposure to interest rate changes. For example, a company with floating-rate debt that was expecting a higher interest rate could fix the rate on its debt by combining the company’s floating debt with a fixed-rate payer’s position on a swap, thereby creating a synthetic fixed-rate debt position. An example of a synthetic floating-rate loan is shown in Exhibit A (columns 10-12). The synthetic loan is formed with a 3.5% fixed-rate loan (semiannual payments) and the floating-rate payer's position on the 3.5% for LIBOR swap.
Exhibit A: Interest Rate Swap
Advertisement
First, the payments are determined by the LIBOR prevailing six months prior to the payment date; thus, payers on swaps would know their obligations in advance of the payment date. Second, when the LIBOR is below the fixed 3.5% rate, the fixed-rate payer pays the interest differential to the floating-rate payer; when it is above 3.5%, the fixed-rate payer receives the interest differential from the floating-rate payer. The net interest received by the fixed-rate payer is shown in Column 5 of the table, and the net interest received by the floating-rate payer is shown in Column 6. Synthetic Positions One of the important uses of interest rate swaps is in creating synthetic fixed-rate or floating-rate liabilities or changing a conventional fixed-rate loan (or floating-rate loan) to a floatiFor example, suppose a corporation has a three-year $10 million floating-rate loan, with the rate set equal to the LIBOR on March 15th and September 15th each year for three years. Fearing that interest rates could increase in the future, suppose the company would like to convert its floating-rate debt to a three-year, $10 million fixed-rate loan starting on 3/15/Y1. Instead of borrowing $10 million from a bank at a fixed rate to refinance its floating-rate debt, the company alternatively could attain a fixed-rate oan by combining its floating-rate loan with a fixed-rate payer's position on the swap.: 3.5%/LIBOR Swap with NP = $10 million: Columns 3-6
Synthetic Fixed Rate Loan: Floating-Rate Loan set at LIBOR and Fixed-Payer Position on 3.5%/LIBOR Swap: Columns 7-9
Synthetic Floating-Rate Loan: 3.50% Fixed-Rate Loan and Floating-Payer Position on 3.5%/LIBOR Swap: Columns 10-12

BUBBLES, EFFICIENTS MARKETS, AND BEHAVIORAL FINANCE
“Markets may remain irrational longer than you can remain solvent” John Maynard Keynes
From the beginning of 1995 to April 2000, the S&P 500 increased 227% from 466 to 1,524; even more impressive, the NASDAQ 100 index increased more than 12 fold from 347 to 4,692. This was the Dot-Com boom period, described by Federal Reserve Chair, Alan Greenspan, at the time as one of “irrational exuberance”. After peaking in April of 2000, the market crashed. One year later the S&P was back to 1,100 and the NASDAQ 100 index had decreased 70% to approximately 1,400; by April 2002, it had declined to approximately 1,000—the bubble had burst.
In general, a speculative bubble occurs when the price of an asset such as stock, gold, or houses, increases beyond a level that can be justified on economic grounds and once past that level the price continues to rise. History is replete with speculative bubbles: the South Sea Bubble, the internet bubble, and the 2008 housing bubble. Bubbles tend to have stages. First, there is an initial period in which an event, announcement, or invention changes expectations. This period is almost always followed by a period of abnormal returns for early investors. In turn, other investors are attracted, even though fundamentals no longer make sense, leading to a boom period in which prices continue to increase. Finally, the fourth stage is the bust. In his book, Dot.Con, John Cassidy captures the essence of the internet bubble with the story of Priceline.com: “In March 1999, Priceline.com … was preparing to do an initial public offering … The word on Wall Street was that Priceline.com would follow the path of American Online, Yahoo!, and ebay to become an “internet blue chip.” The only question people in the investment community were asking was how much stock they w- ould be able to lay their hands on…. On the morning of March 30, 10 million shares of Priceline.com opened on the Nasdaq National Market at $16 each, but the price immediately jumped to $85. At the close of trading, the stock stood at $68; it had risen 425% on that day. Priceline.com was valued at almost $10 billion—more than United Airline, Continental Airlines, and Northwest Airline combined. …Priceline.com started operating on April 6, 1998. By the end of the year, it had sold slightly more than $35 million worth of airline tickets, which cost it $36.5 million. …The loss did not include any of the money Priceline.com spent developing its Web site…A few weeks after Priceline.com’s IPO, its stock reached $150, at which point the tiny company was worth more than the entire U.S. airline industry. Two years later, the stock was trading at less than $2, and the entire capitalization of Priceline.com would not have covered the cost of two Boeing 747s.” (Cassidy, Dot.Con, pp. 2-8)
ARE MARKETS EFFICIENT?
One of the most influential theories to emerge out of the finance literature over the last fifty years is the efficient market hypothesis (EMH). Introduced by Burton Malkiel in the 1960s, the EMH precipitated a considerable amount of controversy between proponents of the EMH (primarily academicians) and practitioners who employed fundamental and technical analysis. EMH proponents argued that if the market consisted of a sufficient number of fundamentalists—those searching for securities priced below or above their intrinsic value—then their actions would inherently force the market price of a security to equal its intrinsic value. For example if a security were underpriced, the fundamentalists would try to buy the security, pushing its market price towards its intrinsic value. Thus, according to the proponents of the EMH, with enough fundamentalists the market price of a security is equal to its true value. Similarly, EMH proponents argued that if the market consisted of enough technicians—those trading off price and volume trends—then their actions would eliminate the possibility of earning any abnormal returns from identifying trends in security prices. If a stock traded low on Monday and high on Friday, technicians would detect this trend and would buy on Monday and sell on Friday. These actions would augment the price of the stock on Monday and lower it on Friday, there by eliminating the trend and the possibility of earning an excess profit. If the EMH holds, in the sense that the market consist of a sufficient number of fundamentalists and technicians, then investors would be unable to earn abnormal returns from either fundamental or technical strategies.
One of the benefits of this controversial theory was that it spurred a considerable amount of research; in fact, there has more research devoted to the EMH than to any other subject in investments. At the forefront of efficient market research are the seminal works of Eugene Fama. For over thirty years, the studies by Fama have served as a template for research in efficient market. For this body of work, he was awarded the 2013 Nobel Prize in Economic Sciences.
The efficient market studies of Fama and other scholars addressed the question of whether or not security prices reflect information. A perfectly efficient market is one in which all information is fully reflected in a security price. If such a market existed, then the price of the security would always be equal to its true value and investors would not be able to earn abnormal returns from fundamental and technical strategies or from inside information. The empirical studies
that have tested market efficient suggest that markets are not perfectly efficient. Studies have found a number of anomalies may exist. The most notable are abnormal returns (returns above risk-adjusted returns) from investing in small-size firms, low price-to-earning per share stocks, high book-to-market value stocks, and stocks in the month of January.
Studies also suggests that the market appears to react quickly and efficiently to events such as initial public offerings, new exchange listings, and expected earnings announcements, but appears to take some time to react to unexpected earnings announcements. Finally, studies have found that, with some exceptions, security analysts and portfolio managers do not appear to be able to consistently outperform the market on a risk-adjusted basis, but that insiders appear to have information not fully reflected in security prices. rly merit to EMH, but as the aforementioned studies suggest there is also some merit to the arguments against it. For example, the Hurst exponent is a time-series measure name after Harold Hurst. The exponent was originally used in hydraulic engineering to study the volatility patterns of rain observed over a long period of time. In finance, the Hurst exponent is used to identify price patterns hidden within seemingly random stock price trends. In general, a time series can be defined as persistent with a tendency to continue its up or down pattern, anti-persistent in which it has a higher tendency to reverse its current pattern, or random. For example, a value of 0.5 for the Hurst coefficient indicates that the movements in the price trend are random. If not, then there is pattern to the stock price movement. For the period 2010-2021, the Hurst exponent daily value for the S&P 500 averaged 0.7922. Applying the Hurst coefficient for individual stocks, one often finds more often than not that the stocks’ price patterns have Hurst exponent value higher or lower than 0.5, suggesting patterns to their movements and providing an argument for the use of technical analysis.

The EMH has been the source of much debate, often pitting its proponents against technicians and fundamentalists alike. There is clea-