Optimizing Urban Perception: Integrating Image Segmentation and Machine Learning to Explore Street ViewCrime Correlations in London
Lewen
Zhang1, Robin Song1, Wenshuo Zhang1
1 University College London, London, United Kingdom
Abstract. Urban safety is a critical concern for town planners, architects, and the general public, particularly in metropolitan areas like London. This study investigates the relationship between crime data in London and street view images (SVI) using advanced image segmentation regression models. By analyzing crime incidents alongside visual data, the research aims to provide accurate predictions of crime rates and identify key contributing factors. The project employs machine learning techniques, precisely Random Forest and XGBoost, to visualize actual versus predicted crime distributions, enhancing our understanding of urban safety dynamics. Additionally, the study explores innovative solutions foroptimizing street scenes through reinforcement learning, allowing for adaptive urban planning strategies. An interactive online platform is developed, enabling users to modify street view components easily. This platform leverages Stable Diffusion to generate responsive urban scenarios, fostering community engagementandinformed decision-making.Byintegratinggeospatialanalysiswithvisual data, this research contributes to the field of urban safety and offers practical tools for enhancing the livability and security of urban environments. Ultimately, the findings aim to inform policy decisions and improve the overall quality of life in urban settings.
Keywords: Machine Learning, Street View Images, Crime Rate
1 Background
London is often perceived on social media as a high-crime city, with urban crime data reaching 75,000 incidents in August 2024 alone, exhibiting significant geographical spatial clustering characteristics, particularly with crime rates around Oxford Street being substantially higher than in other urban areas. Existing research based on Space Syntax theory has already confirmed that urban spatial configuration has a complex structural impact on crime occurrence, with urban space integration and connectivity demonstrating a non-linear, multidimensional correlation with crime rates. This study focuses on the proportional distribution of different segmentation elements in street scenes (such as buildings, streets, greenery, etc.), and through quantitative analysis of
the relationship between street scene element composition and crime rates, explores the potential influencing mechanisms of urban spatial micro-morphology on crime occurrence.
2 Precedents
2.1
Crime Rate related urban study
Many researchers have already provided insights into the complex quantitative relationship between street scenes and crime rates. In 1982, Wilson and Kelling proposed the Broken Window Theory (BWT), with the advantage of explaining the impact of physical environment on crime, but the limitation of failing to deeply analyze specific mechanisms. In 2005, Cozens et al. proposed Crime Prevention Through Environmental Design (CPTED), with the advantage of emphasizing crime prevention through rational physical environmentdesign, but the limitationofnot consideringthe complexity of socioeconomic factors.(Cozens, P.M., Saville, G. and Hillier, D., 2005. )Patino et al. in 2014 attempted to quantify environment using remote sensing images, with advantages of obtaining large-scale data, but limitations of only capturing sky view and inability to reflect human-eye street landscape perspectives.(Garcia, J.J., Velasquez, H. and Mauricio Montenegro, C., 2014.) He et al. in 2020 tried using geotagged social media data, with advantages of obtaining real-time data, but limitations of uneven data distribution and difficulty in precisely characterizing street environments.(He, L., Páez, A., Jiao, J., An, P., Lu, C., Mao, W. and Long, D., 2020.) Hipp et al. in 2021 described physical environment from four dimensions (vibrancy, auto-oriented, defensible space, and greenspace), with advantages of multi-dimensional analysis but limitations of feature selection relying on expert subjective judgments.(Hipp, J. R., Lee, S., Ki, D., and Kim, J. H. 2021). Deng et al. in 2022 used eight street view variables to describe street environment, with advantages of using street view images but limitations of focusing on single environmental elements and not considering overall environmental perception. (Deng, M., Yang, W., Chen, C. and Liu, C., 2022. )
2.2 Regression Models
Conventional crime rate prediction with street view images (SVI) often lies on Siamese Convolutional Neural Networks. Yet, due to their complex structure, CNN models are often regarded as "black boxes," making it difficult to explain their decision-making processes, leading to a problem in applications that require transparency and interpretability, such as in law and social sciences (Birck, 2017; Kadiyam, 2021). Comparatively,otherregressionmodelslikeExtremeGradientBoosting(XGboost)andRandom Forest are able tobebacktraced, providingfeatureimportance scores tohelpunderstand the basis of the model's decisions. Precedent study of carbon emission predictions with
SVI using Random Forest has also been proved with high credibility, attaining an Rsquared value ss> 0.8 (Shi et al., 2024). This leads to our exploration on light-weighted regression model with SVI inputs, aiming to receive both predictions and impacts of predictors concurrently.
2.3 Reinforcement Learning
Reinforcement learning is one of the state-of-art artificial intelligence learning model which approaching the optimal result with a trial-and-error mechanism. Basic reinforcement model contains two parts: actor and critic (Masadeh, Wang and Kamal, 2000) In the recent year, reinforcement learning has been deployed in to the urban scale ,tackling with complex real world problems. In the study conducted in 2024, researchers use RL model to find cyclist’s visual preference with street view and bike trajectories. (Ren et al., 2024) While this research provides valuable insights for city planning, it lacks practical solutions. Building on this work, our study aims to assess the SVI (Street View Index) and propose corresponding solutions.
3 Methodology
3.1
Study area
This study focuses on the city of London, the capital of the United Kingdom. London is a sprawling metropolis with an area of 1,572 km²and a population of over 9 million as of 2024. The city features a diverse range of neighborhoods and physical environments, providing a valuable opportunity to explore how variations in these settings influence crime dynamics. We gathered crime data collected from the Metropolitan Police Service and images collected from Google Street View (GSV), which were analyzed and aggregated to street segments.
3.2
Crime data
Crime data: The crime data for this study was collected from the UK Police website (https://www.police.uk/)fortheperiodfromAugust1,2024,toAugust31,2024. There are 75369 crime incidents in total happened in London which provide a comprehensive overview of crime pattern, mainly happened in the central London. To focus on our analysis, we target on the central area with highest crime count as our study sample which contains 30795 cases. It allows us for a detailed examination of crime dynamics. (see Fig.3A)

Fig. 3A. A figure shows the crime distribution in London in Aug 2024.
Collecting GSV Image: To analyze the data, we calculate the crime count in street segments. For reliability in accessing the feature of the segment, we avoid to include images from points located near intersections, given that these capture the environment of more than a single segment. (Zhang et al., 2018) Instead, we chose the middle point of the street to collect the street view imagery. At each point, we pulled four images using Google Street View (GSV) API that were oriented at 0 degrees, 90 degrees, 180 degrees and 270 degrees. In total, we collected 57476 images from the points (see Fig 3B)

Fig. 3B. A figure shows the crime distribution in street segments and the points for collecting street view imagery.
Image processing: To maximize the visual information from the street view, we combine the four street view images captured at 0, 90, 180 and 270 degrees into one panoramic image. (see Fig.3C) This approach enhance the contextual understanding of each street segments for further analysis.

3.3 Streetview data
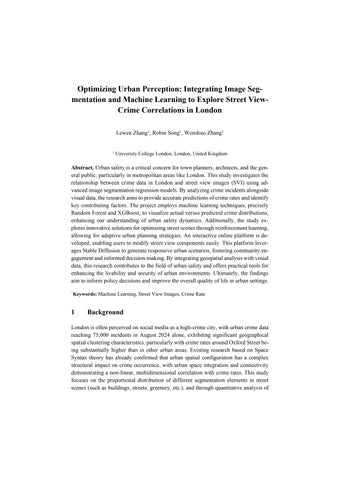
To extract detailed segmented components from each input panorama, a pre-trained psp_res50_ade model was utilized for semantic image segmentation. This model employs a ResNet-50 backbone, a 50-layer residual network integrated with the Pyramid Scene Parsing (PSP) module. The model was trained on the ADE20K dataset, a largescale dataset containing 25,574 images for training and 2,000 images for validation(Zhang et al., 2018)(see Fig.3D). ADE20K provides comprehensive annotations of objects and their parts, with 150 distinct classes for scene parsing tasks, represented using color-coded labels.
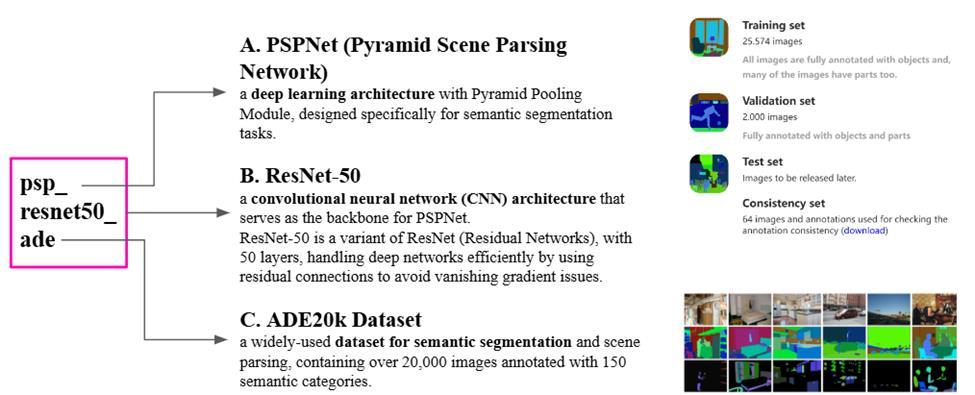
Fig.3D. A breakdown of the psp_resnet50_ade model.
For this study, 7,053 street mid-point panoramas within the selected area were processed using this model in Python. Each Street View Image (SVI) was segmented, producing color-coded output images in PNG format. The color-coded outputs were analyzed at the pixel level to determine the presence and distribution of various components. Specifically, the RGB values of each pixel were matched against the pre-trained labels to generate a normalized dataset of component distributions for all SVIs.
This component distribution dataset was further augmented with corresponding street segment lengths and total crime counts, ensuring comprehensive data preparation for subsequent regression model training and testing (see Fig.3E.). This approach enabled precise mapping of street-level visual features to quantitative crime metrics, facilitating more profound insights into the relationship between urban design elements and crime patterns.

Fig.3E. Data processing flowchart, gathering occurrence of components, length of street segment, and crime counts for regression.
3.4 Regression
Pre-processing of Crime Count Data. Computation of Crime Rate by Length: The crime rate was computed by dividing the crime count by the length of street segments and then multiplying by 100.
This normalization adjusted for variations in street segment lengths:

Data Transformation: The crime rate was capped at the 95th percentile (≤ 50) to address the presence of extreme values (outliers).
A logarithmic transformation was applied to normalize the distribution of crime rates:
This approach avoided issues with zero values and created a more symmetrical distribution for regression analysis.

Fig.3F. Data processing flowchart, gathering occurrence of components, length of street segment, and crime count for regression.
Regression Model Performance Comparison. Three regression models were compared:
Linear Regression: Straightforward regression was used to predict log_crime_rate based on the identified SVI (Street View Image) components and length.
Results: Multiple R-squared: 0.348, Adjusted R-squared: 0.3432

The model was rejected due to its low R-squared value, weak performance for middle and high crime rates, biased trend on scatter plots, and excessive number of predictors for the optimal model (52/143 validated inputs).
Random Forest: Out-of-bag (OOB) error estimates were utilized to optimize the number of trees in the forest. Results: % Var explained: 44.32, R-squared: 0.4512911
The model demonstrated better performance for middle-range crime rates and was deemed suitable for further predictions.
XGBoost: XGBoost was implemented, with optimization for higher tree depths (200300). Results: R-squared: 0.4505854

This model performed well, particularly for higher crime rate predictions.
Fine-tuning Random Forest Model
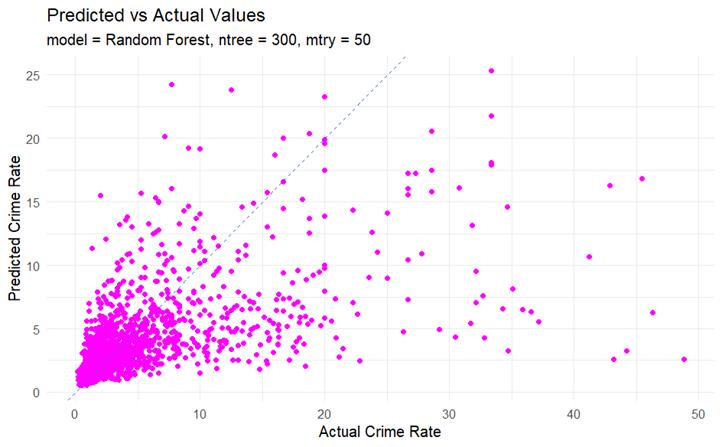
Model Tuning: The following parameters were optimized: ntree (number of trees): A value of 300 was selected, where the OOB error reached a minimum, (see Fig.3G)
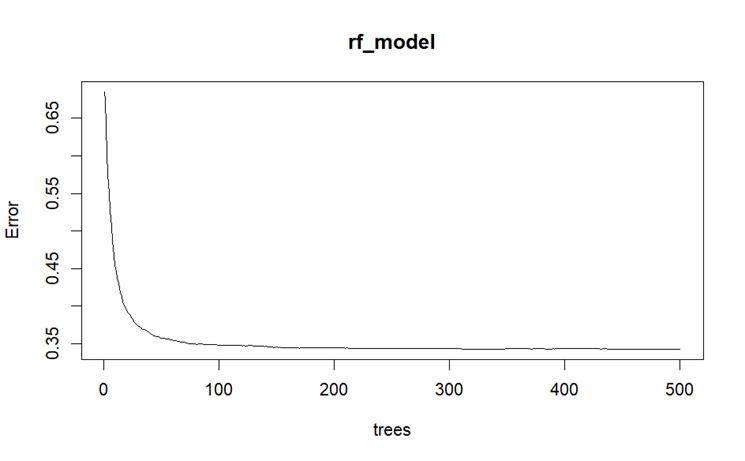
Fig.3G. Out-of-bag (OOB) Error changes with the increase of ntree
mtry (number of variables randomly sampled as candidates at each split): Values between 1 and 50 were tested, with 50 determined as optimal.
Model Training and Validation: The dataset was segmented into 80% for training and 20% for testing. The fine-tuned Random Forest model was applied to predict log_crime_rate.
Feature Importance: The contribution of features (length and SVI components) to the model was visualized using node purity metrics. The top contributing predictors were identified for future insights and training practices (see Fig.3H.).

3.5 Reinforce Learning
Purpose: In this study, we have already built up a correlation between crime data and segmented street view. Reinforcement learning was selected due to its effectiveness to learn optimal behaviors with a clear reward criteria and multiple trials, which makes automated street view improvement possible.
Model selection: In this study, we selected the Soft Actor-Critic model as our training model The SAC model contains two main components: (Masadeh, Wang and Kamal, 2000)
Actor: Actor generate the actions and received evaluation result as improvement factors
Critic: Critic values the actor strategy and give it back to actors. Besides, soft refers to soft Bellman backup which encourage the model to maximizing the reward while also maximizing the entropy. Specifically, SAC model is capable of handling continuous action spaces and balancing multiple optimization objective, making it particularly well-suited for our dataset.
Reward mechanism: Three reward rules were established for the reinforcement learning process:
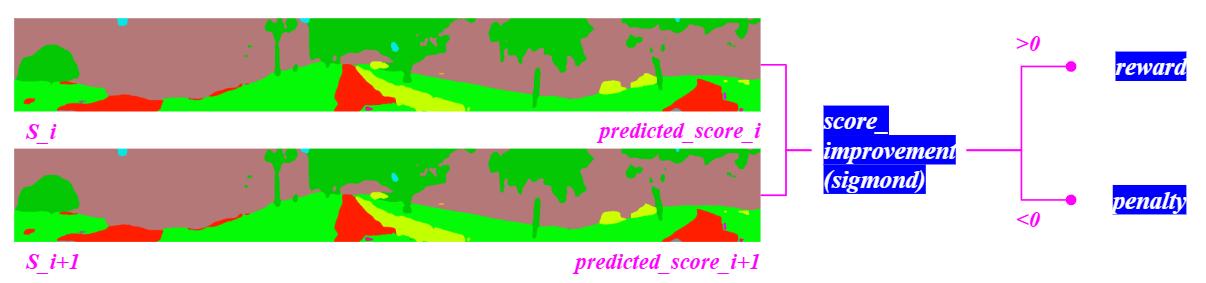
⚫ Score improvement reward: The model calculates the score improvement based on the difference between (i+1) state and i state from regression model.
score_improvement = ����+1- ����
A sigmoid function is applied to smooth the reward.
σ(x) = 1 �� ��+1
then reward: σ(score_improvement) = 1 �� (����+1 ����)+1
If the score improvement>= 0, model will gain reward, otherwise, the model incurs penalty(see Fig.3I)
⚫ Color ratio reward: color ratio reward is divided into two parts: ◼ Positive impact color: The model identifies colors which has higher correlation with crime rate with higher weights. The reward will be given to those color which has a positive impact on the crime rate. (see Fig.3J) reward = ��������ℎ������������ ��* k

⚫ Penalty for Reduced Colors: The model penalizes the reduction of colors associated with the reduced percentage. The greater the proportion of colors is reduced, the larger the penalty incurred. (see Fig.3K)
greater the proportion loss: reward = ������������∗5
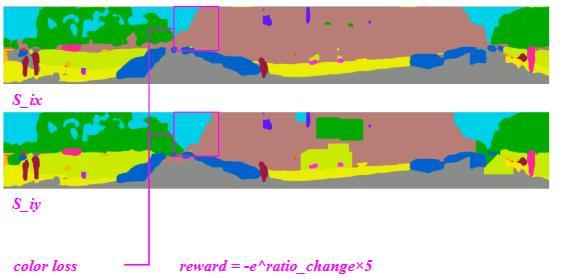
3K. Diagram of color ratio reward-reduction
⚫ Trend reward: The model employs a five-step historical window linear regression to calculate trends in crime rates. (see Fig.3L)
linear regression model can be expressed as:
Tanh function is used for reward bounding, ensuring that the rewards remain within [-1,1].
reward=tanh(slope)
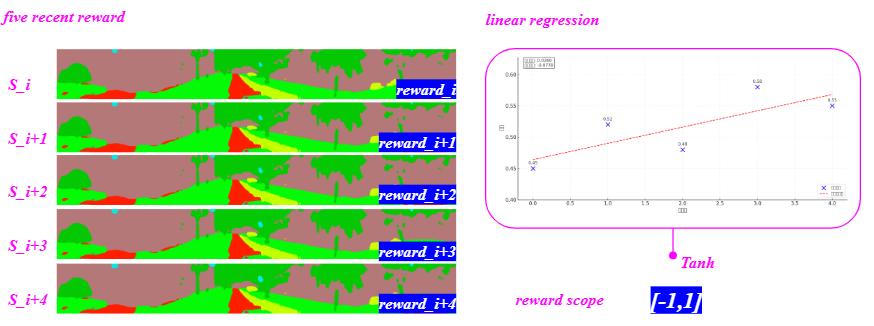
3L. Diagram of trend reward
Movement mechanism: There are two main movement in the action space-dilation and erosion which occur simultaneously. (see Fig.3M) When the white color dilate, the purple erode. A protected area is set for the color with overall percentage less than 5% which will not be influenced by the dilation movement.

3M. An example of dilation, erosion and protected area.
Termination: The model will still calculate the predicted crime score in five steps. If the max mines min is less than 0.01, the training will come to an end
4 Results
4.1 Regression result
To get the predicted crime rate values from Random Forest and XGBoost with the testingdataset,an inversetransformationofthenaturallogarithmisappliedtothepredicted log_crime_rate data from both models:
After obtaining predictions, three factors are used for the dashboard visualization in the London Lower Super Output Areas (LSOA) map:
Mean of crime rate by area: The mean value of all crime rate entries within LSOA
Maximum crime rate by area: The maximum crime rate entry by LSOA
Sum of crime counts by area: The sum of all crime events (predicted: crime rate / 100 * street segment length, for all crime rate entries) by LSOA
A comparison chart is plotted for each factor to validate the predictions (Fig.4A).

Fig.4A. Comparison of Random Forest and XGBoost predictions
Conclusion of model performance
Random Forest:
Performance: The Random Forest model demonstrated reliable performance, particularly for capturing mid-range crime rates. This is evident in the magenta plots, where the predictions align well with observed values for mean and maximum crime rates.
Interpretability: Random Forest offers an advantage in feature importance analysis, allowing for straightforward identification of key predictors influencing crime rates.
Application: The model was chosen for scenarios requiring balanced performance and greater interpretability, such as generating insights from the predictors.
XGBoost:
Performance: XGBoost consistently outperformed Random Forest in predictive accuracy, especially for extremevalues (e.g., thehighest crime rates and counts). The purple plots reveal closer alignment with observed values, particularly for the sum of crime counts.
Scalability and Efficiency: XGBoost’s efficiency in handling large datasets and robust optimization capabilities make it the preferred choice for high-complexity tasks.
Application:Thismodelwasselectedfortasksrequiringsuperiorprecision,particularly for identifying areas with higher crime concentrations.
4.2 Reinforcement learning
Through Reinforcement Learning, we successfully mitigated the crime rate prediction using the original photograph. After 500 iterations, the predicted crime rate was significantly reduced from 2.8798 to 2.6840, representing a notable improvement in our predictive model. (see Fig.4B)The accompanying line charts (see Fig.4C) illustrate the dynamic changes in reward and predicted score throughout the optimization process.
The reward line chart and predicted score line chart provide a comprehensive visualization of the model's learning process. These graphs demonstrate the progressive refinement of our approach, highlighting the effectiveness of the reinforcement learning algorithm in systematically reducing crime rate predictions.

4B. The procedure of the reinforcement learning.
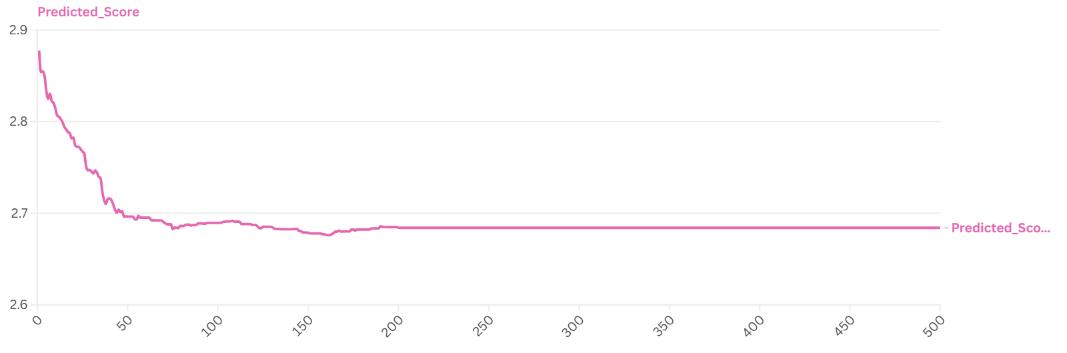

Fig. 4C. The line chart of reward and predicted scoreS
4.3
Interaction design
Our Interactive platform enables designers to upload street view image for crime analysis, utilizing semantic segmentation techniques to generate pixel-level annota-tions, which serve as input for a machine learning pipeline that predicts crime risk probabilities and supports generative urban design using stable diffusion models with segmentation masks as control net (see Fig.4D, Fig.4E)


Fig.4E. The workflow chart of the interactive platform.
5 Conclusion
Throughout the study, we successfully established a correlation between crime data in London and Street View Imagery in London, quantifying their intricate relation-ship. By developing a regression model, we constructed a reinforcement learning framework designed to automatically enhance panoramic street view in a two-dimensional scope. This innovative approach provides a strong reference tools for urban renewal process. In the end, an interactive platform was set up for urban de-signer to test the optimal design solution in the initial design phase.
5.1 Strength
• Crime visualization
Successful reproduction on visuals for crime case distribution
• toolkit
Serves as a workflow prototype for urban-scale crime analysis and prediction on existing cities; Could be expanded to optimize imaginary city scenes (e.g. map development in gaming)
• Innovative reward and movement mechanism in RL
Using reduction penalty and protected area to maintained the detail information in the RL process
• Online Platform:
Handy 2D design tool for planners, architects, policy makers and general public without considering learning curves; Practice for participatory planning
5.2 Weakness
Despite our contribution, several problems remain that need to be solved in the future study:
• Database Limitations
Despite our initial dataset construction, the database's scale and diversity remain insufficient.
• SVI Collection Methodology
The current Semantic View Imagery (SVI) collection method requires substantial enhancement,need to consider the length of the street
• Semantic Segmentation Model Precision
Existing semantic segmentation models lack the accuracy required for detailed building information extraction.
• Crime Rate Regression Accuracy
Overall low R-squared (<0.5) due to the impact of social-economic factors on crime occurance
• Reinforcement Learning Model Effectiveness
The application of reinforcement learning in our research necessitates further optimization in more complex reward mechanism and introduce more advanced actorcritic strategy.
References
1. Birck, M. (2017). Towards Crime Rate Prediction through Street-level Images and Siamese Convolutional Neural Networks. ENIAC - Encontro Nacional de Inteligência Artificial e Computacional.
2. Deng, M., Yang, W., Chen, C. and Liu, C. (2021). Exploring associations between streetscapefactorsand crimebehaviorsusing GoogleStreet Viewimages. FrontiersofComputer Science, 16(4).
3. Hipp, J.R., Lee, S., Ki, D. and Kim, J.H. (2021). Measuring the Built Environment with Google Street View and Machine Learning: Consequences for Crime on Street Segments. Journal of Quantitative Criminology.
4. Kadiyam, P. (2021). Crime rate prediction from street view images using convolutional neural networks and transfer learning. Utwente.nl. [online]
5. Masadeh, A., Wang, Z. and Kamal, A.E. (2000). Reinforcement Learning Architectures: SAC, TAC, and ESAC.
6. Ren, K., Jin, M., Liu, H., Gong, Y. and Liu, Y. (2024). Discovering Cyclists’ Visual Preferences through Shared Bike Trajectories and Street View Images Using Inverse Reinforcement Learning.
7. Shi, W., Xiang, Y., Ying, Y., Jiao, Y., Zhao, R. and Qiu, W. (2024). Predicting Neighborhood-Level Residential Carbon EmissionsfromStreet ViewImagesUsing ComputerVision and Machine Learning. Remote Sensing, 16(8), pp.1312–1312.
8. Zhang, F., Zhou, B., Liu, L., Liu, Y., Fung, H.H., Lin, H. and Ratti, C. (2018). Measuring human perceptions of a large-scale urban region using machine learning. Landscape and Urban Planning, 180, pp.148–160.
9. Zhou, B., Zhao, H., Puig, X., Fidler, S., Barriuso, A. and Torralba, A. (2017). Scene Parsing through ADE20K Dataset. Computer Vision and Pattern Recognition (CVPR).
10. Zhou, B., Zhao, H., Puig, X., Xiao, T., Fidler, S., Barriuso, A. and Torralba, A. (2018). Semantic Understanding of Scenes Through the ADE20K Dataset. International Journal of Computer Vision, 127(3), pp.302–321.