Is This Time Different?
On the morning of Sunday, March 31, 1968, the Reverend Martin Luther King, Jr., stood in the elaborately carved limestone pulpit at Washington National Cathedral. The building—one of the largest churches in the world and over twice the size of London’s Westminster abbey—was filled to capacity with thousands of people packed into the nave and transept, looking down from the choir loft, and squeezed into doorways. At least another thousand people gathered outside on the steps or at nearby St. Alban’s Episcopal Church to hear the sermon over loudspeakers.
It would be Dr. King’s final Sunday sermon. Just five days later the cathedral would again be overflowing with a far more somber crowd—including President Lyndon Johnson, senior cabinet officials, all nine Supreme Court justices, and leading members of Congress— gathered to honor King at a memorial service the day following his assassination in Memphis, Tennessee.1
The title of Dr. King’s sermon that day was “Remaining Awake Through a Great Revolution.” Civil and human rights were, as might be expected, a major component of his address, but he had in mind
29
Chapter 2
revolutionary change on a much broader front. As he explained a short way into his sermon:
There can be no gainsaying of the fact that a great revolution is taking place in the world today. In a sense it is a triple revolution: that is, a technological revolution, with the impact of automation and cybernation; then there is a revolution in weaponry, with the emergence of atomic and nuclear weapons of warfare; then there is a human rights revolution, with the freedom explosion that is taking place all over the world. Yes, we do live in a period where changes are taking place. And there is still the voice crying through the vista of time saying, “Behold, I make all things new; former things are passed away.”2
The phrase “triple revolution” referred to a report written by a group of prominent academics, journalists, and technologists that called itself the Ad Hoc Committee on the Triple Revolution. The group included Nobel laureate chemist Linus Pauling as well as economist Gunnar Myrdal, who would be awarded the Nobel Prize in economics, along with Friedrich Hayek, in 1974. Two of the revolutionary forces identified in the report—nuclear weapons and the civil rights movement—are indelibly woven into the historical narrative of the 1960s. The third revolution, which comprised the bulk of the document’s text, has largely been forgotten. The report predicted that “cybernation” (or automation) would soon result in an economy where “potentially unlimited output can be achieved by systems of machines which will require little cooperation from human beings.”3 The result would be massive unemployment, soaring inequality, and, ultimately, falling demand for goods and services as consumers increasingly lacked the purchasing power necessary to continue driving economic growth. The Ad Hoc Committee went on to propose a radical solution: the eventual implementation of a guaranteed minimum income made possible by the “economy of abundance” such
RISE OF THE ROBOTS 30
widespread automation could create, and which would “take the place of the patchwork of welfare measures” that were then in place to address poverty.*
The Triple Revolution report was released to the media and sent to President Johnson, the secretary of labor, and congressional leaders in March 1964. An accompanying cover letter warned ominously that if something akin to the report’s proposed solutions was not implemented, “the nation will be thrown into unprecedented economic and social disorder.” A front-page story with extensive quotations from the report appeared in the next day’s New York Times, and numerous other newspapers and magazines ran stories and editorials (most of which were critical), in some cases even printing the entire text of the report.4
The Triple Revolution marked what was perhaps the crest of a wave of worry about the impact of automation that had arisen following World War II. The specter of mass joblessness as machines displaced workers had incited fear many times in the past—going all the way back to Britain’s Luddite uprising in 1812—but in the 1950s and ’60s, the concern was especially acute and was articulated by some of the United States’ most prominent and intellectually capable individuals.
In 1949, at the request of the New York Times, Norbert Wiener, an internationally renowned mathematician at the Massachusetts Institute of Technology, wrote an article describing his vision for the future of computers and automation.5 Wiener had been a child prodigy who entered college at age eleven and completed his PhD
* The Committee on the Triple Revolution did not advocate the immediate implementation of a guaranteed income. Instead, it proposed a list of nine transitional policies. Many of these were quite conventional, and included things such as greatly increased investment in education, public works projects to create jobs, and the construction of low-cost housing. The report also argued for a greatly expanded role for unions and suggested that organized labor should become an advocate for the unemployed as well as those who held jobs.
Is This Time Different? 31
when he was just seventeen; he went on to establish the field of cybernetics and made substantial contributions in applied mathematics and to the foundations of computer science, robotics, and computercontrolled automation. In his article—written just three years after the first true general-purpose electronic computer was built at the University of Pennsylvania*—Wiener argued that “if we can do anything in a clear and intelligible way, we can do it by machine” and warned that that this could ultimately lead to “an industrial revolution of unmitigated cruelty” powered by machines capable of “reducing the economic value of the routine factory employee to a point at which he is not worth hiring at any price.”**
Three years later, a dystopian future much like the one Wiener had imagined was brought to life in the pages of Kurt Vonnegut’s first novel. Player Piano described an automated economy in which industrial machines managed by a tiny technical elite did virtually all the work, while the vast majority of the population faced a meaningless existence and a hopeless future. Vonnegut, who went on to achieve legendary status as an author, continued to believe in the relevance of his 1952 novel throughout his life, writing decades later that it was becoming “more timely with each passing day.”6
Four months after the Johnson administration received the Triple Revolution report, the president signed a bill creating the National Commission on Technology, Automation, and Economic Progress.7 In his remarks at the bill’s signing ceremony, Johnson said that “automation can be the ally of our prosperity if we will just
* ENIAC (Electronic Numerical Integrator and Computer) was built at the University of Pennsylvania in 1946. A true programmable computer, it was financed by the US Army and intended primarily for calculating firing tables used to aim artillery.
** Due to a miscommunication, Wiener’s article was never published in 1949. A draft copy was discovered by a researcher working with documents in the MIT library archives in 2012, and substantial excerpts were finally published in a May 2013 article by New York Times science reporter John Markoff.
RISE OF THE ROBOTS 32
look ahead, if we will understand what is to come, and if we will set our course wisely after proper planning for the future.” The newly formed commission then—as is almost universally the case with such commissions—quickly faded into obscurity, leaving behind at least three book-length reports of its own.8
The irony of all the automation worries in the postwar period was that the economy offered very little in the way of evidence to support such concerns. When the Triple Revolution report was released in 1964, the unemployment rate was just over 5 percent, and it would fall to a low of 3.5 percent by 1969. Even during the four recessions that occurred between 1948 and 1969, unemployment never reached 7 percent, and then it fell rapidly once recovery was under way.9 The introduction of new technologies did drive substantial increases in productivity, but the lion’s share of that growth was captured by workers in the form of higher wages.
By the early 1970s, focus had shifted to the OPEC oil embargo, and then to the subsequent years of stagflation. The potential for machines and computers to cause unemployment was pushed further and further out of the mainstream. Among professional economists in particular, the idea became virtually untouchable. Those who did dare to entertain such thoughts risked being labeled a “neo-Luddite.”
Given that the dire circumstances predicted by the Triple Revolution report did not come to pass, we can ask an obvious question: Were the authors of the report definitively wrong? Or did they—like many others before them—simply sound the alarm far too soon?
Norbert Wiener, as one of the early pioneers of information technology, perceived the digital computer as being fundamentally different from the mechanical technologies that preceded it. It was a game changer: a new kind of machine with the potential to usher in a new age—and, ultimately, perhaps rend the very fabric of society. Yet, Wiener’s views were expressed at a time when computers were room-sized monstrosities whose calculations were powered by tens of thousands of searingly hot radio vacuum tubes, some number of
Is This Time Different? 33
which could be expected to fail on a near daily basis.10 It would be decades before the exponential arc of progress would drive digital technology to a level where such views might reasonably be justified. Those decades are now behind us, and the time is ripe for an open-minded reassessment of the impact of technology on the economy. The data shows that even as concerns about the impact of labor-saving technology receded to the fringes of economic thought, something that had been fundamental to the postwar era of prosperity gradually began to change in the American economy. The nearly perfect historical correlation between increasing productivity and rising incomes broke down: wages for most Americans stagnated and, for many workers, even declined; income inequality soared to levels not seen since the eve of the 1929 stock market crash; and a new phrase—“jobless recovery”—found a prominent place in our vocabulary. In all, we can enumerate at least seven economic trends that, taken together, suggest a transformative role for advancing information technology.
Seven Deadly Trends
Stagnant Wages
The year 1973 was an eventful one in the history of the United States. The Nixon administration was embroiled in the Watergate scandal, and in October, OPEC initiated an oil embargo that would soon result in long lines of angry motorists at gas stations across the country. Even as Nixon descended into his death spiral, however, there was another story unfolding. This story began with an event that went completely unheralded and yet marked the beginning of a trend that would arguably dwarf both Watergate and the oil crisis in importance. For that was the year a typical American worker’s pay reached its peak. Measured in 2013 dollars, a typical worker—that is, production and nonsupervisory workers in the private sector, representing well over half the American workforce—earned about $767 per week in
RISE OF THE ROBOTS 34
1973. The following year, real average wages began a precipitous decline from which they would never fully recover. A full four decades later, a similar worker earns just $664, a decline of about 13 percent.11
The story is modestly better if we look at median household incomes. Between 1949 and 1973, US median household incomes roughly doubled, from about $25,000 to $50,000. Growth in median incomes during this period tracked nearly perfectly with per capita GDP. Three decades later, median household income had increased to about $61,000, an increase of just 22 percent. That growth, however, was driven largely by the entry of women into the workforce. If incomes had moved in lockstep with economic growth—as was the case prior to 1973—the median household would today be earning well in excess of $90,000, over 50 percent more than the $61,000 they do earn.12
Figure 2.1 shows the relationship between labor productivity* (which measures the value of workers’ hourly output) and compensation (which includes wages and benefits) paid to ordinary private sector workers from 1948 onward. The first segment of the graph (from 1948 to 1973) shows the way economists expect things to work. Growth in productivity moves in almost perfect lockstep with compensation. Prosperity marches upward and is shared broadly by all those who contribute to the economy. Beyond the mid-1970s, the widening gap between the two lines is a graphic illustration of the extent to which the fruits of innovation throughout the economy are now accruing almost entirely to business owners and investors, rather than to workers.
* Labor productivity measures the value of the output (either goods or services) produced by workers per hour. It is a critically important gauge of the general efficiency of an economy; to a significant extent it determines the wealth of a nation. Advanced, industrialized countries have high productivity because their workers have access to more and better technology, enjoy better nutrition as well as safer and more healthful environments, and are generally better educated and trained. Poor countries lack these things and are, therefore, less productive; their people must work longer and harder to produce the same level of output.
Is This Time Different? 35
Figure 2.1. Growth of Real Hourly Compensation for Production and Nonsupervisory Workers Versus Productivity (1948–2011)
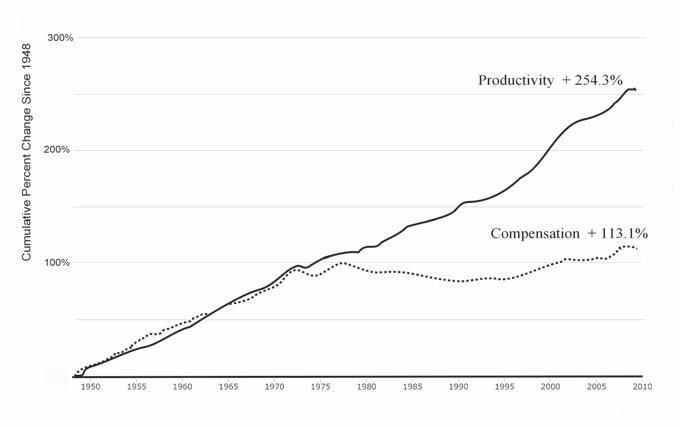
Source: Lawrence Mishel, Economic Policy Institute, based on an analysis of unpublished total economy data from the Bureau of Labor Statistics, the Labor Productivity and Costs program, and the Bureau of Economic Analysis’s National Income and Product Accounts public data series.13
Despite the clarity of this graph, many economists have still not fully acknowledged the divergence between wage and productivity growth. Figure 2.2 shows how growth rates for compensation and productivity compare during different periods going back to 1947. Productivity has significantly outstripped compensation in every decade from 1980 on. The difference is especially dramatic from 2000 to 2009; although productivity growth nearly matches the 1947–1973 period—the golden era of postwar prosperity—compensation lags far behind. It’s difficult to look at this graph and not come away with the impression that productivity growth is pretty clearly blowing the doors off the raises that most workers are getting.
The authors of most college economics textbooks have been especially slow to acknowledge this picture. Consider, for example,
RISE OF THE ROBOTS 36
300% 200% 100% Cumulative Percent Change Since 1948 Productivity + 254.3% Compensation + 113.1% 1950 1955 1960 1965 1970 1975 1980 1985 1990 1995 2000 2005 2010
Figure 2.2. Productivity Growth Versus Compensation Growth
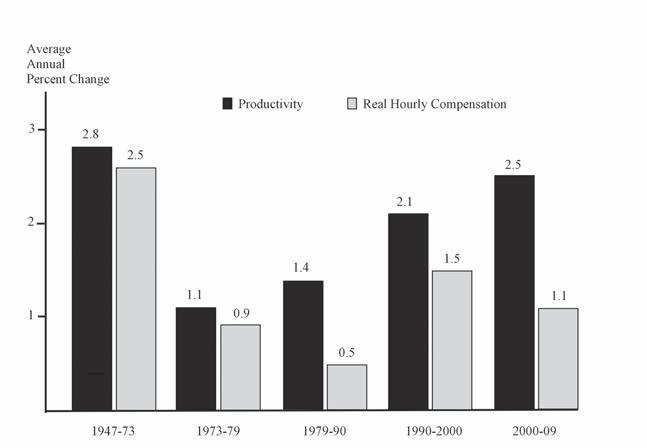
SOURCE: US Bureau of Labor Statistics.14
Principles of Economics, an introductory textbook authored by John B. Taylor and Akila Weerapana,15 the required text for Professor Taylor’s wildly popular introductory economics class at Stanford University. It includes a bar chart very similar to Figure 2.2, but still argues for a tight relationship between wages and productivity. What about the fact that productivity leaps away from wages beginning in the 1980s? Taylor and Weerapana note that “the relationship is not perfect.” That appears to be something of an understatement. The 2007 edition of another textbook, also titled Principles of Economics16 and co-authored by Princeton professor—and former Federal Reserve chairman—Ben Bernanke, suggests that slow wage growth from 2000 on may have resulted from “the weak labor market that followed the recession of 2001” and that wages ought to “catch up to productivity growth as the labor market returns to normal”—a view that seems to ignore the fact that the tight correlation between wage
Is This Time Different? 37
Average Annual Percent Change Productivity Real Hourly Compensation 1947–73 1973–79 1979–90 1990–2000 2000–09
and productivity growth began to deteriorate long before today’s college students were born.*
A Bear Market for Labor’s Share, and a Raging Bull for Corporations
Early in the twentieth century, the British economist and statistician Arthur Bowley delved into decades of national income data for the United Kingdom and showed that the fraction of national income going to labor and capital respectively remained relatively constant, at least over long periods. This apparently fixed relationship ultimately became an accepted economic principle known as “Bowley’s Law.” John Maynard Keynes, perhaps the most famous economist of all time, would later say that Bowley’s Law was “one of the most surprising, yet best established facts in the whole range of economic statistics.”17
As Figure 2.3 shows, during the postwar period, the share of US national income going to labor moved in a fairly tight range, just as
* There is also a technical issue that comes into play when discussing the gap between wage growth and productivity growth. Both the wage (or, more broadly, compensation) and productivity numbers must be adjusted for inflation. The standard way to do this, and the method used by the US Bureau of Labor Statistics (BLS), is to use two different measures of inflation. Wages are adjusted using the Consumer Price Index (CPI) because this reflects the prices of products and services that workers actually spend their money on. The productivity figures are adjusted using the GDP deflator (or implicit price deflator), which is a broader measure of inflation in the entire economy. In other words, the GDP deflator incorporates prices for a lot of things that consumers don’t actually purchase. One especially important difference is that computers and information technology—which have seen substantial price deflation due to Moore’s Law—are much more important in the GDP deflator than in the CPI (computers are not a big component of most household budgets, but are purchased in volume by businesses). Some economists—particularly those who are more conservative—argue that the GDP deflator should be used for both wages and productivity. When this method is used, the gap between wage growth and productivity growth narrows significantly. However, this approach almost certainly understates the level of inflation that impacts wage earners.
RISE OF THE ROBOTS 38
2.3. US Labor’s Share of National Income (1947–2014)
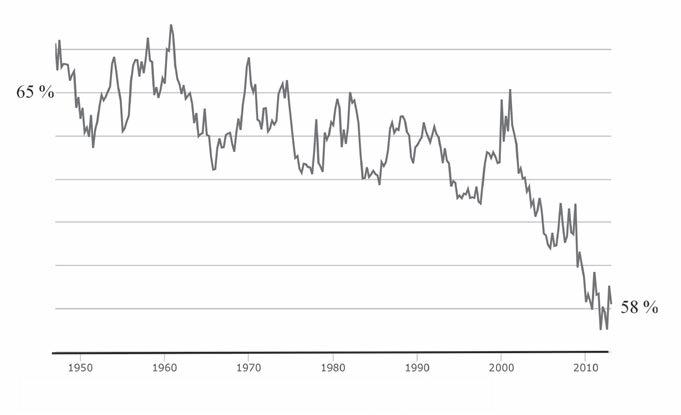
SOURCE: US Bureau of Labor Statistics and Federal Reserve Bank of St. Louis (FRED).18 1950 1960 1970 1980 1990 2000 2010
Bowley’s Law would have predicted. From the mid-1970s on, however, Bowley’s Law began to fall apart as labor’s share went first into a gradual decline and then into a seeming free fall just after the turn of the century. The decline is all the more remarkable when we consider that labor’s share includes anyone who draws a paycheck. In other words, the enormous salaries of CEOs, Wall Street executives, superstar athletes, and movie stars are all considered labor, and those, of course, haven’t been declining at all: they’ve been skyrocketing. A graph showing the share of national income accruing to ordinary workers—or, more broadly, the bottom 99 percent of the income distribution—would certainly show an even more precipitous plunge. While labor’s share of income plummeted, the story was very different for corporate profits. In April 2012, the Wall Street Journal ran a story entitled “For Big Companies, Life Is Good” that documented the astonishing speed at which corporations recovered from the most severe economic crisis since the Great Depression. While millions of
Is This Time Different? 39
Figure
65% 58%
workers remained unemployed or accepted jobs at lower pay or with fewer hours, the corporate sector emerged from the downturn “more productive, more profitable, flush with cash and less burdened by debt.”19 Over the course of the Great Recession, corporations had become adept at producing more with fewer workers. In 2011, big companies generated an average of $420,000 in revenue for each employee, an increase of more than 11 percent over the 2007 figure of $378,000.20 Spending on new plants and equipment, including information technology, by S&P 500 companies had doubled from the year before, bringing capital investment as a percentage of revenue back to pre-crisis levels.
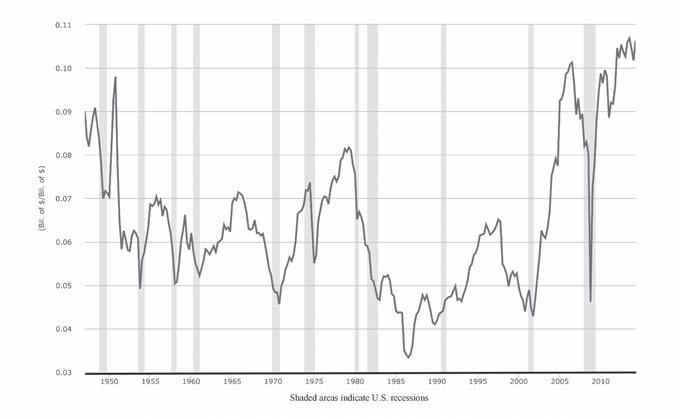
Corporate profits as a percentage of the total economy (GDP) also skyrocketed after the Great Recession (see Figure 2.4). Notice that despite the precipitous plunge in profits during the 2008–2009 economic crisis, the speed at which profitability recovered was unprecedented compared with previous recessions.
RISE OF THE ROBOTS 40
1950 1955 1960 1965 1970 1975 1985 1980 1990 1995 2000 2005 2010 Shaded areas indicate U.S. recessions (Bil. of $/Bil. of $) 0.11 0.10 0.08 0.07 0.06 0.05 0.04 0.03 0.09
Figure 2.4. Corporate Profits as a Percentage of GDP
SOURCE: Federal Reserve Bank of St. Louis (FRED).21
The decline in labor’s share of national income is by no means limited to the United States. In a June 2013 research paper,22 economists Loukas Karabarbounis and Brent Neiman, both of the University of Chicago’s Booth School of Business, analyzed data from fifty-six different countries and found that thirty-eight demonstrated a significant decline in labor’s share. In fact, the authors’ research showed that Japan, Canada, France, Italy, Germany, and China all had larger declines than the United States over a ten-year period. The decline in labor’s share in China—the country that most of us assume is hoovering up all the work—was especially precipitous, falling at three times the rate in the United States.
Karabarbounis and Neiman concluded that these global declines in labor’s share resulted from “efficiency gains in capital producing sectors, often attributed to advances in information technology and the computer age.”23 The authors also noted that a stable labor share of income continues to be “a fundamental feature of macroeconomic models.”24 In other words, just as economists do not seem to have fully assimilated the implications of the circa-1973 divergence of productivity and wage growth, they are apparently still quite happy to build Bowley’s Law into the equations they use to model the economy.
Declining Labor Force Participation
A separate trend has been the decline in labor force participation. In the wake of the 2008–9 economic crisis, it was often the case that the unemployment rate fell not because large numbers of new jobs were being created, but because discouraged workers exited the workforce. Unlike the unemployment rate, which counts only those people actively seeking jobs, labor-force participation offers a graphic illustration that captures workers who have given up.
As Figure 2.5 shows, the labor force participation rate rose sharply between 1970 and 1990 as women flooded into the workforce. The overall trend disguises the crucial fact that the percentage
Is This Time Different? 41
Figure 2.5. Labor Force Participation Rate
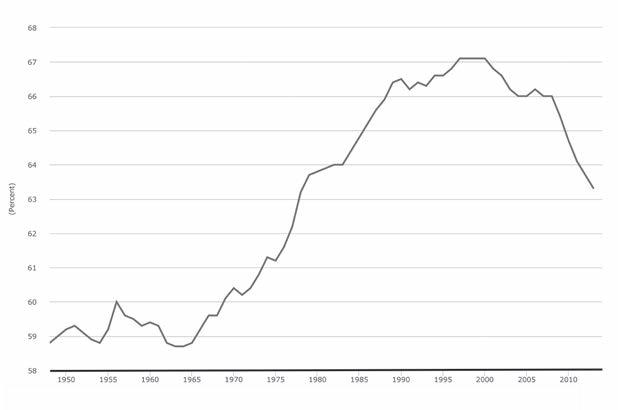
SOURCE: US Bureau of Labor Statistics and Federal Reserve Bank of St. Louis (FRED).25
of men in the labor force has been in consistent decline since 1950, falling from a high of about 86 percent to 70 percent as of 2013. The participation rate for women peaked at 60 percent in 2000; the overall labor force participation rate peaked at about 67 percent that same year.26
Labor force participation has been falling ever since, and although this is due in part to the retirement of the baby boom generation, and in part because younger workers are pursuing more education, those demographic trends do not fully explain the decline. The labor force participation rate for adults between the ages of twenty-five and fifty-four—those old enough to have completed college and even graduate school, yet too young to retire—has declined from about 84.5 percent in 2000 to just over 81 percent in 2013.27 In other words, both the overall labor force participation rate and the participation rate for prime working-age adults have fallen by about three percentage points since 2000—and about half of that decline came before the onset of the 2008 financial crisis.
RISE OF THE ROBOTS 42
1950 1955 1960 1965 1970 1975 1985 1980 1990 1995 2000 2005 2010 (Percent) 58 59 60 61 62 63 64 65 66 67 68
The decline in labor force participation has been accompanied by an explosion in applications for the Social Security disability program, which is intended to provide a safety net for workers who suffer debilitating injuries. Between 2000 and 2011, the number of applications more than doubled, from about 1.2 million per year to nearly 3 million per year.28 As there is no evidence of an epidemic of workplace injuries beginning around the turn of the century, many analysts suspect that the disability program is being misused as a kind of last-resort—and permanent—unemployment insurance program. Given all this, it seems clear that something beyond simple demographics or cyclical economic factors is driving people out of the labor force.
Diminishing Job Creation, Lengthening Jobless Recoveries, and Soaring Long-Term Unemployment
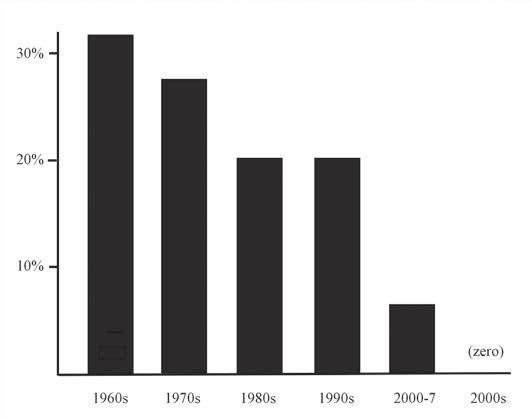
Over the past half-century, the US economy has become progressively less effective at creating new jobs. Only the 1990s managed to—just barely—keep up with the previous decade’s job growth, and that was largely due to the technology boom that occurred in the second half of the decade. The recession that began in December 2007 and the ensuing financial crisis were a total disaster for job creation in the 2000s; the decade ended with virtually the same number of jobs that had existed in December 1999. Even before the Great Recession hit, however, the new century’s first decade was already on track to produce by far the worst percentage growth in employment since World War II.
As Figure 2.6 shows, the number of jobs in the economy had increased by only about 5.8 percent through the end of 2007. Prorating that number for the entire decade suggests that, if the economic crisis had not occurred, the 2000s would likely have finished with a roughly 8 percent job creation rate—less than half of the percentage increase seen in the 1980s and ’90s.
That miserable job creation performance is especially disturbing in light of the fact that the economy needs to generate large numbers
Is This Time Different? 43
SOURCE: US Bureau of Labor Statistics and Federal Reserve Bank of St. Louis (FRED).29
of new jobs—between 75,000 and 150,000 per month, depending on one’s assumptions—just to keep up with population growth.30 Even when the lower estimate is employed, the 2000s still resulted in a deficit of about 9 million jobs over the course of the decade.
Clear evidence also shows that when a recession knocks the wind out of the economy, it is taking longer and longer for the job market to recover. Temporary layoffs have given way to jobless recoveries. A 2010 research report by the Federal Reserve Bank of Cleveland found that recent recessions have seen a dramatic decline in the rate at which unemployed workers are able to land new jobs. In other words, the problem is not that more jobs are being destroyed in downturns; it is that fewer are being created during recoveries. After the onset of the Great Recession in December 2007, the unemployment rate continued to rise for nearly two years, ultimately increasing by a full five percentage points and peaking at 10.1 percent. The Cleveland Fed’s analysis found that the increased difficulty faced by workers
RISE OF THE ROBOTS 44
Figure 2.6. US Job Creation by Decade
1960s 1970s 1980s 1990s 2000-7 2000s 30% 20% 10%
finding new jobs accounted for over 95 percent of that 5 percent jump in the unemployment rate.31 This, in turn, has led to a huge jump in the long-term unemployment rate, which peaked in 2010, when about 45 percent of workers had been out of work for more than six months.32
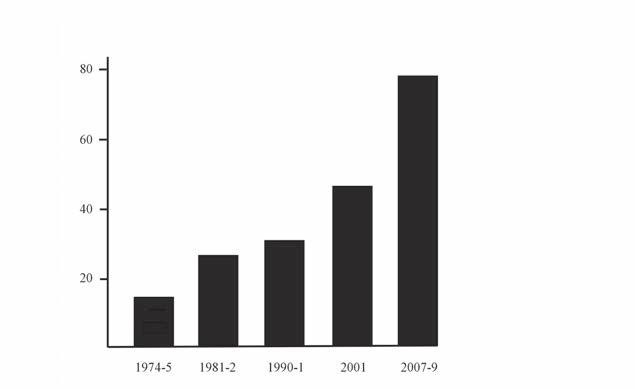
Figure 2.7 shows the number of months it took for the labor market to recover from recent recessions. The Great Recession resulted in a monstrous jobless recovery; it took until May 2014—a full six and a half years after the start of the downturn—for employment to return to its pre-recession level.
Extended unemployment is a debilitating problem. Job skills erode over time; the risk that workers will become discouraged increases, and many employers seem to actively discriminate against the long-term unemployed, often refusing even to consider their résumés. Indeed, a field experiment conducted by Rand Ghayad, a PhD candidate in economics at Northeastern University, showed
SOURCE: US Bureau of Labor Statistics and Federal Reserve Bank of St. Louis (FRED).33
Is This Time Different? 45
Figure 2.7. US Recessions: Months for Employment to Recover (Measured from Start of Recession)
80 60 40 20 1974–5 1981–2 1990–1 2001 2007–9
that a recently unemployed applicant with no industry experience was actually more likely to be called in for a job interview than someone with directly applicable experience who had been out of work for more than six months.34 A separate report by the Urban Institute found that the long-term unemployed are not appreciably different from other workers, suggesting that becoming one of the long-term unemployed—and suffering the stigma that attaches to that category—may largely be a matter of bad luck.35 If you happen to lose your job at an especially unfavorable time and then fail to find a new position before the dreaded six-month mark (a real possibility if the economy is in free fall), your prospects diminish dramatically from that point on—regardless of how qualified you may be.
Soaring Inequality
The divide between the rich and everyone else has been growing steadily since the 1970s. Between 1993 and 2010 over half of the increase in US national income went to households in the top 1 percent of the income distribution.36 Since then, things have only gotten worse. In an analysis published in September 2013, economist Emmanuel Saez of the University of California, Berkeley, found that an astonishing 95 percent of total income gains during the years 2009 to 2012 were hoovered up by the wealthiest 1 percent.37 Even as the Occupy Wall Street movement has faded from the scene, the evidence shows pretty clearly that income inequality in the United States is not just high—it may well be accelerating.
While inequality has been increasing in nearly all industrialized countries, the United States remains a clear outlier. According to the Central Intelligence Agency’s analysis, income inequality in America is roughly on a par with that of the Philippines and significantly exceeds that of Egypt, Yemen, and Tunisia.38 Studies have also found that economic mobility, a measure of the likelihood that the children of the poor will succeed in moving up the income scale, is significantly lower in the United States than in nearly all European nations.
RISE OF THE ROBOTS 46
In other words, one of the most fundamental ideas woven into the American ethos—the belief that anyone can get ahead through hard work and perseverance—really has little basis in statistical reality.
From the perspective of any one individual, inequality can be very difficult to perceive. Most people tend to focus their attention locally. They worry about how they are doing relative to the guy next door as opposed to the hedge fund manager they will, in all likelihood, never encounter. Surveys have shown that most Americans vastly underestimate the existing extent of inequality, and when asked to select an “ideal” national distribution of income, they make a choice that, in the real world, exists only in Scandinavian social democracies.39 *
Nonetheless, inequality has real implications that go far beyond simple frustration about your inability to keep up with the Joneses. Foremost is the fact that the overwhelming success of those at the extreme top seems to be correlated with diminishing prospects for nearly everyone else. The old adage that a rising tide lifts all boats gets pretty tired when you haven’t had a meaningful raise since the Nixon administration.
There is also an obvious risk of political capture by the financial elite. In the United States, to a greater degree than in any other advanced democracy, politics is driven almost entirely by money. Wealthy individuals and the organizations they control can mold government policy through political contributions and lobbying, often producing outcomes that are clearly at odds with what the public actually wants. As those at the apex of the income distribution become increasingly detached—living in a kind of bubble that insulates them almost entirely from the realities faced by typical Americans—there
* This is true regardless of political party. In one study conducted by Dan Ariely of Duke University, over 90 percent of Republicans and 93 percent of Democrats preferred an income distribution similar to that of Sweden over that of the United States.
Is This Time Different? 47
is a real risk that they will be unwilling to support investment in the public goods and infrastructure upon which everyone else depends. The soaring fortunes of those at the very top may ultimately represent a threat to democratic governance. However, the most immediate problem for most middle- and working-class people is that job market opportunities are broadly deteriorating.
Declining Incomes and Underemployment for Recent College Graduates
A four-year college degree has come to be almost universally viewed as an essential credential for entry into the middle class. As of 2012, average hourly wages for college graduates were more than 80 percent higher than the wages of high school graduates.40 The college wage premium is a reflection of what economists call “skill biased technological change” (SBTC).* The general idea behind SBTC is that information technology has automated or deskilled much of the work handled by less educated workers, while simultaneously increasing the relative value of the more cognitively complex tasks typically performed by college graduates.
Graduate and professional degrees convey still higher incomes, and in fact, since the turn of the century, things are looking quite a bit less rosy for young college graduates who don’t also have an advanced degree. According to one analysis, incomes for young workers with only a bachelor’s degree declined nearly 15 percent between 2000 and 2010, and the plunge began well before the onset of the 2008 financial crisis.
* SBTC and the college wage premium offer a partial explanation for increasing income inequality. However, since nearly a third of the adult US population has a college degree, if this were the only thing going on, it would imply a much tamer form of inequality than actually exists. The real action is at the very top— and things become more extreme the higher you go. The outsized fortunes of the top 1 (or .01) percent cannot reasonably be attributed to better education or training.
RISE OF THE ROBOTS 48
Recent college graduates are also underemployed. By some accounts, fully half of new graduates are unable to find jobs that utilize their education and offer access to the crucial initial rung on the career ladder. Many of these unlucky graduates will probably find it very difficult to move up into solid middle-class trajectories.
To be sure, college graduates have, on average, maintained their income premium over workers with only a high school education, but this is largely because the prospects for these less educated workers have become genuinely dismal. As of July 2013, fewer than half of American workers who were between the ages of twenty and twentyfour and not enrolled in school had full-time jobs. Among nonstudents aged sixteen to nineteen only about 15 percent were working full-time.41 The return on investment for a college education may be falling, but it still nearly always beats the alternative.
Polarization and Part-Time Jobs
A further new problem is that the jobs being created during economic recoveries are generally worse than those destroyed by recessions. In a 2012 study, economists Nir Jaimovich and Henry E. Siu analyzed data from recent US recessions and found that the jobs mostly likely to permanently disappear are the good middle-class jobs, while the jobs that tend to get created during recoveries are largely concentrated in low-wage sectors like retail, hospitality, and food preparation and, to a lesser extent, in high-skill professions that require extensive training.42 This has been especially true over the course of the recovery that began in 2009.43
Many of these new low-wage jobs are also part-time. Between the start of the Great Recession in December 2007 and August 2013, about 5 million full-time jobs were vaporized, but the number of part-time jobs actually increased by approximately 3 million.44 That increase in part-time work has occurred entirely among workers who have had their hours cut or who would like a full-time job but are unable to find one.
Is This Time Different? 49
The propensity for the economy to wipe out solid middle-skill, middle-class jobs, and then to replace them with a combination of low-wage service jobs and high-skill, professional jobs that are generally unattainable for most of the workforce, has been dubbed “job market polarization.” Occupational polarization has resulted in an hourglass-shaped job market where workers who are unable to land one of the desirable jobs at the top end up at the bottom.
This polarization phenomenon has been studied extensively by David Autor, an economist at the Massachusetts Institute of Technology. In a 2010 paper, Autor identifies four specific mid-range occupational categories that have been especially hard-hit as polarization has unfolded: sales, office/administrative, production/craft/repair, and operators/fabricators/laborers. Over the thirty years between 1979 and 2009, the percentage of the US workforce employed in these four areas declined from 57.3 percent to 45.7 percent, and there was a noticeable acceleration in the rate of job destruction between 2007 and 2009.45 Autor’s paper also makes it clear that polarization is not limited to the United States, but has been documented in most advanced, industrial economies; in particular, sixteen countries within the European Union have seen a significant decline in the percentage of the workforce engaged in mid-range occupations over the thirteen years between 1993 and 2006.46
Autor concludes that the primary driving forces behind job market polarization are “the automation of routine work and, to a smaller extent, the international integration of labor markets through trade and, more recently, offshoring.”47 In their more recent paper showing the relationship between polarization and jobless recoveries, Jaimovich and Siu point out that fully 92 percent of the job losses in mid-range occupations have occurred within a year of a recession.48 In other words, polarization is not necessarily something that happens according to a grand plan, nor is it a gradual and continuous evolution. Rather, it is an organic process that is deeply intertwined with the business cycle; routine jobs are eliminated for economic
RISE OF THE ROBOTS 50
reasons during a recession, but organizations then discover that everadvancing information technology allows them to operate successfully without rehiring the workers once a recovery gets under way. Chrystia Freeland of Reuters puts it especially aptly, writing that “the middle-class frog isn’t being gradually boiled; it is being periodically grilled at a very high heat.”49
A Technology Narrative
It’s fairly easy to piece together a hypothetical narrative that puts advancing technology—and the resulting automation of routine work— front and center as the explanation for these seven deadly economic trends. The golden era from 1947 to 1973 was characterized by significant technological progress and strong productivity growth. This was before the age of information technology; the innovations during this period were primarily in areas like mechanical, chemical, and aerospace engineering. Think, for example, of how airplanes evolved from employing internal combustion engines driving propellers to much more reliable and better-performing jet engines. This period exemplified what is written in all those economics textbooks: innovation and soaring productivity made workers more valuable—and allowed them to command higher wages.
In the 1970s, the economy received a major shock from the oil crisis and entered an unprecedented period of high unemployment combined with high inflation. Productivity fell dramatically. The rate of innovation also plateaued as continued technological progress in many areas became more difficult. Jet aircraft changed very little. Both Apple and Microsoft were founded during this period, but the full impact of information technology was still far in the future.
The 1980s saw increased innovation, but it became more focused in the information technology sector. This type of innovation had a different impact on workers; for those with the right skill set, computers increased their value, just as the innovations in the postwar
Is This Time Different? 51
era had done for nearly everyone. For many other workers, however, computers had a less positive effect. Some types of jobs began to be either destroyed entirely or deskilled, making workers less valuable at least until they were able to retrain for jobs that leveraged computer technology. As information technology gained in importance, labor’s share of income gradually began to decline. Jet aircraft remained largely unchanged from the 1970s but increasingly used computers in their instrumentation and controls.
The 1990s saw IT innovation accelerate even more, and the Internet took off in the second half of the decade. The trends that began in the 1980s continued, but the decade also saw the tech bubble and the creation of millions of new jobs, especially in the IT sector. These were good jobs that often involved administering the computers and networks that were rapidly becoming critical to businesses of all sizes. As a result, wages did better in this period, but still fell well short of productivity growth. Innovation was centered even more on IT. The recession of 1990–1991 was followed by a jobless recovery as workers, many of whom had lost good mid-range jobs, struggled to find new positions. The job market gradually became more polarized. Jet aircraft were still essentially similar to the designs of the 1970s; however, they now had “fly by wire” systems, in which computers moved the control surfaces in response to the pilots’ inputs, as well as increased flight automation.
In the years following 2000, information technology continued its acceleration and productivity rose as businesses got better at taking full advantage of all the new innovations. Many of those good jobs created in the 1990s began to disappear as corporations automated or offshored jobs, or began to outsource their IT departments to centralized “cloud” computing services. Throughout the economy, computers and machines were increasingly replacing workers rather than making them more valuable, and wage increases fell far short of growth in productivity. Both the share of national income going to labor and the labor force participation rate declined dramatically.
RISE OF THE ROBOTS 52
The job market continued to polarize, and jobless recoveries became the norm. Jet aircraft still used the same basic designs and propulsion systems as in the 1970s, but computer-aided design and simulation had resulted in many incremental improvements in areas such as fuel efficiency. The information technology incorporated into aircraft became even more sophisticated and routinely included full-flight automation, which allowed the planes to take off, fly to a destination, and then land—all without human intervention.
Now, you may quite rightfully object to that story as being overly simplistic—or perhaps even completely wrong. After all, wasn’t it really globalization, or maybe Reaganomics, that led to all our problems? As I said, this was intended to be a hypothetical narrative: a simple story to help clarify the argument for the importance of technology in these seven documented economic trends. Each of these trends has been studied by teams of economists and others who have attempted to discover the underlying causes, and technology has often been implicated as a contributing, if not always the primary, factor. However, it is when all seven trends are considered together that the argument for advancing information technology as a disruptive economic force is most compelling.
Aside from advancing information technology, there are three other primary possibilities that might conceivably have contributed to all, or at least most, of our seven economic trends: globalization, the growth of the financial sector, and politics (in which I include factors like deregulation and the decline of organized labor).
Globalization
That globalization has had a dramatic impact on certain industries and regions is undeniable—just look at America’s rustbelt. But globalization, and in particular trade with China, alone could not have caused wages for most American workers to stagnate over four decades.
First, global trade directly impacts workers who are employed in the tradable sector—in other words, in industries that produce
Is This Time Different? 53
goods or services that can be transported to other locations. The vast majority of American workers now work in nontradable areas like government, education, health care, food services, and retail. For the most part, these people are not directly competing with overseas workers, so globalization is not driving down their wages.
Second, although it may appear that virtually everything sold at Walmart is made in China, most American consumer spending stays in the United States. A 2011 analysis by Galina Hale and Bart Hobijn, two economists at the Federal Reserve Bank of San Francisco, found that 82 percent of the goods and services Americans purchase are produced entirely in the United States; this is largely because we spend the vast majority of our money on nontradable services. The total value of imports from China amounted to less than 3 percent of US consumer spending.50
It is undoubtedly true that, as Figure 2.8 shows, the fraction of American workers employed in manufacturing has fallen
(Thousands of Persons/Thousands of Persons)
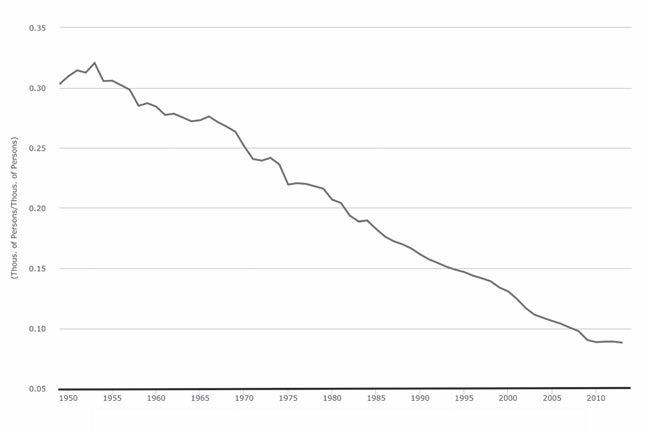
SOURCE: US Bureau of Labor Statistics and Federal Reserve Bank of St. Louis (FRED).51
RISE OF THE ROBOTS 54
Figure 2.8. Percentage of US Workers in Manufacturing
1950 1955 19601960 1965 1970 1975 1985 1980 1990 1995 2000 2005 2010 0.05 0.10 0.15 0.20 0.25 0.30 0.35
dramatically since the early 1950s. This trend began decades before enactment of the North American Free Trade Agreement (NAFTA) in the 1990s and the rise of China in the 2000s. In fact, the decline seems to have halted at the end of the Great Recession as manufacturing employment has actually outperformed the job market as a whole.
A potent force has been very consistently eliminating jobs in the manufacturing sector. That force is advancing technology. Even as the number of manufacturing jobs has been steadily declining as a percentage of total employment, the inflation-adjusted value of the goods manufactured in the United States has dramatically increased over time. We are making more stuff, but doing so with fewer and fewer workers.
Financialization
In 1950, the US financial sector represented about 2.8 percent of the overall economy. By 2011 finance-related activity had grown more than threefold to about 8.7 percent of GDP. The compensation paid to workers in the financial sector has also exploded over the past three decades, and is now about 70 percent more than the average for other industries.52 The assets held by banks have ballooned from about 55 percent of GDP in 1980 to 95 percent in 2000, while the profits generated in the financial sector have more than doubled from an average of about 13 percent of all corporate profits in the 1978–1997 timeframe to 30 percent in the period between 1998 and 2007.53 No matter how you choose to measure it, finance has grown dramatically as a share of economic activity in the United States and, to a somewhat less spectacular degree, in nearly all industrialized countries.
The primary complaint leveled against the financialization of the economy is that much of this activity is geared toward rent seeking. In other words, the financial sector is not creating real value or adding to the overall welfare of society; it is simply finding ever more
Is This Time Different? 55
creative ways to siphon profits and wealth from elsewhere in the economy. Perhaps the most colorful articulation of this accusation came from Rolling Stone’s Matt Taibbi in his July 2009 takedown of Goldman Sachs that famously labeled the Wall Street firm “a great vampire squid wrapped around the face of humanity, relentlessly jamming its blood funnel into anything that smells like money.”54
Economists who have studied financialization have found a strong correlation between the growth of the financial sector and inequality as well as the decline in labor’s share of national income.55 Since the financial sector is, in effect, imposing a kind of tax on the rest of the economy and then reallocating the proceeds to the top of the income distribution, it’s reasonable to conclude that it has played a role in a number of the trends we’ve looked at. Still, it seems hard to make a strong case for financialization as the primary cause of, say, polarization and the elimination of routine jobs.
It’s also important to realize that growth in the financial sector has been highly dependent on advancing information technology. Virtually all of the financial innovations that have arisen in recent decades—including, for example, collateralized debt obligations (CDOs) and exotic financial derivatives—would not have been possible without access to powerful computers. Likewise, automated trading algorithms are now responsible for nearly two-thirds of stock market trades, and Wall Street firms have built huge computing centers in close physical proximity to exchanges in order to gain trading advantages measured in tiny fractions of a second. Between 2005 and 2012, the average time to execute a trade dropped from about 10 seconds to just 0.0008 seconds,56 and robotic, high-speed trading was heavily implicated in the May 2010 “flash crash” in which the Dow Jones Industrial Average plunged nearly a thousand points and then recovered for a net gain, all within the space of just a few minutes.
Viewed from this perspective, financialization is not so much a competing explanation for our seven economic trends; it is rather— at least to some extent—one of the ramifications of accelerating
RISE OF THE ROBOTS 56
information technology. In this, there is a strong cautionary note as we look to the future: as IT continues its relentless progress, we can be certain that financial innovators, in the absence of regulations that constrain them, will find ways to leverage all those new capabilities—and, if history is any guide, it won’t necessarily be in ways that benefit society as a whole.
Politics
In the 1950s, more than a third of the US private sector workforce was unionized. By 2010, that number had declined to about 7 percent.57 At the height of its power, organized labor was a powerful advocate for the middle class as a whole. The fact that workers were able to consistently capture the lion’s share of productivity growth in the 1950s and ’60s can likely be attributed at least in part to the negotiating power of unions during that period. The situation today is very different; unions now struggle simply to maintain their existing membership.
The precipitous decline in the power of organized labor is one of the most visible developments associated with the rightward drift that has characterized American economic policy over the past three decades. In their 2010 book Winner Take All Politics, political scientists Jacob S. Hacker and Paul Pierson make a compelling case for politics as the primary driver of inequality in the United States. Hacker and Pierson point to 1978 as the pivotal year when the American political landscape began to shift under a sustained and organized assault from conservative business interests. In the decades that followed, industries were deregulated, top marginal tax rates on the wealthy and on corporations were cut to historic lows, and workplaces were made increasingly inhospitable to union organization. Much of this was driven not by electoral politics but, rather, by continuous lobbying on the part of business interests. As the power of organized labor withered, and as the number of lobbyists in Washington exploded, the day-to-day political warfare in the capital became increasingly asymmetric.
Is This Time Different? 57
While the political situation in the United States seems uniquely detrimental to the middle class, evidence for the impact of advancing technology can be found in a wide range of developed and developing nations. Inequality is increasing in nearly all industrialized countries, while the share of national income claimed by labor is generally falling. Job market polarization has been observed in a majority of European nations. And in Canada—where organized labor remains a powerful national force—inequality is rising, median household incomes have fallen in real terms since 1980, and private sector union membership has declined as manufacturing jobs have disappeared.58
To some extent, the question here is one of categorization: if a nation fails to implement policies designed to mitigate the impact of structural changes brought on by advancing technology, should we label that as a problem caused by technology, or politics? Regardless, there is little question that the United States stands alone in terms of the political decisions it has made; rather than simply failing to enact policies that might have slowed the forces driving the country toward higher levels of inequality, America very often has made choices that have effectively put a wind at the back of those forces.
Looking to the Future
Thedebateovertheprimarycausesofthesoaringinequalityanddecadeslong wage stagnation that have developed in the United States is likely to continue unabated, and because it touches on intensely polarizing issues—organized labor, tax rates on the wealthy, free trade, the proper role of government—the dialogue is sure to be colored by ideology. To my mind, the evidence I’ve presented here demonstrates that information technology has played a significant—though not necessarily dominant—role over the past few decades. Beyond that, I’m content to leave it to economic historians to delve into the data and perhaps someday shine a more definitive light on the precise forces involved in getting us to this point. The real question—and the
RISE OF THE ROBOTS 58
primary subject of this book—is, What will be most important in the future? Many of the forces that heavily impacted the economy and political environment over the past half-century have largely played out. Unions outside the public sector have been decimated. Women who want careers have entered the workforce or enrolled in colleges and professional schools. There is evidence that the drive toward factory offshoring has slowed significantly, and in some cases, manufacturing is returning to the United States.
Among the forces poised to shape the future, information technology stands alone in terms of its exponential progress. Even in nations whose political environments are far more responsive to the welfare of average workers, the changes wrought by technology are becoming increasingly evident. As the technological frontier advances, many jobs that we would today consider nonroutine, and therefore protected from automation, will eventually be pulled into the routine and predictable category. The hollowed-out middle of the already polarized job market is likely to expand as robots and self-service technologies eat away at low-wage jobs, while increasingly intelligent algorithms threaten higher-skill occupations. Indeed, a 2013 study by Carl Benedikt Frey and Michael A. Osborne at the University of Oxford concluded that occupations amounting to nearly half of US total employment may be vulnerable to automation within roughly the next two decades.59
While accelerating information technology is nearly certain to have an outsized impact on the future economy and job market, it will remain deeply intertwined with other powerful forces. The line between technology and globalization will blur as higher-skill jobs become more vulnerable to electronic offshoring. If, as seems likely, advancing technology continues to drive the United States and other industrialized countries toward ever higher inequality, then the political influence wielded by the financial elite can only increase. This may make it even more difficult to enact policies that might serve to counteract the structural shifts occurring in the economy
Is This Time Different? 59
and improve the prospects for those in the middle and bottom of the income distribution.
In my 2009 book The Lights in the Tunnel, I wrote that “while technologists are actively thinking about, and writing books about, intelligent machines, the idea that technology will ever truly replace a large fraction of the human workforce and lead to permanent, structural unemployment is, for the majority of economists, almost unthinkable.” To their credit, some economists have since begun to take the potential for widespread automation more seriously. In their 2011 ebook Race Against the Machine, Erik Brynjolfsson and Andrew McAfee of the Massachusetts Institute of Technology helped bring these ideas into the economic mainstream. Prominent economists including Paul Krugman and Jeffrey Sachs have likewise written about the possible impact of machine intelligence.60 Nonetheless, the idea that technology might someday truly transform the job market and ultimately demand fundamental changes to both our economic system and the social contract remains either completely unacknowledged or at the very fringes of public discourse.
Indeed, among practitioners of economics and finance there is often an almost reflexive tendency to dismiss anyone who argues that this time might be different. This is very likely the correct instinct when one is discussing those aspects of the economy that are primarily driven by human behavior and market psychology. The psychological underpinnings of the recent housing bubble and bust were almost certainly little different from those that have characterized financial crises throughout history. Many of the political machinations of the early Roman republic could probably be dropped seamlessly onto the front page of today’s Politico. These things never really change. It would be a mistake, however, to apply that same reasoning to the impact of advancing technology. Up until the moment the first aircraft achieved sustained powered flight at Kitty Hawk, North Carolina, it was an incontrovertible fact—supported by data stretching back to the beginning of time—that human beings, strapped into
RISE OF THE ROBOTS 60
heavier-than-air contraptions, do not fly. Just as that reality shifted in an instant, a similar phenomenon plays out continuously in nearly every sphere of technology. This time is always different where technology is concerned: that, after all, is the entire point of innovation. Ultimately, the question of whether smart machines will someday eclipse the capability of average people to perform much of the work demanded by the economy will be answered by the nature of the technology that arrives in the future—not by lessons gleaned from economic history.
IN THE NEXT CHAPTER, we’ll examine the nature of information technology and its relentless acceleration, the characteristics that set it apart, and the ways in which it is already transforming important spheres of the economy.
Is This Time Different? 61
