See discussions, stats, and author profiles for this publication at: https://www.researchgate.net/publication/254452217
From Marx to Morgan Stanley: Inequality and Financial Crises
Article · January 2010 CITATIONS
2 authors:

Mah Hui Lim Penang Institute
37 PUBLICATIONS 335 CITATIONS
SEE PROFILE
Some of the authors of this publication are also working on these related projects:

Macroeconomic surveillance View project
2005 and 2017 projects View project

Hoe Ee Khor
ASEAN+3 Macroeconomic Research Office
24 PUBLICATIONS 165 CITATIONS
SEE PROFILE
61
0 READS
All content following this page was uploaded by Hoe Ee Khor on 24 May 2014. The user has requested enhancement of the downloaded file.

TURKISH ECONOMIC ASSOCIATION
DISCUSSION PAPER 2010/13 http ://www.tek. org.tr FROM MARX TO MORGAN STANLEY: INEQUALITY AND FINANCIAL CRISIS
Michael Lim Mah-Hui and Khor Hoe Ee
December, 2010
From Marx to Morgan Stanley: Inequality and Financial Crisis*
Michael Lim Mah‐Hui and Khor Hoe Ee limmahhui@gmail.comAbstract: Despite robust growth, rising inequality is widespread in many countries. At the same time financial instability and crises are occurring with greater frequency and severity. These two phenomena are related to the contest for a greater share of economic output between labor and capital, with capital gaining a greater share over the past few decades. As a result, there is a tendency towards falling‐consumption by the average household and rising savings by a rich minority that could cause stagnation in the economy. This contradiction between falling consumption and rising saving is “resolved” through the financial system by the recycling of funds from the rich minority to the average household in the form of credit. Financial engineering in the U.S. exacerbated this process that led to excessive lending and borrowing, and the creation of an unsustainable debt and asset bubble that eventually imploded. There is a similar tendency towards greater inequality, falling share of consumption, and rising share of savings and investment in China. However, in the context of a globalized world economy, the contradiction is “resolved” through a recycling of the “excess savings” from China to the U.S. adding to the debt and asset bubble in the U.S.
Forthcoming, Special Issue of Development and Change, January 2011
Introduction
Globalization in its most basic sense refers to the increasing integration of the world’s economies through trade, capital, labor and information flows. With globalization have come increases in productivity and wealth generation. World trade rose faster than world GDP. But globalization has also been accompanied by rising inequality not only between countries but even more so within many countries (Milanovic, 2002; Wade, 2004). At the same time with liberalization of the financial sector, beginning in the United States and later exported to most countries, and also the liberalization of capital flows between countries, we have witnessed an increase in the frequency and severity of financial crises. A World Bank study noted that there were 137 banking crisis between 1970 and 2007, averaging 3.7 per year (Caprio et al 2003). A major banking crisis breaks out every ten years with almost clockwork precision. In the late 1980s, it was the savings and loans crisis in the United States, in the 1990s, it was the Japanese banking crisis and the Asian Financial Crisis, and in late 2000s, it was the recent global financial crisis and recession. 1 Minsky (1986) had presciently argued that as the financial sector moves increasingly from hedge financing to speculative and Ponzi financing, financial fragility becomes more pronounced and financial crisis becomes more frequent.
Among the macro‐economic imbalances that have been put forward to explain the Great Financial Crisis (“GFC”), the trade imbalance between current account
1 We shall refer to this recent financial crisis as the Great Financial Crisis (GFC)
1
surplus countries like China and other Asian countries, and current account deficit countries, most notably the United States, has been cited as the most important cause. Two other structural imbalances that are equally important are less discussed; these are the imbalance between the financial sector and the real economy, and the imbalance in income and wealth between the rich and the poor.2
Inequality Preceded the Great Depression and the Great Financial Crisis
It is instructive to note that the Great Depression of the 1930s was preceded by rising and extreme inequality. See Figure 1. Among the structural weaknesses preceding the Great Depression identified by Galbraith (1997: 177) was high income inequality ‐ in 1929, the top five per cent of the population received one third of all personal income. In recent years, the U.S. has reached a level of inequality higher than that of the pre‐Great Depression period The Gini coefficient of U.S was 0.47 in 2006 compared to an estimated 0.45 in 1929 (Wikipedia, n.d.). But this phenomenon has been largely forgotten in most discussions of the GFC with a few exceptions like Milanovic (2009), Lim (2009) Lim and Lim (2010), Krugman (2010), Klein (2010), Rajan (2010).

Source: Krugman, 2010.
2 These three imbalances are discussed in Lim and Lim (2010).
2
Figure 1
A key to understanding the long‐term structural causes of the GFC is the link between growth, inequality, financial innovation and debt. Important structural changes were happening in the U.S. economy after World War II. After an initial period of robust growth (1940s to 1960s) that saw a rise in real wages and decline in inequality, economic growth began to decelerate and the economy became increasingly driven by debt and asset inflation rather than income growth. Between 1960 and 2007, as the U.S. GDP rose 27 times from $526 billion to $13.9 trillion; total debt of the economy leapt by 64 times from $781 billion to $49.9 trillion. See Table 1. Even more significant is the composition of the total debt. Financial debt increased 490 times, household debt 64 times, non‐financial corporate debt 53 times and government debt 24 times.
Table 1: U.S. GDP and Domestic Debt by Sectors, 1960 – 2007.
Domestic Debt by Sector
US$ billions US$ billions US$ billions US$ billions US$ billions US$ billions
billions
billions 1960 526 781 3320121630823 234 1965 719 1,107 6230533936538 367 1970 1,0381,600 12851445745052 642 1975 1,6382,619 26086473466397 1,124 1980 2,7894,725 5781,4781,3961,079 193 2,056 1985 4,2208,623 1,2572,5782,2782,268 243 3,835 1990 5,80313,769 2,6143,7533,5983,486 318 6,367 1995 7,39818,475 4,2344,1344,8574,684 567 8,368 2000 9,81727,143 8,1456,5897,0114,583 815 14,734 2005 12,43441,244 12,9698,47211,7406,556 1,512 21,441 2007 13,97149,882 16,15510,58813,8157,313 2,016 26,743 Growth x Time 1960 ‐ 2007 27 64 490 53 64 24 88 114
Source: Economic Report of President (2008): Table B‐1; Federal Reserve System, Board of Governors, Table L.1 Credit Market Debt Outstanding
Income and Wealth Inequality
During this period (1970 to 2006), real wages of ordinary workers stagnated and inequality worsened by any number of measures. The Gini coefficient for income deteriorated rising from 0.35 to 0.46 putting the U.S. closer to developing countries like Malaysia and Guatemala (0.48), Argentina (0.52), than to developed countries like Canada (0.33) and Japan (0.25). This meant that the top 2.7% of household earned 20% of total income while the bottom 6% earned only 0.3%. Growth in real income was heavily concentrated in the top 1%. Saez (2008) showed that between 1993 and 2006, the top 1% of income earners captured half of the overall economic growth, with the problem worsening under
3
GDP Total Debt Financial Sector Non‐Financial Corp Sector
Dom Fin
Household Sector Government: Local, State, Fed Rest of World
+ Non‐Fin Corp Debt
US$
US$
the Bush administration’s liberal tax relief for the rich wherein they captured three quarters of income growth.
Distribution of wealth is even more skewed with a Gini coefficient of 0.8, i.e., the top 20% owned 85%, the top 1% owned 33% of total wealth in 2001, whereas the bottom 80% owned only 15% of total wealth (Domhoff, 2006:2).
Wages Lagged Behind Productivity
Figure 2 shows the unequal distribution in another form. Between 1990 and 2005, federal minimum real wage fell 9% and production workers’ pay rose 4%, while CEO’s average compensation increased by 298%, outstripping the rise in corporate profits of 107%.
Figure 2: Cumulative % Change in Economic Indicators, from 1990 (in 2005 dollars)
Source: Domhoff: Wealth, Income, and Power, September 2005 (updated May 2009)
We are taught in Economics that wages of workers are determined by their marginal productivity. However recent trend belies this tenet. See Figure 3.
4
Figure 3
Productivity versus Compensation in the U.S. 1947 ‐ 2008
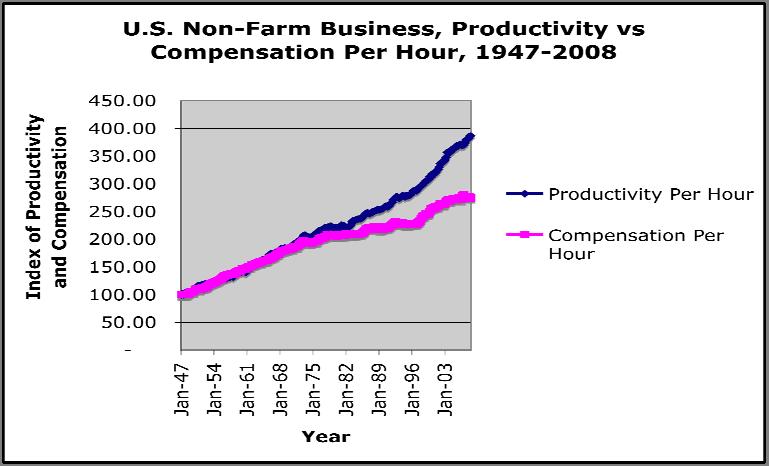
Source: Bureau of Economic Analysis
From mid 1940s to mid 1970s, there was a tight fit between productivity gains and real wages in the United States. But this began to diverge significantly after President Reagan came into power in the late 1970s when he dismantled the National Relations Board, broke up the air traffic control labor union, and renegotiated the accord between labor and capital in favor of the latter (Bowles et al. 1986). Capital’s share of income rose with successive tax cuts in dividends, capital gains, corporate earning and estate duties. In other words, the share of GDP going to labor versus capital is less a result of marginal productivity and more dependent on labor’s bargaining power that has weakened with the ascendance of neo‐liberal policies. Roach (2009: 100,143,242) showed that this was happening not only in the U.S. where real wages increased 1.6% while productivity rose 3.3% over 2001‐2006 but also in Japan, Canada and 12 European countries where the share of compensation of GDP fell from 56% to 53.7% between 2001 and 2006 whereas the share accruing to capital is at a record high. Roach argues that globalization did not confer equitable benefits to everyone; one of the great asymmetries in globalization is that in the contest between returns to labor and capital, the pendulum of economic returns has swung from labor to capital in the developed world and that this trend is unsustainable and has to reverse at some point in the future.3
3 Roach at the same time asserts that in the developing world, the benefits of growth have accrued mainly to labor (p 98). However, his own data on China weakens his earlier assertion. He says “Productivity growth in China’s industrial sector … surged at an average annual rate of nearly 20 percent over the 2000‐
5
Greenspan alluded to the same problem in his recent memoir. He says he is puzzled by this divergence between productivity and real wage increase and is worried that if real wages do not rise more quickly for the average U.S. worker, political support for free markets may be undermined (cited in Guha, 2007).
Marx, Morgan Stanley and the Global Labor Arbitrage
Labor’s bargaining power has been weakened by another important global trend, what Roach (2009:98‐102;184‐87) calls the great labor arbitrage. With China, India and many other emerging markets becoming more integrated into the world economy, globalization has sucked in vast pools of rural and unemployed workers into the labor market, putting downward pressure on wages in the developed countries. It was estimated that China, India and the former Soviet Union added about 1.5 billion new workers into the global economy (Ibid:144). Entry wages of average Chinese manufacturing workers have remained relatively flat during the last three decades of rapid growth because of the large pool of migrant workers from the countryside to the cities. While wages have grown quite rapidly for the skilled and experienced workers, average wages have still lagged behind the growth in labor productivity and are still low by international standards. Indeed, the average wage of the Chinese manufacturing workers was estimated at 57 cents per hour in 2002, which was only about 3% of average U.S. hourly pay. (Ibid:184). However, the supply of migrant workers has been dwindling in recent years, due in part to the impact of China’s one‐child policy on population growth. As a result, there has been increasing upward pressure on wages in the coastal cities, and factories have been moving inland and sourcing workers from the poorer neighboring countries like Vietnam. In recent months, however, pressure and demand for higher wages have led to strikes and lockout in various foreign owned factories in the coastal cities (Ramzy, 2010; Tabuchi, 2010; Pilling, 2010). This may signal the start of a secular trend toward higher real wages in China in line with productivity growth and a rising share of labor in the economic output.
What Roach calls the great labor arbitrage recalls what Marx wrote about over 200 years ago when he analyzed the dynamics of capitalism. 4 In its constant search for markets and profit, capitalism has to ceaselessly expand; it cannot
2004 interval. That’s well in excess of cost pressures implied by 12 percent gains in hourly compensation (Ibid:186). Also a World Bank study showed that between 1998 and 2005, the share China’s GDP going to labor dropped from 53% to 41% (cited in Economist, 2007).
4 It is interesting to note that some Wall Street financiers pay more attention to Marx’s contribution to the analysis of capitalism than most economists. A wealthy investment banker was quoted in the New Yorker magazine saying, “The longer I spend on Wall Street the more convinced I am that Marx was right…I am absolutely convinced that Marx’s approach is the best way to look at capitalism.” (Wheen, 1999:5).
6
stand still. The basic contradiction in capitalism is between capital and labor and their struggle for a bigger share of the economic pie. While this struggle may have been muted and transformed over time, it has not been eliminated and continues to drive the system. In its quest to enhance profit and to accumulate, capital must constantly look for ways to reduce the cost of labor, increase productivity and appropriate most of the surplus. One way is to use more machines and less labor – this not only raises the productivity of labor but also reduces the bargaining power of labor to the extent that the excess workforce are not re‐employed in other industries and increases the pool of unemployed.
Strategies to Enhance Profits
Other recent strategies of capital to augment profit and reduce labor costs include the use of temporary, part‐time and contractual workers who are paid lower wages, have few, if any, benefits, and weak bargaining power. Over the last decade, we have witnessed the phenomenon of “jobless recovery” (Akyuz, 2006). Charles McMillion, the president and chief economist of MBG Information Services in Washington, an expert on employment issues, said that there are now 3.4 million fewer private sector jobs in the U.S. than there were a decade ago. In the last 10 years, we’ve seen the worst job creation record since 1928 to 1938 (Herbert, 2010.) Even as the economy expanded, full time jobs did not grow as fast. Most of the new jobs created were of temporary, part‐time, or contractual nature and in the low wage sectors. These changes occurred not only in the United States but also in Japan, a country known for job security. In Japan, between 1991 and 1998, while the ratio of regular to total workforce for all workers rose slightly, this ratio fell for workers under thirty years of age, creating a chasm between older workers with security and younger workers without security (Yuji, 2006:33). This pattern is repeated in many European countries under the banner of increasing labor flexibility. In Spain, about a third of the workforce has little job security and benefits, pitted against the older workforce with permanent status (Schuman, 2010:21).
Another financial strategy to enhance profits is the widespread use of leveraged buy‐out where investors or management borrow heavily to buy out well‐run companies, ramp up their leverage, and ruthlessly trim the workforce to maximize profits and shareholders’ value. 5
With political onslaught waged by capital, supported by liberal state policies that reduce taxes in favor of capital, the introduction of new financial strategies to maximize profits, the entrants of billions of new workers from emerging economies into the global labor force, the economic returns of growth have accrued more to capital than to labor, creating greater inequality in most countries.
Inequality and Under‐consumption
5 See Lim and Lim (2010: 31‐36).
7
What does inequality have to do with economic and financial crisis? When wages of the majority of the work force are stagnating or kept low, there is a structural tendency towards under‐consumption that puts a drag on growth and profit. The production and accumulation process of capitalism is interrupted in the realization process, i.e., goods that are produced cannot be sold due to lack of effective demand from the majority whose incomes are low resulting in excess productive capacity and eventually a slow down in the economy and economic crisis. In other words, stagnation resulting from under consumption is inherent in the dynamics of capitalism reflecting the inability of capital to realize the full value of the commodities produced due to rising income inequality and the falling share of wages over time. 6
Inequality impacts on the economy in two ways. On the one hand, it results in under‐consumption or a lack of effective demand for the majority, and on the other hand, it concentrates income and wealth in the hands of a tiny minority with excess savings; the former has a high propensity but low ability to consume, while the latter has a high propensity to save and a high appetite for investments. 7
Over‐consumption and Debt Bubble, Excess Savings and Asset Bubble
We showed earlier how under‐consumption in the United States was “resolved” through the assumption of debt by the ordinary households leading to “over‐consumption”. Even as income and wages stagnated, personal consumption in the U.S. rose from about 60% of GDP in 1960s to a peak of 72% in 2007, concomitant with a decline in savings rate of about 10%, supported by household debt that grew 64 times from $216 billion to $13.8 trillion (equivalent to 100% of U.S. GDP). Financial innovations and some government policies 8 fuelled this debt bubble: credit card loans, home equity loans, and securitization of loans exponentially increased the total volume of loans, with the mistaken belief that the dispersion of loans to other investors who are able and willing to
6 Due to Marx’s unfinished work on Capital, the debate is unsettled over whether economic crises are due more to the tendency for rate of profit to fall arising from the increasing organic composition of capital, or the result of under‐consumption in the realization process. In the authors’ view, it is not an either or proposition that can be settled theoretically. Rather it is more productive to examine the empirical evidence to discern which trend is more evident in different historical situations, and the myriads of counter‐tendencies to these two trends. For a fuller discussion see, Sweezy (1946).
7 Krugman (2010) in his discussion on inequality and financial crisis also talks of under‐consumption and debt burden of the ordinary households but also attributes the crisis to “over‐consumption” by the upper reaches of society. It is our view that over‐investments in financial assets by the rich are more important than their over‐consumption of consumer goods in contributing to this crisis.
8 Rajan (2009) attributes a prominent role to government policies to provide housing to the poor through Gini Mae and Freddie Mac as an important cause of the crisis. He tends to downplay poor financial practices in this exercise.
8
bear the risks would make the financial system safer. 9 Home equity loans, in particular, became a major source of income for many, and a driver for the economy. In 2007, home equity loan totaled $487 billion (Economic Report of the President, 2008: Table B‐72). A Federal Reserve calculation showed net equity extractions from U.S. homes rose from 3% to 9% of disposable income from 2000 to 2006 (cited in Roach, 2009:59). Another estimate has it that without home equity withdrawals, U.S. GDP growth would have been negative in 2001 and 2002 and less than 1% between 2003 and 2005 (Wikinvest). When house prices started to decline in 2006, this boom turned into a bust and triggered the great financial crisis.
Under‐consumption and excess savings are two sides of the same coin. On one end is a majority with limited income and, on the other end, a tiny minority with excess savings and liquidity. As individuals, the rich can only consume so much; most of their income goes into savings and financial investments. They are not content with meager returns from fixed deposits, particularly in a low interest rate environment. Hence the excess savings is placed in the hands of bankers and financiers who churn out financial instruments to meet the growing demand for higher yields giving rise to the financial asset bubble. However, this debt and asset bubble is a mirage built on what Minsky classified as “Ponzi” financing because the escalating household debt is clearly not sustainable given the stagnation in real wages and is built on the assumption that the debt need not be repaid as long as property price continues to rise to match the growing debt.
Rise and Dominance of Finance Capitalism
While the basic dynamics of capitalism has not changed since Marx wrote his Capital, the forms and specifics of capitalism have changed significantly. Among the major changes are: the transition from petty‐enterprise capitalism to monopoly capitalism, and more recently, the eclipse of the real or productive economy by the financial industry way beyond what Marx could have imagined. In the United States, between 1960 and 2006, the financial sector’s share of GDP rose from 14% to 20% of GDP, almost twice as large as the next sector (wholesale and retail trade at 12%), while manufacturing sector’s share fell from 27% to 11% (Economic Report of the President: 1997, 2008). The financial sector accounted for 30% of the share of total corporate profits compared to 21% for the manufacturing sector (Bureau of Economic Analysis: n.d. Tables 6.16 A‐D).
The role of credit and fractional banking is central to the understanding of financial crisis. The GFC and other recent economic crises have shown that it is fragility and instability in the financial sector that is the cause of the most severe financial crises and not wage and consumer price inflation (Barbera, 2009). To the extent that central bankers have focused their eyes on consumer and wage inflation rather than asset inflation, they have been not only been remiss in their
9 Alan Greenspan was a major cheerleader for these financial innovations. See his speech “Risk Transfer and Financial Stability.” (2005).
9
duty but also were misguided in their belief in the efficient market hypothesis that markets always price assets efficiently and are self regulating.10
Financial innovations in the financial sector have exaggerated the economic and financial crisis by encouraging practices that reduce the margins of financial safety and increase the risk appetite of investors. In the U.S. inequality and financial speculation encouraged two types of bubbles – a debt bubble among households, certain sectors of industry that engaged in leveraged buy out, and financial institutions that actively use derivatives to leverage their exposure; and an asset bubble in equities, securities, and property. 11 As we have demonstrated earlier, despite stagnating income and wages in the United States, household could rack up consumption to its highest level at 72% of GDP. Ironically, the structural trend towards falling share of wages and under‐consumption in the U.S. was transformed into over‐consumption for the ordinary households (relative to their income) and over‐investment for the rich through a financial system that recycled the excess savings of the rich to the ordinary households and encouraged excessive risk taking through innovative financial engineering. The going was good while it lasted, but eventually the party came to an end in 2008
China – Inequality, Under‐consumption and Export Surplus
China’s Current Account Surplus
What about China? China has been often singled out and blamed for the financial crisis because of its huge current account surplus. According to many mainstream economists, the most prominent being Ben Bernanke, the present Chairman of the Federal Reserve System, the “savings glut” in Asia had contributed to the global trade imbalance and low interest rates causing the financial bubble and bust. 12 In discussing the cause of the admittedly unsustainable global current account imbalances, it is disingenuous to pin the responsibility on the current account surplus countries and not the current account deficit countries. From a global perspective, current account surpluses and current account deficits are flip sides of the same coin, i.e. the total value of current account surpluses must be equal to the total value of current account deficits for the world economy as a whole. Hence countries cannot run current account surpluses unless other countries are willing to run current account deficits. Whether a country runs a current account surplus or deficit depends on the aggregate expenditure of the country relative to its income. A country in current account deficit is spending more than its income and can therefore take policy actions to reduce its overall spending in order to reduce its deficit. While China has been accused of pursuing a weak exchange rate policy in order to
10 See Lim and Lim (2010:1‐9).
11 To the extent that the ordinary and poorer households participated in the housing boom made possible by government mortgage guarantees and securitization, they also helped to fuel the property asset bubble.
12 See his speech, “The Global Savings Glut and the U.S. Current Account Deficit” (2005).
10
boost its exports leading to its current account surplus, the US is equally guilty of pursuing a very loose monetary policy that encouraged the excessive borrowing and consumption by households.
China’s Savings Investment Gap
An alternative way to look at the current account balance of a country is its saving investment gap, i.e., an excess of savings over investments is equivalent to a current account surplus, while an excess of investments over savings results in a current account deficit. From this perspective, the important questions are what cause a country to have more savings than investments and how can you increase consumption in order to reduce the saving rate for a current account surplus country and vice versa for a deficit country.
Why is China’s savings in excess of its domestic investments causing it to have persistent current account surplus? Figure 4 shows that China has a very high saving rate, close to 50% of its GDP, and is one of the highest in the world. In 2007, the largest component of China’s total savings is still the household sector, accounting for about 22%; followed by the corporate sector at 18% and then the government sector at 10%. In national accounting terms, savings is the residual after deducting private and government consumption from gross national income. Hence the higher the saving rate, the lower the consumption rate. Figure 5 shows that private consumption in China has declined from about 50% in 1992 to 36% in 2007, well below the 65% norm for most of the world’s major economies; in fact, private consumption was over 70% in the early 1960s in China (Roach, 2009:179). Why is private consumption rate low and saving rate high in China?
Figure 4: Composition of China’s Savings, 1999‐2007
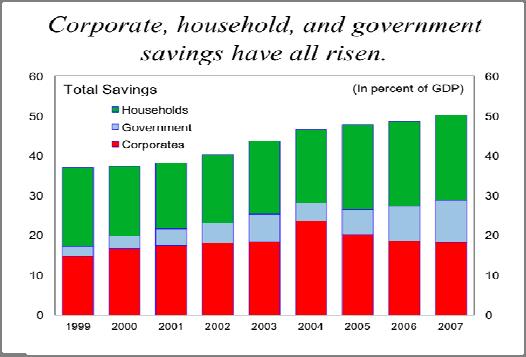
Source: IMF, 2010.
Figure 5: China’s Private Consumption, 1992‐2007
11
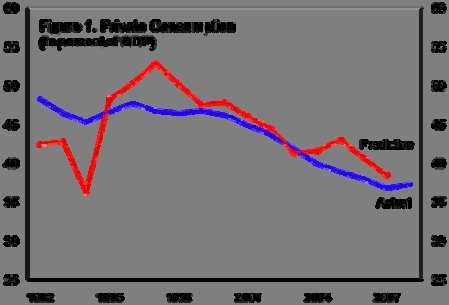
Source: Kai and Diaye, 2010.
China’s Growing Inequality
Despite the impressive economic growth of China over the last three decades averaging about 10% yearly, this growth has not been evenly distributed, both from the point of view of the share of GDP accruing to labor and from the perspective of income distribution. Income equality has worsened significantly, with the Gini coefficient almost doubling from 0.32 to 0.50 between 1978 and 2006 (China News 1). Another measure of the imbalance can be seen from the share of GDP going to labor; this has dropped from 57% to 37% between 1978 and 2005 (China News 2). Roach (2009:186) says that productivity growth in China has surged at an average annual rate of 20% over the 2000‐2004 period, well in excess of cost pressures implied by the 12% gains in hourly compensation. In other words, like its developed countries counterpart, the pendulum in China has swung in favor of capital over labor with most of the productivity gains accruing to capital rather than labor. With declining share of economic output accruing to labor, aggravated by increasing inequality of income, private consumption as a percentage of GDP has been declining as shown in Figure 5.
Although real wages of urban Chinese workers in coastal cities has improved and real consumption has risen over time, it is declining as a share of total output. The problem of under‐consumption is aggravated by China’s reforms that led to a sharp drop in social consumption of goods and services like health care, housing, and education. The economic reforms led to the corporatization of SOEs and a sharp reduction in their provision of social goods and services as SOEs were encouraged by government policies and compelled by market forces to behave like commercial enterprises and to focus on their bottom line.
Sources of High Savings
There are two major reasons why saving rate is so high in China. First is the precautionary saving of ordinary households. Prior to China’s economic reforms, social services were provided free or at low prices by government and SOEs. China was once recognized by the World Health Organization as providing a high level of basic health services (not necessarily technologically sophisticated) to a majority of its population. In the field of education, China after the revolution
12
improved its literacy rate to over 90% and provided good basic education to both men and women, reducing the gender gap. The same can be said for basic housing that was available at very low prices. In the transition from China’s variant of socialism to capitalism, millions of state enterprise workers were thrown out of work, social services such as housing, education and health services were drastically cut and economic insecurity mounted for the vast majority of the population. What used to be free, now cost two years of an average worker’s wage for a serious hospital visit. Thus the ordinary Chinese are forced to save for rainy days.
The second source of high savings comes from the corporate sector. Corporate saving rate is high reflecting in part the behavioral shift of SOEs to maximize profits by cutting back on provision of social services to workers. Furthermore, Chinese SOEs pay very little tax and dividends; much of their profits are used to fund investments resulting in an extremely high investment rate of about 40% in the Chinese economy. There are two issues with the investments. First, as high as the investment rate is, it is still below the national savings rate, giving rise to an excess of savings over investment. Second, much of the investments are direct at the export sector rather than domestic market, resulting in China’s current account surplus (excess of exports over imports).
Inequality, Under‐consumption and Current Account Surplus
In both the U.S. and China, inequality results in under‐consumption, i.e., a decline in purchasing power for the ordinary households. In the U.S., however, under‐consumption for the ordinary households was “resolved” by taking on increasing levels of debt. An over‐leveraged and sophisticated financial system was able to recycle excess liquidity and on‐lend them to households. In China, bank lending to households is not well developed and banks traditionally focus their lending on state owned enterprises. While bank lending to households for consumption and housing have grown in recent years, loans to households still account for only 17.8% of China’s financial institutions’ total loan portfolio (People’s Bank of China, 2008). Instead, the excess savings in China found its outlet in the balance of payments as current account surpluses and rising foreign reserves of the central banks. See Figure 6.
Figure 6: China’s and U.S. Current Account Balances, China’s Foreign Reserves, 2000 ‐2009.
13
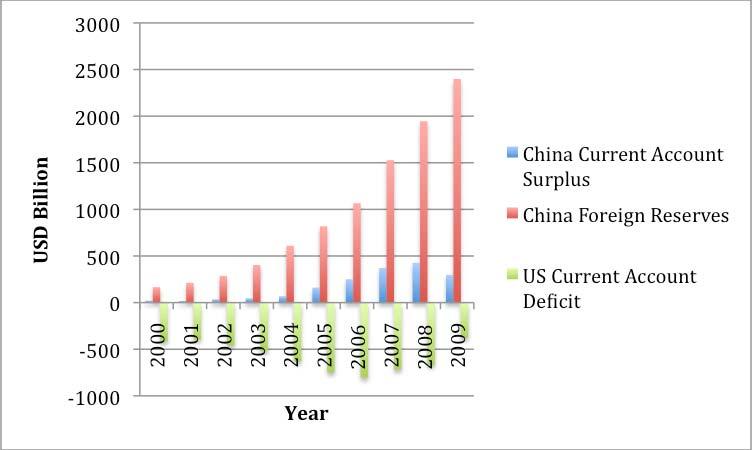
Sources: Chinability, US‐China Business Council, Bureau of Economic Analysis.
Between 1970 and 2006, exports as a percentage of GDP rose from below 5% to about 35% and together with fixed investments accounted for about 75% of GDP (Roach, 2009:173). The foreign reserves are mostly invested in US Treasury bills that in turn provided liquidity for the US banking system to lend to the housing sector. Figure 7 shows that the main issuers of debt between 2004 and 2006 were mortgage agencies and asset back securities issuers that had overtaken the federal government as debt issuers.
Figure 7: U.S. Debt Issuers: Who Issued the Debt
Source: Duncan, 2007.
Ironically, under‐consumption and excess savings in a poor country like China are funding the excess consumption and debt bubble in the U.S. To recognize this is not to subscribe to Bernanke’s thesis of global saving glut as the cause of the GFC. World savings as a whole has not risen significantly above historical rates.
14
-400 -200 0 200 400 600 800 1000 $ BILLIONS 199019921994199619982000200220042006 Federal Government GSEs plus Agency & GSE-backed mortgage pools ABS Issuers
Rather we see it as a tale of two gluts – the Chinese savings glut, on the one hand, and the U.S. debt and over‐consumption glut, on the other hand, made possible by over‐leveraged and reckless financial institutions.
The Chinese leaders are concerned about the imbalances in the economy. Premier Wen Jiabao in his press conference after the National People’s Congress in 2007 warned that China’s economy was increasingly “unstable, unbalanced, uncoordinated, and unsustainable.” (Ibid:229). The imbalance between the rich and the poor, and between exports and domestic consumption are not sustainable. Yet, to reduce exports and increase domestic consumption, wages must rise with productivity and inequality must be reduced. The government in recent years has also paid more attention to providing more social services and safety net to the poor. In the 11th Five Year Plan (2006‐2010), the government recognized the need to correct the growing income equality and imbalance between consumption and investment. It committed itself to expanding domestic demand by raising the incomes of the lower and middle income households, increasing farmers incomes, providing more social services to the rural areas and accelerating the pace of urbanization, and improving the social security system in order to encourage the Chinese households to reduce their precautionary savings and increase their consumption. However, despite the measures that were taken, the trend towards falling wages and consumption have continued in the last few years and it appears the government has to intensify its efforts and expand the scope and coverage of its programs to increase the provision of social goods and services.
Conclusion
We return to the basic contradiction in growth under capitalism, that is, the contest for returns between capital and labor. Capital’s unrelenting quest for higher profits and return is at the expense of labor’s share creating the tendency towards under‐consumption that in turn threatens the accumulation process. Capital with the support of the neo‐liberal state enacts political, economic, financial strategies to increase its share of the returns. In the US, Europe and other developed countries, this process was aided by the entrants of huge reservoir of labor from the emerging economies into the global production and labor markets, thereby putting downward pressure on wages and exacerbating the tendency toward under‐consumption. The tendency towards under‐consumption in the US is overcome by household borrowings reflecting the recycling of the excess savings of the rich minority to the average household. The spread of capitalism into China has also led to a similar phenomenon of falling share of wages and under‐consumption by the average household in China. However, the excess savings in China was recycled through the global financial system to the average American household exacerbating the growing indebtedness of the households in the U.S.
We do not propose that inequality is the only or direct cause of economic and financial crisis. We propose that it is an important factor contributing to financial imbalance in the economy, which combined with a highly leveraged financial sector that churns out new financial products to increase overall lending,
15
increases the vulnerability of the financial system to systemic breakdown. Hence the rising income inequality issue must be addressed in order to resolve economic and financial instability.
However, the rising income inequality issue is a structural problem that requires a major shift in policy away from market fundamentalism towards some form of policy to raise real wages concomitant with productivity increases, and to redistribute income from the rich to the poor and middle‐income households. For now the priority must be to overcome the financial crisis and restore the health of the economy. However, the difficulty and intractability of dealing with this problem is evident in the present anemic recovery in the United States that may be running out of steam with the end of the fiscal stimulus program. The stimulus programs have helped to support spending in the economy by providing income to the unemployed, and debt relief to homeowners who have negative home equity. The stimulus program is meant to be temporary and is effective only if the corporate sector recovers and starts to invest and hire. Even though the corporate sector has improved its financial position, it has done so by cutting costs; hence most of the rise in profits is due to cost reduction rather than expansion of business and revenue generation. Cutting costs means not hiring, or making workers work longer and harder. Official unemployment remains at a high of almost 10%. “When you combine the long‐term unemployed with those who are dropping out and those who are working part‐time because they can’t find anything else, it is just far beyond anything we’ve seen in the job market since the 1930s.” said McMillion and the estimated number is 30 million in this “unemployed” group. (Herbert).
However, even with improvement in employment, economic recovery will be hobbled by weakness in household balance sheet. Hence in order for economic recovery to be sustainable, it is necessary for policy makers to address the issues of growth with substantial employment generation, reduction of inequality and strengthening of household balance sheet.
References:
Akyuz, Yilmaz. 2006. From Liberalization to Investment and Jobs: Lost in Translation. Penang, Third World Network.
Bai,HelenY.andMai-ChiHoang,2010.“AnnualRevisionoftheUSInternational TransactionsAccounts.July.BureauofEconomicAnalysis. http://www.bea.gov/scb/pdf/2010/07%20July/0710_intl-accts.pdf
Barbera, Robert J. 2009. TheCostofCapitalism. New York: McGraw Hill. Bernanke, Ben S. 2005. "The Global Saving Glut and the U.S. Current Account Deficit," Homer Jones Lecture, St. Louis, Missouri, April 14. Bowles, Samuel, D.M. Gordon, and T.E.Weisskopf. 1986. “Power and Profits: The Structure of Accumulation and the Profitability of the Postwar U.S. Economy.” ReviewofRadicalPoliticalEconomics 18(1&2): 132–67. BureauofEconomicAnalysis. n.d. http://www.bea.gov/interactive.htm Caprio, Gerard, Daniela Klingbiel, Luc Laeven, and Guillermo Noguerra. 2003. Banking Crises Database. October. Washington D.C.: World Bank.
16
China News1: 研究者称中国基尼系数连续上升 贫富差距逐步拉大. Available at: http://news.china.com/zh_cn/domestic/945/20090518/15486331.html
China News2: 中国居民劳动报酬占GDP比重连降22年 Available at: http://news.163.com/10/0512/02/66ETQIN300014AED.html Chinability. “China’s Current Account Balances 1982‐2009.” Access August 30, 2010. http://www.chinability.com/CurrentAccount.htm Domhoff, G William. 2005.WealthIncomeandPowerSeptember2005(updatedMay 2009). http://sociology.ucsc.edu/whorulesamerica/power/wealth.html Domhoff, G.William. 2006. “Wealth, Income and Power.” http://sociology.uscs.edu/whorulesamerica/power.html.
Duncan, Richard.. “Blame the Dollar Standard.” FinanceAsia, September (2007),35–42.
Economic Report of the President, 1997 http://www.gpoaccess.gov/USbudget/fy98/pdf/erp.pdf EconomicReportofthePresident.2008. http://www.gpoaccess.gov/eop/tables08.html.
Economist. 2007. “A Workers’ Manifesto for China.” Vol. 385, No. 8550: 90. Oct 11 Galbraith, John K. 1997. The Great Crash 1929. Boston: Houghton Mifflin. Greenspan, Alan. 2005. “Risk Transfer and Financial Stability.” May 5. http://www.federalreserve.gov/boarddocs/speeches/2005/20050505/default. htm
Guha , Krishna. 2007. “A Global Vision.” FinancialTimes, September 17 Henriques, Diana B. 2008. “U.S. Bailout Monitor Sees Lack of A Coherent Plan.” NewYorkTimes, December 2.
Herbert, Bob. 2010. “US Facing Full-Blown Employment Crisis?” IHT, reprinted in Star, Malaysia. August 11.
IMF Country Report No. 10/238, July 2010. Washington D.C. Kai Guo and Papa N’Diaye, 2010. “Determinants of China’s Private Consumption: An International Perspective.” IMFWorkingPaper. April. Washington D.C. Klein, Ezra. 2010. Does Income Inequality Cause Financial Crises?” Washington Post, June 28. Available at http://voices.washingtonpost.com/ezra‐klein/2010/06/does_income_inequality_cause_f.html
Krugman, Paul. 2010. Inequality and Crisis. June 28. Pdf. Available at: http://krugman.blogs.nytimes.com/2010/06/28/inequality‐and‐crises/ Lim, Michael Mah Hui. 2009. “Fix Income and Wealth Imbalances Too.” Straits Times, Singapore. August 18.
Lim, Michael Mah‐Hui and Lim Chin. 2010. Nowhere to Hide: The Great Financial Crisis and Challenges for Asia. Singapore. Institute of Southeast Asian Studies. Milanovic, Branko, 2002. True World Income Distribution, 1988 and 1993: First calculation based on household surveys alone, Economic Journal, Vol.112 (476): 51‐92.
Milanovic, Branko, 2009. “Two Views on the Cause of the Global Crisis.” YaleGlobal, May 4. Available at: http://www.carnegieendowment.org/publications/index.cfm?fa=view&id=2305 3
Minsky, Hyman P. 1986. Stabilizing an Unstable Economy. New Haven: Yale University Press.
People’s Bank of China, 2008: Table: Sources and Uses of Funds of Financial Institutions (By Sector). Accessed August 30, 2010.
17
http://www.pbc.gov.cn/english/diaochatongji/tongjishuju/gofile.asp?file=2008 S01a.htm
Pilling, David. 2010. “Change in finally afoot for China’s workers.” Financial Times, June 2.
Rajan, Raghuram. 2010. “How Inequality Fueled the Crisis.” July 9. Available at: http://www.project‐syndicate.org/commentary/rajan7/English Ramzy, Austin. 2010. “As China Economy Grows, So Does Labor Unrest.” Time. June 10.
Roach, Stephen S. 2009. The Next Asia: Opportunities and Challenges for a New Globalization. Hoboken, New Jersey. John Wiley & Sons Inc.
Saez, Emmanuel. 2008. “Striking it Richer: The Evolution of Top Incomes in the United States.” Mimeographed. Department of Economics, University of California, Berkeley.
Schuman, Michael. 2010. “The Lost Continent.” Time. July 12: 18‐21. Sweezy, Paul M. 1964. The Theory of Capitalist Development. New York. Monthly Review Press.
Tabuchi, Hiroko. 2010. “Honda Strike Presents New Reality for Japan.” International Herald Tribune. June 2. U.S. China Business Council. “China’s Economic Statistics.” Accessed August 30, 2010. http://www.uschina.org/statistics/economy.html Wade, Robert. 2004. “Is Globalization Reducing Poverty and Inequality?” World Development 32 (4): 567‐589. Wheen, Francis. 1999. Karl Marx. London. Fourth Estate.
Wikinvest. n.d. Mortgage Equity Withdrawal. Available at: http://www.wikinvest.com/wiki/Mortgage_Equity_Withdrawal_(MEW).Accessed August 9, 2010.
Wikipedia, n.d. Gini Coefficient. Available at http://en.wikipedia.org/wiki/Gini_coefficient#US_income_Gini_indices_over_time Accessed August 9, 2010.
Yuji, Genda. 2006. ANaggingSenseofJobInsecurity:TheNewRealityFacing JapaneseYouth. Tokyo. International House of Japan, Inc.
18
View publication stats