APPENDICES
Demographics | Community Engagement Summary | Community Needs Survey Report | ATLAS | LOS Analysis | Habitat | Recreation Programs and Services Assessment | Benchmarks | Maps | Current Park Master Plans | Capital Improvement Plan
Submitted by:
Berry, Dunn, McNeil & Parker, LLC 2211 Congress Street, Portland, ME 04102 207.541.2200
Chad Snow Principal | Berry, Dunn, McNeil & Parker, LLC csnow@berrydunn.com
Dannielle Wilson, Project Manager Manager | Berry, Dunn, McNeil & Parker, LLC dwilson@berrydunn.com

DEMOGRAPHICS APPENDIX 1
City of Maple Valley, WA Demographic Profile
BerryDunn reviewed the City of Maple Valley’s demographic profile to provide valuable insights into factors that could impact Maple Valley’s planning efforts and to deepen understanding of the potential market for recreation by highlighting where and how the community might change.
BerryDunn sourced population data from Maple Valley’s Comprehensive Plan Update which was completed in 2024. Other demographic characteristics including age distribution, income, and race/ethnicity were sourced from ArcGIS Business Analyst using November 2024 U.S. Census estimates. 1 Disability data was provided by the American Community Survey which was released in 2023. BerryDunn also compared Washington (WA) to U.S. data, where applicable, for additional context.
Population Characteristics
In 2024, Maple Valley’s population was estimated at 29,320 residents, a significant increase from 14,277 residents in 2000. Projections provided in the Comprehensive Plan suggest a slight population increase, with an anticipated 29,680 residents by 2029, and an anticipated 34,420 residents in 2044. 2
1: Population Projections
Source: 2024 Comprehensive Plan Update
1 Esri. n.d. “ArcGIS Business Analyst: Data Overview.” Accessed December 18, 2024 https://doc.arcgis.com/en/business-analyst/web/data.htm
2 City of Maple Valley “2024 Comprehensive Plan Update.” https://www.maplevalleywa.gov/government/departments/community_development/2044_comprehensive_plan_updat e/index.php#outer-1075.
of Maple Valley– Demographics Report
Figure
Age Distribution
In 2024, the median age of Maple Valley residents was 37.4 years, which is younger than both the median age in Washington (38.8) and in the United States (39.3). The age distribution in Maple Valley shows a significant proportion of the population in the 35 – 54 age range (33.30%), followed by the 0 – 19 age group (32 13%). The senior age group (75+) was the smallest at just 3.98%. This age breakdown points toward a need to focus on more recreational services for younger populations.
Figure 2: Age Distribution (2024)
Age Change Over Time
Over the next five years, the young adult population is projected to experience the most significant growth, with the 20 – 34 age group expected to increase by 2.79%. This change reflects a large teenage population within the youth category who will become young adults in the next five years. Adult and youth populations will see the most significant decrease, with both shrinking more than 2.50% over this same period Meanwhile, the senior population will experience the smallest change only growing by 0.68%.
Youth (0-19 years)
Young Adult (20-34 years)
Adult (35-54 years)
Older Adult (55-74 years)
Senior (75+ years)
Figure 3: Age Change Over Time (2024 – 2029)
Household Characteristics
Maple Valley’s median household income ($138,699) is significantly higher than that of both Washington ($97,013) and the United States ($79,068).
Figure 4: Household Income (2024)
Maple Valley has a lower proportion of residents living below the federal poverty level when compared to state and national averages. An estimated 4.44% of Maple Valley residents live below this level a lower proportion than both Washington (9.59%) and the United States (12.42%).
Figure 5: Population Living Below the Poverty Level (2024)
Maple Valley Washington U.S.
Maple Valley Washington U.S.
Racial Diversity
Maple Valley has experienced changes in racial diversity between 2010 and 2024, and these trends are projected to continue through 2029 (Figure 6). The white population saw a substantial decrease from 86% in 2010 to 70% in 2024 and is expected to further decline to 68% by 2029. Meanwhile, the two or more races group saw the largest increase, jumping from 5% in 2010 to 13% in 2024. The category of “other races” includes Native Americans, Pacific Islanders, and other races not designated by the U.S. Census.
Figure 6: Change in Racial Diversity (2010 – 2029)
White Black or African American Asian
Two or More Races Other Races Hispanic Population 2010 2024 2029
Disabilities
An estimated 7.6% of individuals in the City of Maple Valley have a disability, compared to 13.9% in the State of Washington. 3 The most common types of disabilities in Maple Valley are independent living and ambulatory difficulties, both at 2.9%. Table 1 outlines the percentages of individuals living with various disabilities, as defined by the U.S. Census. 4 These percentages exceed the total disability rate because some individuals experience multiple types of disabilities.
with performing activities such as managing finances, shopping, or arranging transportation due to physical, mental, or emotional conditions.
with memory, concentration, or decision-
Source: American Community Survey, 2023
3 U.S. Census Bureau. (2023). Health. Retrieved January 15, 2025, from Census.gov website: https://data.census.gov/profile/Maple_Valley_city,_Washington?g=160XX00US5343150#health
4 U.S. Census Bureau (2021). How Disability Data are Collected from The American Community Survey. Retrieved January 15, 2025, from Census.gov website: https://www.census.gov/topics/health/disability/guidance/data-collection-acs.html
Table 1: Most Common Disabilities
Key Findings
This report provides an overview of demographics and socioeconomic characteristics in Maple Valley Table 2 highlights key demographic findings, showing positive trends across most categories. More importantly, however, the predicted amount of change between 2024 and 2029 is quite minor across all categories. These findings point to key areas of focus for Maple Valley’s future planning, including prioritizing recreational opportunities for the youth and young adults.
Table 2: Key Demographic Findings

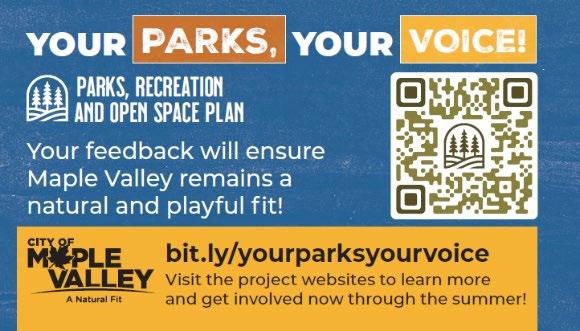
COMMUNITY ENGAGEMENT SUMMARY APPENDIX 2
Maple Valley Engagement: The Community’s Voice
Serving as the foundation for planning, the City Maple Valley’s (City’s) Parks, Recreation, and Open Space (PROS) process prioritized meaningful community engagement. This effort aimed to shape both the PROS plan and a dedicated master plan for Lake Wilderness Park the crown jewel of Maple Valley’s park system.
Executive Summary: Key Community Engagement Findings
The community engagement effort generated significant feedback that reflects diverse perspectives on the future of parks, recreation facilities, and services in Maple Valley. Residents provided detailed comments, suggestions, and preferences regarding Lake Wilderness Park and other recreational priorities. BerryDunn estimates that the engagement process resulted in approximately 10,450 touchpoints by more than 2,750 community members.
Key themes emerged from the focus groups, intercept events, and Social Pinpoint digital engagements, including the following highlights:
• Indoor recreation facilities: There was notable interest in developing indoor recreation amenities such as gymnasiums, fitness spaces, and multipurpose rooms to offer year-round activity options for the community. Expanded recreational programming is desired, and increased space is necessary to accommodate the demand.
• Crowding and parking issues: Respondents noted concerns regarding crowding and parking limitations at Lake Wilderness Park, calling for strategic solutions to improve parking, manage peak usage, and enhance the overall visitor experience.
• Expanded trail connectivity: Feedback emphasized the importance of creating a connected, accessible network of trails, allowing for safer walking, biking, and outdoor recreation throughout Maple Valley and within Lake Wilderness Park.
• Aquatics: Many community members voiced strong support for aquatic facilities, expressing a need for swimming options and water play areas (splash pads) to serve residents of all ages.
Participants also expressed strong interest in enhancing other recreational opportunities and amenities, with many emphasizing the importance of preserving natural spaces while upgrading park infrastructure. Popular suggestions included improving trails and pathways, expanding play areas, and increasing accessibility for all ages and abilities. Environmental stewardship was also a recurring priority.
There was community enthusiasm for new and innovative programming, such as expanded events, classes, and cultural activities that foster a sense of belonging and celebrate local identity. Feedback also highlighted support for amenities that promote health and wellness, including upgraded and additional sports facilities, picnic spaces, and safe gathering areas.
Across all engagement platforms, BerryDunn acknowledged the value of inclusive planning, encouraging ongoing opportunities for input and transparent communication about project progress. These insights informed the planning process and helped shape the vision and strategic priorities for not only Lake Wilderness Park but also Maple Valley’s entire parks and recreation system.
The Engagement Process
Engagement by the Numbers
BerryDunn organized a variety of creative and meaningful ways for the community to provide input. These included four focused meetings with staff, two interactive events at local festivals, and three meetings with key community partners. Insights from these activities informed the statistically valid community needs survey question development. The survey received participation from more than 400 residents. Additionally, an online project page hosted on Social Pinpoint invited widespread input, further enriching the planning process with valuable perspectives from Maple Valley’s community members. Table 1 provides participation data for each engagement activity
Table 1: Maple Valley Community Engagement Participation Overview Engagement Opportunities
Participation
Community partner interviews 17 community members at 3 meetings with community partners
Staff engagement
Intercept events
Project website visitors
Online contributions
Social Pinpoint ideas wall
Social Pinpoint survey
Social Pinpoint budget exercise
Social Pinpoint mapping exercise
Social Pinpoint ideas wall (Lake Wilderness Park Master Plan)
Community Needs Survey
Engagement Strategy
31 staff members at 4 focus group meetings
118 comments from 388 community members at two outdoor festivals
4,234 visitors, with 3,020 visits from 2,176 unique visitors
673 online contributions from 380 contributors
265 ideas wall comments and 3,170 reactions (likes/dislikes)
82 survey respondents; 57 open-ended comments
38 participants in a priority allocation exercise
29 participants in a mapping exercise
140 ideas wall comments and 1,790 reactions (likes/dislikes)
403 Respondents
To help ensure an effective engagement process, BerryDunn collaborated with City staff to design a multifaceted approach that would resonate with a broad cross-section of Maple Valley residents. In February 2025, the community engagement strategy was finalized, focusing on a single goal: to welcome as many community voices as possible into discussions about the future of parks, recreation facilities, services, and potential Lake Wilderness Park enhancements
The engagement strategy revolved around:
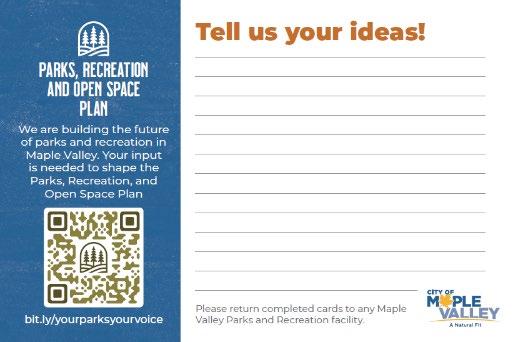
• Development of campaign themes and marketing collateral
• Staff and public focus groups
• Digital engagement opportunities and a project webpage using Social Pinpoint, which offered the following opportunities:
o Ideas wall
o Interactive map
o Budget priority exercise
o Survey
• A social media outreach/digital campaign
• Pop-up events (intercept opportunities)
PROS Plan Engagement
Community and Staff Input into the PROS Plan
Community Partner Interviews
Three meetings with community partners were facilitated that included leaders from business, education, public arts, the arboretum, youth sports organizations, civic clubs, nonprofits, the historical society, and the chamber of commerce as well as veterans, cricket, disc golf, and trail users. Key partners were highly representative of the Maple Valley community. The most frequent comments expressed a need for additional space and programs, enhanced trail connectivity, and praise for staff responsiveness and community partnerships. BerryDunn grouped comments into the following themes:
• Capacity and space limitations: Indoor space and gymnasium space shortages, Lake Wilderness Lodge access, summer camps filling quickly, not enough field time, crowded events, and parking shortages (13 mentions).
• Praise for staff responsiveness: Helpful, responsive, easy to work with, fast hazard/event response, and individuals named for good service (11 mentions)
• Trail system and connectivity: Increased use, bike access, trail extensions, connectivity challenges across highway, and trail importance in new developments (9 mentions)
• Strong partnerships and collaboration: Schools, nonprofits, chamber, advocacy, and economic development links (9 mentions).
• Facility maintenance and quality: Clean parks, no trash, repairs handled, Lake Wilderness Lodge preservation, arboretum transformation, restroom/trash needs (8 mentions).
• Programs and events: Adult/children’s lodge programs, youth activities, fun runs, fishing derby, arts/cultural events, and more variety needed (8 mentions)
• Lodge use issues: Underutilization, costs for nonprofits, difficult reservations, revenuefirst focus, lack of balance in access (7 mentions).
• Increased pickleball demand: Need for indoor/outdoor courts, and lack of facility space (5 mentions)
• Communication improvements: Operations, media, coordination with arboretum, weekend staff gaps, event promotion, and storytelling (5 mentions).
• Equity and boundary concerns: Non-resident fees, school district vs. City limits, lack of King County action, residents outside of the City feel excluded (5 mentions)
Staff Focus Groups
In total, 31 department leaders and staff participated in focus group meetings The team took great pride in demonstrating the value placed on events and amenities, suggesting that parks and recreation is a “jewel” for Maple Valley. The most repeated comments from leadership and staff are organized into the following five themes:
• Staffing and capacity limitations: Focus group participants noted heavy workloads, staffing shortages, reliance on seasonal staff, and a lack of mid-level positions. They noted that strong employees drive demand, which leads to burnout.
• Facilities and space constraints: There is a lack of indoor recreation space, storage, and athletic fields.
• Growth and non-resident demand: Population growth places strain on staff. There is high non-resident use due to Maple Valley’s regional appeal. This creates challenges with balancing service equity between residents and non-residents.
• Parking and access issues: According to staff and leadership, parking and access issues require resolution, mainly at Lake Wilderness Park
• Programming needs and trends: Youth sports are at capacity, leaving adult sports underserved. There is also demand for more inclusive and varied programming (e.g., pickleball, aquatics, fitness, dog park, trails).
Pop-Up Intercept Events
BerryDunn collaborated with department staff to gather community input at two events: Maple Valley Days on June 13 and 14, 2025, and the Maple Valley Kids Festival on July 19, 2025. At each event, participants prioritized their top parks and recreation needs by allocating $100 in play money to designated priorities and sharing openended feedback through comment opportunities. The in-person activities mirrored online feedback opportunities.
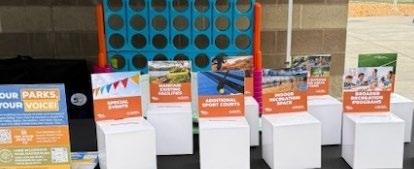
At both events, participants prioritized increasing outdoor active areas (non-turf), indoor recreation spaces, special events, and trails. Table 2 illustrates results from the prioritization exercise. The alignment of results between the two events is presented in the table, helping to demonstrate consistency in community desires between results from the two different respondent groups Comparing participant priorities from Maple Valley Days and the Maple Valley Kids Festival, the data demonstrates that community members expressed similar needs and preferences at both events.
Table 2: Intercept Engagement Prioritization Results at Maple Valley Days and the Maple Valley Kids Festival
Open-Ended Comments
Community members voiced strong support for aquatics, indoor recreation centers, trails, and outdoor recreation.
• Indoor Recreation Centers
o A YMCA-style facility or community recreation center with a pool, basketball and pickleball courts, and family spaces (16 comments).
o Indoor activity spaces for children, tweens, and teens, as well as year-round options like indoor playgrounds, skating, bowling, and waterparks (10 comments).
• Trails and Outdoor Recreation
o Trail system expansion, connectivity, maintenance (19 comments).
o Interest in hiking and running paths, mountain bike trails, pump tracks (7 comments).
1
• Aquatics
o Community pools, aquatic centers, or indoor swimming facilities (23 comments).
o Splash pads and water play features, especially for families with children (20 comments).
o Swimming lessons, family swim, and water safety programs (5 comments).
Secondary themes included a desire for more sports facilities such as pickleball and tennis courts, playgrounds and family spaces, community events (e.g., concerts, festivals, movies in the park), and an amphitheater-style performance space.
Digital Engagement – Social Pinpoint
BerryDunn developed a project website using Social Pinpoint to gather input on the PROS plan and the Lake Wilderness Park master plan. The site resulted in the following engagement metrics between February 6 and September 3, 2025.
• A total of 4,234 views
• A total of 3,020 visits from 2,176 unique visitors
• A total of 673 contributions from 380 contributors
Ideas Wall
Respondents shared suggestions on the ideas wall, which featured categories such as facilities, open spaces, walking paths, recreation programs, parks, and miscellaneous options. Each idea could receive either a like or a dislike, reflecting the level of public support. As detailed in Table 3, facility- and park-related comments accounted for 68% of input and attracted 76% of total likes.
Table 3: Idea Wall Themes
Survey
A total of 93 Social Pinpoint visitors completed the online survey; Table 4 summarizes their responses. Notably, 50% of respondents were satisfied with parks, recreation, and open spaces in Maple Valley. Table 5 presents qualitative ratings across key service delivery categories.
Why do you or your household members visit Maple Valley Parks, Recreation, and Open Spaces? Play = 65
= 65
Rejuvenation = 38
Sports = 47
Other = 11
To what extent are your needs met at Maple Valley's Parks, Recreation, and Open Spaces?
10 respondents = 0% – 30% 26 respondents = 40% – 60% 36 respondents = 70% – 100% Table 5: Online Survey
Alongside quality ratings, survey participants made 57 comments regarding suggested improvements for parks and recreation. These responses closely mirrored the ideas posted on the ideas wall. Table 6 contains more specific details and the most repeated comments
Table 6: Online Comments from Survey Respondents
Table 4: Online Survey Responses
Budget Priorities
Participants were invited to rank project categories for funding by distributing between $10 and $100 across nine different options. The most popular choices were expanding outdoor active use areas, increasing indoor recreation space, and maintaining current facilities. In total, 38 people participated as summarized in Table 7.
Table 7: Online Budget Priority Exercise
Mapping Ideas
Participants had the opportunity to share feedback and mark specific locations on the map corresponding to their comments. A total of 29 remarks were submitted, as illustrated in Figure 2. A total of 14 comments were submitted relating to the area at or near Lake Wilderness Park, nine closes to Fernwood Park, and seven closes to Summit Park.
The most frequent themes included trails and connectivity (improved crossings, safer access, bridges, and expanded trail connections), playground and park facilities (requests for new play structures, restoring neighborhood parks, adding gazebos, picnic tables, and pet waste stations), and community/recreation facilities (pools, gyms, multi-use community centers, golf course improvements). Several comments also highlighted specific park or facility concerns, such as the need for more restrooms at the arboretum, limited parking at the skate park, and a request for the City to maintain the Wilderness Summit neighborhood park
The most popular themes were trail improvements and safety (with at least seven related comments), followed by requests for community or recreation centers with pools (about five comments), and playground/park restoration (about four comments). Other unique but notable suggestions included support for Gaffney’s Grove disc golf course, better Lake Wilderness Golf Course maintenance, improved bus stops, and helping ensure continued access to local trails. Overall, residents emphasized safer connections and expanded recreation options.
2: Map with Areas Corresponding to Comments
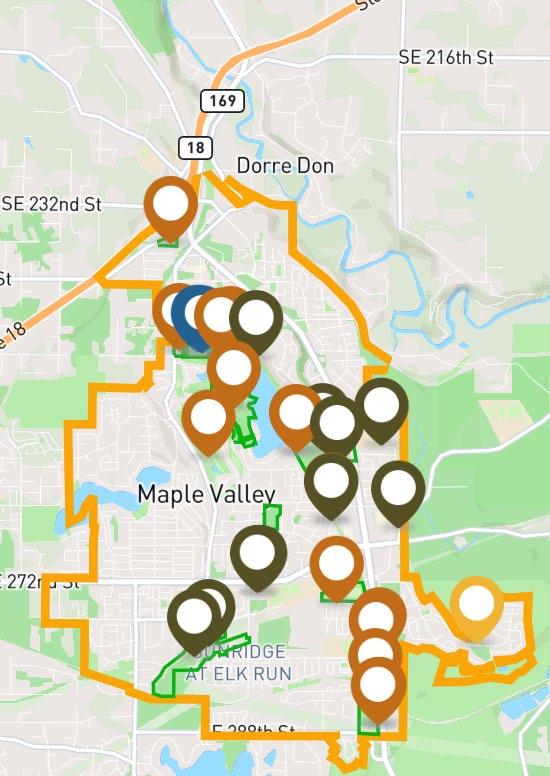
Figure
Lake Wilderness Park Master Plan Engagement
Community and Staff Input into the Lake Wilderness Master Plan
In addition to the broader PROS plan engagement, targeted outreach regarding Lake Wilderness Park was conducted, with findings detailed in this section. These additional insights complement Site Workshop’s intercept events, visioning workshops, and the statistically significant community needs survey. For details on participation and methodology, please see the Engagement Process section earlier in this report.
Staff Focus Groups
Staff reported the following specific to the park:
• Parking and access are critical issues.
• Park is overtaxed with multiple uses.
• Amenities are aging/have been outgrown
• Drainage, flooding, invasive species concerns
• There is a desire for reimagining, rebalancing, and enabling better connectivity, especially to the Green to Cedar Rivers Trail.
• Lake Wilderness Park and Lodge assets are aging.
Community Partner Meetings
Key community partners voiced concerns about Lake Wilderness Park, including parking shortages during events, aging facilities, accessibility challenges, unsafe swimming due to algae, and underused spaces. Lodge restrictions and inadequate signage further limit the park’s usability.
• Parking shortages during large events: inadequate parking, overflow into meadow/high school, and need better signage (6 comments).
• Aging or inadequate facilities: picnic shelters, grills, tables, bathrooms/showers, and restrooms closed in winter (6 comments)
• ADA/accessibility issues: beach, trails, arboretum access, and gnome trail (5 comments).
• Water quality of the lake: algae blooms make swimming unsafe (3 comments)
• Underutilization of space: large grassy areas, outdated baseball field, and Lodge restrictions limit outside group use (3 comments).
• Year-round use and amenities: interest in splash pad, amphitheater, covered shelters/fireplace, zipline, and expanded programming (3 comments)
• Balance of active vs. passive use: calls to preserve natural, quiet setting while also allowing water sports, playgrounds, lacrosse, and canoeing (3 comments)
• Arboretum improvements and challenges: invasives, restrooms, communication, and stairway to gnome trail (3 comments)
• Event crowding and infrastructure strain: big festivals overwhelm the park; need better planning/capacity (3 comments).
• Future vision concerns: need clarity on purpose (preservation vs. rentals/active recreation) and keep natural footprint while enhancing amenities (3 comments)
Pop-Up Intercept Events
More than 240 comments were gathered about the park during two pop-up events Figure 3 provides a word cloud visualization of the comments.
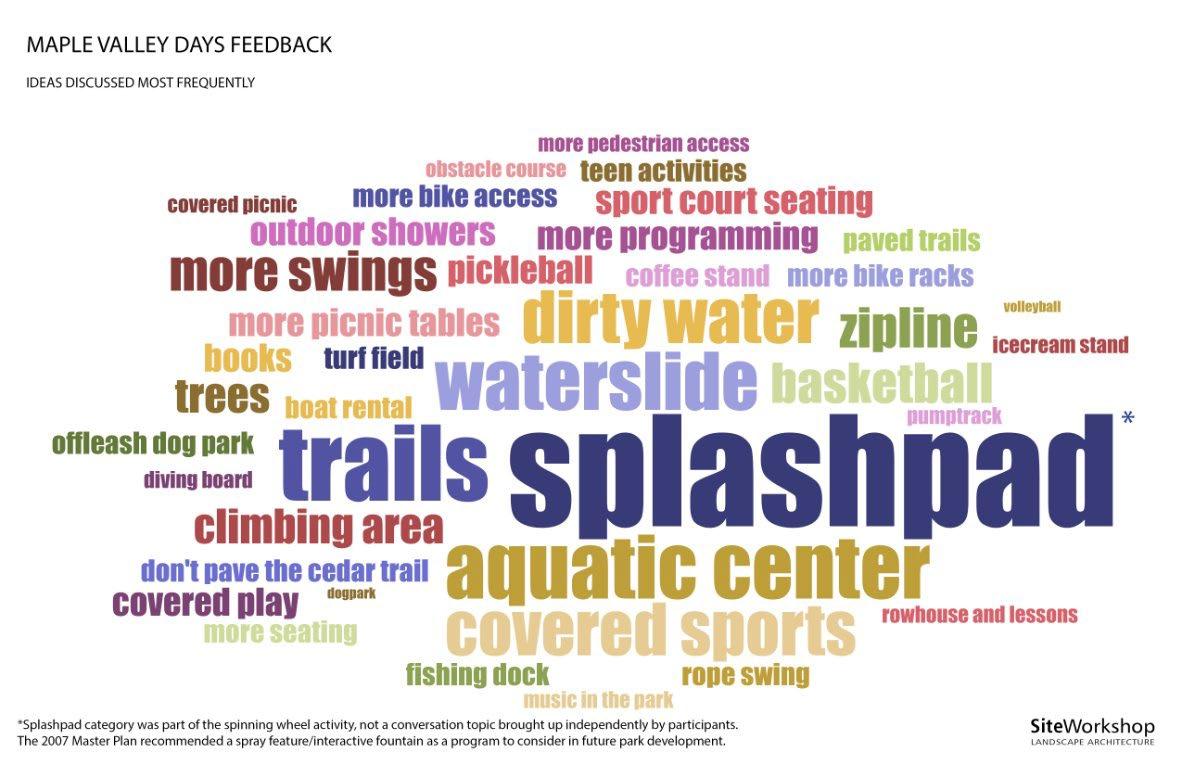
The topics discussed most included splash pad, playground, land and water access, covered sport courts, and fields.
Figure 3: Lake Wilderness Park Feedback Word Cloud, Maple Valley Days
Figure 4 illustrates the frequency of comments as well as a sampling of participant quotes.
Figure 4: Lake Wilderness Park Feedback Quantity and Quotes, Maple Valley Days
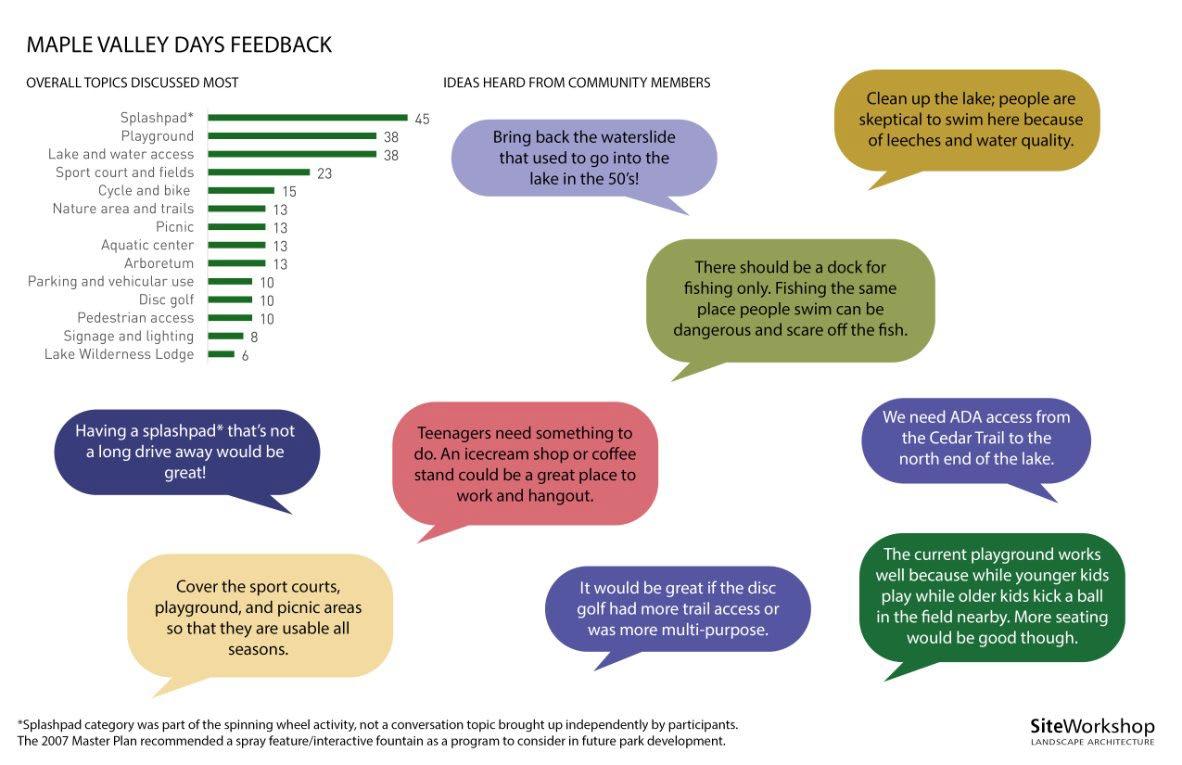
Comment card requests included adding a splash pad to the park, installing different fall protection under playground equipment, and providing basketball courts. Additionally, there was interest in making rowboats available for visitors.
Digital Engagement – Social Pinpoint
Ideas Wall
A total of 140 comments were received regarding planning for Lake Wilderness Park, as shown in Table 8. Splash pads and improvements to lake water quality emerged as the most frequently mentioned topics. Additionally, the ideas wall recorded a substantial number of likes (1,211) and dislikes (579) on these suggestions.
2 The “other” category included ideas for a roller skate rink, a crew house and sailing center, and an outdoor gym.
Survey
A total of 15 community members participated in the online survey. Table 9 summarizes their responses regarding preferences for park use.
Table 9: Park Use Favored by Survey Respondents
Park Use Choice Rank
Preservation of open space and natural areas
Active recreation space
Passive recreation space
First choice = 10 respondents
First choice = 2 respondents
First choice = 1 respondent
Second choice = 1 respondent
Second choice = 1 respondent
Second choice = 7 respondents
Survey participants cited overcrowding, limited parking, and a lack of appealing amenities as the primary obstacles to enjoying Lake Wilderness Park. Figure 5 provides detailed results.
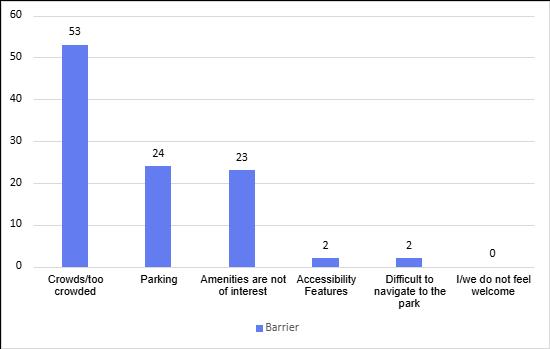
Figure 5: Barriers to Use of Lake Wilderness Park
Key Themes
Key themes emerged from the focus groups, intercept events, and Social Pinpoint digital engagements, including the following highlights:
• Indoor recreation facilities: There was notable interest in developing indoor recreation amenities such as gymnasiums, fitness spaces, and multipurpose rooms to offer year-round activity options for the community. Expanded recreational programming is desired, and increased space is necessary to accommodate the demand.
• Crowding and parking issues: Respondents noted concerns regarding crowding and parking limitations at Lake Wilderness Park, calling for strategic solutions to improve parking, manage peak usage, and enhance the overall visitor experience.
• Expanded trail connectivity: Feedback emphasized the importance of creating a connected, accessible network of trails, allowing for safer walking, biking, and outdoor recreation throughout Maple Valley and within Lake Wilderness Park.
• Aquatics: Many community members voiced strong support for aquatic facilities, expressing a need for swimming options and water play areas (splash pads) to serve residents of all ages.
COMMUNITY NEEDS SURVEY
Presented to the Maple Valley, WA Parks and Recreation Dept. July 2025


Executive Summary
2025 City of Maple Valley Parks and Recreation Needs Assessment Survey – Executive Summary
PURPOSE
During the spring of 2025, ETC Institute conducted a parks and recreation needs assessment survey for the City of Maple Valley. The survey was conducted to help determine parks and recreation priorities for the community. The results will aid the City in taking a resident-driven approach to parks and recreation planning to enhance the community and improve the quality of life for residents.
METHODOLOGY
The seven-page survey, cover letter, and postage-paid return envelope were mailed to a random sample of households in the City of Maple Valley The cover letter explained the purpose of the survey and encouraged residents to either return their survey by mail or complete the survey online. After the surveys were mailed, ETC Institute followed up with residents to encourage participation
The goal was to obtain surveys from at least 300 residents. This goal was far exceeded, with a total of 403 households responding to the survey. The results for the sample of 403 households have a 95% level of confidence with a precision rate of at least +/- 4.9%.
This report contains the following:
• An executive summary of the methodology for administering the survey and major findings
• Charts showing the overall results of the survey (Section 1)
• Priority Investment Rating (PIR) analysis that identifies priorities for facilities/amenities and programs/activities (Section 2)
• Benchmarking analysis that shows how Maple Valley’s results compare to national results (Section 3)
• Tabular data showing the overall results for all questions on the survey (Section 4)
• A copy of the survey instrument (Section 5)
USAGE AND CONDITION OF PARKS/FACILITIES AND REASONS PREVENTING USE
• Nearly all respondents (96%) indicated their household had visited City of Maple Valley parks and/or recreation facilities during the past 12 months. Of those, 31% rated the physical condition of the parks and facilities they visited as “excellent;” 56% gave a rating of “good,” 12% “fair,” and only 1% rated the physical condition of parks and facilities as “poor.”
• The top reasons preventing households from visiting Maple Valley parks and recreation facilities more often were: lack of amenities they want to use (26%), lack of parking to access parks/facilities (18%), lack of restrooms (15%), and lack of shade (14%). Multiple selections could be made for this question.
2025 City of Maple Valley Parks and Recreation Needs Assessment Survey –
Executive Summary
PARTICIPATION AND QUALITY OF PROGRAMS/EVENTS AND REASONS PREVENTING PARTICIPATION
• Sixty percent (60%) of respondents indicated their household had participated in programs or events offered by the City of Maple valley Parks and Recreation Department during the past 12 months. Of those, 33% rated the overall quality of programs/events in which their household participated as “excellent;” 56% gave a rating of “good,” 10% “fair,” and only 1% rated the overall quality of programs/events as “poor.”
• The top reasons preventing households from participating in Maple Valley Parks and Recreation Department programs more often were: lack of knowledge of what is offered (26%), classes are full (21%), too busy/not interested (21%), and program not offered (19%). Multiple selections could be made for this question.
INTEREST IN INDOOR RECREATION FACILITY AND POTENTIAL FUNDING
• Based on the sum of their top four choices, the indoor recreation features that households would be most likely to use if they were offered are: 1) lap lanes for swim lessons, exercise swimming, etc., 2) interactive water play, 3) indoor running/walking track, and 4) aerobics/fitness/gymnastics space.
• Respondents were asked how they feel the construction of a new indoor recreation facility should be funded. More than half (58%) feel it should be funded with new development impact fees; 26% feel new bonds should be issued, 9% feel it should be funded with a sales tax increase, and 8% do not support building a new recreation and/or community center.
• Thirty-five percent (35%) of respondents feel the cost for operations and programming in a new indoor recreation space should be funded through user fees paying the majority and new taxes paying the remaining; 31% feel new general City taxes should pay the majority and user fees should pay the remaining, 24% feel the cost should be paid entirely through user fees, and 10% feel it should be paid entirely through existing City taxes.
SUPPORT FOR IMPROVEMENTS TO LAKE WILDERNESS PARK
• Respondents were asked to indicate their level of support for various actions the City could take to improve Lake Wilderness Park. More than three-fourths (78%) of respondents are “very supportive” or “somewhat supportive” of preserving existing natural areas Other actions the City could take that respondents are “very supportive” or “somewhat supportive” of include: developing new trails and/or connecting existing trails (75%), improving access to regional trail (74%), adding new splashpad/spray park (68%), improving existing pathways and/or trails (68%), improving existing picnic tables/shelters (67%), and adding new covered space (64%).
2025 City of Maple Valley Parks and Recreation Needs Assessment
2025 City of Maple Valley Parks and Recreation Needs Assessment Survey –
Executive Summary
• Based on the sum of their top four choices, the improvements to Lake Wilderness Park that are most important to households are: 1) developing new trails and/or connecting existing trails, 2) adding new splashpad/spray park, 3) preserving existing natural areas, and 4) adding new covered space.
WAYS THAT RESIDENTS LEARN ABOUT PARKS, FACILITIES, PROGRAMS AND EVENTS
• The most frequent ways that residents learn about Maple Valley parks, recreation facilities, programs and events are: word of mouth (57%), social media (53%), recreation activity guide (52%), the City website (51%), and banners (43%). Multiple selections could be made for this question.
• Based on the sum of their top three choices, the methods that residents would most prefer the City to use to communicate about parks, recreation facilities, programs and events are: 1)social media, 2) recreation activity guide, and 3) emails.
ORGANIZATIONS USED FOR RECREATION AND SPORTS ACTIVITIES
• Eighty percent (80%) of respondents indicated they have used the City of Maple Valley for recreation and sports activities during the last 12 months. Other organizations include: neighboring cities (57%), public schools (40%), and private clubs (tennis, health, swim, fitness) (29%). Multiple selections could be made for this question.
ALLOCATION OF FUNDING FOR VARIOUS PARKS AND RECREATION CATEGORIES
• Respondents were asked to indicate how they would allocate $100 for various parks and recreation categories. Their responses are as follows: constructing a new indoor recreation facility ($37.48), improving/maintaining existing parks and open space ($29.82), acquiring new park land and open space ($13.38), expanding program offerings ($8.91), constructing new sports fields ($5.96), and other improvements ($4.47).
2025 City of Maple Valley Parks and Recreation Needs Assessment Survey: Findings Report
2025 City of Maple Valley Parks and Recreation Needs Assessment Survey –
Executive Summary
FACILITY/AMENITY NEEDS AND PRIORITIES
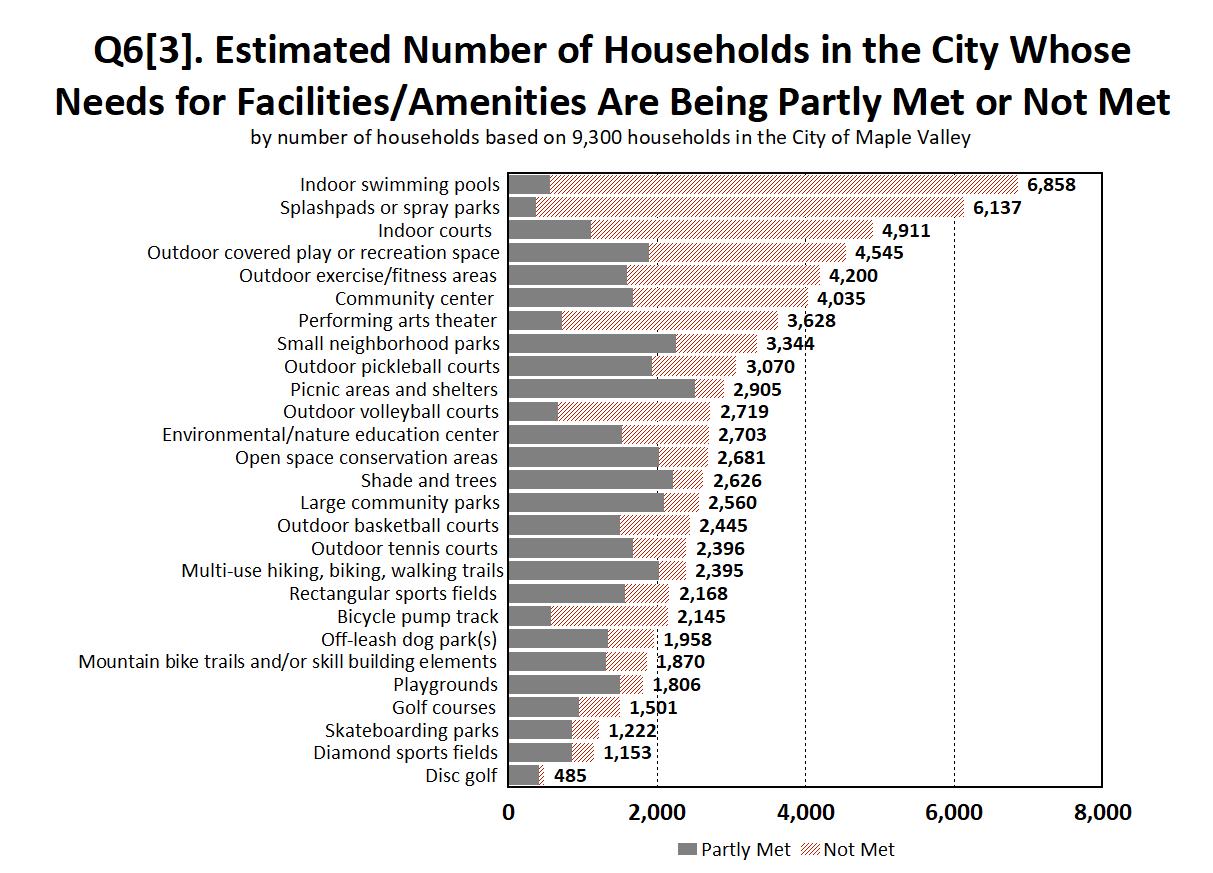
Facility/Amenity Needs: Respondents were asked to identify if their household had a need for 27 parks and recreation facilities/amenities and rate how well their needs for each were currently being met. Based on this analysis, ETC Institute was able to estimate the number of households in the community that had the greatest “unmet” need for various facilities/amenities
The three facilities/amenities with the highest percentage of households that indicated a need were: large community parks (89%), shade and trees (89%), and multi-use hiking, biking, walking trails (87%). When ETC Institute analyzed the needs in the community, these same three facilities/amenities had a need that affected more than 8,000 households.
ETC Institute estimates a total of 6,858 households in Maple Valley that have a need, have unmet needs for indoor swimming pools. The estimated number of households that have unmet needs for each of the 27 parks and recreation facilities/amenities that were assessed is shown in the chart below.
2025 City of Maple Valley Parks and Recreation Needs Assessment Survey – Executive Summary
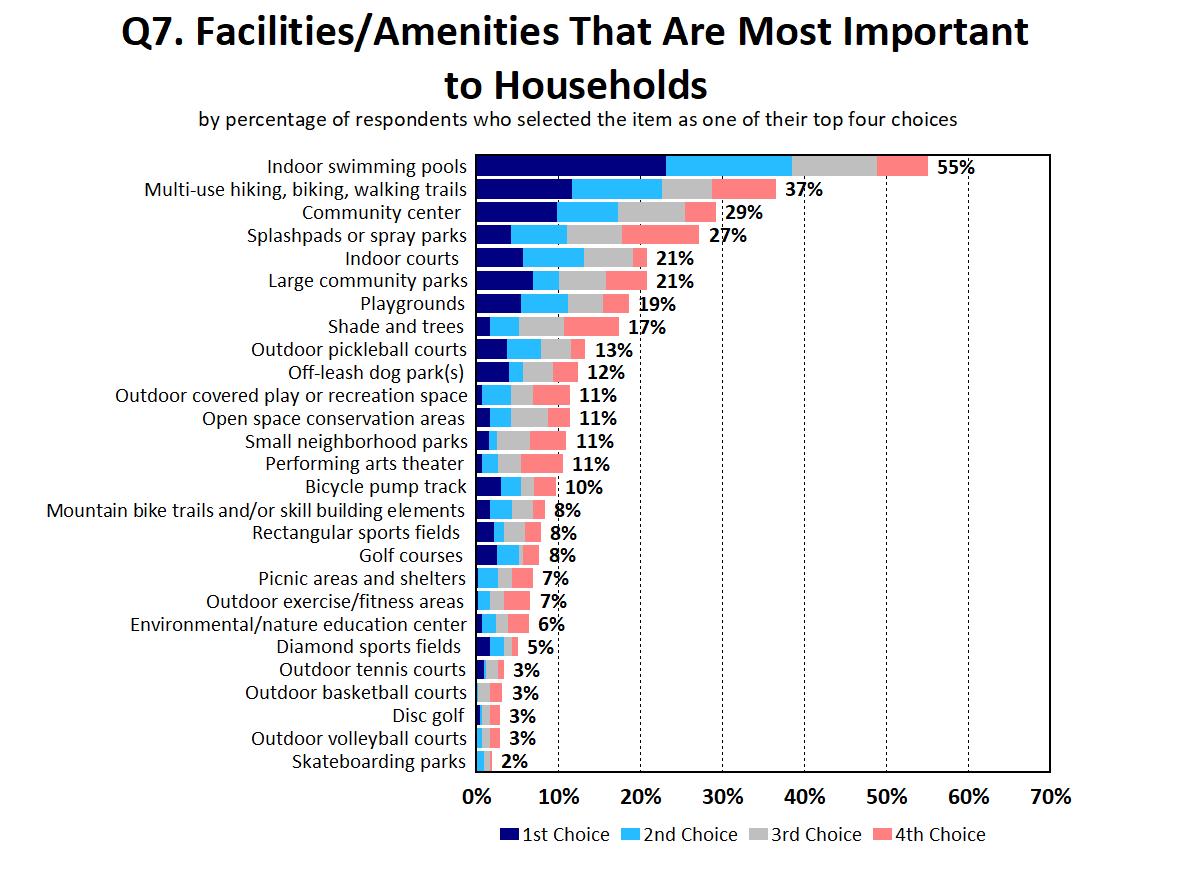
Facility/Amenity Importance: In addition to assessing the needs for each facility/amenity, ETC Institute also assessed the importance that residents placed on each. Based on the sum of respondents’ top four choices, the most important facilities/amenities to households were: indoor swimming pools (55%), multi-use hiking, biking, walking trails (37%), community center (29%), and splashpads or spray parks (27%). The percentage of residents who selected each facility/amenity as one of their top four choices is shown in the chart below.
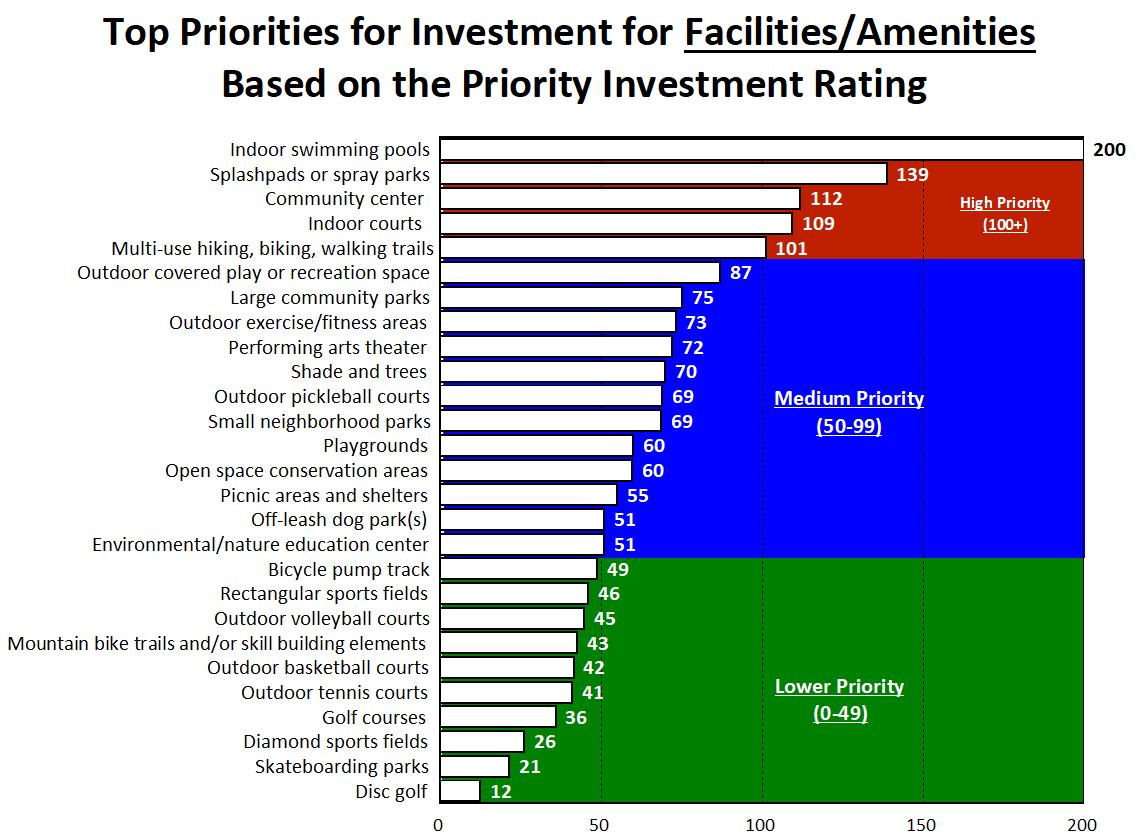
Priorities for Recreation Facility/Amenity Investments: The Priority Investment Rating (PIR) was developed by ETC Institute to provide organizations with an objective tool for evaluating the priority that should be placed on facilities/amenities. The PIR equally weights (1) the importance that residents place on facilities/amenities and (2) how many residents have unmet needs for the facility/amenity. Details regarding the methodology for this analysis are provided in Section 2 of this report.
2025 City of Maple Valley Parks and Recreation Needs Assessment Survey: Findings Report
City of Maple Valley, WA
2025 City of Maple Valley Parks and Recreation Needs Assessment Survey – Executive Summary
Based on the Priority Investment Rating (PIR), the following five facilities/amenities were rated as high priorities for investment:
• Indoor swimming pools (PIR=200)
• Splashpads or spray parks (PIR=139)
• Community center (PIR=112)
• Indoor courts (PIR=109)
• Multi-use hiking, biking, walking trails (PIR=101)
The chart below shows the Priority Investment Rating for each facility/amenity that was assessed on the survey.
2025 City of Maple Valley Parks and Recreation Needs Assessment Survey –
Executive Summary
PROGRAM/ACTIVITY NEEDS AND PRIORITIES
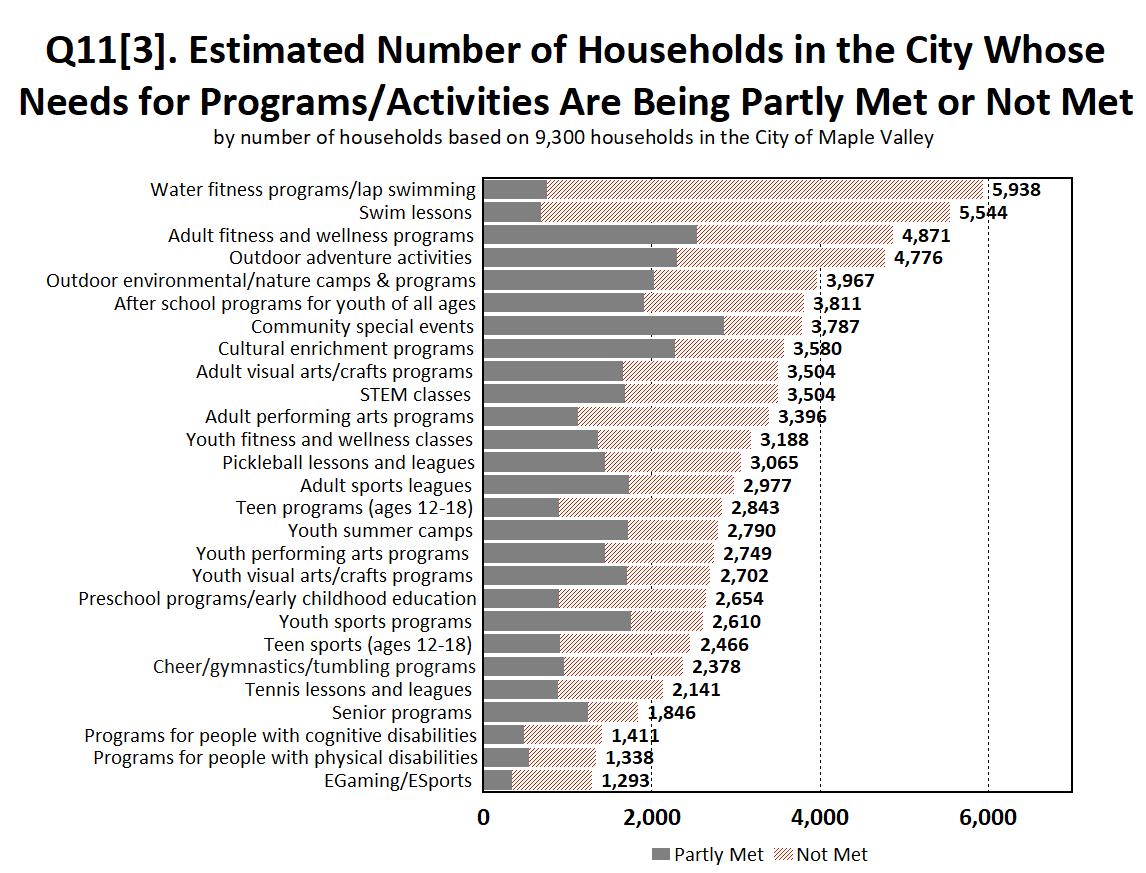
Program/Activity Needs. Respondents were asked to identify if their household had a need for 27 parks and recreation programs/activities and rate how well their needs for each were currently being met. Based on this analysis, ETC Institute was able to estimate the number of households in the community that had “unmet” needs for each program/activity
The four programs/activities with the highest percentage of households that had needs were: community special events (75%), water fitness programs/lap swimming (66%), adult fitness and wellness programs (66%), and outdoor adventure activities (66%). When ETC Institute analyzed the needs in the community, all four of these programs/activities had a need that affected more than 6,000 households.
ETC Institute estimates a total of 5,938 households in Maple Valley that have a need, have unmet needs for water fitness programs/lap swimming. The estimated number of households that have unmet needs for each of the 27 programs/activities that were assessed is shown in the chart below.
2025 City of Maple Valley Parks and Recreation Needs Assessment Survey – Executive Summary
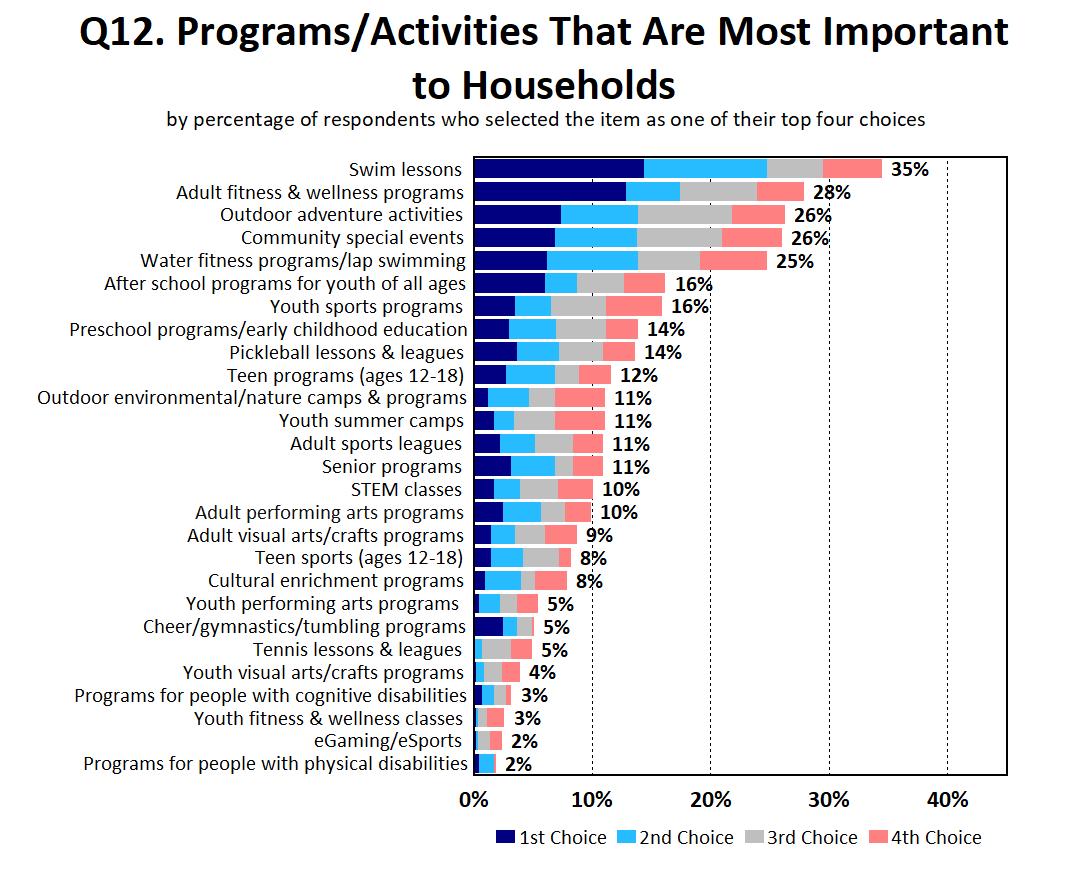
Program/Activity Importance. In addition to assessing the needs for each program/activity, ETC Institute also assessed the importance that residents place on each. Based on the sum of respondents’ top four choices, the most important programs/activities to households were: special events (34%), adult fitness and wellness programs (32%), nature programs/environmental education (24%), and programs for seniors (23%). The percentage of residents who selected each program/activity as one of their top four choices is shown in the chart below and on the following page.
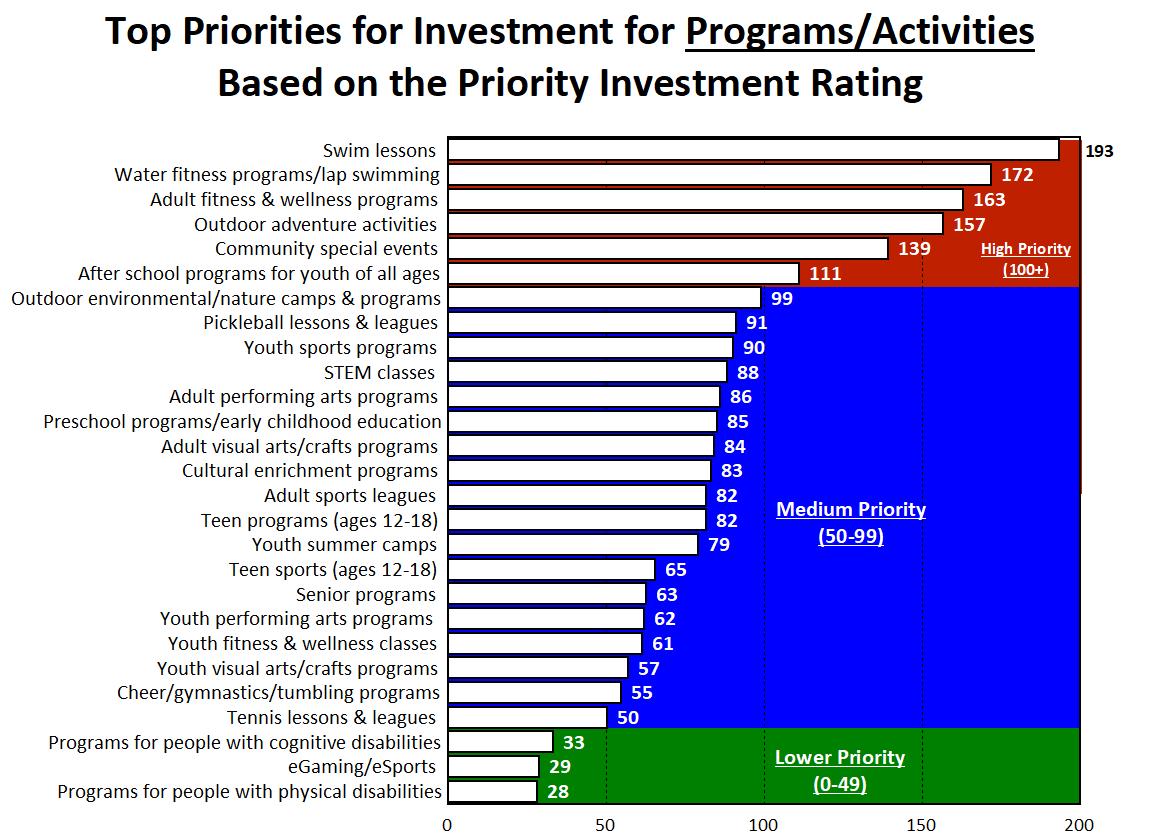
Priorities for Program/Activity Investments. Based on the priority investment rating (PIR), which was described briefly on page vi of this Executive Summary and is described in more detail in Section 2 of this report, the following six programs/activities were rated as “high priorities” for investment:
• Swim lessons (PIR=193)
• Water fitness programs/lap swimming (PIR=172)
• Adult fitness and wellness programs (PIR=163)
2025 City of Maple Valley Parks and Recreation Needs Assessment Survey – Executive
Summary
• Outdoor adventure activities (PIR=157)
• Community special events (PIR=139)
• After school programs for youth of all ages (PIR=111)
The chart below shows the Priority Investment Rating (PIR) for each of the programs/activities that were rated.
CONCLUSIONS AND RECOMMENDATIONS
When analyzing the parks and recreation facilities/amenities and programs/activities offered by Maple Valley, the following were the items for which the highest number of residents had a need: large community parks, shade and trees, multi-use hiking, biking, walking trails, community special events, water fitness programs/lap swimming, adult fitness and wellness programs, and outdoor adventure activities Focusing on these items would provide the greatest benefit for the largest number of residents in Maple Valley.
2025 City of Maple Valley Parks and Recreation Needs Assessment Survey – Executive Summary
Making certain the availability of facilities/amenities and programs/activities encompasses the greatest number of households ensures funding is appropriately allocated to give the community the greatest benefit possible. In order to ensure that Maple Valley continues to meet the needs and expectations of the community, ETC Institute recommends sustaining and/or improving the performance in areas that were identified as “high priorities” by the Priority Investment Rating (PIR).
The facilities/amenities and programs/activities with the highest PIR ratings are listed below.
Facility/Amenity Priorities
o Indoor swimming pools (PIR=200)
o Splashpads or spray parks (PIR=139)
o Community center (PIR=112)
o Indoor courts (PIR=109)
o Multi-use hiking, biking, walking trails (PIR=101)
Program/Activity Priorities
o Swim lessons (PIR=193)
o Water fitness programs/lap swimming (PIR=172)
o Adult fitness and wellness programs (PIR=163)
o Outdoor adventure activities (PIR=157)
o Community special events (PIR=139)
o After school programs for youth of all ages (PIR=111)
City of Maple Valley Parks and Recreation

Charts and
Graphs 2025 City of Maple Valley Parks and Recreation Needs Assessment Survey:
Have
Q1. Ages of Household Members
Under age 5Ages 5 to 9Ages 10 to 14Ages 15 to 17
Ages 18 to 24Ages 25-34Ages 35 to 44Ages 45 to 54
Ages 55 to 64Ages 65 to 74Ages 75+
Q2a. Overall, how would you rate the physical condition of ALL the City of Maple Valley parks and recreation facilities you have visited?
by percentage of respondents who answered “yes" to Question 2 (excluding “not provided”)
Q3. Reasons That Prevent Households From Visiting City of Maple Valley Parks and Recrea tion Facilities More Often
Use
Parks/facilities
Q4. Has your household participated in any programs or events offered by the City of Maple Valley Parks and Recreation Department during the past 12 months?
Q4a. How would you rate the overall quality of the City of Maple Valley Parks and Recreation programs or events in which your household has participated?
Q5. Reasons That Prevent Households
From Participating in City of Maple Valley Parks and Recreation Department Programs More Often
I don't know what is offered
Classes are full
Too busy/not interested
Program not offered
Program times are not convenient
Lack of quality programs
Fees are too high
Use programs of other agencies
Online registration is not user friendly
Old & outdated facilities
Registration is difficult
Lack of quality instructors
Lack of right program equipment
Poor customer service by staff
Lack of transportation
Do not feel safe participating
Language/cultural barriers Too far from our home
Households That Have a Need for the Following Facilities/Amenities
Large community parks
Shade and trees
Multi-use hiking, biking, walking trails
Small neighborhood parks
Indoor swimming pools
Picnic areas and shelters
Playgrounds
Open space conservation areas
Splashpads or spray parks
Community center
Outdoor covered play or recreation space
Outdoor exercise/fitness areas
Indoor courts
Environmental/nature education center
Rectangular sports fields
Performing arts theater
Outdoor pickleball courts
Mountain bike trails and/or skill building element
Mountain bike trails and/or skill building elements
Diamond sports fields
Off-leash dog park(s)
Outdoor basketball courts
Outdoor tennis courts Disc golf
Skateboarding parks Golf courses Outdoor volleyball courts
pump track
Estimated Number of Households That Have a Need for Facilities/Amenities by number of households based on 9,300 households in the City of Maple Valley
Large community parks Shade and trees
Multi-use hiking, biking, walking trails
Small neighborhood parks
Indoor swimming pools
Picnic areas and shelters
Playgrounds
Open space conservation areas
Splashpads or spray parks
Community center
Outdoor covered play or recreation space
Outdoor exercise/fitness areas
Indoor courts
Environmental/nature education center
Rectangular sports fields
Performing arts theater
Outdoor pickleball courts
Mountain bike trails and/or skill building element
Mountain bike trails and/or skill building elements
Diamond sports fields
Off-leash dog park(s)
Outdoor basketball courts
Outdoor tennis courts Disc golf Skateboarding parks
Q6[2]. How Well Facilities/Amenities in the City Are Meeting the Needs of Households
Indoor swimming pools
Splashpads or spray parks
Indoor courts
Outdoor covered play or recreation space
Outdoor exercise/fitness areas
Community center
Performing arts theater
Small neighborhood parks
Outdoor pickleball courts
Picnic areas and shelters
Outdoor volleyball courts
Environmental/nature education center
Open space conservation areas
Shade and trees
Large community parks
Outdoor basketball courts
Outdoor tennis courts
Multi-use hiking, biking, walking trails
Rectangular sports fields
Bicycle pump track
Off-leash dog park(s)
Mountain bike trails and/or skill building element
Playgrounds
Golf courses
Skateboarding parks
Q7. Facilities/Amenities That Are Most Important to Households
by percentage of respondents who selected the item as one of their top four choices
Indoor swimming pools
Multi-use hiking, biking, walking trails
Community center
Splashpads or spray parks
Indoor courts
Large community parks
Playgrounds
Shade and trees
Outdoor pickleball courts
Off-leash dog park(s)
Outdoor covered play or recreation space
Open space conservation areas
Small neighborhood parks
Performing arts theater
Bicycle pump track
Mountain bike trails and/or skill building element
Mountain bike trails and/or skill building elements
Rectangular sports fields
Golf courses
Picnic areas and shelters
Outdoor exercise/fitness areas
Environmental/nature education center
Diamond sports fields
Outdoor tennis courts
Outdoor basketball courts Disc golf
Outdoor volleyball courts
Skateboarding parks
Q8. How Often Households
Would Use Each of the
Following
Amenities If They Were Offered by percentage of respondents
(excluding “don’t know”)
Local walking/jogging trails
Regional walking/jogging/running/biking trails
Playgrounds
Outdoor covered play or recreation space
Outdoor exercise/fitness area
Splashpad/spray park
Pickleball courts
Off leash dog area
Soccer fields
Bicycle pump track
Baseball/softball fields
Basketball courts
Picnic shelters
Tennis courts
Volleyball courts
Skateboard park
Football fields
Lacrosse fields Cricket pitch
Several Times a WeekA Few Times/MonthAt Least Once/Month Less Than Once/MonthSeldom/Never
Q9. Amenities That Households Would be MOST LIKELY to Use If They Were Offered
by percentage of respondents who selected the item as one of their top four choices
Local walking/jogging trails
Regional walking/jogging/running/biking trails
Splashpad/spray park
Playgrounds
Outdoor covered play or recreation space
Outdoor exercise/fitness area
Off leash dog area
Picnic shelters
Pickleball courts
Bicycle pump track
Soccer fields
Basketball courts
Tennis courts
Volleyball courts
Baseball/softball fields
Football fields
Skateboard park
Lacrosse fields
Cricket pitch
Q10. How Respondents Feel the Construction of New Amenities Should be Funded
Issue new bonds Sales tax increase New development impact feesI don't support building additional outdoor amenities by percentage of respondents (excluding “not provided”)
Q11[1]. Households That Have a Need for the Following Programs/Activities
by percentage of respondents
Community special events
Water fitness programs/lap swimming
Adult fitness and wellness programs
Outdoor adventure activities
Swim lessons
Cultural enrichment programs
Outdoor environmental/nature camps & programs
After school programs for youth of all ages
Youth sports programs
Adult sports leagues
Adult performing arts programs
STEM classes
Youth summer camps
Adult visual arts/crafts programs
Pickleball lessons and leagues
Youth fitness and wellness classes
Preschool programs/early childhood education
Youth performing arts programs
Youth visual arts/crafts programs
Teen sports (ages 12-18)
Cheer/gymnastics/tumbling programs
Teen programs (ages 12-18)
Senior programs
Tennis lessons and leagues
Programs for people with cognitive disabilities
Programs for people with physical disabilities
EGaming/ESports
Community special events
Water fitness programs/lap swimming
Adult fitness and wellness programs
Outdoor adventure activities
Swim lessons
Cultural enrichment programs
Outdoor environmental/nature camps & programs
After school programs for youth of all ages
Youth sports programs
Adult sports leagues
Adult performing arts programs
STEM classes
Youth summer camps
Adult visual arts/crafts programs
Pickleball lessons and leagues
Youth fitness and wellness classes
Preschool programs/early childhood education
Youth performing arts programs
Youth visual arts/crafts programs
Teen sports (ages 12-18)
Cheer/gymnastics/tumbling programs
Teen programs (ages 12-18)
Senior programs
Tennis lessons and leagues
Programs for people with cognitive disabilities
Programs for people with physical disabilities EGaming/ESports
02,0004,0006,0008,000
Q11[2]. How Well Programs/Activities in the City Are Meeting the Needs of Households
by percentage of respondents (excluding “no need”)
Community special events
Youth sports programs
Senior programs
Youth summer camps
Adult sports leagues
Cultural enrichment programs
Preschool programs/early childhood education
Cheer/gymnastics/tumbling programs
EGaming/ESports
Youth performing arts programs
Programs for people with cognitive disabilities
Outdoor adventure activities
Teen sports (ages 12-18)
Programs for people with physical disabilities
Pickleball lessons and leagues
Youth visual arts/crafts programs
Adult fitness and wellness programs
Adult performing arts programs
Outdoor environmental/nature camps & programs
After school programs for youth of all ages
Tennis lessons and leagues STEM classes
Adult visual arts/crafts programs
Youth fitness and wellness classes
Teen programs (ages 12-18)
Swim lessons
Water fitness programs/lap swimming
Q11[3]. Estimated Number of Households in the City Whose Needs for Programs/Activities Are Being Partly Met or Not Met
Water fitness programs/lap swimming Swim lessons
Adult fitness and wellness programs
Outdoor adventure activities
Outdoor environmental/nature camps & programs
After school programs for youth of all ages
Community special events
Cultural enrichment programs
Adult visual arts/crafts programs STEM classes
Adult performing arts programs
Youth fitness and wellness classes
Pickleball lessons and leagues
Adult sports leagues
Teen programs (ages 12-18)
Youth summer camps
Youth performing arts programs
Youth visual arts/crafts programs
Preschool programs/early childhood education
Youth sports programs
Teen sports (ages 12-18)
Cheer/gymnastics/tumbling programs
Tennis lessons and leagues Senior programs
Programs for people with cognitive disabilities
Programs for people with physical disabilities
EGaming/ESports 0 2,0004,0006,000 Partly MetNot Met by number of households based on 9,300 households in the City of Maple Valley
Q12. Programs/Activities That Are Most Important to Households
by percentage of respondents who selected the item as one of their top four choices
Swim lessons
Adult fitness & wellness programs
Outdoor adventure activities
Community special events
Water fitness programs/lap swimming
After school programs for youth of all ages
Youth sports programs
Preschool programs/early childhood education
Pickleball lessons & leagues
Teen programs (ages 12-18)
Outdoor environmental/nature camps & programs
Youth summer camps
Adult sports leagues
Senior programs
STEM classes
Adult performing arts programs
Adult visual arts/crafts programs
Teen sports (ages 12-18)
Cultural enrichment programs
Youth performing arts programs
Cheer/gymnastics/tumbling programs
Tennis lessons & leagues
Youth visual arts/crafts programs
Programs for people with cognitive disabilities
Youth fitness & wellness classes
eGaming/eSports
Programs for people with physical disabilities
Q13.
How Often Households Would Use Each of the Following Indoor Recreation Features If They Were Offered by percentage of respondents
(excluding “don’t know”)
Lap lanes for swim lessons, exercise swimming, etc
Interactive water play
Weight room/cardiovascular equipment area
Indoor running/walking track
Aerobics/fitness/gymnastics space
Multi-purpose courts
Covered outdoor seating and/or activity elements
Coffee/snack/grab and go food options
Game rooms
Indoor sports courts
Childcare or preschool space
Climbing wall
Changing/shower/locker rooms
Arts and crafts rooms
Teen lounge areas
Seating/lounge areas
Technology/Innovation center
Senior programs, resources, and services
Multi-purpose community rooms
Youth counseling services
Banquet/special event space
Several Times a WeekA Few Times/Month At Least Once/MonthLess Than Once/Month Seldom/Never
Q14. Indoor Recreation Features That Households Would be
MOST LIKELY to Use If They Were Offered
by percentage of respondents who selected the item as one of their top four choices
Lap lanes for swim lessons, exercise swimming, etc
Interactive water play
Indoor running/walking track
Aerobics/fitness/gymnastics space
Weight room/cardiovascular equipment area
Multi-purpose courts
Climbing wall
Covered outdoor seating and/or activity elements
Coffee/snack/grab and go food options
Game rooms
Childcare or preschool space
Indoor sports courts
Arts and crafts rooms
Senior programs, resources, and services
Teen lounge areas Changing/shower/locker rooms
Multi-purpose community rooms
center
Youth counseling services
Banquet/special event space
Seating/lounge areas
Q15.
How Respondents Feel the Construction of a New Indoor Recreation Facility Should be Funded
Issue new bonds Sales tax increase New development impact feesI don't support building a new recreation and/or community center by percentage of respondents (excluding “not provided”)
Q15a. How Respondents Feel the Cost for Operations and Programming in a New Indoor Recreation Space Should be Funded
100% through existing City taxes
New general City taxes should pay majority & fees from users should pay remaining Fees from users should pay majority & new taxes should pay remaining 100% through user fees by percentage of respondents (excluding “don’t know” )
Q16. Level of Support for th e Following Actions the City Could Take to Improve Lake Wilderness Park
percentage of respondents
Preserve existing natural areas
Develop new trails and/or connect existing trails
Improve access to regional trail
Add new splashpad/spray park
Improve existing pathways and/or trails
Improve existing picnic tables/shelters
Add new covered space
Add new picnic tables/shelters
Improve existing playground
Add new playgrounds
Add new outdoor exercise/fitness areas
Add additional parking
Add new bandshell/stage at amphitheater
Improve existing outdoor tennis/pickleball courts
Add new outdoor tennis/pickleball courts
Improve existing softball field
Add new basketball courts
Add new off-leash dog area
Add new rectangular sports fields
Add new diamond sports fields
0%20%40%60%80%100%
Very SupportiveSomewhat SupportiveNot SureNot Supportive
Q17. Lake Wilderness Park Improvements That Are Most Important to Households
Develop new trails and/or connect existing trails
Add new splashpad/spray park
Preserve existing natural areas
Add new covered space
Improve access to regional trail
Improve existing pathways and/or trails
Add new playgrounds
Add additional parking
Add new outdoor tennis/pickleball courts
Add new off-leash dog area
Improve existing playground
Add new bandshell/stage at amphitheater
Add new outdoor exercise/fitness areas
Improve existing picnic tables/shelters
Add new picnic tables/shelters
Improve existing outdoor tennis/pickleball courts
Add new rectangular sports fields
Add new basketball courts
Improve existing softball field
Add new diamond sports fields
Q18. Ways That ResIdents Learn About Maple Valley Parks, Recreation Facilities,
Programs, and Events
Q19. Methods That Residents Would MOST PREFER the City to Use to Communicate About Parks, Recreation
Facilities,
Programs, and Events
by percentage of respondents who selected the item as one of their top three choices
Materials at parks or recreation facilities
Promotions at special events
Q20.
Organizations Households Have Used for Recreation and Sports Activities During the Last 12 Months
Q22. Demographics: Gender Identity
by percentage of respondents (excluding “prefer not to disclose” )
0.8% selected “non-binary”
0.3% selected “prefer to self-describe”
Q23. Demographics: Race/Ethnicity
by percentage of respondents (excluding “prefer not to disclose” - multiple selections could be made)
Q24. Demographics: Number of Years Respondents Have Lived in Maple Valley
years or less6 to 10 years11 to 15 years 16 to 20 years21 to 30 years31+ years by percentage of respondents (excluding “not provided” )
2 Priority Investment Rating
Priority Investment Rating (PIR)
Overview
The Priority Investment Rating (PIR) was developed by ETC Institute to provide governments with an objective tool for evaluating the priority that should be placed on parks and recreation investments. The Priority Investment Rating was developed by ETC Institute to identify the amenities/facilities and programs/activities residents think should receive the highest priority for investment. The Priority Investment Rating reflects the importance residents place on items (sum of top 4 choices) and the unmet needs (needs that are only being partly met or not met) for each amenity/facility and program/activity relative to those that rated the highest overall. Since decisions related to future investments should consider both the level of unmet need and the importance of amenities/facilities and programs/activities, the PIR weights each of these components equally.
The PIR reflects the sum of the Unmet Needs Rating and the Importance Rating as shown in the equation below:
= UNR + IR
For example, suppose the Unmet Needs Rating for playgrounds is 26.5 (out of 100) and the Importance Rating for playgrounds is 52 (out of 100), the Priority Investment Rating for playgrounds would be 78.5 (out of 200).
How to Analyze the Charts:
• High Priority Areas are those with a PIR of at least 100. A rating of 100 or above generally indicates there is a relatively high level of unmet need and residents generally think it is important to fund improvements in these areas. Improvements in this area are likely to have a positive impact on the greatest number of households.
• Medium Priority Areas are those with a PIR of 50-99. A rating in this range generally indicates there is a medium to high level of unmet need or a significant percentage of residents generally think it is important to fund improvements in these areas.
• Low Priority Areas are those with a PIR below 50. A rating in this range generally indicates there is a relatively low level of unmet need and residents do not think it is important to fund improvements in these areas. Improvements may be warranted if the needs of very specialized populations are being targeted.
The following pages show the Unmet Needs Rating, Importance Rating, and Priority Investment Rating for amenities/facilities and programs/activities.
PIR
2025 City of Maple Valley Parks and Recreation Needs Assessment Survey: Findings Report
Unmet Needs Rating for Facilities/Amenities
the rating for the item with the most unmet need=100 the rating of all other items reflects the relative amount of unmet need for each item compared to the item with the most unmet need
Indoor swimming pools
Splashpads or spray parks
Indoor courts
Outdoor covered play or recreation space
Outdoor exercise/fitness areas
Community center
Performing arts theater
Small neighborhood parks
Outdoor pickleball courts
Picnic areas and shelters
Outdoor volleyball courts
Environmental/nature education center
Open space conservation areas
Shade and trees
Large community parks
Outdoor basketball courts
Outdoor tennis courts
Multi-use hiking, biking, walking trails
Rectangular sports fields
Bicycle pump track
Off-leash dog park(s)
Mountain bike trails and/or skill building element Playgrounds Golf courses Skateboarding parks
Mountain bike trails and/or skill building elements
Importance Rating for Facilities/Amenities
the rating for the item rated as the most important=100 the rating of all other items reflects the relative level of importance for each item compared to the item rated as the most important
Indoor swimming pools
Multi-use hiking, biking, walking trails
Community center
Splashpads or spray parks
Indoor courts
Large community parks
Playgrounds
Shade and trees
Outdoor pickleball courts
Off-leash dog park(s)
Outdoor covered play or recreation space
Open space conservation areas
Small neighborhood parks
Performing arts theater
Bicycle pump track
Mountain bike trails and/or skill building element
Mountain bike trails and/or skill building elements
Rectangular sports fields
courses
Picnic areas and shelters
Outdoor exercise/fitness areas
Environmental/nature education center
sports fields
Top Priorities for Investment for Facilities/Amenities
Indoor swimming pools
Splashpads or spray parks
Community center
Indoor courts
Multi-use hiking, biking, walking trails
Outdoor covered play or recreation space
Large community parks
Outdoor exercise/fitness areas
Performing arts theater
Shade and trees
Outdoor pickleball courts
Small neighborhood parks
Playgrounds
Open space conservation areas
Picnic areas and shelters
Off-leash dog park(s)
Environmental/nature education center
Bicycle pump track
Rectangular sports fields
Outdoor volleyball courts
Mountain bike trails and/or skill building element
Mountain bike trails and/or skill building elements
basketball courts
Unmet Needs Rating for Programs/Activities
Water fitness programs/lap swimming Swim lessons
Adult fitness and wellness programs
Outdoor adventure activities
Outdoor environmental/nature camps & programs
After school programs for youth of all ages
Community special events
Cultural enrichment programs
Adult visual arts/crafts programs STEM classes
Adult performing arts programs
Youth fitness and wellness classes
Pickleball lessons and leagues
Adult sports leagues Teen programs (ages 12-18)
Youth summer camps
Youth performing arts programs
Youth visual arts/crafts programs
Preschool programs/early childhood education
Youth sports programs
Teen sports (ages 12-18)
Cheer/gymnastics/tumbling programs
Tennis lessons and leagues Senior programs
Programs for people with cognitive disabilities
Programs for people with physical disabilities EGaming/ESports
Importance Rating for Programs/Activities
Swim lessons
Adult fitness & wellness programs
Outdoor adventure activities
Community special events
Water fitness programs/lap swimming
After school programs for youth of all ages
Youth sports programs
Preschool programs/early childhood education
Pickleball lessons & leagues
Teen programs (ages 12-18)
Outdoor environmental/nature camps & programs
Youth summer camps
Adult sports leagues
Senior programs STEM classes
Adult performing arts programs
Adult visual arts/crafts programs
Teen sports (ages 12-18)
Cultural enrichment programs
Youth performing arts programs
Cheer/gymnastics/tumbling programs
Tennis lessons & leagues
Youth visual arts/crafts programs
Programs for people with cognitive disabilities
Youth fitness & wellness classes
eGaming/eSports
Programs
Top Priorities for Investment for Programs/Activities
Based on the Priority Investment Rating
Swim lessons
Water fitness programs/lap swimming
Adult fitness & wellness programs
Outdoor adventure activities
Community special events
After school programs for youth of all ages
Outdoor environmental/nature camps & programs
Pickleball lessons & leagues
Youth sports programs STEM classes
Adult performing arts programs
Preschool programs/early childhood education
Adult visual arts/crafts programs
Cultural enrichment programs
Adult sports leagues
Teen programs (ages 12-18)
Youth summer camps
Teen sports (ages 12-18)
Senior programs
Youth performing arts programs
Youth fitness & wellness classes
Youth visual arts/crafts programs
Cheer/gymnastics/tumbling programs
Tennis lessons & leagues
Programs for people with cognitive disabilities
eGaming/eSports
Programs for people with physical disabilities
3
Benchmarking Analysis
Have you or any members of your household visited any City parks and/or recreation facilities during the past 12 months?
How would you rate the physical condition of ALL the City parks and recreation facilities you have visited?
Reasons That Prevent Households From Visiting City Parks and Recreation Facilities More
Often
Lack of amenities we want to use
Lack of parking to access parks/facilities
Lack of restrooms
Not aware of parks' or facilities' locations
Use parks/facilities in other cities/county
Parks/facilities are not well maintained
Do not feel safe using parks/facilities
Too far from our home
Lack of handicap (ADA) accessibility
of
How would you rate the overall quality of the City’s programs or events in which your household has participated?
by percentage of respondents who particip ated in programs/events in the past year
Reasons That Prevent Households From Participating in City
Parks and Recreation Department Programs More Often
I don't know what is offered
Classes are full
Too busy/not interested
Program not offered
Program times are not convenient
Lack of quality programs
Fees are too high
Use programs of other agencies
Old & outdated facilities
Registration is difficult
Lack of quality instructors
Lack of right program equipment
Lack of transportation
Do not feel safe participating
Language/cultural barriers
Too far from our home
Ways That Respondents Learn About City Parks, Recreation Facilities, Programs, and Events
Tabular Data
City of Maple Valley Parks and Recreation Needs Assessment
Q1. Including yourself, how many people in your household are...
Under age 5
Ages 5-9 0.3 136
Ages 10-14 0.3 139
Ages 15-19 0.2 93
Ages 20-24 0.1 54
Ages 25-34 0.3 111
Ages 35-44 0.8 306
Ages 45-54 0.5 183
Ages
Q2. Have you or any members of your household visited any City of Maple Valley parks and/or recreation facilities during the past 12 months?
Q2. Have your household members visited any City parks and/or recreation facilities during past 12 months
Q2a. Overall, how would you rate the physical condition of ALL the City of Maple Valley parks and recreation facilities you have visited?
Q2a. How would you rate overall physical condition of all City parks & recreation facilities you have visited
WITHOUT “NOT PROVIDED”
Q2a. Overall, how would you rate the physical condition of ALL the City of Maple Valley parks and recreation facilities you have visited? (without "not provided")
Q2a. How would you rate overall physical condition of all
parks & recreation facilities you have visited
Q3. Please CHECK ALL of the following reasons that prevent you or members of your household from visiting City of Maple Valley parks and recreation facilities more often.
Q3. All the reasons that prevent your household members from visiting City parks & recreation facilities
often
Do not feel safe using parks/facilities
Q3-14. Other
• A lot of goose droppings
• At the Maple Valley Natural Park trail, there is no physical map posted on the kiosk like there is at the Lake Sawyer end of the trail-there should be physical maps people can take photos of at ALL kiosks that have titles for trails. GPS on the trail was spotty and a friend of mine was just lost on the trail for several hours yesterday because GPS on their phone kept redirecting them and they couldn't find their way back to the trail. Long story short, they called me at the Maple Valley end so I could drive and get them and drive them back to their car at the Lake Sawyer end. Is it because "everyone should know that GPS won't work in a forest"? Should there be a few trail signs? I bought a hand held compass on a lanyard for both of us for the future.
• Bathrooms are not safe for transgender people.
• Bike lanes free from traffic.
• Busy
• Busy
• Busy working, too tired.
• Can no longer access the Elk Run Park ever since the city blockaded the property with barbed wire. We used to take walks and bike rides in that area. Really disappointed that it's no longer accessible.
• Connected trails to parks and facilities would make a lot of sense.
• crowded
• crowded
• Crowded at Lake Wilderness, at the beach and picnic areas. Sports fields are usually occupied with large groups, not engaged in baseball.Fishing at Lake Wilderness is poor after the April derby, as the lake seems 'fished out'.
• crowding, I live near lake wilderness and on most sunny days the park is very busy
• Do not have a indoor pickleball court
Q3-14. Other
• expensive to use boards/boats
• Feel excluded, not welcomed
• Fields are always occupied by sports teams.
• FIELDS FREQUENTLY DOUBLE BOOKED
• Generally full of people that are not residents; overly crowded.
• It’s not ‘exciting’
• Lack of bicycle racks to lock up our bikes. We specifically rode our bikes to summit park and were surprised there was no bike rack at all.
• Lack of fences around play area, bigger kids being too aggressive around little kids(maybe a smaller aged kids area separate) too many people playing pickleball in areas not designated for it. Create a pickleball only area
• Lack of shade at playgrounds other than lake wilderness.
• More things for older teens/adults.
• My own schedule. We visit them as often as we like.
• need awning
• need more natural areas
• Need to improve roads in and out of Maple Valley and Covington
• no interest
• No reasons
• NO SWIMMING POOL OR ARTS CENTER
• None of the above. We visit all the time.
• Not very interested
• Nothing to shield equipment from rain
• Nothing. We love the parks
• Old equipment
• Our health
• PREFERRED COVERED/INDOOR OUT OF BAD WEATHER-MOST OF THE YEAR
• previous water warnings
• Restricted by bad weather/rain. It would be nice to have more covered areas, especially close to the playground, which would help protect against both rain and sun.
• Skate park is obviously very popular but has become overcrowded. There is not enough space for younger and older kids to enjoy their equipment safely. Maple Valley could definitely use another one.
• Sometimes overcrowded
• Sometimes too busy
• The bathrooms at Summit Park are so dirty every time. Same at Lake Wilderness. These bathrooms need better maintenance and security.
• The lack of sidewalks all the way there.
• The pool in Covington could be a much better destination for recreational and competitive swimming.
• Too busy
• TOO BUSY-NOT ENOUGH SPACE-COURTS
• Too crowded
• Too crowded
• Too crowded
• TOO CROWDED
Q3-14. Other
• Too little pickleball courts and open play is disorganized
• Too many people leaving trash and playing loud music
• Traffic congestion
• use neighborhood parks, HOA
• Way too crowded and too much garbage.
• Way too many people.
• We don't necessarily avoid the Parks. Just don't visit super often
• We just moved to maple valley today!
• We use them all often . lake wilderness a cleaner lake Leeches and swimmers itch
• Weather
• Weather
• Weather
• Weather and time
Q4. Has your household participated in any programs or events offered by the City of Maple Valley Parks and Recreation Department during the past 12 months?
Q4. Have your household members participated in any programs or events offered by City Parks & Recreation Department during past 12 months
Q4a. How would you rate the overall quality of the City of Maple Valley Parks and Recreation Department programs or events in which your household has participated?
Q4a. How would you rate overall quality of City Parks & Recreation Department programs or events in which your household has participated
WITHOUT “NOT PROVIDED”
Q4a. How would you rate the overall quality of the City of Maple Valley Parks and Recreation Department programs or events in which your household has participated? (without "not provided")
Q4a. How would you rate overall quality of City Parks & Recreation Department programs or events in which your household has participated
Q5. Please CHECK ALL of the following reasons that prevent you or members of your household from participating in City of Maple Valley Parks and Recreation Department programs more often.
Q5. All the reasons that prevent your household members from participating in City Parks & Recreation Department programs more often
Q5-19. Other
• Busy going to sports events in Issaquah for our grandchildren.
• Cannot participate in the winter, due to rain or being cold
• Discomfort due to uncomfortable/offensive City displayed imagery such as pride flags and BLM-inspired Juneteenth black supremacist fist images.
• FOUND OTHER PROGRAMS EASIER TO USE EG BLACK DIAMOND DAY CAMPY, STEAM BOAT STUDIO
• Hard to find a program at a good time for the right age group that seemed worth the cost. Would love to do soccer or martial arts though but hard to commit weekly cuz of other events, zoo, etc.
• I just want more space
• Lack of interesting programs for my demographic (35-44). Everything seems for children/teenagers, or seniors. I also have a disability, so I can’t play sports and that’s usually the only thing offered for adults.
• Lack of parking
• lazy
• more adult center, activities for handicapped
• no interest
• Our health
• Play pickleball
• Poor communication on scheduling changes.
• Programs not relevant to my interests, again, do feel excluded because of identities
• Programs offered are not of interest
• Programs we want are not offered.
• Some of the vendors don't look safe, rides for kids specifically. Otherwise they do a great job!
• Sometime registration is too late and with only a few slots to offer.
• We did the summer camp for sports. I know that some sports there is no way to get shade. But basketball does not have to be one of those sports. Plenty of times basketball is inside. Or outside in the shade. Anyway. It was very very hot that week. My kids almost got heat stroke. So although we still do plenty of things through maple valley parks & rec, summer basketball camp will not be one of them.
• We just moved to maple valley today!
• Would be nice to have soccer in spring and fall
2025 City of Maple Valley Parks and Recreation Needs
Q6. Please indicate how well your needs are being met for each of the facilities/amenities listed below on a scale of 4 to 1, where 4 means your needs are "Fully Met," and 1 means your needs are "Not Met" at all.
(N=403)
Q6-1. Bicycle pump track
Q6-2. Community center (multi-use space for events, exercise & activities)
Q6-3. Diamond sports fields (baseball, softball)
Q6-4. Disc golf
Q6-5. Environmental/nature education center
Q6-6. Golf courses
Q6-7. Indoor courts (basketball, volleyball, pickleball)
Q6-8. Indoor swimming pools
Q6-9. Large community parks
Q6-10.
Q6-11. Multi-use hiking, biking, walking trails (paved or unpaved)
Q6-15. Outdoor covered play or recreation space
Q6-18. Outdoor tennis courts
Q6-19.
Q6-20.
2025 City of Maple Valley Parks and Recreation Needs Assessment
Q6. Please indicate how well your needs are being met for each of the facilities/amenities listed below on a scale of 4 to 1, where 4 means your needs are "Fully Met," and 1 means your needs are "Not Met" at all.
Q6-22. Playgrounds
Q6-23. Rectangular sports fields (football, lacrosse, soccer, cricket)
Shade & trees
Q6-25. Skateboarding parks
Q6-26. Small neighborhood parks
Q6-27. Splashpads or spray parks
Q6-28. Other
WITHOUT “NO NEED”
Q6. Please indicate how well your needs are being met for each of the facilities/amenities listed below on a scale of 4 to 1, where 4 means your needs are "Fully Met," and 1 means your needs are "Not Met" at all. (without "no need")
(N=403)
Q6-1. Bicycle pump track
Q6-2. Community center (multi-use space for events, exercise & activities)
Q6-3. Diamond sports fields (baseball, softball)
Q6-4. Disc golf
Q6-5. Environmental/nature education center
Q6-6. Golf courses
Q6-7. Indoor courts (basketball, volleyball, pickleball)
Q6-8. Indoor swimming pools
Q6-10. Mountain bike trails and/or skill building elements
Q6-11. Multi-use hiking, biking, walking trails (paved or unpaved)
Q6-12. Off-leash dog park(s)
Q6-13.
Q6-14. Outdoor basketball courts
Q6-15. Outdoor covered play or recreation space
Q6-16. Outdoor exercise/fitness areas
Q6-17.
Q6-20. Performing arts theater
Q6-21. Picnic areas & shelters
WITHOUT “NO NEED”
Q6. Please indicate how well your needs are being met for each of the facilities/amenities listed below on a scale of 4 to 1, where 4 means your needs are "Fully Met," and 1 means your needs are "Not Met" at all. (without "no need")
Q6-22. Playgrounds
Q6-23. Rectangular sports fields (football, lacrosse, soccer, cricket)
Q6-24. Shade & trees
Q6-25. Skateboarding parks
Q6-26. Small neighborhood parks
Q6-27. Splashpads or spray parks
Q6-28. Other
Q6-28. Other
• Access to the elk run open space
• ADA specific areas
• Adult outdoor exercise/fitness area and equipment.
• adult swings, drinking water, benches
• arboretum
• Celebrations respecting Easter or Memorial Day rather than a month of “pride”.
• Community center like a YMCA that has courts, gym, indoor track, indoor pool. It rains here and there is nothing to do
• Community pool and/or splash pad
• Community swimming pool
• Connected trail system would make sense.
• Covered pickleball courts
• Don’t know what’s a private community park or MV park. Only trail that links most parks is the Lake wilderness trail. Trail should be altered to drop people at the cross walk, or create a large crosswalk with a no turn on red light sign so pedestrians can continue on their way. Need a unified protected bike lane to parks and shopping.
• gym
• hiking trails
• I door YMCA or community center like federal way with an indoor gym, pool, courts, meeting spaces, etc.
• I want a zipline from 4 corners all the way to lake wilderness park. I also want all the lake front houses bulldozed down so you can walk around lake wilderness.
• I would like to see more and safer bicycling infrastructure including the promised bridge over the train tracks. Not sure if that is something Maple Valley has jurisdiction over though.
• Ice rink
• Improved disc golf. Local organization to run that live in the community. Why is it run by individuals who don’t live in our city?
• Indoor pickleball or covered pickleball
• indoor pool
• Indoor tennis court
• Indoor/covered Pickleball courts
• It would be great to have arts in particular clay and painting.
• Love the parks, but would also love a pool or splash park too.
• Maple valley is significantly behind all other cities around us for specialized options for younger kids.
• Maple valley needs more of everything and a POOL!!!!
• More covered picnic/seating areas, and a rock wall for climbing (preferably indoors for year-round use).
• More lakefront and river access
• More trees for nature. High school has great plays.
• Need more pickleball courts!! We have over 50 players daily on 4 courts! Need covered courts and lights to foster this growing sport that brings people together!
• No community garden space. Not many options for older kids (tweens/teens who don’t skateboard)
• open water recreation
• Outdoor swimming pools
• Paved not gravel cedar river trail.
2025 City of Maple Valley Parks and
Q6-28. Other
• place for teens to hang out
• POOL
• Rec center and pool
• Reserved Boat trailer parking at Lake Wilderness
• Rock climbing
• Sidewalk
• Sidewalks on main roads.
• The community center is old and antiquated. It does not have a lot to offer to our youth to keep them occupied and staying out of trouble. It has more programs for seniors. I also think it’s important to offer p patches (community shared gardens). Some of our home plots do not have adequate space or sun for gardens. In the areas of the properties where there is adequate sun, HOAs prohibit converting your front lawn to garden space. It would be a great way to increase access to fresh fruits and veggies that can be grown for personal use to keep our community healthy.
• Trees for hammocks
• Walk paths not there in lots of places. Can’t take kids safely out on bikes
• We go to the Covington aquatic center. So we do regularly need & use their facilities. The price has gotten an awful lot higher for us because we are not Covington residents. The competition to get in to those classes for everyone else that is still interested (my kids all passed the final level of swimming lessons so we don’t need it anymore.) is fierce! My kids are all on track for being on the Tahoma high school swim team. But pretty soon there will not be enough kids to be on the Tahoma high school swim team because it is hard to get swimming lessons around here now. A pool would be nice for you guys to consider eventually.
• We LOVE it here!!! Maybe more basketball courts, free meetup spaces for groups with shared interests to meet and more yoga, exercise dance, and tai- chi classes!
• Would love to see a ymca in maple valley
Q7. Which FOUR facilities/amenities from the list in Question 6 are MOST IMPORTANT to your household?
Top choice
Q7. Which FOUR facilities/amenities from the list in Question 6 are MOST IMPORTANT to your household?
2nd choice
Q7. Which FOUR facilities/amenities from the list in Question 6 are MOST IMPORTANT to your household?
3rd choice
Q7. Which FOUR facilities/amenities from the list in Question 6 are MOST IMPORTANT to your household?
4th choice
SUM OF TOP 4 CHOICES
Q7. Which FOUR facilities/amenities from the list in Question 6 are MOST IMPORTANT to your household? (top 4)
Sum of top 4 choices
Q8. The City of Maple Valley is interested in the community's need for ADDITIONAL OUTDOOR RECREATION SPACES. Please indicate how often your household would use each of these amenities.
(N=403) Several times/ A few times/ At least once/ Less than week
Q8-1. Baseball/softball fields
Q8-4. Cricket pitch
Q8-5. Football fields
Local walking/jogging trails
Q8-11. Pickleball courts
Q8-18.
WITHOUT “DON’T KNOW”
Q8. The City of Maple Valley is interested in the community's need for ADDITIONAL OUTDOOR RECREATION SPACES. Please indicate how often your household would use each of these amenities. (without "don't know")
(N=403)
Bicycle pump track
Q8-5. Football fields
Q8-18.
Q8-20. Other
• Access to Elk Run open space. Please get rid of the barbed wire fence. What a colossal waste and insulting use of tax dollars.
• ADA
• Badminton court
• Bike trails
• Community pool
• Disc golf
• Improved disc golf course
• Indoor aquatic center
• Indoor pool
• Indoor pool
• Indoor pool
• Indoor pool
• Indoor swimming pool with classes.
• Indoor tennis and volleyball.
• Indoor tennis courts
• Indoor workout facility - ex YMCA!
• INDOOR/OUTDOOR HEATED POOL
• lake wilderness
• leave wooded areas
• More pickleball courts I play daily at wilderness
• More public seating areas in the parks.
• Mostly use the walking path and dog park at the new park by the High School. Besides Lake Wilderness and Arboretum, no idea where the other parks are located.
• Mountain biking trails
• Not outdoor, but please consider a Maple Valley swimming pool with a shallow end. We need more safe swim opportunities and swim lessons.
• Outdoor covered pickleball courts
• Outdoor swimming pool. You could make it convertible to be indoor/outdoor
• Paved walking trails
• Pickleball
• place for teens
• Pool
• Pool
• Pool
• Pool
• Pool
• POOL WITH SWIMMING LESSONS
• Pool! We do visit the aquatic center & all 3 kids swim 5-6 days per week in the summer.
• Pool
• Reserved boat trailer parking at Lake Wilderness boat launch
Q8-20. Other
• Rock climbing
• rollerblade, paved bike trails
• Soccer fields needed
• Swimming pool
• Swimming pool
• Swimming pool
• Swimming pool
• Swimming pool
• Swimming, rec center
• Tween/teen activity options Community pea patch/gardens
• Walk on a sidewalk
• Zipline
Q9. Which FOUR of the amenities listed in Question 8 would your household be MOST LIKELY to use?
Q9. Which FOUR of the amenities listed in Question 8 would your household be MOST LIKELY to use?
2nd choice
Q9. Which FOUR of the amenities listed in Question 8 would your household be MOST LIKELY to use?
3rd choice
Q9. Which FOUR of the amenities listed in Question 8
SUM OF TOP 4 CHOICES
Q9. Which FOUR of the amenities listed in Question 8 would your household be MOST LIKELY to use? (top 4)
Sum of top 4 choices
120 City of Maple Valley, WA
Q10. The City of Maple Valley is interested in the community's need for additional outdoor recreation spaces; however, additional funding would be needed to build new amenities. Which ONE of the following statements best represents how you feel the construction of new amenities should be funded?
Q10. How should construction of new amenities be
WITHOUT “NOT PROVIDED”
Q10. The City of Maple Valley is interested in the community's need for additional outdoor recreation spaces; however, additional funding would be needed to build new amenities. Which ONE of the following statements best represents how you feel the construction of new amenities should be funded? (without "not provided")
Q10. How should construction of new amenities be funded
Q11. Please indicate how well your needs are being met for each of the programs/activities listed below on a scale of 4 to 1, where 4 means your needs are "Fully Met," and 1 means your needs are "Not Met" at all.
(N=403)
Q11-1. Adult fitness & wellness programs
Q11-2. Adult performing arts programs
Q11-3. Adult sports leagues
Q11-4. Adult visual arts/crafts programs
Q11-5. After school programs for youth of all ages 3.7%
Q11-6. Cheer/gymnastics/tumbling programs
Q11-7. Community special events
Q11-9. eGaming/eSports
Q11-10. Outdoor adventure activities (rock climbing, kayaking, biking)
Q11-11. Outdoor environmental/nature camps & programs
Q11-12. Pickleball lessons & leagues
Q11-13. Preschool programs/early childhood education
Q11-14. Programs for people with cognitive disabilities
Q11-15. Programs for people with physical disabilities
Q11-16. Senior programs
Q11-17. STEM (science, technology, engineering, & mathematics) classes
Q11-19. Teen programs (ages 12-18)
Q11-20. Teen sports (ages 12-18)
2025 City of Maple Valley Parks and Recreation Needs
Q11. Please indicate how well your needs are being met for each of the programs/activities listed below on a scale of 4 to 1, where 4 means your needs are "Fully Met," and 1 means your needs are "Not Met" at all.
WITHOUT “NO NEED”
Q11. Please indicate how well your needs are being met for each of the programs/activities listed below on a scale of 4 to 1, where 4 means your needs are "Fully Met," and 1 means your needs are "Not Met" at all. (without "no need")
(N=403)
Q11-1. Adult fitness & wellness programs
Q11-2. Adult performing arts programs
Q11-3. Adult sports leagues
Q11-4. Adult visual arts/crafts programs
Q11-5. After school programs for youth of all ages
Q11-6. Cheer/gymnastics/tumbling programs
Community special events
Q11-8. Cultural enrichment programs
Q11-9.
Q11-10. Outdoor adventure activities (rock climbing, kayaking, biking)
Q11-11. Outdoor environmental/nature camps & programs
Q11-12. Pickleball lessons & leagues
Q11-13. Preschool programs/early childhood education
Q11-14. Programs for people with cognitive disabilities
Q11-15. Programs for people with physical disabilities
Q11-16. Senior programs
Q11-17. STEM (science, technology, engineering, & mathematics) classes
Q11-19. Teen programs (ages 12-18)
Q11-20. Teen sports (ages 12-18)
2025 City of Maple Valley Parks and Recreation Needs Assessment
WITHOUT “NO NEED”
Q11. Please indicate how well your needs are being met for each of the programs/activities listed below on a scale of 4 to 1, where 4 means your needs are "Fully Met," and 1 means your needs are "Not Met" at all. (without "no need")
Q11-28. Other:
Q12. Which FOUR programs/activities from the list in Question 11 are MOST IMPORTANT to your household?
Top choice
Q12. Which FOUR programs/activities from the list in Question 11 are MOST IMPORTANT to your household?
2nd choice
Q12. Which FOUR programs/activities from the list in Question 11 are MOST IMPORTANT to your household?
3rd choice
Q12. Which FOUR programs/activities from the list in Question 11 are MOST IMPORTANT to your household?
4th
SUM OF TOP 4 CHOICES
Q12. Which FOUR programs/activities from the list in Question 11 are MOST IMPORTANT to your household? (top 4)
Sum of top 4 choices
Q13. The City of Maple Valley is exploring the importance of indoor recreation space that meets the needs of your entire family. Below are some elements that could be included in that facility. Please indicate how often your household would use each of these paid features.
(N=403)
Q13-1. Aerobics/fitness/ gymnastics
Q13-3. Banquet/special event space
Q13-4. Changing/shower/locker rooms
Q13-5. Childcare or preschool
Q13-6. Climbing wall
Q13-7. Coffee/snack/grab & go food
Q13-8. Covered outdoor seating and/or activity elements
Q13-9. Game rooms (e.g., pool, air hockey, carpet ball)
Q13-10. Indoor running/walking track
Q13-11. Indoor sports courts (handball, racquetball, squash)
Q13-12. Interactive water play (lazy river, spray, slides, fountains)
Q13-13. Lap lanes for swim lessons, exercise swimming, competitive swimming or therapeutic purposes
Q13-14. Multi-purpose community rooms for classes/ meetings/parties
times/ A few times/ At least once/ Less than week
Q13. The City of Maple Valley is exploring the importance of indoor recreation space that meets the needs of your entire family. Below are some elements that could be included in that facility. Please indicate how often your household would use each of these paid features.
Several times/ A few times/ At least once/ Less than week month month once/month Seldom/never Don't know Q13-15. Multi-purpose courts for basketball, volleyball, pickleball, etc.
Q13-17. Senior programs, resources, & services
Q13-18. Technology/innovation center (creative/maker space)
Q13-19. Teen lounge areas
Q13-20. Weight room/ cardiovascular equipment area
Q13-21. Youth counseling services
Q13-22. Other
WITHOUT “DON’T KNOW”
Q13. The City of Maple Valley is exploring the importance of indoor recreation space that meets the needs of your entire family. Below are some elements that could be included in that facility. Please indicate how often your household would use each of these paid features. (without "don't know")
(N=403)
Q13-1. Aerobics/fitness/ gymnastics
Arts & crafts rooms
Q13-3. Banquet/special event space
Q13-4. Changing/shower/ locker rooms
Q13-5. Childcare or preschool space
Q13-6. Climbing wall
Q13-7. Coffee/snack/grab & go food
Q13-8. Covered outdoor seating and/or activity elements
Q13-9. Game rooms (e.g., pool, air hockey, carpet ball)
Q13-10. Indoor running/ walking track
Q13-11. Indoor sports courts (handball, racquetball, squash)
Q13-12. Interactive water play (lazy river, spray, slides, fountains)
Q13-13. Lap lanes for swim lessons, exercise swimming, competitive swimming or therapeutic purposes
Q13-14. Multi-purpose community rooms for classes/ meetings/parties
2025 City of Maple Valley Parks and Recreation Needs
WITHOUT “DON’T KNOW”
Q13. The City of Maple Valley is exploring the importance of indoor recreation space that meets the needs of your entire family. Below are some elements that could be included in that facility. Please indicate how often your household would use each of these paid features. (without "don't know") At least once/ Less than once/ Several times/week A few times/month month month Seldom/never
Q13-15. Multi-purpose courts for basketball, volleyball, pickleball, etc.
Q13-16. Seating/lounge areas
Q13-17. Senior programs, resources, & services
Q13-18. Technology/ innovation center (creative/ maker space)
Q13-19. Teen lounge areas
Q13-20. Weight room/ cardiovascular equipment area
Q13-21. Youth counseling services
Q13-22. Other
Q13-22. Other
• Access to Elk Run open space
• Pool
• Pool
• Pool
• Rec center with fitness swimming child care etc.
• We exercise at home or outside. Unless we retire, I don’t see that changing. We don’t like paying fees to use services we pay for with our taxes. There are other public facilities that could be used at the Tahoma HS that we do not have access to even though we continue to pay for them. They have an outdoor walking track and tennis courts that are under utilized. We should co-op those.
• Yoga
Q14. Which FOUR of the features listed in Question 13 would your household be MOST LIKELY to use if they were included in a new indoor recreation space?
Top choice
Q14. Which FOUR of the features listed in Question 13 would your household be MOST LIKELY to use if they were included in a new indoor recreation space? Q14. 2nd choice
Q14. Which FOUR of the features listed in Question 13 would your household be MOST LIKELY to use if they were included in a new indoor recreation space?
3rd choice
Q14. Which FOUR of the features listed in Question 13 would your household be MOST LIKELY to use if they were included in a new indoor recreation space?
Q14. 4th choice
City of Maple Valley
SUM OF TOP 4 CHOICES
Q14. Which FOUR of the features listed in Question 13 would your household be MOST LIKELY to use if they were included in a new indoor recreation space? (top 4)
Q14. Sum of top 4 choices
Q15. The City of Maple Valley is exploring the importance of indoor recreation space for your entire family. However, additional funding would be needed to build a new facility. Which ONE of the following statements best represents how you feel the construction of a new facility should be funded?
Q15. How should construction of a new facility be funded
WITHOUT “NOT PROVIDED”
Q15. The City of Maple Valley is exploring the importance of indoor recreation space for your entire family. However, additional funding would be needed to build a new facility. Which ONE of the following statements best represents how you feel the construction of a new facility should be funded? (without "not provided")
Q15. How should construction of a new
Q15a. Currently, City of Maple Valley Parks and Recreation provides programs and services based on the actual cost and is funded through user fees. Which ONE of the following statements best represents how you feel the cost for operations and programming in a new indoor recreation space for the entire family should be funded?
Q15a. How should cost for operations & programming in a new indoor recreation space for entire family be
WITHOUT “DON’T KNOW”
Q15a. Currently, City of Maple Valley Parks and Recreation provides programs and services based on the actual cost and is funded through user fees. Which ONE of the following statements best represents how you feel the cost for operations and programming in a new indoor recreation space for the entire family should be funded? (without "don't know")
Q15a. How should cost for operations & programming in a new indoor recreation space for entire family be
Fees from users should pay majority of costs, & new
Q16. LAKE WILDERNESS PARK: Please rate your level of support for each of the following actions the City of Maple Valley could take to improve the park.
(N=403)
Q16-1. Add additional parking
Q16-2. Add new bandshell/stage at amphitheater
Q16-3. Add new basketball courts
Q16-4. Add new covered space (basketball, pickleball, tennis, playgrounds, general use)
Q16-5. Add new diamond sports fields (baseball, softball)
Q16-6. Add new off-leash dog area
Q16-7. Add new outdoor exercise/fitness areas
Q16-8. Add new outdoor tennis/pickleball courts
Q16-9. Add new picnic tables/shelters
Q16-10. Add new playgrounds
Q16-11. Add new rectangular sports fields (football, soccer, lacrosse, cricket)
Q16-12. Add new splashpad/spray park
Q16-13. Develop new trails and/or connect existing trails
Q16-14. Improve access to regional trail
Q16-15. Improve existing outdoor tennis/ pickleball courts
Q16-16. Improve existing pathways and/or trails
Q16-17. Improve existing picnic tables/ shelters
Q16-18. Improve existing playground
Q16. LAKE WILDERNESS PARK: Please rate your level of support for each of the following actions the City of Maple Valley could take to improve the park.
Q16-20. Preserve existing natural areas
Q16-21. Other
Q16-21. Other
• Add a decent cafe or other vendor with garden theme
• Allow for more lake rentals (add more kayaks, canoes, paddleboards, etc. to the inventory so that more people can enjoy Lake Wilderness on the water).
• BATHROOM NEAR PLAYGROUND NEEDS TO BE IMPROVED
• Bike pump track
• BUILD A GYMNASIUM
• Community Center with pool.
• easier access of Cedar river trail on south side, bike lane and walking path along entrance from Witte Rd
• Get rid of houses around lake
• Keep it updated and clean
• More disc golf
• Night market could be improved.
• Open up access to the Elk Run open space
• parking specific to boat ramp
• Pool
• POOL-SWIMMING
• Rec center
• Reserved parking f for boat trailers at the boat launch. It is unusable when non-boaters fill it and double park to use the meadow.
• Rock climbing
• Sand volleyball courts
• Volleyball
Q17. Which FOUR actions from the list in Question 16 are the most important to your household?
Q17. Top choice
Add
Q17. Which FOUR actions from the list in Question 16 are the most important to your household?
Q17. 2nd choice
Add
Q17. Which FOUR actions from the list in Question 16 are the most important to your household?
Q17. 3rd choice
Add
Q17. Which FOUR actions from the list in Question 16 are the most important to your household?
4th choice
SUM OF TOP 4 CHOICES
Q17. Which FOUR actions from the list in Question 16 are the most important to your household? (top 4)
Q17. Sum of top 4 choices
Add
covered
(basketball, pickleball, tennis, playgrounds, general use)
Add
Add
(football, soccer, lacrosse,
Q18. From the following list, please CHECK ALL the ways you learn about City of Maple Valley parks, recreation facilities, programs, and events.
Q18. All the ways you learn about City parks, recreation facilities, programs, & events
Q18-11. Other:
Q19. From the list in Question 18, which THREE methods of communication would you MOST PREFER the City use to communicate with you about parks, recreation facilities, programs, and events?
Top choice
Q19. From the list in Question 18, which THREE methods of communication would you MOST PREFER the City use to communicate with you about parks, recreation facilities, programs, and events?
2nd choice
Q19. From the list in Question 18, which THREE methods of communication would you MOST PREFER the City use to communicate with you about parks, recreation facilities, programs, and events?
3rd choice
SUM OF TOP 3 CHOICES
Q19. From the list in Question 18, which THREE methods of communication would you MOST PREFER the City use to communicate with you about parks, recreation facilities, programs, and events? (top 3)
3
Q20. From the following list, please CHECK ALL of the organizations that you or members of your household have used for recreation and sports activities during the last 12 months.
Q20. All the organizations your household members have used for recreation & sports activities during last 12 months
of Maple Valley
(e.g., synagogues, churches)
Q20-9. Other
• Davids Glen Driving Range
• Girl Scouts
• Greater Maple Valley Community Center
• HOA
• King County
• Martial arts
• Private daycare
• Rail to Trail system - Cedar to Green, Black Damond Open Space - Settle Pipeline trail.
• Social groups
• The special needs community in Maple Valley must go outside the city limits for enrichment programs. Tahoma SD has a great special needs division, but no community support.
• Trampoline parks
• Work affiliated interest groups like cycling and running clubs.
Q21. If you had $100, how would you allocate the funds among the parks and recreation categories listed below?
Improve/maintain existing parks & open space
Acquire new park land & open space
Construct new sports fields (softball, soccer, baseball, etc.)
Construct new indoor recreation facility
Expand program offerings
Other
$29.82
$13.38
$5.96
$37.48
$8.91
$4.47
Q21. Other
• Adult wellness and fitness programs
• Better connect trails
• Build a swimming pool
• Connecting our adding new walking/bilking trails
• Covered outdoor space for sports
• Covered pickleball courts
• GIVE IT BACK TO TAXPAYERS
• Indoor swimming
• make lake Wilderness softball field into dog park as it is never used
• No idea how to spend the last dollar on a required second category.
• Outdoor covered lighted pickleball courts
• Pool
• Pool
• Pool
• Pool
• Pool and water features
• POOL FOR SWIMMING AND LESSONS
• Pool or splash pad
• PUMP track
• Road going in and out of Maple Valley and Covington
• splash pads for summer
• Splashpad / new pool / bike pump track
• Swim facilities NOT THE LEECH GROSS LAKE
• Swimming pool!!!!
• USE IT FOR SOMETHING ELSE
• Water activities
Q22. Your gender identity:
Q22-4. Your gender identity
WITHOUT “PREFER NOT TO DISCLOSE”
Q22. Your gender identity: (without "prefer not to disclose")
Q22-4. Your gender identity
Q22-4. Self-describe your gender identity:
Q22-4. Self-describe your gender identity
Q23. Which of the following best describes your race/ethnicity?
WITHOUT “PREFER NOT TO DISCLOSE”
Q23. Which of the following best describes your race/ethnicity? (without "prefer not to disclose")
Q23-7. Self-describe your race/ethnicity:
Q23-7. Self-describe
Q24. How many years have you lived in Maple Valley?
Q24. How many years have you lived in Maple Valley
WITHOUT “NOT PROVIDED”
Q24. How many years have you lived in Maple Valley? (without "not provided")
Q24. How many years have you lived in Maple Valley
5
Survey Instrument


A Natural Fit
May 2025
Dear Maple Valley Resident,
The City of Maple Valley Parks & Recreation Department is dedicated to enhancing the quality of life in our community by providing safe, welcoming parks and recreation opportunities-places where people can gather, stay active, and build meaningful connections. To ensure we continue meeting the needs of our growing and diverse community, we'd like your input to help determine park, facility, and recreation priorities for the future.
Even if you don't currently use our parks or facilities, your voice matters. This survey is an important part of our planning process and will help us understand how we can better serve you and your family now, and into the future.
The survey will take approximately 10-15 minutes to complete, and every question helps. By sharing your thoughts, you'll help shape a plan guided by community priorities-a plan that strengthens neighborhood connections, improves quality of life, and ensures that Your Parks reflect Your Voice.
We've partnered with ETC Institute, an independent research firm, to conduct the survey and analyze the results. All responses will remain confidential and will be compiled into a public report used to guide future decision-making.
Please complete and return your survey within the next two weeks using the enclosed postage-paid envelope. If you prefer, you may complete the survey on line at m map Leva lleysurvey. o rg.
Thank you for taking the time to help shape the future of Maple Valley Parks and Recreation. We're listening-because these are Your Parks, Your Voice.

Dave Johnso City of Maple Valley Director Parks & Recreation

2025 City of Maple Valley Parks and Recreation Needs Assessment Survey
The City of Maple Valley would like your input to help determine park, facility, and recreation priorities for the community. This survey will take 10-15 minutes to complete. When you are finished, please return your completed survey in the enclosed postage-paid, return-reply envelope. If you prefer, you can complete the survey online at maplevalleysurvey.org. We greatly appreciate your time!
1. Including yourself, how many people in your household are...
Under age 5: Ages 5-9: Ages 10-14: Ages 15-19: Ages 20-24: Ages 25-34:
Ages 35-44: Ages 45-54: Ages 55-64: Ages 65-74: Ages 75+:
2. Have you or any member of your household visited any City of Maple Valley parks and/or recreation facilities during the past 12 months?
____(1) Yes [Answer Q2a.] ____(2) No [Skip to Q3.]
2a. Overall, how would you rate the physical condition of ALL the City of Maple Valley parks and recreation facilities you have visited?
____(4) Excellent ____(3) Good ____(2) Fair ____(1) Poor
3. Please CHECK ALL of the following reasons that prevent you or members of your household from visiting City of Maple Valley parks and recreation facilities more often.
____(01) Do not feel safe using parks/facilities
____(02) Lack of amenities we want to use
____(03) Lack of handicap (ADA) accessibility
____(04) Lack of lighting
____(05) Lack of parking to access parks/facilities
____(06) Lack of restrooms
____(07) Lack of shade
____(08) Lack of transportation
____(09) Language/cultural barriers
____(10) Not aware of parks' or facilities' locations
____(11) Parks/facilities are not well maintained
____(12) Too far from our home
____(13) Use parks/facilities in other cities/county
____(14) Other:
4. Has your household participated in any programs or events offered by the City of Maple Valley Parks and Recreation Department during the past 12 months?
____(1) Yes [Answer Q4a.]
____(2) No [Skip to Q5.]
4a. How would you rate the overall quality of the City of Maple Valley Parks and Recreation Department programs or events in which your household has participated?
____(4) Excellent ____(3) Good ____(2) Fair ____(1) Poor
5. Please CHECK ALL of the following reasons that prevent you or members of your household from participating in City of Maple Valley Parks and Recreation Department programs more often.
____(01) Classes are full
____(02) Do not feel safe participating
____(03) Fees are too high
____(04) I don't know what is offered
____(05) Lack of quality instructors
____(06) Lack of quality programs
____(07) Lack of right program equipment
____(08) Lack of transportation
____(09) Language/cultural barriers
____(10) Old and outdated facilities
____(11) Online registration is not user friendly
____(12) Poor customer service by staff
____(13) Program not offered
____(14) Program times are not convenient
____(15) Registration is difficult
____(16) Too far from our home
____(17) Too busy/not interested
____(18) Use programs of other agencies
____(19) Other:
6. Please indicate how well your needs are being met for each of the facilities/amenities listed below on a scale of 4 to 1, where 4 means your needs are "Fully Met," and 1 means your needs are "Not Met" at all. If you do not have a need for an item listed, please circle "9" for "No Need."
23.
7. Which FOUR facilities/amenities from the list in Question 6 are MOST IMPORTANT to your household? [Write in your answers below using the numbers from the list in Question 6, or circle "NONE."] 1st: ____ 2nd: ____ 3rd: ____ 4th: ____
8. The City of Maple Valley is interested in the community's need for ADDITIONAL OUTDOOR RECREATION SPACES. Please indicate how often your household would use each of these amenities.
would you use these amenities?
9. Which FOUR of the amenities listed in Question 8 would your household be MOST LIKELY to use?
[Write in your answers below using the numbers from the list in Question 8, or circle "NONE".] 1st: ____ 2nd: ____ 3rd: ____ 4th: ____ NONE
10. The City of Maple Valley is interested in the community's need for additional outdoor recreation spaces; however, additional funding would be needed to build new amenities. Which ONE of the following statements best represents how you feel the construction of new amenities should be funded?
____(1) Issue new bonds
____(2) Sales tax increase
____(3) New development impact fees (fees charged on future residential development)
____(4) I don't support building additional outdoor amenities
11. Please indicate how well your needs are being met for each of the programs/activities listed below on a scale of 4 to 1, where 4 means your needs are "Fully Met," and 1 means your needs are "Not Met" at all. If you do not have a need for an item listed, please circle "9" for "No Need."
12. Which FOUR programs/activities from the list in Question 11 are MOST IMPORTANT to your household? [Write in your answers below using the numbers from the list in Question 11, or circle "NONE."] 1st: ____ 2nd: ____ 3rd: ____ 4th: ____
13 . The City of Maple Valley is exploring the importance of indoor recreation space that meets the needs of your entire family. Below are some elements that could be included in that facility. Please indicate how often your household would use each of these paid features.
How often would you use these features?
14. Which FOUR of the features listed in Question 13 would your household be MOST LIKELY to use if they were included in a new indoor recreation space? [Write in your answers below using the numbers from the list in Question 13, or circle "NONE".]
15. The City of Maple Valley is exploring the importance of indoor recreation space for your entire family. However, additional funding would be needed to build a new facility. Which ONE of the following statements best represents how you feel the construction of a new facility should be funded?
____(1) Issue new bonds
____(2) Sales tax increase
____(3) New development impact fees (fees charged on future residential development) ____(4) I don't support building a new recreation and/or community center [Skip to Q16.]
15a. Currently, City of Maple Valley Parks and Recreation provides programs and services based on the actual cost and is funded through user fees. Which ONE of the following statements best represents how you feel the cost for operations and programming in a new indoor recreation space for the entire family should be funded?
____(1) 100% through existing City taxes
____(2) New general City taxes should pay the majority of costs, and fees from users should pay for the remaining costs
____(3) Fees from users should pay the majority of costs, and new taxes should pay for the remaining costs
____(4) 100% through user fees
____(9) Don't know
16. LAKE WILDERNESS PARK: Please rate your level of support for each of the following
the City of Maple Valley could take to improve the park.
17. Which FOUR actions from the list in Question 16 are the most important to your household? [Write in your answers below using the numbers from the list in Question 16, or circle "NONE."] 1st: ____ 2nd: ____ 3rd: ____ 4th: ____ NONE
18. From the following list, please CHECK ALL the ways you learn about City of Maple Valley parks, recreation facilities, programs, and events.
____(01) Recreation activity guide
____(02) City website
____(03) Materials at parks or recreation facilities
____(04) Conversations with City staff
____(05) Word of mouth
____(06) Promotions at special events
____(07) Banners
____(08) Emails
____(09) Social Media
____(10) Flyers
____(11) Other:
19. From the list in Question 18, which THREE methods of communication would you MOST PREFER the City use to communicate with you about parks, recreation facilities, programs, and events?
[Write in your answers below using the numbers from the list in Question 18, or circle "NONE."]
1st: ____ 2nd: ____ 3rd: ____ NONE
20. From the following list, please CHECK ALL of the organizations that you or members of your household have used for recreation and sports activities during the last 12 months.
____(01) City of Maple Valley
____(02) Neighboring cities
____(03) Places of worship (e.g., synagogues, churches)
____(04) Private and non-profit youth sports
____(05) Private clubs (tennis, health, swim, fitness)
____(06) Private schools/charter schools
____(07) Private summer camps
____(08) Public schools
____(09) Other:
21. If you had $100, how would you allocate the funds among the parks and recreation categories listed below? [Please select at least two from the list and be sure your total adds up to $100.]
$ _ Improve/maintain existing parks and open space
$ _ Acquire new park land and open space
$ _ Construct new sports fields (softball, soccer, baseball, etc.)
$ _ Construct new indoor recreation facility
$ _ Expand program offerings
$ _ Other:
$100 TOTAL
22. Your gender identity:
____(1) Male
____(2) Female
____(3) Non-binary
____(4) Prefer to self-describe: ____(5) Prefer not to disclose
23. Which of the following best describes your race/ethnicity?
____(01) Asian or Asian Indian
____(02) Black or African American
____(03) American Indian or Alaska Native
____(04) White
____(05) Native Hawaiian or other Pacific Islander
____(06) Hispanic or Latino
____(88) Prefer not to disclose
____(99) Other:
24. How many years have you lived in Maple Valley? ________ years
25. Would you be willing to participate in future surveys sponsored by the City of Maple Valley?
____(1) Yes [Please answer Question 25a.] ____(2) No
25a. Please provide your contact information.
Mobile Phone Number:
Email Address:
This concludes the survey. Thank you for your time!
Please return your completed survey in the enclosed return-reply envelope addressed to: ETC Institute, 725 W. Frontier Circle, Olathe, KS 66061
ATLAS APPENDIX 4
Inventory Atlas
Inventory Process and Scoring Information
This inventory has been completed in a series of steps. The planning team first prepared a preliminary list of existing components using information provided by the client as well as aerial photography and the Geographic Information System (GIS) data. All components identified were given GIS points and names.
Next steps involved field visits conducted by the consulting team to confirm the preliminary data and collect additional information.
During the field visits and evaluations, missing components are added to the data set, and each component was evaluated as to how well it met expectations for its intended function. During the site visits the following information was collected:
•Component location
•Component type
•Evaluation of component condition
•Evaluation of comfort and convenience features
•Evaluation of park design and ambience
•Site photos
•General comments
The inventory team uses the following rating system to evaluate each component, comfort and convenience feature, and overall design and ambience:
0 = Not Functioning
1 = Below Expectations
2 = Meets Expectations
3 = Exceeds Expectations
Scores are based on such things as the condition of the component, its size, or capacity relative to the need at that location, and its overall quality.
Components are evaluated from two perspectives: first, the value of the component in serving the immediate neighborhood, and second, its value to the entire community.
The setting for a component and the conditions around it affect how well it functions, so in addition to scoring the components, each park site is given a set of scores to rate its comfort, convenience, and ambient qualities. This includes such things as the availability of restrooms, drinking water, shade, scenery, etc.
Information collected during the site visits has been compiled in the following GIS.
Inventory Review Atlas Introduction
The following document contains the Inventory Review Atlas. The inventory sheets and maps represent data compiled during the initial data collection and field visits. Park boundary data provided by your GIS department. They are assumed to be accurate, but please review. Point data for individual components was collected during preliminary aerial imagery survey and confirmed during site visits. Please review the following:
Park boundary (Green area)
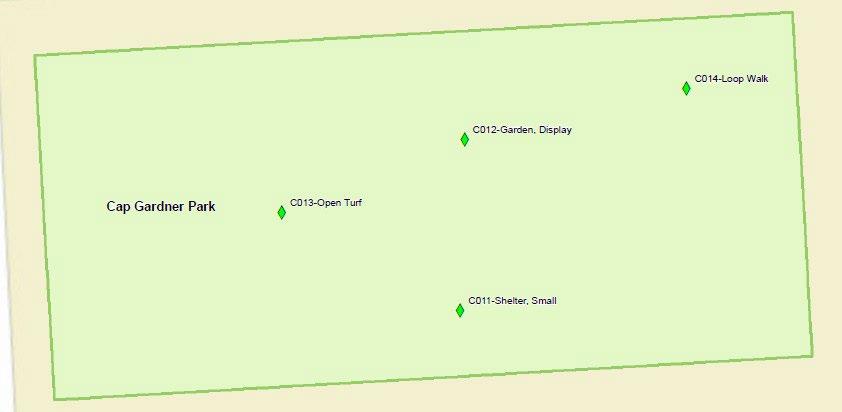
location (Green diamonds)

Component
Component type and quantity
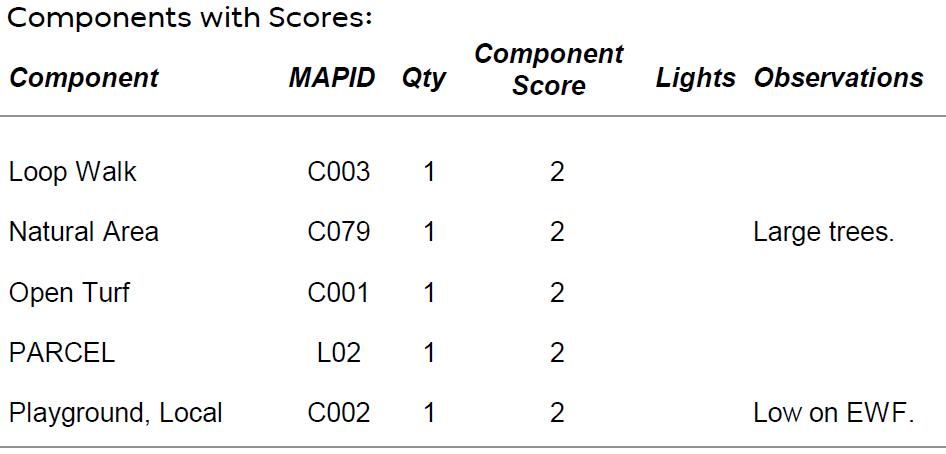
Evaluation (score) of component conditions
Components were evaluated from two perspectives: first, the value of the component in serving the immediate neighborhood, and second, its value to the greater community The score is on a scale of 0-3, with 0 meaning nonfunctioning, 1 being below expectations, 2 meets expectations, and 3 exceeds expectations. Further explanation is in the next section of the atlas, the Inventory Process and Scoring Information.
For Neighborhood consideration, each component was evaluated from the perspective of a resident that lives nearby. High scoring components are easily accessible to pedestrians in the neighborhood, are attractive for short and frequent visits, and are unobtrusive to the surrounding neighborhood. Components that do not have a high neighborhood score may not be located within walking distance of residents, have nuisance features such as sports lighting, have locked fences, or may draw large crowds for which parking is not provided.
For Community consideration, components were evaluated from the perspective of residents in the greater community. High scoring components in this category may be unique components within the parks and recreation system, have a broad draw from throughout the community, have the capacity and associated facilities for community-wide events, or are in areas that are accessible only by car. For low scoring community components, you may notice that park components limited to only HOA residents, for example, will be lower scoring because of their limited access.
Evaluation of comfort and convenience features
Besides standard components, this inventory also evaluates features that provide comfort and convenience to the users. These are things that a user might not go to the park specifically to use but are things which enhance the users’ experience by making it a nicer place to be. The presence of features such as drinking water, shade, seating, and restrooms in proximity to a component has the effect of increasing the value of the component. Modifiers encourage people to stay longer and enjoy the components more fully. These features are scored as described above with the 0-3 system. In scoring, we are not as concerned about recording the number or size of these components as we are the ability of the feature to serve the park.
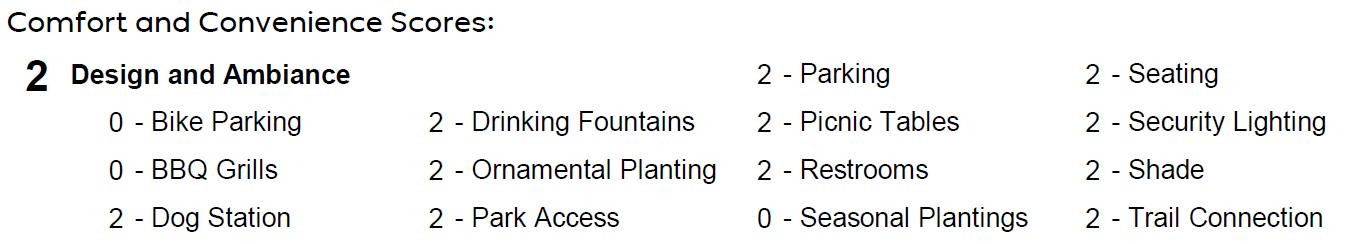
Evaluation of park design and ambiance
Using the same scoring system that is used for components and modifiers, the quality of overall Design and Ambiance is rated. The quality of the users’ experience is enhanced by a pleasant setting and good design and diminished by a lack thereof. Good design not only makes a place look nice, but it also makes it feel safe and pleasant, and encourages people to visit more often and to stay longer.
Cumulative Location Score
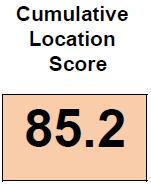
This score is the result of cumulative algorithms and is based on all the other data included on the data sheet (Design and Ambiance, Comfort and Convenience amenities, and the number and quality of Components.) This overall location score provides a point of reference for comparing different parks within a system. Page 3 of 4
General Comments
Comments about parks or components may partly describe general observations or reasonings for scores
Your Team’s Review

Please perform a review of this atlas using the comment features within the PDF and return it to us for amendments. We will incorporate your comments and edits to the dataset and any suggested changes will be addressed and corrected. We appreciate all your time and effort in reviewing this dataset and assuring its accuracy.

Outdoor Component Type
Adventure Course
Amusement Ride
Aquatics, Complex
Aquatics, Lap Pool
Aquatics, Leisure Pool
Aquatics, Spray Pad
Aquatics, Therapy Pool
Basketball Court
Basketball, Practice
Batting Cage
Bike Complex
Bike Course
Camping, Defined
Outdoor Component List
Definition
An area designated for activities such as ropes courses, zip-lines, challenge courses, etc. Specify type in comments.
Carousel, train, go-carts, bumper cars, or other ride upon features. Has an operator and controlled access.
A facility that has at least one immersion pool and other features intended for aquatic recreation.
A man-made basin designed for people to immerse themselves in water and intended for swimming laps.
A man-made basin designed for people to immerse themselves in water and intended for leisure water activities. May include zero-depth entry, slides, and spray features.
A water play feature without immersion intended for interaction with moving water.
A temperature-controlled pool intended for rehabilitation and therapy.
Describes a dedicated full-sized outdoor court with two goals.
Describes a basketball goal for half-court play or practice. Includes goals in spaces associated with other uses.
A stand-alone facility that has pitching machines and restricted entry.
A facility that accommodates various bike skills activities with multiple features or skill areas.
A designated area for non-motorized bicycle use. It can be constructed of concrete, wood, or compacted earth. May include a pump track, velodrome, skills course, etc.
Defined campsites that may include a variety of facilities such as restrooms, picnic tables, water supply, etc. Quantity based on official agency count.
For use only if the quantity of sites is available. Use "Camping, Undefined" for other instances.
Camping, Undefined
Climbing, Designated
Climbing, General
Concession
Indicates allowance for users to stay overnight in the outdoors in informal and/or undefined sites. Receives a quantity of one for each park
A designated natural or man-made facility provided and/or managed by an agency for recreation climbing not limited to children's play.
Indicates allowance for users to participate in a climbing activity. Receives a quantity of one for each park.
A facility used for the selling, rental, or other provision of goods and services to the public.
Outdoor Component Type Definition
Diamond Field
Diamond Field, Complex
Diamond Field, Practice
Disc Golf
Dog Park
Educational Experience
Equestrian Facility
Event Space
Fitness Course
Game Court
Garden, Community
Garden, Display
Describes softball and baseball fields of all kinds suitable for organized diamond sports games. Not specific to size or ageappropriateness.
Multiple ballfields at a single location suitable for tournaments.
Describes any size of grassy area used for practice. Distinguished from ballfield in that it doesn’t lend itself to organized diamond sports games. Distinguished from open turf by the presence of a backstop.
Describes a designated area that is used for disc golf. Quantities: 18 hole course = 1; 9 hole course = .5
An area explicitly designated as an off-leash area for dogs and their guardians.
Signs, structures, or historical features that provide an educational, cultural, or historical experience. Receives a quantity of one for each contiguous site. Distinguished from public art by the presence of interpretive signs or other information.
An area designated for equestrian use. Typically applied to facilities other than trails.
A designated area or facility for an outdoor class, performance, or special event, including an amphitheater, bandshell, stage, etc.
One or more features intended for personal fitness activities. Receives a quantity of one for each complete grouping.
Outdoor court designed for a game other than tennis, basketball, volleyball, as distinguished from a multi-use pad, including bocce, shuffleboard, lawn bowling, etc. The type specified in the comments. Quantity counted per court.
Describes any garden area that provides community members a place to have a personal vegetable or flower garden.
Describes any garden area that is designed and maintained to provide a focal point or destination, including a rose garden, fern garden, native plant garden, wildlife/habitat garden, arboretum, etc.
Outdoor Component Type Definition
Golf
A course designed and intended for the sport of golf. Counted per 18 holes. Quantities: 18 hole course = 1; 9 hole course = .5
Golf, Miniature A course designed and intended for use as a multi-hole golf putting game.
Golf, Practice An area designated for golf practice or lessons, including driving ranges and putting greens.
Historic Feature A site designated to commemorate an event, person or place of of local, statewide or national significance
Horseshoe Court
A designated area for the game of horseshoes, including permanent pits of regulation length. Quantity counted per court.
Horseshoes Complex Several regulation horseshoe courts in a single location suitable for tournaments.
Ice Hockey Regulation size outdoor rink explicitly built for ice hockey games and practice. General ice skating included in "Winter Sport."
Inline Hockey Regulation size outdoor rink built specifically for in-line hockey games and practice.
Loop Walk
Multi-Use Pad
Natural Area
Opportunity to complete a circuit on foot or by non-motorized travel mode. Suitable for use as an exercise circuit or leisure walking. Quantity of one for each park or other location unless more than one distinct circuit is present.
A paved area that is painted with games such as hopscotch, 4 square, tetherball, etc. Often found in schoolyards. As distinguished from "Games Court," which is typically single-use.
Describes an area in a park that contains plants and landforms that are remnants of or replicate undisturbed native areas of the local ecology. It can include grasslands, woodlands and wetlands.
Outdoor Component Type Definition
Open Turf
Other
Passive Node
Pickleball Court
Picnic Ground
Playground, Destination
Playground, Local
A grassy area that is not suitable for programmed field sports due to size, slope, location, or physical obstructions. May be used for games of catch, tag, or other informal play and uses that require an open grassy area.
An active or passive component that does not fall under any other component definition. Specified in comments.
A place that is designed to create a pause or particular focus within a park and includes seating areas, plazas, overlooks, etc. Not intended for programmed use.
A designated court designed primarily for pickleball play.
A designated area with a grouping of picnic tables suitable for organized picnic activities. Individual picnic tables are accounted for as Comfort and Convenience modifiers.
A playground that attracts families from the entire community. Typically has restrooms and parking on-site. May include special features like a climbing wall, spray feature, or adventure play.
A playground that serves the needs of the surrounding neighborhood. Includes developed playgrounds and designated nature play areas. Park generally does not have restrooms or on-site parking.
Public Art
Rectangular Field Complex
Rectangular Field, Large
Any art installation on public property. Receives a quantity of one for each contiguous site.
Several rectangular fields in a single location suitable for tournament use.
Describes a specific field large enough to host one adult rectangular field sports game such as soccer, football, lacrosse, rugby, and field hockey. The approximate field size is 180’ x 300’ (60 x 100 yards). A field may have goals and field lining specific to an individual sport that may change with a permitted use.
Outdoor Component Type Definition
Rectangular Field, Multiple
Rectangular Field, Small
Describes an area large enough to host one adult rectangular field sports game and a minimum of one other event/game, but with an undetermined number of actual fields. This category describes a large open grassy area that can be arranged in any manner of configurations for any number of rectangular field sports. Sports may include but are not limited to: soccer, football, lacrosse, rugby, and field hockey. A field may have goals and field lining specific to a particular sport that may change with a permitted use.
Shelter, Large
Shelter, Small
Skate Feature
Skate Park
Describes a specific field too small to host a regulation adult rectangular field sports game. Accommodates at least one youth field sports game. Sports may include but are not limited to: soccer, football, lacrosse, rugby, and field hockey. The field may have goals and field lining specific to a certain sport that may change with a permitted use.
A shade shelter or pavilion large enough to accommodate a group picnic or other event for a minimum of 13 seated whether or not benches or picnic tables are provided. Lack of seating may be addressed in scoring.
A shade shelter, large enough to accommodate a family picnic or other event for approximately 4-12 persons with seating for a minimum of 4. Covered benches for seating up to 4 people included as a modifier in comfort and convenience scoring and should not be included here.
A stand-alone feature primarily for wheel sports such as skateboarding, in-line skating, etc. The feature may or may not allow freestyle biking. May be associated with a playground but is not part of it. Dedicated bike facilities are categorized as "Bike Course."
An area set aside primarily for wheel sports such as skateboarding, in-line skating, etc. Attracts users from the entire community. The park may or may not allow freestyle biking. May be specific to one user group or allow for several user types. It can accommodate multiple users of varying abilities. Typically has a variety of concrete or modular features.
Outdoor Component Type Definition
Target Range A designated area for practice and/or competitive target activities. The type specified, such as archery or firearms, in comments.
Tennis Complex
Multiple regulation courts in a single location with amenities suitable for tournament use.
Tennis Court One standard regulation court suitable for recreation and/or competitive play. Quick Start or other non-standard types specified in comments.
Tennis, Practice Wall A wall intended for practicing tennis.
Track, Athletic A multi-lane, regulation-sized running track appropriate for track and field events.
Trail Access Point
Trail, Multi-Use
Trail, Primitive
Trail, Water
Trailhead
Volleyball Court
A point of connection to a trail or trail system, without ammentities generally associated with a trailhead.
A trail, paved or unpaved, is separated from the road and provides recreational opportunities or connection to walkers, bikers, rollerbladers, and equestrian users. Paths that make a circuit within a single site are "Loop Walks."
A trail, unpaved, located within a park or natural area that provides recreational opportunities or connections to users. Minimal surface improvements that may or may not meet accessibility standards.
A river, stream, canal, or other waterway used as a trail for floating, paddling, or other watercraft.
A designated staging area at a trail access point. May include restrooms, an information kiosk, parking, drinking water, trash receptacles, seating, etc.
One full-sized court. May be hard or soft surface, including grass and sand. May have permanent or portable posts and nets.
Outdoor Component Type Definition
Wall Ball Court
Water Access, Developed
Water Access, General
Water Feature
Water, Open
Winter Sport
Walled courts associated with sports such as handball and racquetball. The type specified in the comments.
A developed water access point. Includes docks, piers, kayak courses, boat ramps, fishing facilities, etc. Specified in comments including quantity for each unique type.
Measures a user's general ability to access the edge of open water. May include undeveloped shoreline. Typically receives a quantity of one for each contiguous site.
A passive water-based amenity that provides a visual focal point. Includes fountains and waterfalls.
A body of water such as a pond, stream, river, wetland with open water, lake, or reservoir.
An area designated for a winter sport or activity such as a downhill ski area, nordic ski area, sledding hill, toboggan run, recreational ice, etc. The type specified in the comments.
THIS PAGE INTENTIONALLY LEFT BLANK


Source: Esri, Maxar, Earthstar Geographics, and the GIS User Community
Cedar River Trail (King County Regional Trail)
Address: Cedar River Trl, Maple Valley, Washington, 98038
Owner:
Approximate
Inventory
Park Overview: 0.5 miles of trail owned and managed by King County along the Cedar River. Great trail access, though the area within depicted boundary is otherwise limited.
Elk Run Natural Area
X Components
G Indoor Facilities Trails Rivers Parks City Boundary
- Trail Access Point
- Other
Elk Run Natural Area
- Natural Area
Source: Esri, Maxar, Earthstar Geographics, and the GIS User Community
Address: 27625 228th Ave SE, Maple Valley, WA 98038
Owner: City of Maple Valley
Approximate Acres: 52.2
Class: Greenways and Natural Areas
Inventory Date: 2/18/2025
Overview: Natural areas and walking paths in retired golf course property. Site is 52.2 acres total, including 2 acres of the special facility Elk Run Farm.
Fernwood Park
X Components
G Indoor Facilities Trails Rivers Parks City Boundary
Fernwood Park
C034 - Natural Area
C082 - Trail Access Point
Source: Esri, Maxar, Earthstar Geographics, and the GIS User Community
Address: 23023 SE 267th Pl, Maple Park
Valley, WA 98038
Owner: City of Maple Valley
Approximate Acres: 6.15


C054
Lake Wilderness Lodge
Lake Wilderness Golf Course
Greater Maple Valley Community Center
Green to Cedar Rivers Trail (King County Regional Trail)
Address: Green to Cedar Riv er Trl, Maple Valley, WA, 98038
Owner: King County Parks and Recreation
Approximate Miles: 4.18
Class: Greenways and Natural Areas
Inventory Date: 4/22/2025
Park Overview:
Regional trail owned and managed by King County, with 4.18 miles within City Limits. Links Maple Valley with the Cedar River Trail and metro areas to the northwest, following an abandoned railroad.
Connection to 230th Pl SE snaking around the stormwater pond is a public easement per plat notes.
contained on King County property and public ROW.
Gated connection through city owned stormwater pond connects to private access tract road. C061
Connection to the neighborhood to the north is within a City owned stormwater tract.
Connection on public ROW. Required to be improved when property to the southeast develops.
Green to Cedar Rivers Trail (King County Regional Trail)
Trail Access Point 1 2
C066
C067 Trail Access Point 1 2
C068 Trail Access Point 1 2
C070
C072
C073
C074 Trail Access Point 1 2
C075 Trail Access Point 1 2
C076
Connection at 276th. The 276th crossing will be improved as part of King Countys planned improvements.
Public connection where the trail crosses SR516.
Connection to South Fork pedestrian access tract. King County will be improving this connection on their property during trail improvement work.
Connection on SE 280th St. Crossing improvements will be made as part of King County Trail improvements.
Recorded access easement allows public access on the northern side of St. George parcel.
Connection through Summit Estates open space tract which has been dedicated to King County.
Trail connection exists, appears to be built by office property owner with no public easement.
Connection to ROW on both sides of the street.
Overlook at Summit Park tract connection. Private tract for public pedestrian access.
THIS PAGE INTENTIONALLY LEFT BLANK
X Componen ts G Indoor Facilitie s Trails Rivers Pa rks Cit y Boun dary
Henrys Switch Open Space ¯
Henr ys Sw itc h Open Spa ce King County Re gional Tra il G ree n To Ce dar
C083 - N atu ra l Area
C238 - Tra il Access Point
Source: Esri, Maxar, E arthstar Geographics, and the GIS User Community
Address: 240th Ave SE, Maple
Valley, WA 98038
Owner: City of Maple Valley
Approximate Acres: 15.54
Lake Wilderness Lodge
Source: Esri, Maxar, Earthstar Geographics, and the GIS User
Address: 25400 Witte Rd SE, Maple Valley, WA 98038
Owner: City of Maple Valley
Inventory
Lake Wilderness Park ¯
X Components G Indoor Facilities
Trails Rivers
Parks City Boundary
C016-Skate Park
C080-Trail Access Point
C036-Historic Feature
C081-Natural Area
C013-Disc Golf
C050-Trail Access Point
C024-Educational Experience
C038-Garden, Display
Greater M aple Valley Community Center and The Den Lak e Wilderness Lodge
C057-Trail Access Point
C025-Educational Experience
C037-Shelter, Small
C039-Water Feature
C040-Passive Node
C071-Trailhead
C042-Public Art
C026-Natural Area
C043-Concessions
C044-Picnic Ground
C020-Diamond Field
C049-Pickleball, Overlay
X X X X X X X X X X X X X X X X X X X XW W X X X X X X X X X X X X G G
C041-Water Access, General
C017-Shelter, Large
C045-Educational Experience
C019-Water Access, Developed
C018-Water Access, General
C046-Shelter, Small
C048-Loop Walk
C021-Playground, Destination
C022-Tennis Court
C027-Open Turf
C047-Game Court
C023-Water Access, Developed
Source: Esri, Maxar, Earthstar Geographics, and the GIS User
Address: 22500 SE 248th St, Maple Valley, WA 98038
Owner: City of Maple Valley
Approximate Acres: 111.21
Class: Community
Inventory Date: 2/18/2025
Park Overview:
Regional park with arboretum, trails, lake access, and other recreational amenities. Storied history, and central to many annual events. Site of Gaffney's Grove Disc Golf Course and Maple Valley Community Center. Cumulative Location
City of Maple Valley, WA
THIS PAGE INTENTIONALLY LEFT BLANK

Legacy Site
Green to Cedar Rivers Trail King Coun ty
C241 - Trailhead
C240 - Shelter, Large
C064 - Trail Access Point
C054 - Trail Access Point
Source: Esri, Maxar, Earthstar Geographics, and the GIS User
Address: 25719 Maple Valley Black Diamond Rd. SE, 98038
Owner: City of Maple Valley
Approximate Acres: 50.37
Class: Greenways and Natural Areas
Inventory Date: 2/18/2025
Parcel of mostly developed land located across from Rock Creek Elementary, featuring a large pavillion, many primitive trails, and Green to Cedar Rivers Trail frontage. Site is planned for future development.
Summit Park & Ball Fields
X Components
G Indoor Facilities Trails Rivers Parks City Boundary
- Trail Access Point
C005 - Rectangular Field, Large
C006 - Diamond Field, Overlay
- Shelter, Small
C032 - Trail Access Point
C008 - Playground, Destination
-
- Basketball Court
Summit Park & Ball Fields
King County Regional Trail Green To Cedar
C009 - Dog Park
C031 - Loop Walk
C010 - Disc Golf
C029 - Public Art
C011 - Skate Park
C004 - Diamond Field
C030
C007
C075
C012
Pickleball, Overlay
Source: Esri, Maxar, Earthstar Geographics, and the GIS User Community
Address: 23675 SE Tahoma Way, Maple Valley, WA 98038
Owner: City of Maple Valley
Approximate Acres: 15.81 Class: Community Inventory
complex with diamond and rectangular fields, a skate park, a basketball court, a playground, and a dog park.
C079 - Natural Area C002
Source: Esri, Maxar, Earthstar Geographics, and the GIS User Community
Address: 21849
Wax Rd, Maple Valley, WA 98038
THIS PAGE INTENTIONALLY LEFT BLANK
Indoor Component Type
Indoor Component List
Definition
Arts and Crafts A room with non-carpeted floor, built-in storage for materials, and a sink. Often adjacent to a kiln room.
Auditorium/Theater A large room designed specifically as a performance/lecture space that includes a built-in stage, seating, and can accommodate stage lighting and sound amplification.
Childcare/Preschool A room or space with built in secure entry and cabinets, a small toilet, designated outdoor play area, etc. Intended for short-term child watch or half or full day preschool use.
Fitness/Dance A room with resilient flooring and mirrors.
Food - Counter Service Staffed food service with commercial kitchen and no waiter services.
Food - Full Service Staffed food service with commercial kitchen and dining room with waiter services.
Food - Vending Non-staffed area with vending machines and/or self-service food options.
Gallery/Exhibits A space intended for display of art, interpretive information, or other type of exhibit. Typically has adequate lighting, open wall space, and room for circulation.
Sport Court
Active recreation space that can accommodate basketball, volleyball, or other indoor court sports with one or more courts designated in quantity.
Track, Indoor Course with painted lanes, banked corners, resilient surface, and marked distances suitable for exercise walking, jogging, or running.
Kitchen - Kitchenette Area for preparing, warming, or serving food.
Kitchen - Commercial Kitchen that meets local codes for commercial preparation food services.
Lobby/Entryway
Multi-purpose Room
Patio/outdoor seating
Retail/Pro-shop
Sauna/steam
An area at the entry of a building intended for sitting and waiting or relaxing.
A space that can host a variety of activities including events, classes, meetings, banquets, medical or therapeutic uses, etc. Also includes rooms or areas designated or intended to be used as games rooms, libraries, or lounges. Rooms may be dividable.
An outdoor space or seating area designed to be used exclusively in conjunction with an indoor space and primarily accessed through an indoor space.
An area for retail sales of sporting equipment, gifts, etc. Typically has direct access from outdoors and can be secured separately from the rest of a building or facility.
A facility with built-in seating and a heat source intended for heat therapy. May be steam or dry heat.
Note: Any component from the outdoor component list may be included as an indoor component
Greater Maple Valley Community Center
Privately run facility on City property. Serving as a nonprofit-managed community hub, offering a variety of programs and services aimed at fostering community.
The new Community Clubhouse at Lake Wilderness Golf Course (construction Aug 2025Sept 2026) will include a new two-story building, a pro shop, a restaurant/bar, two golf simulators, cart storage, a patio, and a banquet hall.
City of Maple Valley, WA
Address:
Owner:
Owner:
Address: Class: 22024 SE 248th St, Maple Valley, WA 98038
of Maple Valley
Inventory Date:
Modifiers with Scores
2 Design and Ambiance
Components with Score
Facility Overview: An annex to the Greater Maple Valley Community Center, one multipurpose room used for teen programming.
Cumulative Indoor Scoring:
City of Maple Valley, WA
LOS ANALYSIS APPENDIX 5
APPENDIX 5
The Maple Valley Parks and Open Space System
The City of Maple Valley's (City’s) Parks and Recreation Department (Department) manages a wide-ranging parks and open space system that provides diverse recreational opportunities across an active landscape. This park inventory and level of service (LOS) analysis assesses how Maple Valley parks and facilities currently meet the needs of the community. This analysis provides a baseline for assessing current service levels and informing future investments. Combined with community feedback, and pinpoints service gaps and identify opportunities for improvement.
Figure 1 provides a system inventory map that shows the relative size and distribution of existing parks and recreation facilities in the City. The inventory and planning area is focused on City park properties and King County trailways and is bound by City limits. The City provided data for alternative provider parks, which were not part of the park inventory process but are included in inventory maps for walkability analysis. A full inventory of City parks is available in the PROS Plan Appendix 4
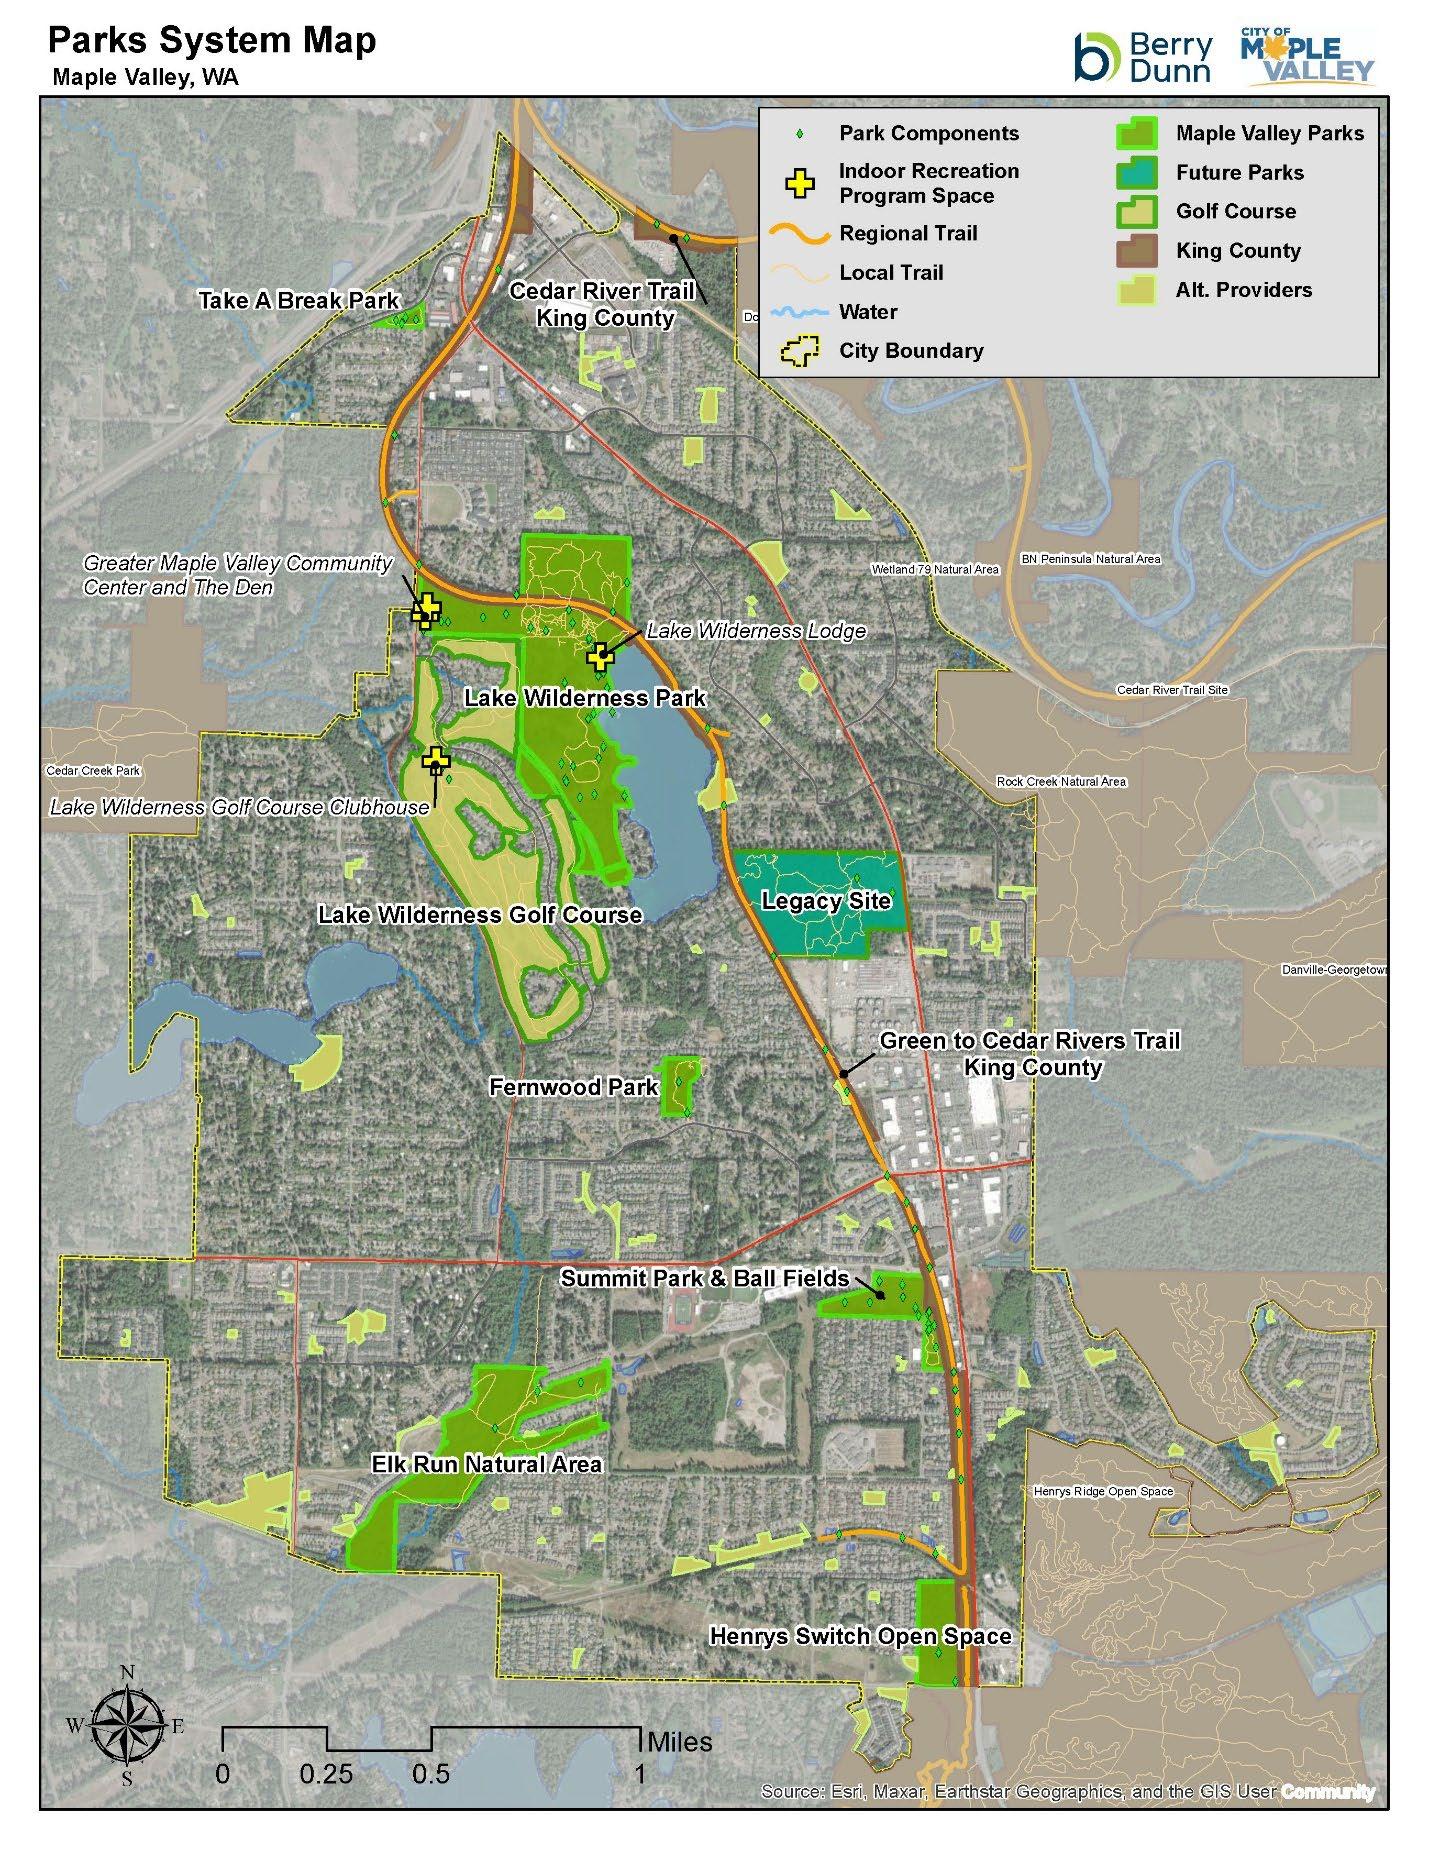
Figure 1: Park System Map
Park Classification System
As a means of organizing parks and recreation facilities, parks are classified within a hierarchy that creates a system of interrelated facilities; the City’s locations are placed into specific categories or classifications that help define the locations based on size and amenities. The classifications currently used by the City include Neighborhood Parks, Community Parks, Greenways and Natural Areas, And Special Use Parks.
Neighborhood Park (1 – 10 Acres)
Neighborhood parks are designed for nearby residents, providing space for recreation, play, and social activities. These parks are located within a half mile of homes, serve as community gathering places, and accommodate a range of ages and activities.
Key features of neighborhood parks include the following:
• Playgrounds, multipurpose grass fields, and courts
• Walking paths, shaded picnic areas, and seating
• Typically, a mix of irrigated natural grass turf and natural landscaping
• General accessibility by foot, bike, or neighborhood streets
• On-street parking (common); parking lots (less typical)
This study reviewed City-owned and operated neighborhood parks and not private homeowner association (HOA) parks.
Community Park (More Than 10 Acres)
Typically larger in size, community parks provide a mix of programmed sports facilities and open spaces for a broad range of community activities. These parks often serve as regional destinations, incorporating features that support both active and passive recreation.
Key features of these parks include the following:
• Sports fields, courts, and event spaces
• Walking trails, gardens, and natural features
• Amphitheaters, festival areas, or historical elements
• Located along major roads for easy access
• Designed to accommodate a variety of recreational needs
Greenways and Natural Areas (Vary in Size)
Greenways and natural areas are parks primarily dedicated to preserving natural environments while providing passive recreation opportunities. These areas feature trails, water access, and environmental education opportunities with minimal infrastructure to preserve natural character.
Key features of greenways and natural areas include the following:
• Trail systems and water access points
• Natural habitat preservation
• Limited developed amenities
• Environmental and educational programming
• Flood control and stormwater management
Special Purpose Parks (Vary in Size)
Parks designed to support a specific community purpose, such as cultural, environmental, or recreational needs, are categorized as special purpose parks. These spaces may feature golf courses, aquatic centers, civic plazas, campgrounds, or other specialized amenities tailored to their intended use.
Table 1 summarizes the number of established parks in each classification and their approximate acreage within the Maple Valley system.
Some facilities that meet neighborhood needs and have specialized amenities could be placed into more than one classification but are placed in the classification that meets the broadest definition.
Lake Wilderness Park stands as Maple Valley's crown jewel, encompassing 111.21 acres of diverse recreational amenities and natural beauty.
This flagship community park serves as a regional destination, featuring Lake Wilderness itself with developed water access including a floating dock and boat launch making it a premier location for water recreation. The park hosts the renowned 18-hole Gaffney's Grove Disc Golf Course, multiple educational experiences including a children's story path and nursery garden interpretation and serves as the home of the Greater Maple Valley Community Center.
The park's trail system connects to the Green to Cedar Rivers Trail, providing seamless access to the broader regional trail network. With its combination of active recreation facilities, natural areas, historic features (including a veteran’s memorial), and cultural amenities, Lake Wilderness Park exemplifies how Maple Valley integrates community gathering spaces with environmental stewardship and diverse recreational programming for residents of all ages.
Inventory and Assessment
The Department maintains a variety of amenities across its park system. Each City-maintained amenity was assessed based on condition, size, site capacity, and overall quality through thorough field evaluations conducted in February 2025.
BerryDunn conducted an on-site inventory and created an overview of each Maple Valley facility, including site-specific scorecards and inventory maps. Field evaluations informed the creation of an inventory atlas to record each park’s map and sitespecific amenity scorecards. The atlas was presented to Department staff for approval before proceeding with further analysis.
Park Inventory
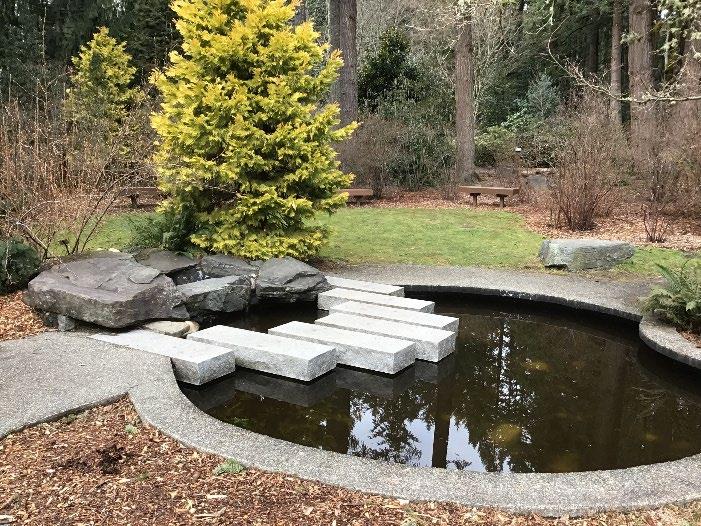
Eight parks comprise the City’s park and open space system:
• Elk Run Natural Area
• Fernwood Natural Area
• Henry's Switch Open Space
• Lake Wilderness Park
• Lake Wilderness Golf Course
• Legacy Site
• Summit Park
• Take-A-Break Park
Facility Inventory
Table 2 inventories the 26 structures that are on City land and/or maintained by the City. It also includes corresponding key elements of each structure.
220 City of Maple Valley, WA
*Leased to PD – Ascend Building, Kent/Kangley and 242nd Avenue SE
While more than half (15) of the structures accommodate public access, only two facilities Lake Wilderness Lodge and Maple Valley Community Center support public indoor recreation facilitation. The structures related to parks and recreation services are depicted in Figure 2.
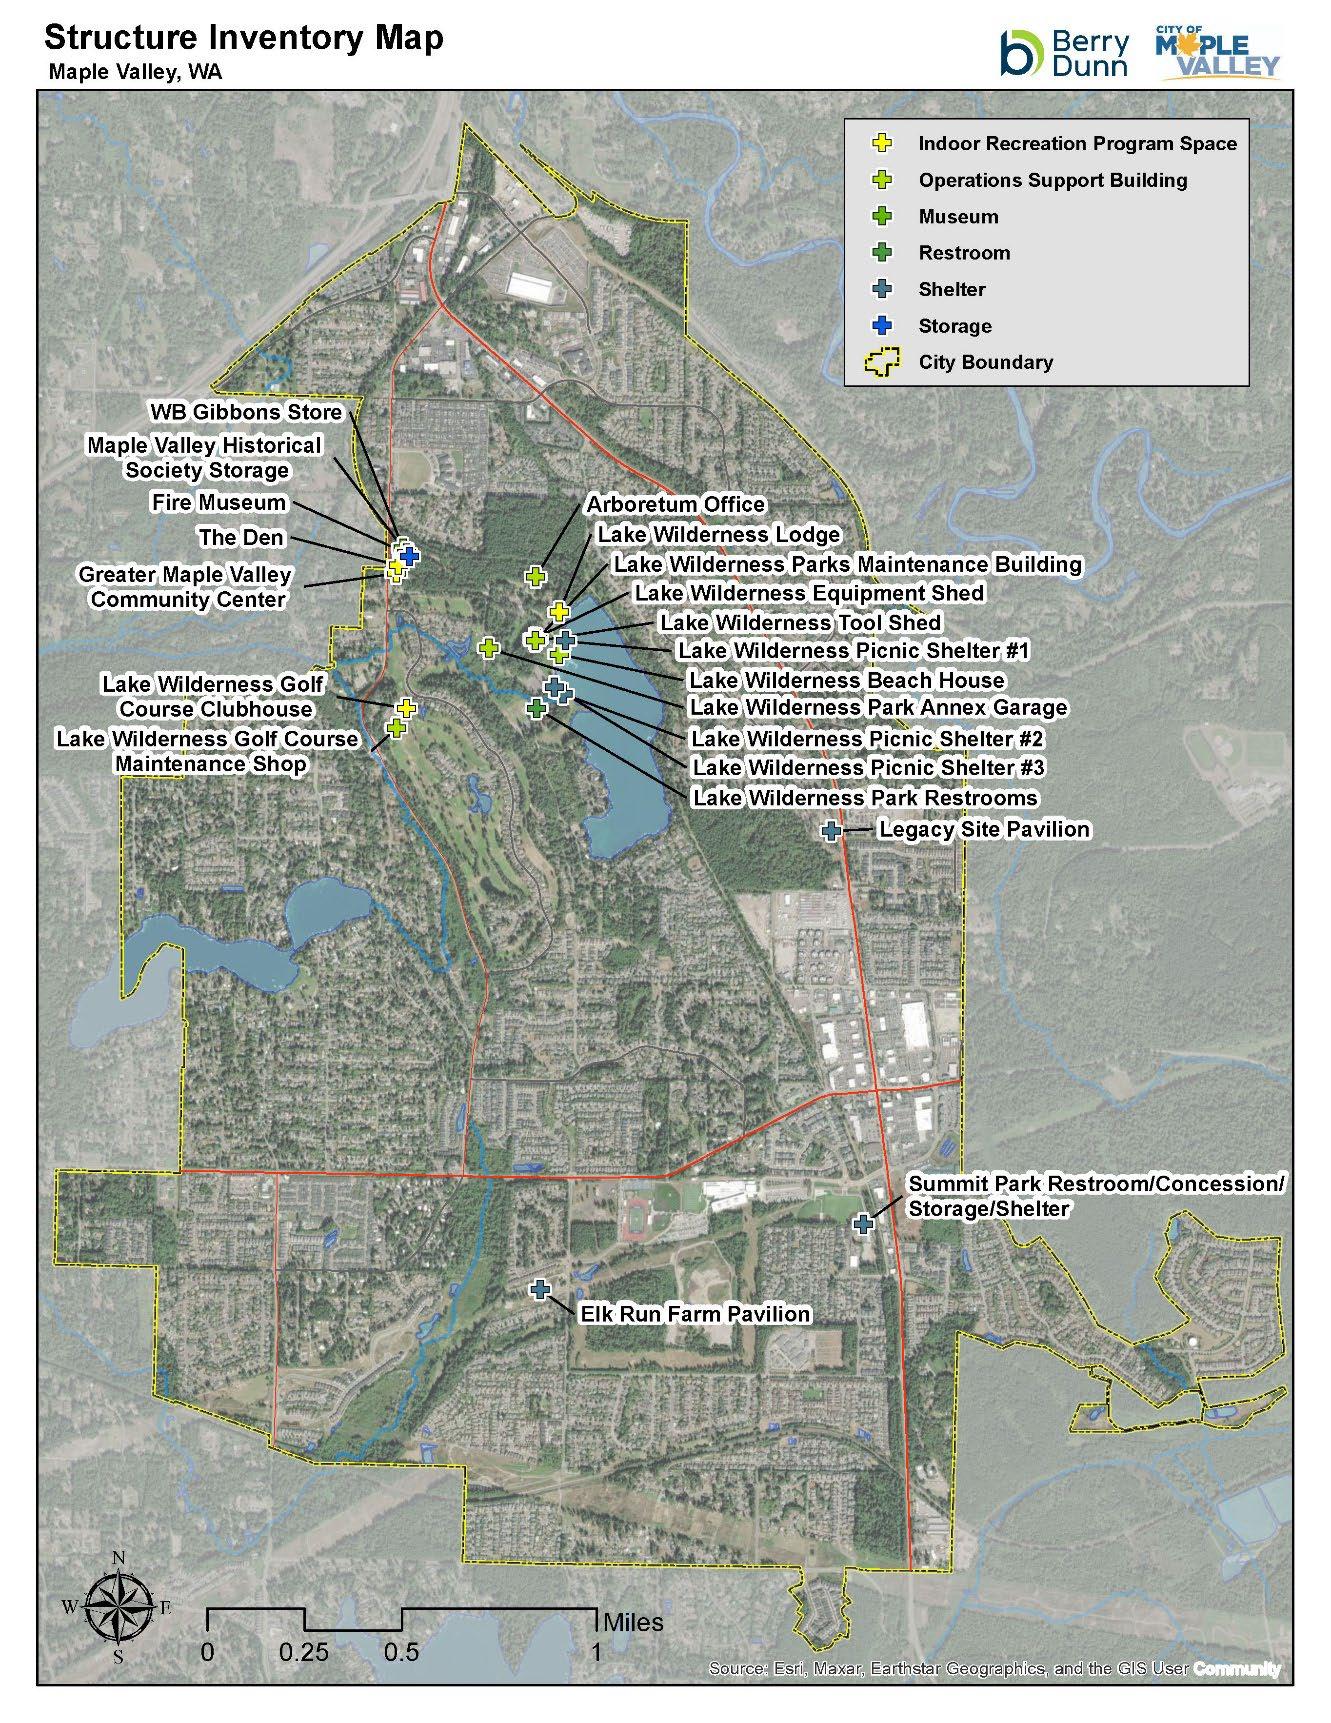
Figure 2: Park and Recreation Services Structures
Figure 3 provides a detailed depiction of the structures in the Lake Wilderness Park vicinity.
Figure 3: Park and Recreation Services Structures: Lake Wilderness Area
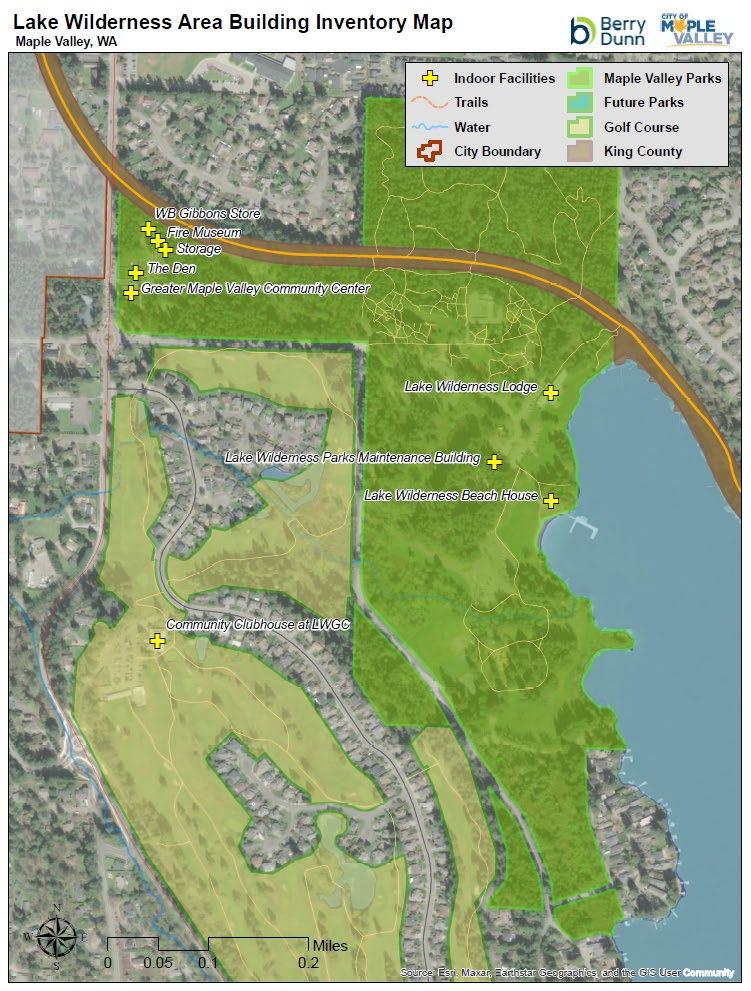
Park Amenity Scoring
An amenity is any features such as a playground, picnic shelter, athletic field, court, trail node, or gathering space designed to help people exercise, socialize, and support their physical, mental, and social well-being. The Department maintains 83 outdoor recreation amenities throughout its park system.
The inventory team used the following four-tier rating system to evaluate park amenities:
• 0 = Nonfunctioning
• 1 = Below Expectations
• 2 = Meets Expectations
• 3 = Exceeds Expectations
Most amenities in the City’s park system meet or exceed expectations, with nearly 98% rated a 2 or 3, reflecting high quality and a strong commitment to ongoing maintenance. For the amenities rated below expectations, strategic upgrades especially targeted at older fields and trail access points can quickly close gaps and sustain excellence citywide. Amenities not currently meeting expectations are listed in Table 4.
Identifying these low-performing amenities enables the Department to target a small number of individual site upgrades while sustaining high standards citywide. Regular investment in maintenance and selective upgrades, especially aging athletic facilities and trail infrastructure, will help maintain the impressive system-wide scoring results and enhance residents' overall recreation experience.
Table 3: Maple Valley Amenity Scores Versus National Data Set
Scores
Table 4: Maple Valley Amenities Not Meeting Expectations (Score of 1)
Henry’s Switch Open Space Trail Access Point
Primitive access points on trail running north to south.
Parks Ratings
To better understand park conditions and guide future investment, each City park was evaluated based on key amenity performance and core criteria that shape the user experience. Ratings considered the availability of supporting features such as restrooms, drinking fountains, seating, parking, and shade, which enhance comfort and accessibility. A standardized scale (good, fair, or poor) provided consistency and clarity across the system.
Good: General design and ambiance lends itself to a positive experience. Key park components and amenities such as picnic shelters, restrooms, playgrounds, splash pads, and sport courts are present, well maintained, and functional. The park and its amenities are clean, safe, and free from visible damage.
Fair: Components and amenities are present, but some may show signs of wear or need minor repairs. Components may be few, or comfort and convenience amenities may lack modern features or experience occasional maintenance issues.
Poor: Basic amenities are missing, nonfunctional, or in disrepair. Conditions may include outdated structures, safety concerns, and/or insufficient amenities.
The Legacy Site
A mostly undeveloped 50.37-acre Legacy Site represents tremendous potential for transforming Maple Valley's programs and public gathering capabilities once developed. It currently provides a large pavilion for the farmers market and many dirt walking trails. Acquired in 2001, this centrally located property at Black Diamond Road/SR 169 and Southeast 260th Street offers exceptional connectivity through direct roadway access and proximity to the Green to Cedar Rivers Trail, providing both vehicle and pedestrian access to the broader regional network.
The future development and pedestrian infrastructure installation outlined in the Legacy Site Master Plan will provide recreation space and allow residents to reach the property on foot or by bicycle, transforming it into a community hub accessible by multiple transportation modes. As a park, the site is envisioned to host farmers markets, seasonal festivals, concerts, and large-scale celebrations. The property's combination of acreage, lakefront overlook, and connectivity makes it ideally suited to become one of Maple Valley's premier venues for civic engagement and cultural programming.
Table 5: Park Scores
The condition ratings for Maple Valley parks reflect a combination of factors, such as component and amenity quantity, park size, maintenance frequency, accessibility, safety, and how well each park serves neighborhood needs. Parks like Take-A-Break, Summit Park and Ball Fields, and Lake Wilderness Park are scored as “good” because they offer numerous amenities and are regularly maintained, making them attractive and functional for a range of recreational activities.
In contrast, Fernwood Park and Henry’s Switch Open Space have been rated “poor” because they feature few amenities (just two each), contain comparatively large acreage that remains underutilized, and exhibit visible signs of limited maintenance. These ratings result from access challenges like deteriorating pathways, dense or overgrown landscaping, minimal seating, a lack of accessible trails, and little to no signage. When much of the site feels unused or neglected, the overall visitor experience suffers, and community perceptions decline.
To address these issues, the City could leverage recent feedback from planning efforts and engagement to determine which new features or services would make the most impact for residents. In the case of the two poorly rated parks in Maple Valley, taking steps like clearing brush, upgrading trails, providing more seats, improving signage, updating landscaping, and possibly introducing a distinguishing feature (such as a play area or picnic shelter) would enhance both visitor enjoyment and perceived value. Even modest investments targeting identified priorities could greatly improve user experience and community satisfaction at Fernwood and Henry’s Switch.
Developing Beyond “Meets Expectations”
City staff have expressed a strong commitment to advancing beyond basic standards, aiming to create parks that not only meet expectations but consistently surpass them. Elevating a park or individual amenity from “meets” to “exceeds” involves providing experiences, services, and infrastructure that are distinctive, memorable, and thoughtfully aligned with the evolving needs of the community. The following subsections present targeted improvements that, if implemented, could transform each property into a model for excellence, offering exceptional value and enjoyment for all visitors. Developing and executing individual park master plans can also help raise the bar.
Elk Run Natural Area
Currently rated: Natural Area (2), Trail Access Points (2)
• Enhance trail connectivity and infrastructure by creating smooth, durable, multi-use trail surfaces capable of accommodating multiple users, with formal connections to nearby neighborhoods and northbound access to Highway 516 and eastbound to Tahoma High School and Summit Park.
• Implement thorough wayfinding with maps, directional signage at key junctions, and distance markers to establish distinct trail loops and sense of place
• Develop passive activity nodes with seating, art installations, and natural gathering spaces that encourage visitors to linger.
• Install comfort amenities including restrooms, shade structures, drinking water stations, and low-profile security lighting to support extended use.
• Strengthen educational and aesthetic value through interpretive signage that identifies local flora, fauna, and site history.
• Establish native pollinator gardens and display gardens near Elk Run Farm, add perennial color displays at entry points, and incorporate educational orchard and garden beds that directly support the farm's mission of serving local food banks.
• Consider installing a fitness course along trail corridors to create an integrated wellness destination.
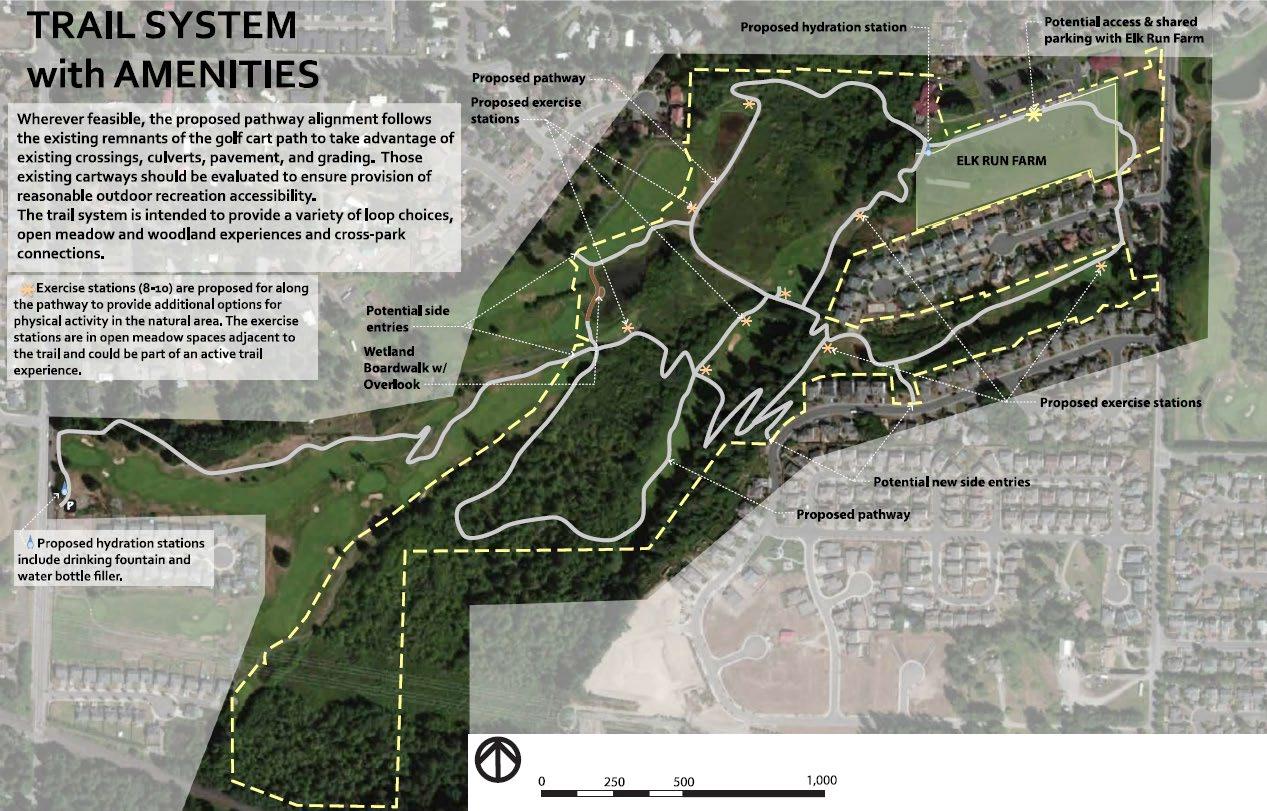
Figure 4: Elk Run Natural Area Concept Plan
Fernwood Natural Area
Currently rated: Natural Area (2), Trail Access Points (2)
• Transform the three primitive access points (south, northeast, northwest corners) into defined trailheads with durable surfacing and low-profile lighting that extends usability while preserving the natural character.
• Formalize the internal trail system by developing an accessible loop with natural surface paths, periodic resting places, viewpoint seating, and connecting educational elements that interpret the area's ecological significance.
Henry's Switch Open Space
Currently rated: Natural Area (2), Trail Access Points (1)
Figure 5: Henry’s Switch Open Space Concept Plan, 50%
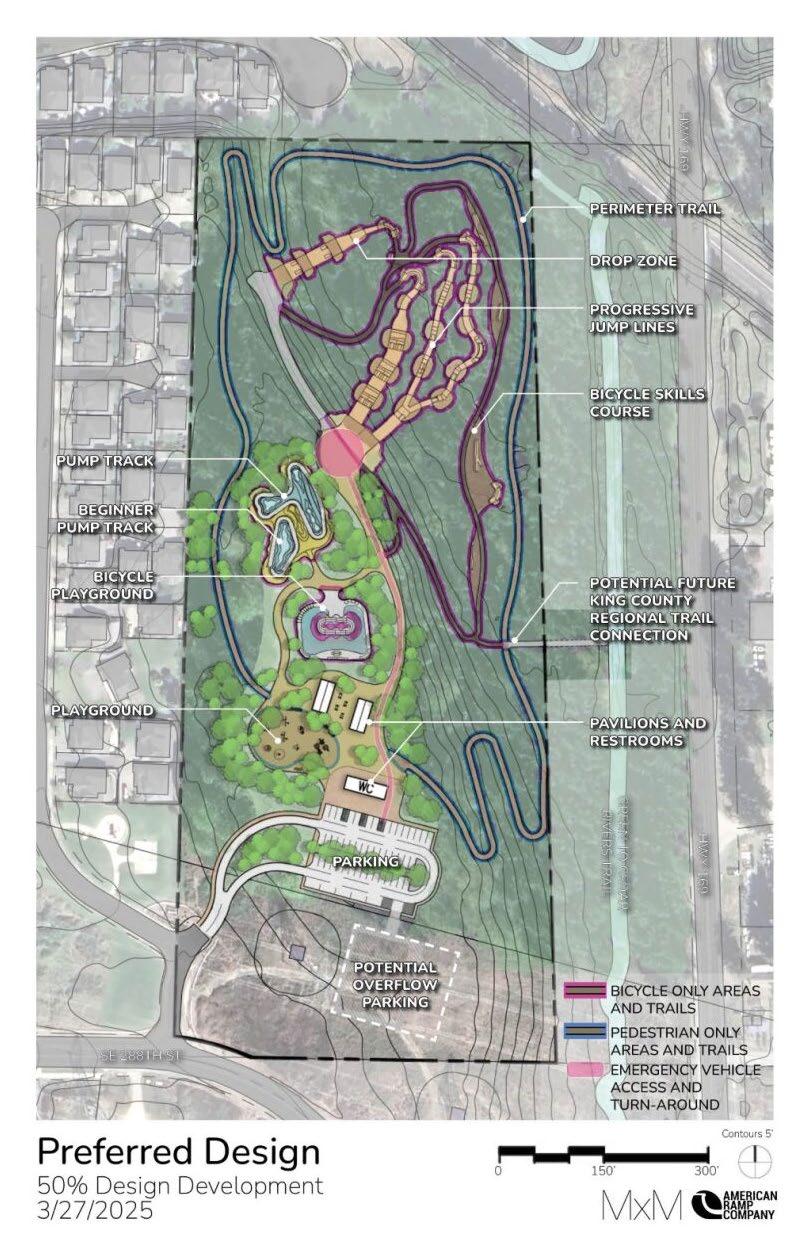
• Connect into the Cedar to Green Rivers Trail Develop site as a trailhead equipped with restrooms, shade structures, drinking water, and parking
• Install comprehensive wayfinding through interpretive kiosks with trail maps, clear directional signage, and educational content that invites exploration.
• Incorporate comfort amenities, including seating areas, dog waste stations, bike parking, bike repair stations, and trash receptacles to support diverse visitors.
• Consider supplemental activating amenities such as a bike course, pump track, or dog park to establish Henry's Switch Open Space as a recreational biking destination rather than retain as an undeveloped site.
Lake Wilderness Park
Currently rated: Multiple Components (2), Diamond Field (1)
228 City of Maple Valley, WA
• Build comfortable and easy-to-use pathways and loop walks, giving users easy access to viewpoints, resting places, and areas of recreation. Install signage and wayfinding, low-profile lighting, and interpretive signage.
• Enhance the skate park from “meets” to “exceeds expectations” by expanding older concrete in-ground features with modern street-style obstacles and improved transitions. Create a complete facility environment through shade structures for spectators, integrated seating areas, water fountains, restrooms, and security lighting that activate the space as a premier youth destination.
• Restore Diamond Field from “below expectations” to “exceptional” status through field renewal. Address deferred maintenance with proper grading and drainage improvements, installing quality infield and outfield surfacing material, upgrading backstop and outfield netting, and adding LED field lighting for extended play hours. Enhance the spectator and player experience by adding bleachers, installing a scoreboard, and providing covered dugouts, a judge’s box, accessible pathways, and shade structures.
Lake Wilderness Golf Course
Currently rated: Golf Course (2), Practice Facility (2)
• Elevate the golfer and visitor experience by adding shaded outdoor seating areas around the new clubhouse (arriving 2026), that includes viewing decks overlooking signature holes and creating comfortable gathering spaces that encourage non-golfers to enjoy the property.
• Upgrade seasonal plantings through rotating color displays at the clubhouse entrance, practice green surrounds, and key course viewpoints that deliver memorable aesthetic experiences throughout the year.
Legacy Site
Currently rated: Large Shelter/Pavilion (3), Trailhead (2)
• Upgrade the trailhead into a signature destination by adding wayfinding kiosks, detailed trail maps showing connections to the Green-to-Cedar Rivers Trail network, a bike repair station, covered seating areas, and interpretive elements that share the site’s history and future vision.
• Build a pedestrian and bicycle bridge across SR 169, allowing safe access to the site from the east and alleviating a significant pedestrian barrier.
• Develop a destination playground, natural play area and spray pad to attract families and provide an engaging environment for play and learning.
• Create a walkable downtown atmosphere by combining uses that drive foot traffic, such as City Hall, a destination brewpub, and the seasonal farmers market, to build a sense of place and stimulate consumer demand.
• Consider joint ventures that establish a large indoor public market serving as both a community gathering space and an incubator for small retail and restaurant businesses.
• Design flexible event spaces and a venue capable of hosting community events, concerts, and seasonal festivals to activate the site year-round.
Summit Park and Ball Fields
Currently rated: Rectangular Fields (3), Multiple Components (2)
• Capitalize on Summit Park's strategic location by developing a formalized trail connection to Elk Run Natural Area, creating a linked destination for walkers and cyclists. Upgrade the Cedar to Green Rivers Trail access into a full trailhead with staging area, signage, seating, and bike repair facilities, positioning Summit Park as a biking and walking hub that anchors Maple Valley's trail network.
• Enhance disc golf into a tournament-quality experience by upgrading the course with improved tee pads, upgraded signage with detailed hole maps and distances, defined fairways, spectator seating areas, and practice baskets.
• Expand the diverse and adaptive Linda Olson Playground with additional inclusive equipment, installing enhanced shade structures over play zones, and incorporating nature play elements that engage children with the natural environment. Repair musical elements currently out of service
Take-A-Break Park
Currently rated: Playground (3, newly installed in 2025), Loop Walk (2)
• Enhance shade from “below” to “exceeds expectations” by installing distinctive, highquality shade structures over seating areas and portions of the loop walk, planting fastgrowing shade trees at strategic locations, and adding shade sails over gathering spaces to significantly improve summer usability and comfort.
• Improve trail connectivity by developing formal connections from the loop walk to adjacent neighborhood pathways, installing clear wayfinding signage, and creating safe pedestrian linkages that integrate Take-A-Break Park into the broader community walking network and active transportation system.
• Expand play area to include an accessible swing.
Investment and Stewardship
Maintaining and elevating this high LOS will require continued strategic investments in staff, operating budget and equipment, and capital resources. These investments help ensure that upgrades are installed and sustained over time, aligning improvements with resident input and community priorities. By implementing these targeted enhancements across Maple Valley's eight parks, the City will transform its park system into a network of distinctive, exceptional community assets that deliver outstanding value and varied experiences for residents of all ages and abilities.
Level of Service (LOS)
To evaluate Maple Valley’s LOS, BerryDunn analyzed the availability, quantity, and accessibility of City-maintained parks and amenities. This assessment integrates the system inventory with geographic information system (GIS) mapping to illustrate park distribution throughout the City.
Benchmark Analysis
National Recreation and Park Association (NRPA) benchmarks provide a useful framework for assessing parkland availability relative to population size. Maple Valley's park system encompasses 359.6 acres, including the Lake Wilderness Golf Course and excluding parks managed by alternative providers like King County or HOAs. With a population of 28,877 residents in 2025, this yields 12.45 acres of parkland per 1,000 residents.
This LOS sits above the 2025 NRPA median benchmark of 10.9 acres per 1,000 residents for communities of similar size (20,000 to 49,999 people) This metric represents only municipal parkland and does not capture the full recreational value provided through alternative providers, Maple Valley's strategic partnerships, and regional trails connectivity.
Maple Valley's geographic position creates exceptional recreational access that extends beyond its municipal boundaries. Residents have access to miles of trails within City limits and are connected to hundreds of miles of regional trails, including the Green to Cedar Rivers Trail and the Cedar River Trail (managed by King County Parks and Recreation), as well as park properties provided by alternative providers such as HOAs and neighboring communities. These opportunities effectively expand the recreational service area and provide residents with trailbased activities and semi-private parks not reflected in standard acreage calculations
The 50.37-acre Legacy Site represents significant future capacity, demonstrating long-term strategic planning for recreational and community development. When combined with ongoing plans for the development of Henry’s Switch Open Space and existing regional facilities like the 18-hole Lake Wilderness Golf Course and Gaffney's Grove Disc Golf Course Maple Valley serves both local and regional recreation demands.
Beyond a typical acres-per-thousand-people metric, BerryDunn compared the City’s park system to the number of specific park components with average provisions by comparable communities in the NRPA national data set. Table 6 reveals these comparisons and highlights how Maple Valley amenities compare to other agencies of similar population size.
Table 6: Park Benchmark Analysis
This analysis demonstrates that Maple Valley meets or exceeds NRPA benchmarks for specialized recreational facilities, such as skateboard parks and pickleball courts, while identifying opportunities for strategic expansion in traditional amenities (e.g., playgrounds, athletic fields, and courts). The City's unique strengths in extensive natural areas and regional trail connectivity provide distinctive recreational value that complements standard facility offerings, enabling resident access to both conventional and specialized recreational opportunities.
Walkability Analysis
The NRPA's 10-minute walk metric is an industry-recognized benchmark that recommends all residents live within a 10-minute walk (approximately 0.5 miles) of a park or green space. This standard promotes equitable access to recreation and nature for all community members.
Pedestrian barriers such as highways, major streets, railroads, and natural features like rivers can significantly limit walkable access to parks. These obstacles divide the City into zones where residents can reach parks without crossing a major street or hazard. Figure 6 shows how these barriers create distinct pedestrian zones. To evaluate accessibility, the analysis considers whether people of all ages especially children and older adults can safely and comfortably reach parks without encountering major obstacles. If a route is not safe or easy
for an 8-year-old or an 80-year-old, it is treated as a barrier to walkability and a challenge to fair, equitable access.
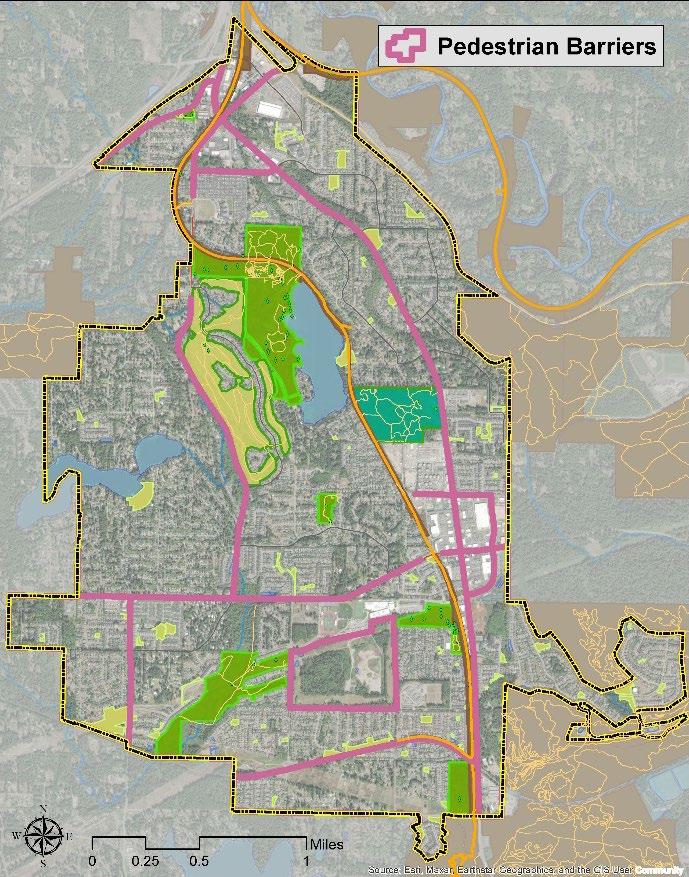
Figure 6: Barriers to Walkable Access to Parks
Using a 10-minute walk (half a mile) service area for Maple Valley parks and a 5-minute walk for alternative recreation providers while accounting for pedestrian barriers this analysis identifies gaps in park walkability across the City. Currently, 16.9% of residents (4,882 people) lack walkable access to a park regardless of park classification. This highlights a shortfall in the equitable distribution of recreational facilities and underscores the opportunity for targeted improvements in park planning and pedestrian connectivity.
This finding highlights a key planning challenge: although the City excels in providing largescale community parks and natural areas, its small-scale neighborhood parks and pocket parks do not quite serve residents' daily recreational needs within a walkable distance. The concentration of major parks like Lake Wilderness Park and Summit Park and Ball Fields, while valuable for community-wide recreation, leaves many residential areas without convenient pedestrian access to green space and places tremendous pressure on those major facilities.
These walkability gaps represent critical opportunities for strategic investment in neighborhoodscale parks, trail connections, and pedestrian infrastructure improvements to enhance equitable access to recreation for all residents, particularly in areas currently underserved by the existing park network.
Figure 7 depicts greater walkability access with darker shades of orange and less access with a color gradient change from light orange to yellow. Gaps are depicted where there is no color gradient shown.
234 City of Maple Valley, WA
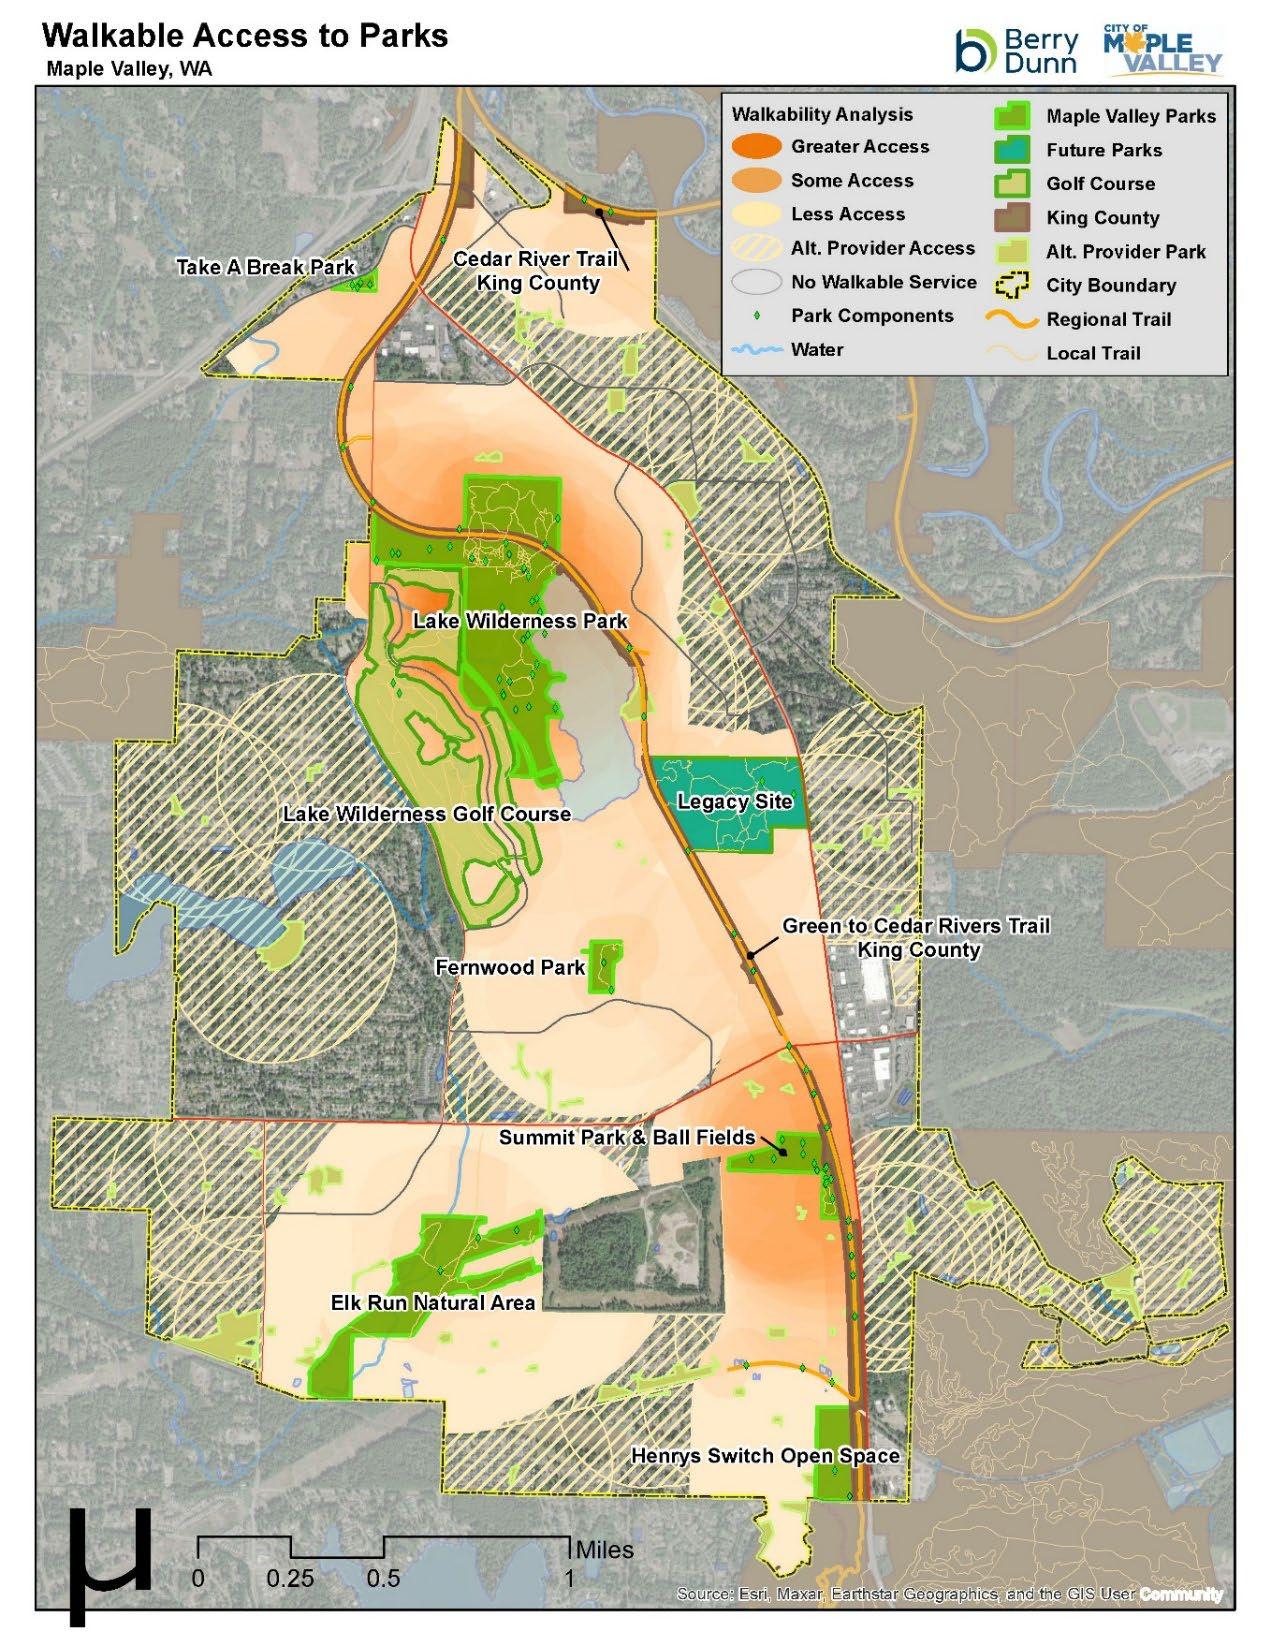
Figure 7: Walkable Access to Parks
Gap Analysis
Areas lacking walkable 10-minute access to outdoor recreation were further evaluated using pedestrian barrier analysis. Figure 8 demonstrates areas within the system that currently lack walkable access to outdoor recreation space, with gaps prioritized by underserved population size. These gap areas equate to locations to best target future acquisitions, improve connections by way of pedestrian infrastructure to surrounding parks and open spaces, or create trail connections to other regions.
Figure 8: Future Opportunities to Improve Walkable Access to Parks
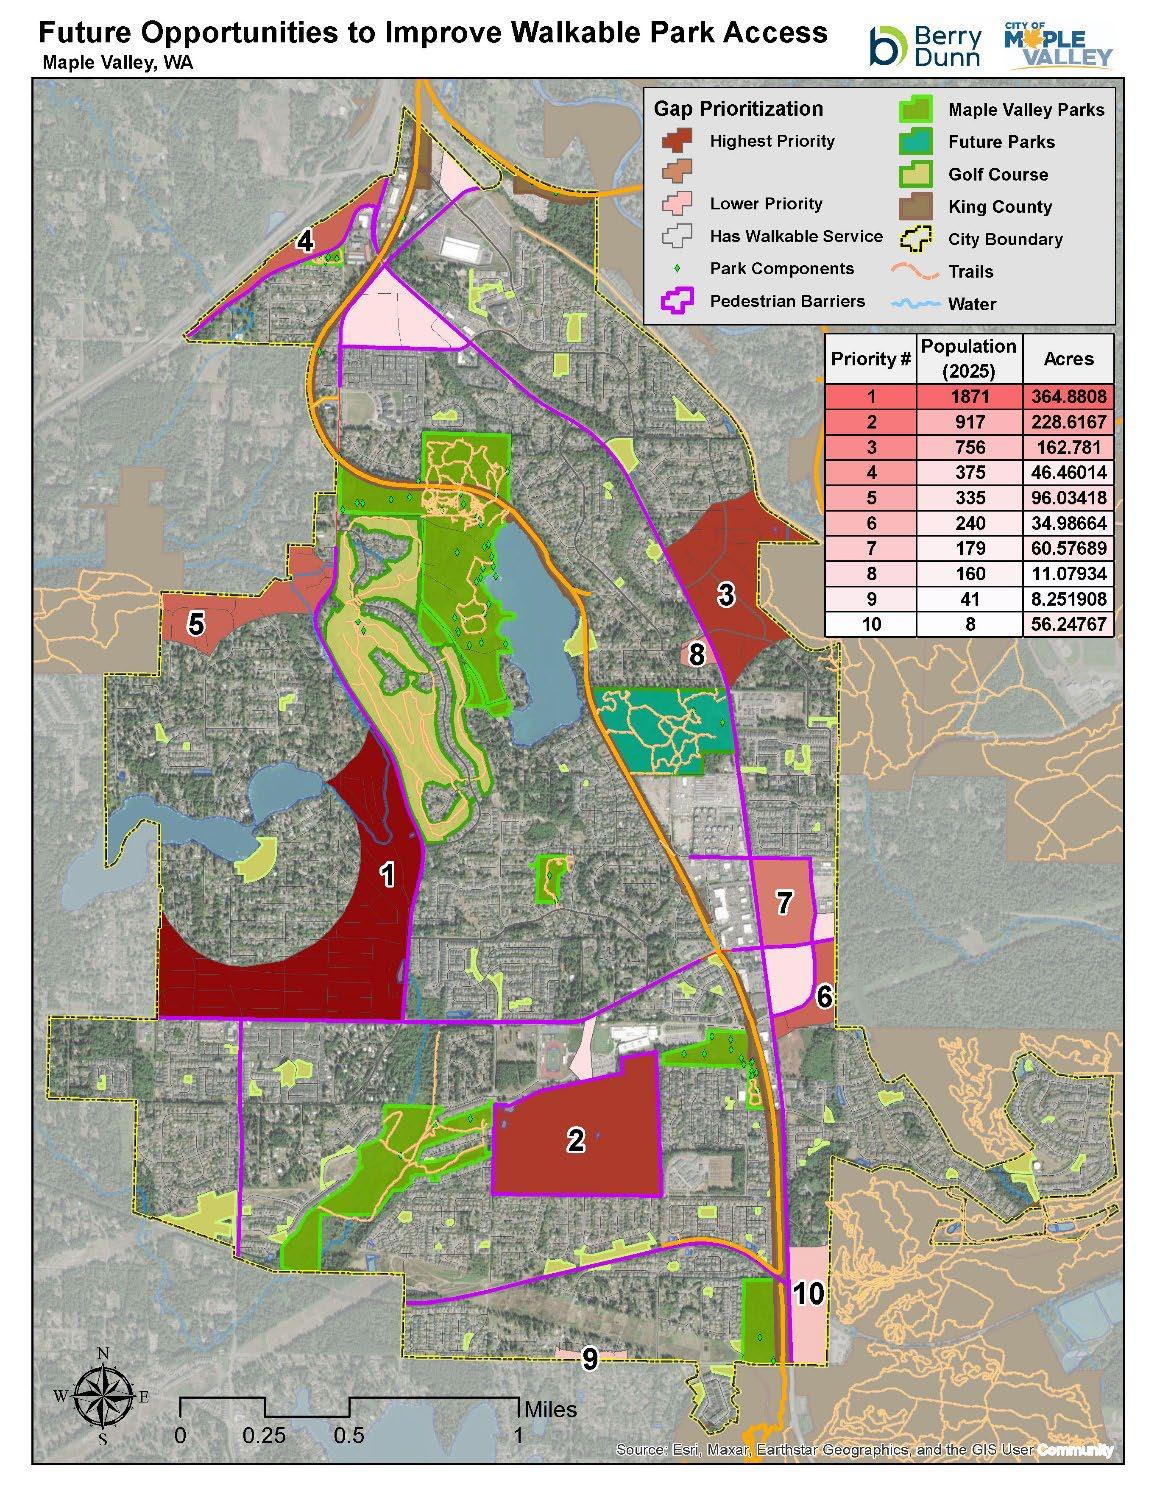
These areas collectively include significant residential populations and feature the following priority zones:
• Gap 1 (Highest Priority): Western Maple Valley northwest of Witte Road SE and SE 272nd Street, encompassing approximately 1,871 residents in primarily single-family residential developments. This area currently has no City parks and faces limited access due to a lack of sidewalks and crosswalks, significant surrounding roadways, and distance from existing park facilities.
• Gap 2 (Medium Priority): This underdeveloped area in south-central Maple Valley, located between Tahoma High School and SE 280th Street, is home to approximately 917 residents, according to census data, despite being largely undeveloped. Its central location and proximity to schools suggest the area may be targeted for future development. If so, long-term planning should include provisions for resident access to recreational amenities. Developing a trailway along the utility easement on the north side would significantly improve connectivity to both Elk Run and Summit Parks and Tahoma High School, with benefits extending well beyond the immediate neighborhood.
• Gap 3 (Lower Priority): Northeast Maple Valley, east of Maple Valley Black Diamond Road SE, serving approximately 756 residents in established neighborhoods. This gap could be alleviated by capitalizing on pedestrian infrastructure across WA-169 to the Legacy Site and by improving connections to the Rock Creek Natural Area and Pipeline Trail to the east.
• Gaps 4 – 10 (Lower Priority): These smaller residential clusters, located at the far northwest and southeast edges of Maple Valley, are home to approximately 1,338 residents. While their service needs are more dispersed, these areas still lack walkable access to City parks or trailways. In the future, it may be worthwhile to explore opportunities for expanding recreational access to better serve these neighborhoods. This analysis reveals that strategic investment in improved pedestrian crossings, trail connectivity, and possibly future neighborhood parks particularly in the highest priority areas would significantly enhance access to recreation and quality of life for the approximately 5,364 residents who currently have the least walkable access to outdoor recreational opportunities.
Trail Network and Connectivity
The interconnected trail system represents a cornerstone of Maple Valley's recreation infrastructure. The Green to Cedar Rivers Trail provides miles of regional connectivity, linking Maple Valley with the Cedar River Trail and metropolitan areas to the northwest along a converted railroad corridor. With identified trail access points throughout the City, residents enjoy connectivity to both local and regional trail networks.
Strategic Trail Connections
Maple Valley's Parks and Recreation Commission, City management, and previous planning efforts have identified priority trail improvements that will help transform the system into a more cohesive and functional network. These strategic connections directly support the park-specific
recommendations outlined in section 2.5 (above) and represent the highest impact investments for enhancing system connectivity and accessibility.
• The extension of the Cedar to Green Rivers Trail through Henry's Switch represents a major regional opportunity. This extension builds on Maple Valley's existing success by connecting with the larger regional corridor, positioning Henry's Switch as a strategic waypoint on the trail network. Combined with improved trailhead facilities and parking at Henry's Switch Open Space, the Legacy Site, and Summit Park, this connection elevates the site from underutilized to essential, further encouraging trail traffic and recreational usage for local and regional residents.
• Constructing a pedestrian and bicycle bridge across SR 169 would eliminate a major barrier between the Legacy Site and surrounding neighborhoods. This connection provides safe, comfortable, and direct access for residents of all ages, reducing reliance on vehicle trips, and positioning the Legacy Site as a regional hub for walking and biking. By linking to the Cedar-to-Green Rivers Trail and other local routes, the bridge will strengthen Maple Valley’s trail network, enhance equitable park access, and create a signature gateway feature that reflects the City’s commitment to connectivity and active transportation.
• The Elk Run to Summit Park connection represents a critical east-west corridor linking two major recreational anchors. This formalized trail would create a destination walk for residents, connecting Elk Run's natural trails and gardens with Tahoma High School, Summit Park's ball fields, playgrounds, and the Cedar to Green Rivers Trail. The resulting corridor would serve as a signature pedestrian and cycling route through central Maple Valley, activating both sites and distributing recreational access across the community's core.
• Equally important, trail improvements connecting Elk Run northward to Highway 516 will further enhance access to this natural area and provide another valuable link to regional trail networks. These connections transform Elk Run into a networked property that serves multiple neighborhoods and through users, maximizing the site's role in the broader recreational system.
Long-term infrastructure that connects neighborhoods and destinations strengthens the existing network by creating safe, non-vehicular routes and positioning Maple Valley as a regional transportation hub. These investments highlight the strategic importance of trail continuity and reflect the City’s commitment to comprehensive, future-ready active transportation. These recommendations and planning efforts are shown in Figure 9.
Official Recommendation
The Parks and Recreation Commission made a unanimous recommendation at its October 8, 2025, meeting that the City of Maple Valley improve connectivity to the Legacy Site by allocating funds to pursue the planning and construction of a safe and accessible trail connection from the southeast corner of the Legacy Site to the Green to Cedar Rivers Trail.


System-Wide Benefit
Trail connections enhance recreational opportunities beyond individual park sites, creating corridors for walking, cycling, and nature appreciation while supporting wildlife movement and environmental connectivity throughout the region. When implemented together, the priority connections transform Maple Valley's trail network into an interconnected system where residents can seamlessly move among destinations, neighborhood parks, and regional resources. The result is a wide-reaching recreation network that increases property values, supports public health, and positions Maple Valley as a destination for active recreation in the greater Seattle metropolitan area.
Key Findings
Based on the full inventory and analysis of the City’s parks and recreation system, several key findings emerge. These findings are outlined below and should be utilized to develop the future action plan and capital improvement plan projects.
Quality Amenities and Maintenance
The City’s parks and open space system demonstrates high quality and maintenance standards, with 97.8% of amenities meeting or exceeding expectations.
Extensive Trail Network
A robust network of regional trails managed by the City, King County, and other partners creates an interconnected system that extends recreational opportunities beyond park boundaries.
Abundant Natural Areas
Over 46% of the system’s acreage consists of greenways and natural areas. These spaces offer environmental benefits, passive recreation, and wildlife habitat preservation.
Strategic Regional Partnerships
Collaboration with King County Parks and Recreation and alternative providers expands recreational capacity and enables resident access to regional trail networks and neighborhood park facilities.
High Acreage-to-Population Ratio
With 12.45 acres per 1,000 residents, the City provides parkland access that exceeds national benchmarks. Increasing the amount of developed land within the owned acreage would expand community access to parks.
Targeted Improvement Opportunities
While the system performs well overall, two identified components require attention to maintain quality standards. Specific gaps in walkable service areas should be improved to help ensure equitable access for all residents.
Future-Oriented Planning
The 50.37-acre Legacy Site Master Plan reflects strategic long-term planning for recreational development and community access.
This analysis demonstrates that Maple Valley operates a parks and recreation system that works to balance resident needs with environmental stewardship. The combination of diverse facilities, extensive natural areas, and strategic partnerships creates a recreation network that enhances quality of life for the community.
HABITAT APPENDIX 6
Maple Valley’s Park System Natural Resources
Characteristics
The City of Maple Valley's (City) park system includes eight developed parks, undeveloped natural areas, and recreational facilities totaling over 360 acres of public land and serves as a vital component of the community's quality of life while simultaneously providing critical habitat for fish and wildlife within the rapidly developing Puget Sound region. As urban growth continues to fragment natural landscapes, the City's parks, which include upland forests, lakes, wetlands, and streams, have become increasingly important. They now function as critical biological refugia, providing habitat for native species ranging from Pacific tree frogs and roughskinned newts in seasonal wetlands, to great blue herons and river otters along lake shores. Salmon and trout, navigate the interconnected stream and lake corridors, while upland forests and meadows provide foraging, breeding and migratory habitat for elk, deer, bears, and coyotes. Maple Valley's unique location, adjacent to extensive County-owned natural open spaces and near the Cedar River Watershed, gives these protected areas greater regional habitat value and importance. They serve as essential steppingstones in the broader regional habitat network, allowing wildlife populations to move, feed, and reproduce across an otherwise increasingly urbanized landscape.
Beyond their ecological significance, Maple Valley's natural areas deliver substantial environmental services that directly benefit residents and the broader watershed. Vegetation intercepts rainfall and stormwater runoff, reducing flood risks in downstream neighborhoods while naturally filtering pollutants before they reach sensitive waterways. Wetland complexes trap sediments that might otherwise degrade water quality in the Green River system and ultimately Puget Sound itself. These multifaceted landscapes also provide irreplaceable opportunities for environmental education and outdoor recreation, offering residents of all ages the chance to connect with nature through hiking trails that wind through forest, boardwalks that traverse delicate wetland habitats, and interpretive programs that foster understanding of local ecology and conservation.
Known for its abundance of trees and freshwater lakes, the City has demonstrated its commitment to environmental stewardship through comprehensive policies that guide all municipal decisions affecting the natural environment. As the regional population continues to grow, these irreplaceable natural areas will face mounting pressure from development and increased use. It is therefore vital that preservation and restoration remain top priorities, helping to ensure these ecosystems continue to thrive for the benefit of both fish and wildlife and the residents who cherish these natural spaces.
Fish and Wildlife Habitat
Fish and wildlife habitat types found in the City’s parks are essential for supporting native biodiversity. Washington Department of Fish and Wildlife Priority Habitats and Species data identifies several high-value habitat areas within the park system that warrant special management consideration (Table 1). These habitats include salmon-bearing stream corridors with intact riparian forests; upland forests featuring multi-story canopy structure; forested wetlands, emergent marshes, and seasonal ponds that support breeding amphibians and waterfowl; open fields that provide habitat for pollinators, seed-dispersing birds, and foraging
raptors; headwater lakes and associated shoreline habitats; as well as the transitional edge environments where different habitat types intersect to create particularly rich wildlife communities.
Table 1: Species and Habitats Mapped in Maple Valley
Occurrence
Coho Salmon1,2
Oncorhynchus kisutch
Coastal Cutthroat Trout2
Oncorhynchus clarkii
Chum Salmon2
Oncorhynchus keta
Steelhead Trout2
Oncorhynchus mykiss
Chinook Salmon2
Oncorhynchus tshawytscha
Elk1
Cervus elaphus
Northwestern Pond Turtle1
Actinemys marmorata
Waterfowl Concentrations1
Candidate Not Listed Cranmer Creek, Jenkins Creek
Not Listed Not Listed Jenkins Creek
Not Listed Not Listed Cranmer Creek
Threatened Candidate Cranmer Creek, Jenkins Creek
Threatened Not Listed Jenkins Creek
Not Listed Not Listed Throughout Maple Valley
Proposed Threatened Endangered Mapped but likely not present within the city limits
Park Wetlands1
Throughout Maple Valley
Lake Wilderness, Lake Lucerne, Pipe Lake
Freshwater Pond1
Freshwater Emergent Wetland1
Freshwater Forested Shrub Wetland1
Lake Wilderness Park, Elk Run Natural Area
Lake Wilderness Park, Elk Run Natural Area
Lake Wilderness Park, Elk Run Natural Area Riverine1
Lake Wilderness Park
Source:
1 - Washington Department of Fish and Wildlife Priority Habitats and Species (PHS) on the Web
2 - Statewide Washington Integrated Fish Distribution (SWIFD) map
Wetlands
The park system encompasses several distinct wetland habitats, from small seasonal ponds to expansive forested wetland complexes. The most extensive wetland complex lies within the Elk Run Natural Area, featuring diverse forest, scrub-shrub, and emergent wetland ecosystems. Lake Wilderness Park also contains significant lake-associated wetland areas that provide critical habitat for waterfowl throughout the region.
In addition to providing habitat to both aquatic and terrestrial species, the wetland complexes within Maple Valley's parks function as biological treatment facilities, utilizing natural processes to improve water quality through multiple mechanisms. Emergent vegetation, such as cattails, sedges, and rushes, physically traps suspended sediments and debris while their root systems create extensive surface area for beneficial bacteria that break down organic pollutants and excess nutrients.
Protecting and enhancing the water quality functions of park natural areas requires both preservation of existing systems and strategic restoration of degraded sites. The City will work to minimize direct impacts to sensitive aquatic areas through careful trail design, installation of boardwalks and bridges where necessary, and implementation of low-impact maintenance practices that prevent soil compaction and erosion.
Fish-Bearing Streams and Riparian Corridors
The park system encompasses portions of two fish-bearing stream systems, including Jenkins Creek, which flows from Wilderness Lake, and Cranmar Creek, which flows through Elk Run Park. These streams provide valuable habitat to iconic salmonid species, including coastal cutthroat trout and coho salmon, fall chinook salmon, and winter steelhead.
The riparian corridors along these streams are relatively intact within the park boundaries and offer both ecological richness and recreational value to park visitors. These verdant streamside zones feature shallow wetlands essential for breeding amphibians and provide nursery habitat for juvenile fish, while also serving as prime feeding areas for migrating waterfowl. For visitors, these corridors provide tranquil settings for hiking, photography, and nature observation, with well-maintained trails offering access to diverse habitats.
Priorities for protection should focus on connecting aquatic habitats to riparian corridors through restored buffers that accommodate seasonal movement patterns of amphibians, small mammals, and birds, while helping to ensure that access infrastructure supports sustainable recreation without compromising the park's ecological functions.
Lakes and Shorelines
Maple Valley provides extensive public shoreline access to several lakes, including Lake Lucerne, Pipe Lake, and one of Maple Valley's premier aquatic resources, Lake Wilderness. The Washington Department of Fish and Wildlife Priority Habitats and Species data designates Lake Wilderness as a critical waterfowl concentration area, while more than 100 birders have completed nearly 400 checklists on eBird, documenting an impressive 124 bird species including several species of raptors, waterfowl, shorebirds, and numerous songbirds, establishing this lake as a treasured destination for birders throughout the Puget Sound region.
The lake serves as a vital habitat for fish, supporting native Kokanee and stocked rainbow trout populations; invasive species pose an ongoing and serious threat to this delicate ecosystem. Eurasian watermilfoil, and yellow flag iris, in particular, have established itself in portions of the lake, forming dense underwater mats that can displace native aquatic vegetation, alter water chemistry, and disrupt the habitat structure upon which fish and wildlife depend. These invasive plants can also impede recreational activities such as swimming, kayaking, and fishing, diminishing the lake's value for public enjoyment.
Recognizing the critical importance of preserving Lake Wilderness's ecological integrity, the City remains committed to working collaboratively with local partners, including the Washington Department of Fish and Wildlife, King County, lake associations, and volunteer stewardship groups, to monitor invasive species populations and implement targeted management strategies. Through ongoing partnerships, regular monitoring programs, and adaptive management approaches, the City will continue to address these threats while maintaining the lake's role as both a crucial wildlife habitat and a cherished community resource.
Upland Forests
The upland forested areas within Maple Valley’s parks serve as critical roosting, breeding, and foraging grounds for numerous bird species, while functioning as important wildlife corridors for larger mammals, including elk, deer, and brown bears. These same areas offer visitors excellent opportunities for wildlife watching, particularly during dawn and dusk hours, and provide peaceful retreats for those seeking to connect with nature through activities like birdwatching, sketching, or simply enjoying the restorative sounds of nature.
These forested upland habitats function as a critical steppingstone in the wildlife corridor network, connecting urban green spaces with larger natural areas. Effective management requires maintaining and improving habitat connectivity by removing barriers to wildlife movement and establishing continuous native vegetation zones linking different habitat types. This approach must carefully balance public access needs with forest ecosystem integrity, as trail development and user dispersal can fragment the upland forest canopy and disrupt wildlife movement patterns. Strategic trail placement should concentrate recreational use along designated corridors while maintaining large, undisturbed forest blocks that provide interior habitat conditions essential for sensitive species.
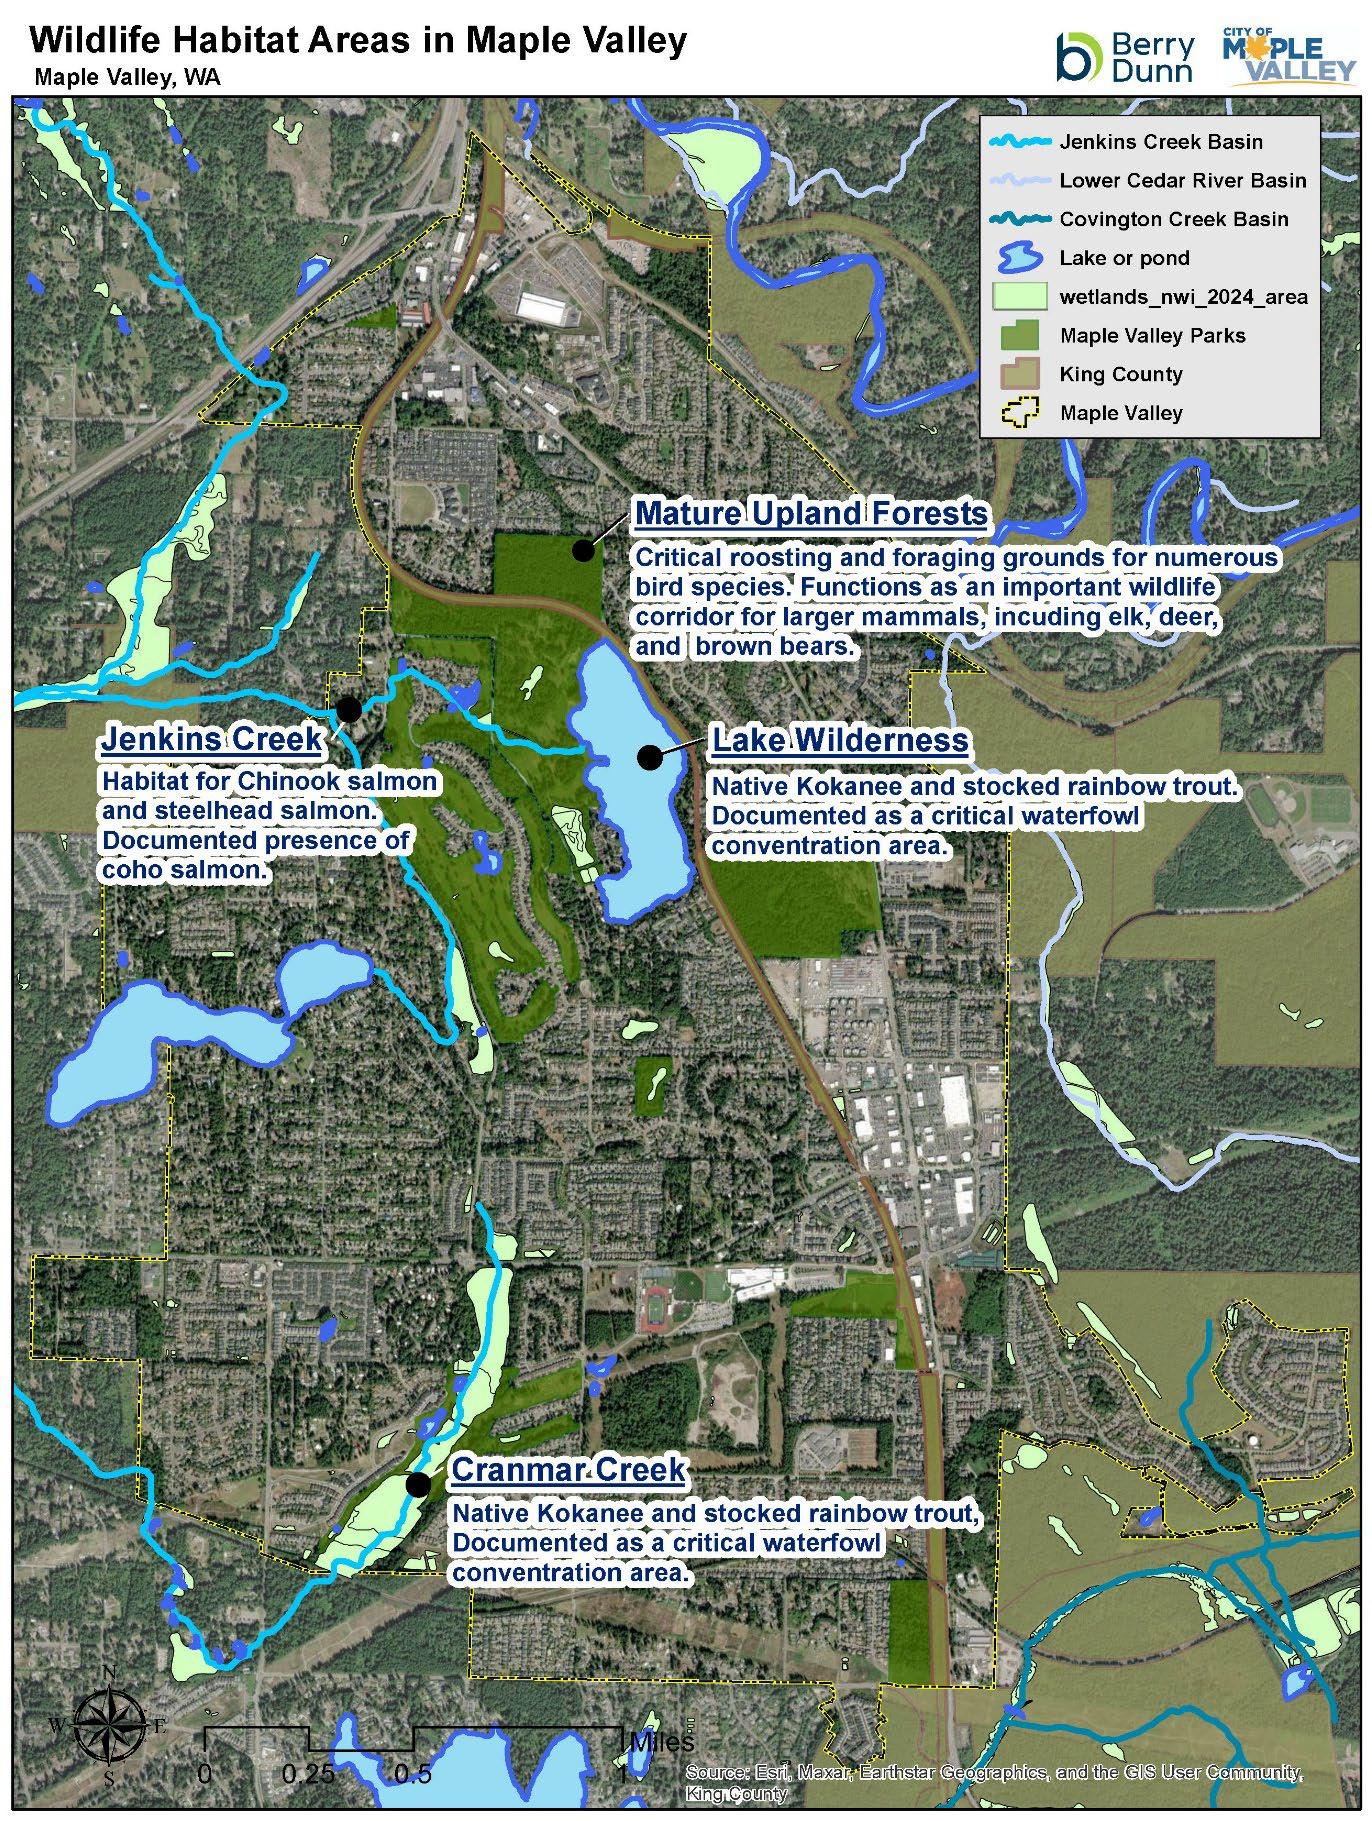
RECREATION PROGRAMS AND SERVICES ASSESSMENT
Introduction
The recreation assessment reviews the City of Maple Valley (City) Parks and Recreation Department’s (Department’s) recreation program and service offerings through a series of individual analyses. BerryDunn reviewed the results of these analyses from a global perspective by assessing what the Department is offering, who it is reaching, and what the community has shared. This assessment report offers detailed insight into the Department’s recreation program and service offerings; helps identify strengths, weaknesses, and opportunities for future program direction; and assists with identifying program categories, programming gaps, and future program considerations.
BerryDunn reviewed various reports and data for this effort, including the Department’s seasonal program guides and website as well as data from registration software and staff. Internal staff meetings also yielded beneficial insight. The integration of community engagement results with data analysis helped inform and drive program and service recommendations. Together, these analyses provide an extensive picture of how the Department’s recreation services meet current and future community needs.
What are you offering?
Who are you reaching?
What did the community say?
Informs future direction
Program Menu
The Department’s program menu consists of recreational activities offered for a specific time frame. BerryDunn analyzed Fiscal Year (FY) 2024 data for this report. This section reviews the menu’s core program areas, program inventory, program distribution, and age segmentation.
Core Program Areas
The Department categorizes its recreational activities into five program areas, as illustrated in Figure 1.

The categorization helps the internal team administer (and external users research and register for) programs in an organized fashion.
Figure 1: Program Areas
Fitness and Dance
Youth Sports
Education, Music, and Art
Camps
Adult Sports
Program Inventory
To understand the breadth of recreation offerings, the Department’s current program menu was compared to a national inventory of common parks and recreation program categories, highlighting both the strengths of the existing program portfolio and opportunities for future expansion.
Based on this review, the Department offers approximately 62.2% of the program categories typically provided by similar agencies across the country, which is slightly under the national average of 64.5%.
Table 1 compares the Department’s 2024 offerings with national benchmarks. Shaded categories represent program types not currently offered by the Department, helping identify gaps and potential areas for development.
Table 1: Program Inventory Compared to National Database
Shaded categories represent program types not currently offered Active
Before/After
Birthday
Day/School Break Camps
Environmental/Nature
The program categories highlighted in blue represent opportunities for program menu expansion if aligned with community needs. For example, senior programming is provided by the Greater Maple Valley Community Center; therefore, expanding this program area would be prudent only if unmet needs are identified.
Program Distribution
Understanding the distribution of the Department’s enrollment-based program menu across core program areas helps identify the extent of programming within each area in relation to the whole. Figure 2 reflects programs offered by core program area. Fitness and dance programs account for the largest share at 34.7% (182 total offerings), followed by youth sports at 24.4% (128 total offerings) and education, music, and art at 19.2% (101 total offerings). Camps and adult sports make up smaller portions at 11.6% (61 total offerings) and 10.1%, respectively (53 total offerings)
Figure 3 depicts the total programs offered in 2024 according to program area and season. Most programs were offered in the spring/summer (238), followed by fall (156) and winter (131).
Figure 2: Enrollment-Based Program Distribution (2024)
Figure 3: Total Programs Offered, by Season (2024)
City of Maple Valley, WA
When analyzing program distribution, it is important to consider findings with other analysis components and performance factors such as age segmentation and participation levels for a more complete understanding of reach and program execution effort.
Age Segmentation
The age segment analysis reviews the distribution of program offerings according to age segments serviced. For the purposes of this assessment, BerryDunn delineated age categories according to the following structure:
• Early Childhood, 0 – 5 years
• Youth, 6 – 12 years
• Teen, 13 – 18 years
• Young Adult, 19 – 34 years
• Adult, 35 – 61 years
• Senior (62+ years)
BerryDunn tallied the number of registration-based program opportunities targeted to specific age groups in 2024. If a program section spanned clearly across two age categories (e.g., ages 8 – 14), BerryDunn counted that section once in the youth category and once in the teen category. Figure 4 displays the Department’s 2024 program menu’s percentage of registrationbased programs offered according to each age segment.
Youth programs make up the largest share at 41.3%, followed by early childhood at 19.7%, teens at 15.1%, adults at 14.2%, and seniors at 9.7%.
Age segmentation analysis is a helpful method for reviewing departmental programming in relation to community demographics. Demographic data can help demonstrate how programming efforts align with the community’s makeup. The adjacent comparison of the
Figure 4: Total Programs Offered by Age Segment (2024)
community’s population and enrollment-based program offerings in Figure 5 demonstrates the relationship between the population percentage and the percentage of programs offered for two key age segments.
Figure 5: Population vs. Program Menu
Most (76.1%) of the Department’s enrollment-based programs are designed for youth ages 0 –18, while the youth age segment represents 32.1% of the community’s population. Adults make up 67.9% of the population, while 23.9% of enrollment-based programs are designed for this age segment. Most park and recreation agencies across the country offer a higher percentage of youth programming (often between 60% and 75%) despite the youth population typically being significantly smaller. The program menu’s age segmentation does not need to mirror the community’s age demographic segmentation exactly; however, an ongoing goal can be to balance the menu to reflect community makeup. This pattern mirrors trends in similar-sized communities, where youth programs typically dominate program offerings despite representing a smaller share of the total population.
Program Performance
In addition to assessing the menu of programs offered, it is helpful to gauge program performance. The extent of program performance can be measured by participation, financial performance, and the life cycle analysis.
Program Enrollment
In 2024, the Department’s programs enrolled 7,165 participants Youth sports made up the largest portion of overall enrollment at 35.1%, followed by adult sports (24.6%) and fitness and dance (22.1%). Camps and education, music, and art accounted for 12.3% and 5.9%, respectively.
More than half (59.7%) of enrollment was in sports programs. This emphasis on athletics reinforces the Department’s strength in structured, team-based recreation while suggesting opportunities to expand non-sport offerings to reach new audiences.
Figure 6: Overall Enrollment by Program Type
Music & Art, 5.9%
12.3%
& Dance, 22.1%
Residency
Overall participation was significantly higher among City residents, who accounted for the majority (77.7%) of enrollments across all program types. Members of the general public accounted for 22.3% of all enrollments in 2024.
Camps had the highest percentage of residents (88.9%), followed by youth sports (79.4%) and fitness and dance (78.4%). Adult sports attracted a significant percentage of general public participants; more than half (52.6%) of participants were not residents in 2024.
Adult Sports, 24.6%
Type and Residency
Participation Snapshot: Sports
Taking a closer look at youth sports enrollment, five types of sports compose youth sport offerings (Figure 8) Youth sport classes had the highest participation of the five types at 35.1%, followed by basketball leagues at 27.2%, baseball at 18.8%, soccer at 16.8%, and volleyball at 2.1%.
Adult sports programs had the highest participation in softball leagues at 30.2%, followed by sport classes at 20.8%, volleyball at 19.9%, flag football at 12.7%, soccer at 11.2%, and racquet sports at 5.3%.
Figure 7: Total Enrollment by Program
Figure 8: Youth Sports Participation
Youth Sport Classes Youth Basketball League Youth Baseball Leagues
Youth Soccer League Youth Volleyball League
Together, these figures illustrate strong community engagement across both youth and adult team sports.
Waitlists
When a program is created, the staff member must enter the maximum number of participants allowed to register for that program. When more interest is generated than there are spots available, a waitlist can be formed. The goal of recreation staff is to enroll as many participants as possible from the waitlist. In some cases, participation slots can be created in programs by increasing the number of instructors or the number of sections offered. Staff may be unable to increase the size of the program due to limitations on available facility space (room size or School District availability), or staffing/instructor/volunteer availability. The Department’s waitlist by program area is depicted in Figure 10.
Figure 9: Adult Sports Participation
Figure 10: Waitlist Enrollment by Program Category
Adult Softball Leagues Adult Sport Classes Adult Volleyball Leagues Adult Flag Football Adult Soccer Leagues Adult Racquet Sports Leagues
The Department’s software indicated 557 people remained on a waitlist in 2024. Of that total, 315 were waitlisted for camps, 48 were waitlisted for adult sports, and 120 were waitlisted for youth sports. It is typical for programs to have a few participants remaining on a waitlist at the end of a season.
Waitlist data indicates strong demand from residents across all program types. Camps had the highest waitlist count (315), with 255 residents and 60 general public waitlisted registrants. Youth sports had 81 residents and 39 general public participants, while adult sports had 32 residents and 16 general public participants. Fitness and dance included 56 residents and 13 general public participants on the waitlist. Education, music, and art had only five residents waitlisted, with no general public participants. Figure 11 reflects higher resident demand, particularly in camps and youth programs.
Another measure that helps inform whether supply meets demand is the percentage of needs met. Total demand is calculated by adding the number of registrants and waitlisted registrants. The number of registrants divided by total demand equals the percentage of needs met. Figure 12 demonstrates that the program area with the lowest percentage of needs met was camps (70.7%).
Camps
• 315 on waitlist
• 70.7% needs met
Adult Sports
• 48 on waitlist
• 92.1% needs met
Youth Sports
• 120 on waitlist
• 96.1% needs met
Not only is it important for the City to try to meet its residents’ needs (demand), but registrants who remain on the waitlist also represent lost fiscal resources. For example, if each waitlisted person were enrolled into the program of their choice (assuming instructor and facility spaces were secured), and the average net revenue earned by the City for each resident is $10, the City would gain an additional $5,570 in net revenue in 2024. Based on program-specific net
Figure 11: Waitlist Enrollment by Program Type and Residency
Figure 12: 2024 Percentage of Needs Met
revenues of $11 and $39 per registrant, Camp Wild could generate about $3,465 in net revenue and youth sports could generate roughly $4,680 if each waitlist registrant could be enrolled Addressing unmet demand, particularly in camps and youth sports, presents both a service and revenue opportunity for the City. This revenue potential would increase further as average net revenue per participant rises across program areas.
Program Life Cycle
A life cycle analysis was conducted to evaluate the current mix of programs offered by the Department. This analysis helps determine whether the Department is maintaining a healthy balance between established offerings and new, innovative programs that respond to changing community interests.
Staff were asked to categorize their programs into one of four life cycle stages (introduction, growth, mature, and decline) based on their familiarity with participation trends and program performance. These categories provide insight into how programs are evolving and where attention may be needed to adapt, refresh, or retire offerings. Table 2 describes each life cycle stage and the Department’s percentage of programs within each stage.
Most programs are in the growth (37%) and mature (34%) stages, indicating strong development and stability. A smaller portion is in the decline phase (17%), while introduction accounts for just 12%, suggesting fewer new programs are being launched.
Figure 13 depicts all major program categories and their distribution across life cycle stages. A healthy balance between stages is optimal, with a bulk of programs in the growth and mature stages. That is the case for the Department, with 71% of programs in these stages.
As a normal part of the planning cycle, there should always be programs in the introduction stage that bring new, innovative programming to the menu. There will typically also be programs in the decline stage; those programs should be either repositioned or decommissioned. The Department’s percentage of programs in the decline stage (17%) is a bit high and should be examined for possible repositioning or decommissioning consideration
Table 2: Life Cycle Stages
13: Distribution of Program Life Cycles
Individual program areas should strive to have programming that falls into all four life cycle stages, with the majority in the growth and mature stages (green and light blue in Figure 14). Three of the five program areas demonstrate programming in all four life cycle stages, with education, music, and art representing one of the most well-balanced categories. Fitness and dance show a very large number of programs in the growth stage (42); maturing them will be the next goal. Youth sports and adult sports have notable portions in the decline phase, suggesting a need for review or revitalization. Regularly monitoring this balance will help ensure programming remains responsive to evolving community interests.
Program Facilitation
For some programs, the Department employs its own staff to lead the experience. For others, the Department coordinates with an independent contractor. When an independent contractor relationship is established, the Department’s role could include advertising the opportunity, facilitating registration, and/or providing the facility, while the independent contractor could be responsible for providing supplies and instructors. These shared responsibilities between the entities result in a split of program revenue.
The distribution of programming in terms of contract or in-house offerings shows a significant reliance on independent contractors across several categories. Education, music, and art programs are led entirely by contractors, accounting for 22.3% of the total recreation offerings. Similarly, fitness and dance programs are fully delivered by contractual instructors, representing 14% of the total. Youth sports is more balanced, with 19.0% contracted and 12.8% conducted in-house by staff, indicating a hybrid approach. Camps are evenly split, with both contractors and staff contributing 7.8% each. In contrast, adult sports lean more heavily on staff delivery, with 11.2% managed in-house compared to 5% contracted.
Figure
Figure 14: Distribution of Programs by Contract Status
All programs were evaluated consistently regardless of who facilitated them. The City remains responsible for the overall participant experience, whether programs are delivered by staff or contractors. There is no single ideal mix of delivery methods, as each has its benefits and challenges. What matters most is that services are provided efficiently, effectively, and to the community’s satisfaction. This balanced approach allows the Department to deliver a wide range of programs while leveraging external expertise.
Mobile Recreation
The City facilitates a mobile recreation program called Destination Recreation, where Department employees bring a brand-wrapped van filled with recreation supplies to three local parks throughout the summer. Staff lead scheduled activities and games, and performers hold shows for children aged 2–12, three days per week, according to a schedule posted on the City’s website.
Mobile recreation check-in data collected in 2025 highlights strong community engagement across three park locations. Lake Wilderness Park recorded the highest number of household or group check-ins at 246, followed by the Legacy Site with 209, and Take-a-Break Park with 204, resulting in a total of 659 check-ins (Figure 15) These findings affirm the program’s popularity and visibility across multiple neighborhood parks.
Figure 15: Mobile Recreation Household/Group Check-Ins by Location (2025)
Lake Wilderness Park
Site
During sign-in, parents reported a total of 1,353 children across all sites: 621 at Lake Wilderness Park, 375 at Take-a-Break Park, and 357 at the Legacy Site (Figure 16).
Figure 16: Number of Children Registered by Location (2025)
Events
The Department directly organizes six community events annually the Bike Challenge, Independence Day Celebration, Kids' Fest, Music and Movies in the Park, Zombie Dash, and Hometown Holidays. Partners are responsible for six events—the Egg Hunt, Fishing Derby, Lake Wilderness Triathlon, Maple Valley Days, Be the Hope Walk, and Turkey Trot. The City organizes five additional events: the Town Hall, Juneteenth, Earth Day, Volunteer & Service Expo, and the Pride Event This distribution shows that while the Department leads in recreational programming, partners contribute significantly to event variety, and the City focuses on civic and cultural initiatives. This collaboration underscores the City’s ability to deliver a diverse annual calendar of community experiences.
While the Department organizes six of the events, it supports all 17 annual events through logistical coordination, setup, event execution, trash pick-up and removal, and take-down Significant departmental staff resources are committed to these community-wide celebrations.
Table 3: Annual Events by Organizing Entity
City Events Parks and Recreation Department Events
Events Earth Day
Bike Rodeo
Be the Hope Walk
Hunt
Town Hall Kids' Fest Lake Wilderness Triathlon
Volunteer & Service Expo
Music and Movies in the Park
Maple Valley Days
Zombie Dash
Turkey Trot
Lake Wilderness Park
Take-a-Break Park
Legacy Site
Facility Use
While the Department uses its indoor and outdoor facilities for its own programming and event services, it also facilitates the rental of indoor and outdoor spaces and amenities. This section examines the use of the facilities for programmatic and rental functions.
Program vs. Rental Use
Figure 17 illustrates the distribution of facility usage hours between program and non-program activities at Summit Park, Lake Wilderness Lodge, Lake Wilderness Park, and the Legacy Site. Summit Park reports the highest overall activity among the four sites, with external rentals slightly exceeding internal program use at 2,043.5 hours compared to 2,037.5 program hours. Lake Wilderness Lodge shows a relatively balanced use profile, with 1,175.8 hours of internal program use modestly surpassing 1,087.0 hours of external rentals. At Lake Wilderness Park, activity is also fairly evenly split, though external rentals remain the primary driver, with 1,603.0 hours compared to 1,552.0 program hours. The Legacy Site reflects a similar pattern, with 295.0 hours of external rentals slightly exceeding 289.0 hours of internal program use.
Figure 17: Internal Program Use vs. External Rentals
Rental Hours
Summit Park recorded the most total rental hours, with all 2,043.5 hours attributed to sports field activities. Lake Wilderness Park followed with 1,603 hours, primarily driven by picnic shelter and site reservations, which accounted for 1,476 hours. Lake Wilderness Lodge logged 1,087.5 rental hours, with significant time dedicated to business meetings (326.5 hours) and weddings (524.5 hours). The Legacy Site was rented for 295 hours, mostly for park special use (261 hours). Overall, the combined total rental hours across all locations/activity types amounted to 5,029 hours.
Legacy Site
Lake Wilderness Lodge
Lake Wilderness Park
Summit Park
External Rentals Internal Program Use
When program hours are factored in, each facility shows a nearly even split between program and rental activity. Program hours closely match rental hours at all four sites, indicating that both types of use contribute equally to how these facilities serve the community.
Figure 18: Facility Use Hours by Location and Function
Boat rental data at Lake Wilderness Park reveals a strong preference for group-based water activities. Multiple rider boats, which include pedal boats, canoes, and kayaks, accounted for the highest usage, totaling 796 hours, indicating robust demand for shared recreational experiences. Single Rider boats, including stand-up paddle boards and kayaks, followed with 504 hours. The relatively lower reliance on stand-up paddle board rentals may also reflect that many visitors bring their own boards, while group-oriented equipment continues to depend more on City-provided options.
Figure 19: Lake Wilderness Park Boat Rental Hours
Multiple Rider Boats Single Rider Boats Stand-Up Paddle Boards
City of Maple Valley, WA
Rental Revenue
Lake Wilderness Lodge generated the highest revenue among all locations, totaling $508,527.75, with weddings contributing the largest share at $390,800.00. Summit Park followed with $91,843.75 all from sports field usage. Lake Wilderness Park earned $65,824.00, primarily from picnic shelter and site rentals ($25,000.00) and multiple rider boats ($18,984.00). The Legacy Site recorded the lowest revenue at $7,740.00, mostly from park special use and outdoor pavilion activities. Overall, the combined revenue across all locations and services amounted to $673,935.50. Revenue from rentals provides a meaningful offset to operating costs, particularly through the consistent financial performance of Lake Wilderness Lodge.
Figure 20: Rental Revenue by Location
Legacy Site
Lake Wilderness Park
Summit Park
Lake Wilderness Lodge
Event, Program, and Rental Reach
Event Reach
The Placer.ai event data in Table 4 provides a high-level overview of how both City-operated and non-City-operated events contributed to visitation in Maple Valley in 2024. Placer.ai is a nationally recognized geolocation analytics platform that uses anonymous, aggregated mobile device location data to estimate visitation patterns. Because Placer.ai is location-based rather than event-based, reported visit counts reflect overall activity within the event footprint and may include overlapping park use, concurrent activities, or general public visitation rather than confirmed event attendance.
City-operated events varied in scale, audience composition, and dwell time. The Bike Challenge and Rodeo was a smaller, community-focused event with 131 registered participants. Placer.ai data shows approximately 2,900 visits within the event area on that day, most of which came from non-residents, suggesting that both the event and the park itself attract families and participants from surrounding communities on a typical summer Saturday. Independence Day was the largest City-hosted event, generating approximately 10,300 visits and showing the highest share of Maple Valley residents (46.6%), indicating strong local participation alongside regional draw. Music & Movies in the Park also demonstrated substantial reach, with 7,900 visits and a predominantly non-resident audience (64.4%), suggesting appeal beyond the immediate community. Other City events such as Kids Fest (3,900 visits) and Hometown Holidays (1,600 visits) reflect a mix of local and regional participation, with Hometown Holidays showing the strongest local orientation (58.8% residents).
Non-City-operated events similarly played an important role in activating public spaces and drawing visitors to Maple Valley. Maple Valley Days was the largest event overall, generating approximately 20,800 visits across multiple days and attracting a broad mix of local and regional attendees (40.8% residents). Athletic and special-interest events such as the Lake Wilderness Triathlon, Turkey Trot (Thanksgiving Day 5K), and the Fishing Derby attracted primarily nonresident participants, which is typical for competitive or destination-oriented events. Communitybased events like the Egg Hunt – Community Church Event showed higher levels of local participation while still contributing to overall park activity.
Across both City-operated and non-City-operated events, dwell times were consistently strong, ranging from approximately 43 minutes to nearly three hours, with several events exceeding 150 minutes. These longer dwell times suggest that attendees are spending meaningful time participating in activities, engaging with vendors or programming, and using park amenities. Overall, the data indicates that Maple Valley’s events, whether hosted directly by the City or by partner organizations, play a significant role in activating parks and public spaces, supporting community engagement, and attracting visitors from both within and outside the city.
Table 4: Placer.ai Event Visitation Overview (2024)
Program Reach
The program participant maps (Figures 21 and 22) illustrate the geographic distribution of program engagement across the City and the surrounding region. The local view (Figure 21) shows a dense concentration of participants throughout Maple Valley neighborhoods.
Figure 21: Program Participants – Maple Valley View (2024)
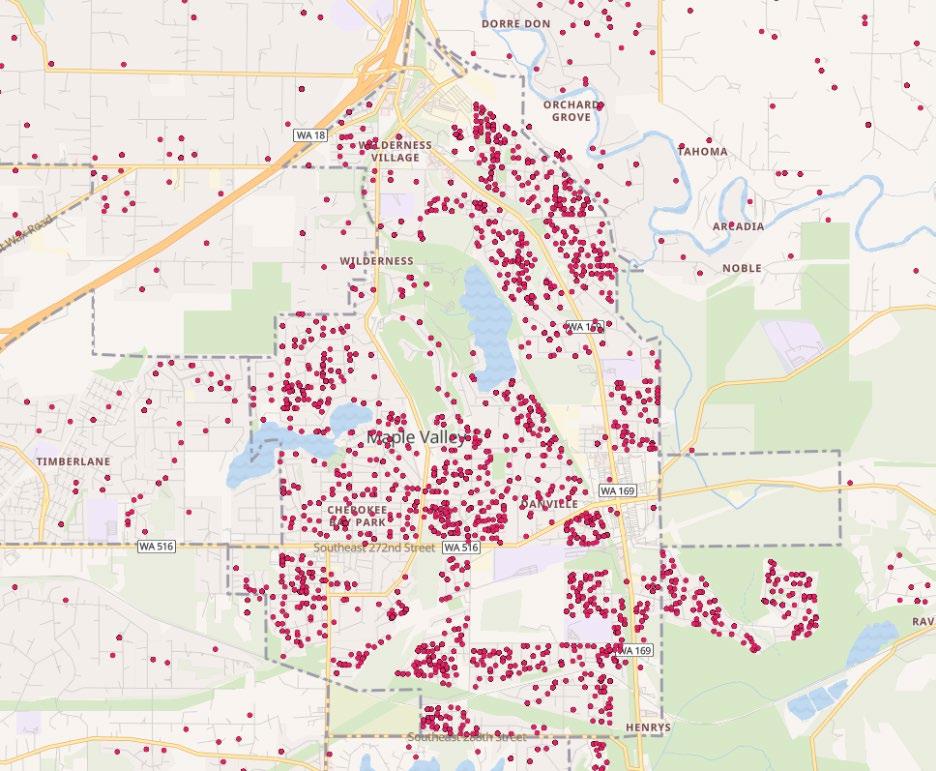
The regional view (Figure 22) highlights the City’s broader program reach, with clusters extending across South King County and into major population centers including Renton, Kent, Seattle, and Tacoma. Together, these maps reflect strong local and regional participation in City recreation programs.
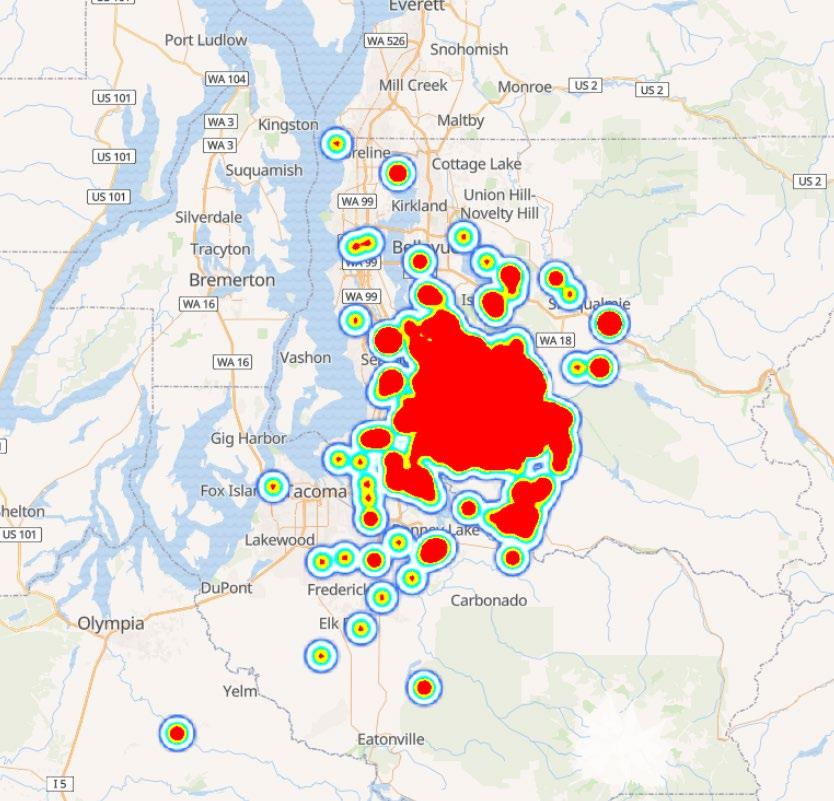
The mobile recreation reach map (Figure 23) illustrates where the 2025 mobile recreation program participant households are located throughout the region, with the highest concentration centered in Maple Valley (ZIP 98038). This pattern underscores the program’s strong community presence and its success in engaging local residents. Nearby communities such as Black Diamond (98010), Covington (98042), and Renton (98058) also showed consistent participation, reflecting the program’s reach across the broader South King County area.
While most mobile recreation engagement originated within Maple Valley, additional check-ins appeared throughout western and central Washington, with a small number of participants in other states, including Oregon, California, Florida, and Pennsylvania, potentially representing former residents and/or visiting families. Because participant data is collected at the ZIP code level, each point corresponds to the geographic center of that ZIP area, which may create the appearance of gaps between data clusters.
Figure 22: Program Participants – Regional View (2024)
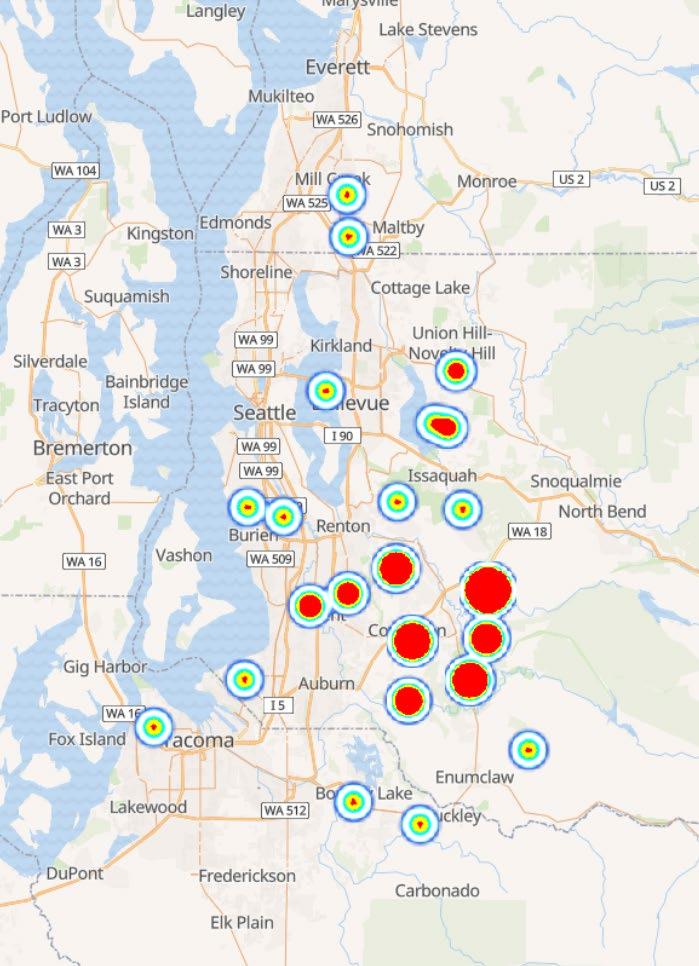
Figure 23: Mobile Recreation Participants (2024)
272 City of Maple Valley, WA
Rental Reach
The facility rental map (Figure 24) illustrates where 2024 rental customer households are located across the region, with the highest concentration in Maple Valley. Most renters originated from within the City, showing strong local use of community facilities. Nearby cities such as Kent, Renton, Auburn, Covington, and Seattle also showed consistent participation, indicating regional interest in Maple Valley’s rental spaces. A few rentals originated from Oregon, Idaho, Arizona, Texas, and Michigan, perhaps from former residents and/or families with local connections.
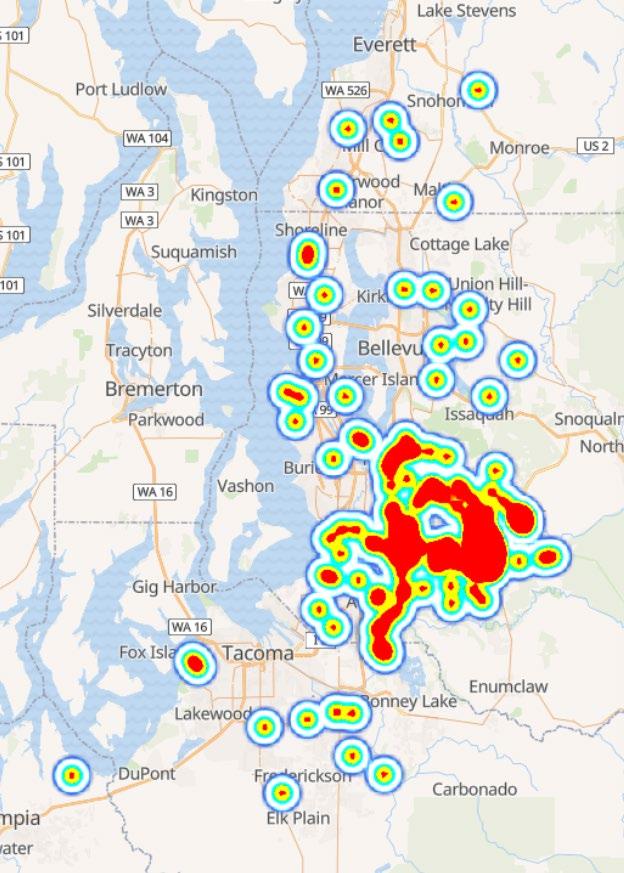
Figure 24: Facility Rental – Regional View (2024)
Staff Feedback
BerryDunn facilitated a staff discussion to understand strengths, challenges, and opportunities in delivering programs and services. These insights complement the data analysis in this report.
Strengths
Staff emphasized that the Department provides high-quality programs with strong community participation, particularly in youth sports such as soccer and basketball, which continue to grow. Summer camps are also very popular with the community, with some filling within minutes of registration opening. The team is committed to maintaining a welcoming, service-oriented culture despite resource limitations.
Challenges
The discussion revealed several ongoing barriers affecting the Department’s ability to deliver programs efficiently and meet growing community demand. Staff identified limited facilities as a key constraint, noting the absence of a dedicated indoor recreation space and that Lake Wilderness Lodge is outdated and undersized for current programming needs. The lack of covered outdoor areas also limits year-round operations during inclement weather. Staffing capacity remains a significant challenge, as a small team of three full-time staff oversees 25–30 contracted instructors, manages expanding youth and adult sports programs, coordinates a highly seasonal summer programming, and organizes six major community events. High turnover among part-time seasonal employees (limited to 17 hours per week) further disrupts continuity and increases the burden of ongoing training. Partnerships and access were also highlighted, with rising School District rental fees and limited public transportation options reducing affordability and accessibility for families. Finally, technology limitations create inefficiencies, as the City’s registration and accounting systems (Xplor and Incode) do not integrate, requiring manual reconciliation of revenue and reports. Despite these constraints, staff identified several key opportunities to strengthen and expand programming.
Opportunities
Staff see strong potential to expand camp, youth sports, and adult fitness and wellness offerings as demand, facility space, and staff capacity allow. They also recognize the value of covered outdoor structures to support year-round programming and formal agreements with partners to reduce program conflicts and strengthen collaboration.
Ideas for Improvement
Staff suggested enhancing the registration process for greater consistency and userfriendliness, noting that clearer communication and a more predictable registration flow would help reduce confusion for both participants and staff. They also recommended converting some seasonal roles to longer-term part-time positions to improve retention and exploring additional facility investments to meet rising community demand. Addressing these needs would allow the Department to continue delivering high-quality programs while expanding opportunities for residents of all ages.
Community Needs Assessment Alignment
The community engagement process yielded significant program-related feedback. The community survey, website, and event booths helped identify the community’s expressed programming needs. This section compares key programming-related takeaways with findings from the data analysis phase; the result is an understanding of the alignment between community needs and what is (or is not) being provided.
Most community needs survey respondents (89%) rated the quality of City programs as excellent or good; the community is very satisfied with current service levels. Additionally, survey findings indicated that residents are very aware of program offerings and yet cannot get in because classes are full. To help guide future program area development, the Department can consider aquatics programming, adult fitness and wellness programs, and outdoor adventure activities provided it can secure the needed facility space and staff/instructors to facilitate additional programs. This alignment between community feedback and operational data provides a clear road map for future investment priorities.
Community Participation
The following City-specific data was sourced from Esri Business Analyst and the 2025 Parks and Recreation Needs Assessment Survey conducted by ETC Institute. Figures 26 – 29 and Tables 4 and 5 illustrate how participation and expenditures in recreation activities among Maple Valley residents compare with statewide benchmarks and how these trends align with the Department’s current program performance and community priorities.
As shown in Figure 25, Maple Valley residents demonstrate strong engagement in fitness activities, with participation slightly above statewide averages in every category. Walking for exercise (36.3%) was the most common activity, followed by weight lifting (19.2%) and jogging or running (12.4%). These results highlight the community’s strong emphasis on health and wellness, consistent with survey findings that identify adult fitness and wellness programs (Priority Investment Rating (PIR) = 163) as a top programming priority.
25: Local Participation in Fitness Activities
Figure 26 depicts participation in sports activities, where golf (9.9%), basketball (6.2%), and pickleball (5.2%) lead local participation. Traditional team sports such as baseball, football, and volleyball attract smaller shares (each ≤ 3%), suggesting that community sports participation is
Figure
(2025)
Walking for Exercise
Weight Lifting Jogging or Running Yoga Aerobics Pilates Zumba
Maple Valley Washington
driven more by individual or small group participation than large team leagues. This mirrors registration data, which shows consistent adult sports demand but with opportunities to diversify offerings toward drop-in formats.
Figure
Local Participation in Sport Activities (2025)
As illustrated in Figure 27, local participation in outdoor recreation is robust, with hiking (22.3%) and road bicycling (11.3%) standing out as leading activities both slightly above Washington averages. Other outdoor pursuits, such as backpacking, mountain biking, and skiing, maintain moderate participation levels (3% – 4%), reinforcing the area’s strong connection to regional trails and open space amenities. These findings align with community survey results, in which outdoor adventure programs (PIR = 157) ranked among the highest priorities for future program investment.
26:
Figure 27: Local Participation in Outdoor Recreation (2025)
Maple Valley Washington
City of Maple Valley, WA
Figure 28 shows that water-based recreation participation in Maple Valley closely mirrors statewide trends, with only minor variations across all activity types. Swimming (18.4%) remains one of the most common aquatic pursuits, followed by freshwater fishing (9.1%) and canoeing or kayaking (7.4%). Although participation levels are consistent with state averages, community survey findings identified water fitness and lap swimming (PIR = 172) and swim lessons (PIR = 193) among the City’s top program priorities, which indicates that—although overall aquatic participation is stable there is growing demand for structured aquatic and fitness opportunities.
As shown in Table 6, Maple Valley households spend more overall on recreation than the state average, reflecting a community that values recreation services and invests in quality experiences. Average household expenditures exceed state levels across all categories, with the largest differences in membership fees for social, recreation, or health clubs ($500.52 vs. $385.07); sports, recreation, and exercise equipment ($410.29 vs. $309.08); and fees for recreational lessons ($310.99 vs. $209.77). These spending patterns demonstrate Maple Valley’s strong commitment to an active lifestyle, which aligns with community survey findings that identified adult fitness and wellness programs (PIR = 163), water fitness and lap swimming (PIR = 172), and swim lessons (PIR = 193) among the City’s top investment priorities.
Annual household spending on bicycles ($115.43 per household) and outdoor equipment ($81.68) also exceeds statewide averages, reinforcing Maple Valley’s connection to its trail system, parks, and outdoor recreation amenities. This trend aligns with the survey’s high priority ranking for outdoor adventure activities (PIR = 157) and strong community interest in outdoor programs and special events (PIR = 139), further underscoring residents’ desire for both active and social recreation experiences.
Figure 28: Local Participation in Water-Based Recreation (2025)
Table 5: Average Recreation Expenditures (2025)
Maple Valley Washington
These spending and participation patterns underscore Maple Valley’s strong commitment to fitness, wellness, and outdoor recreation, which are key priorities identified through the statistically valid survey.
Table 6 further demonstrates total recreation expenditures for Maple Valley and Washington. The highest spending occurs in membership fees ($4.7 million), sports and recreation equipment ($3.8 million), and recreational lessons ($2.9 million), which each correspond to highpriority program areas in the community survey.
Table 6: Total Recreation Expenditures (2025)
Key Findings
The recreation assessment highlights key strengths, challenges, and opportunities across program delivery, facilities, participation, and alignment with community needs.
Program Strengths
The Department offers a comprehensive and balanced program portfolio, providing about 62% of common recreation program categories compared to the national benchmark. Most offerings are in the growth (37%) or mature (34%) life cycle stages, indicating stability and responsiveness to demand. Youth programs drive the largest share of enrollment, consistent with Maple Valley’s family-oriented community. Resident engagement is strong, with 78% of participants living within the City, and overall satisfaction remains high.
Participation Trends
Youth and adult sports represent nearly 60% of all enrollments, with fitness and dance contributing to another 22%. City-wide participation rates in fitness and outdoor recreation exceed state averages, and mapping confirms the highest engagement within Maple Valley, extending modestly into nearby South King County communities.
Operational and Facility Insights
Limited indoor space, an aging Lake Wilderness Lodge, and a lack of covered outdoor areas restrict year-round programming. Despite these constraints, facility use exceeds 5,000 hours annually, and Lake Wilderness Lodge generates over $500,000 in rental revenue. The mix of staff and contractor-led programming supports efficiency but requires coordination to maintain service consistency.
Community Alignment
Survey results and program data show strong alignment between what residents want and what the Department provides. Adult fitness, aquatics, and outdoor adventure programs rank among the community's top priorities and align with participation and spending trends, confirming that current focus areas reflect local interests.
Opportunities for Growth
Expanding facility access through partnerships, new indoor space, or covered outdoor structures would help meet growing demand in adult fitness and aquatics. Improving technology integration between registration and accounting systems, stabilizing seasonal staffing, and monitoring programs in decline will strengthen efficiency and adaptability.
These findings position the Department to build on strong community trust and participation while strategically planning for future program and facility investments that sustain Maple Valley’s high-quality of life.
BENCHMARKS APPENDIX 8
National Comparisons Include*:

Median of all agencies
Median of agencies with population of 20,000 and 49,999

*Data sourced from the 2025 NRPA Park Metrics Report
Local Comparisons Include**:
City (Population)
Burien (52,915)
Kenmore (24,346)
Mountlake Terrace (23,143)
SeaTac (32,614)
University Place (36,303)
The median of these agencies was determined for simple comparisons to Maple Valley.
**Financial and staff data was sourced from 2024 City Budgets; Park and facility information sourced from city websites
Service Level Ratios
Case Study: Town of Williston, ND

The town experienced rapid growth from the oil industry; from 2010 to 2024, the population grew from 14,000 to ~35,000
One cent sales tax funded the 250,000 sq. ft recreation center in 2014
Within 6 Months:
Sold 13,000 memberships
Daily visitation >16,000 people
Generated $340,000 in revenue daily
Source: For Better or For Worse | Feature | Parks and Recreation Magazine | NRPA
MAPS APPENDIX 9
Parks System Map
Structure Inventory Map
G Indoor Recreation Program Space
G Operations Support Building
G Museum
G Restroom
G Shelter
G Storage City Boundary
Maple Valley Historical So ciety Sto rage
e Museum
D en
Greater Maple Valley Commu nity Center
Lake Wild erness Golf Course Clu bho use
Lake Wild erness Golf Cou rse Maintenance Sh op
retum Office
Wild erness Parks Maintenance Bu ildin g
Wild erness Equipment Shed
Wild erness Too l Sh ed
Lake Wild erness Picnic Shelter #1
Lake Wild erness Beach House
Lake Wild erness Park Annex Garag e
Lake Wild erness Picnic Shelter #2
Lake Wild erness Picnic Shelter #3
Lake Wild erness Park R estro oms
Gib bon s Store Legacy Site Pavilion
Su mmit Park Restroo m/Con cessio n/ Storage/Shelter
Source: Esri, Maxar, Earthstar Geographics, and the GIS User
Elk Run F arm Pavilion
Lake Wild erness Lo dge
Lake
Lake
Lake
Lake Wilderness Area Building Inventory Map
Pedestrian Barriers to Walkable Access to Recreation

Pedes trian Barriers
Source: Esri, Maxar, Earthstar Geographics, and the GIS User
Walkable Access to Parks
Walkabili
Greater
Some
Less
Al
Maple
Go
Ki
Al
Trai
Water
Lake Wild erness Park
Lake Wild erness Golf Cou rse
Elk Run Natural Area
een to Cedar Rivers Trail King Co unty
Su mmit Park & Ball Fields
Henrys Switch Op en Space
Fernwoo d Park
Source: Esri, Maxar, Earthstar Geographics, and the GIS User
Wildlife Habitat Areas in Maple Valley


Jenkin s Creek
Habitat for Chinook salmon and steelhead salmon
Documented
Mature Uplan d Fo rests
Critical roosting and foragin g grounds for numerous bird species. Functions as an important wildlife corridor for larger mammals, in cuding elk, deer, and brown bears.
Lake Wilderness
Native Kokanee and stocked rainbow trout
Documented as a critical waterfowl conventration area
Cranmar Creek
Native Kokanee and stocked rainbow trout, Documented as a critical waterfowl conventration area.
Source: Esri, Maxar, Earthstar Geographics, and the GIS User Community, King County
CURRENT PARK MASTER PLANS
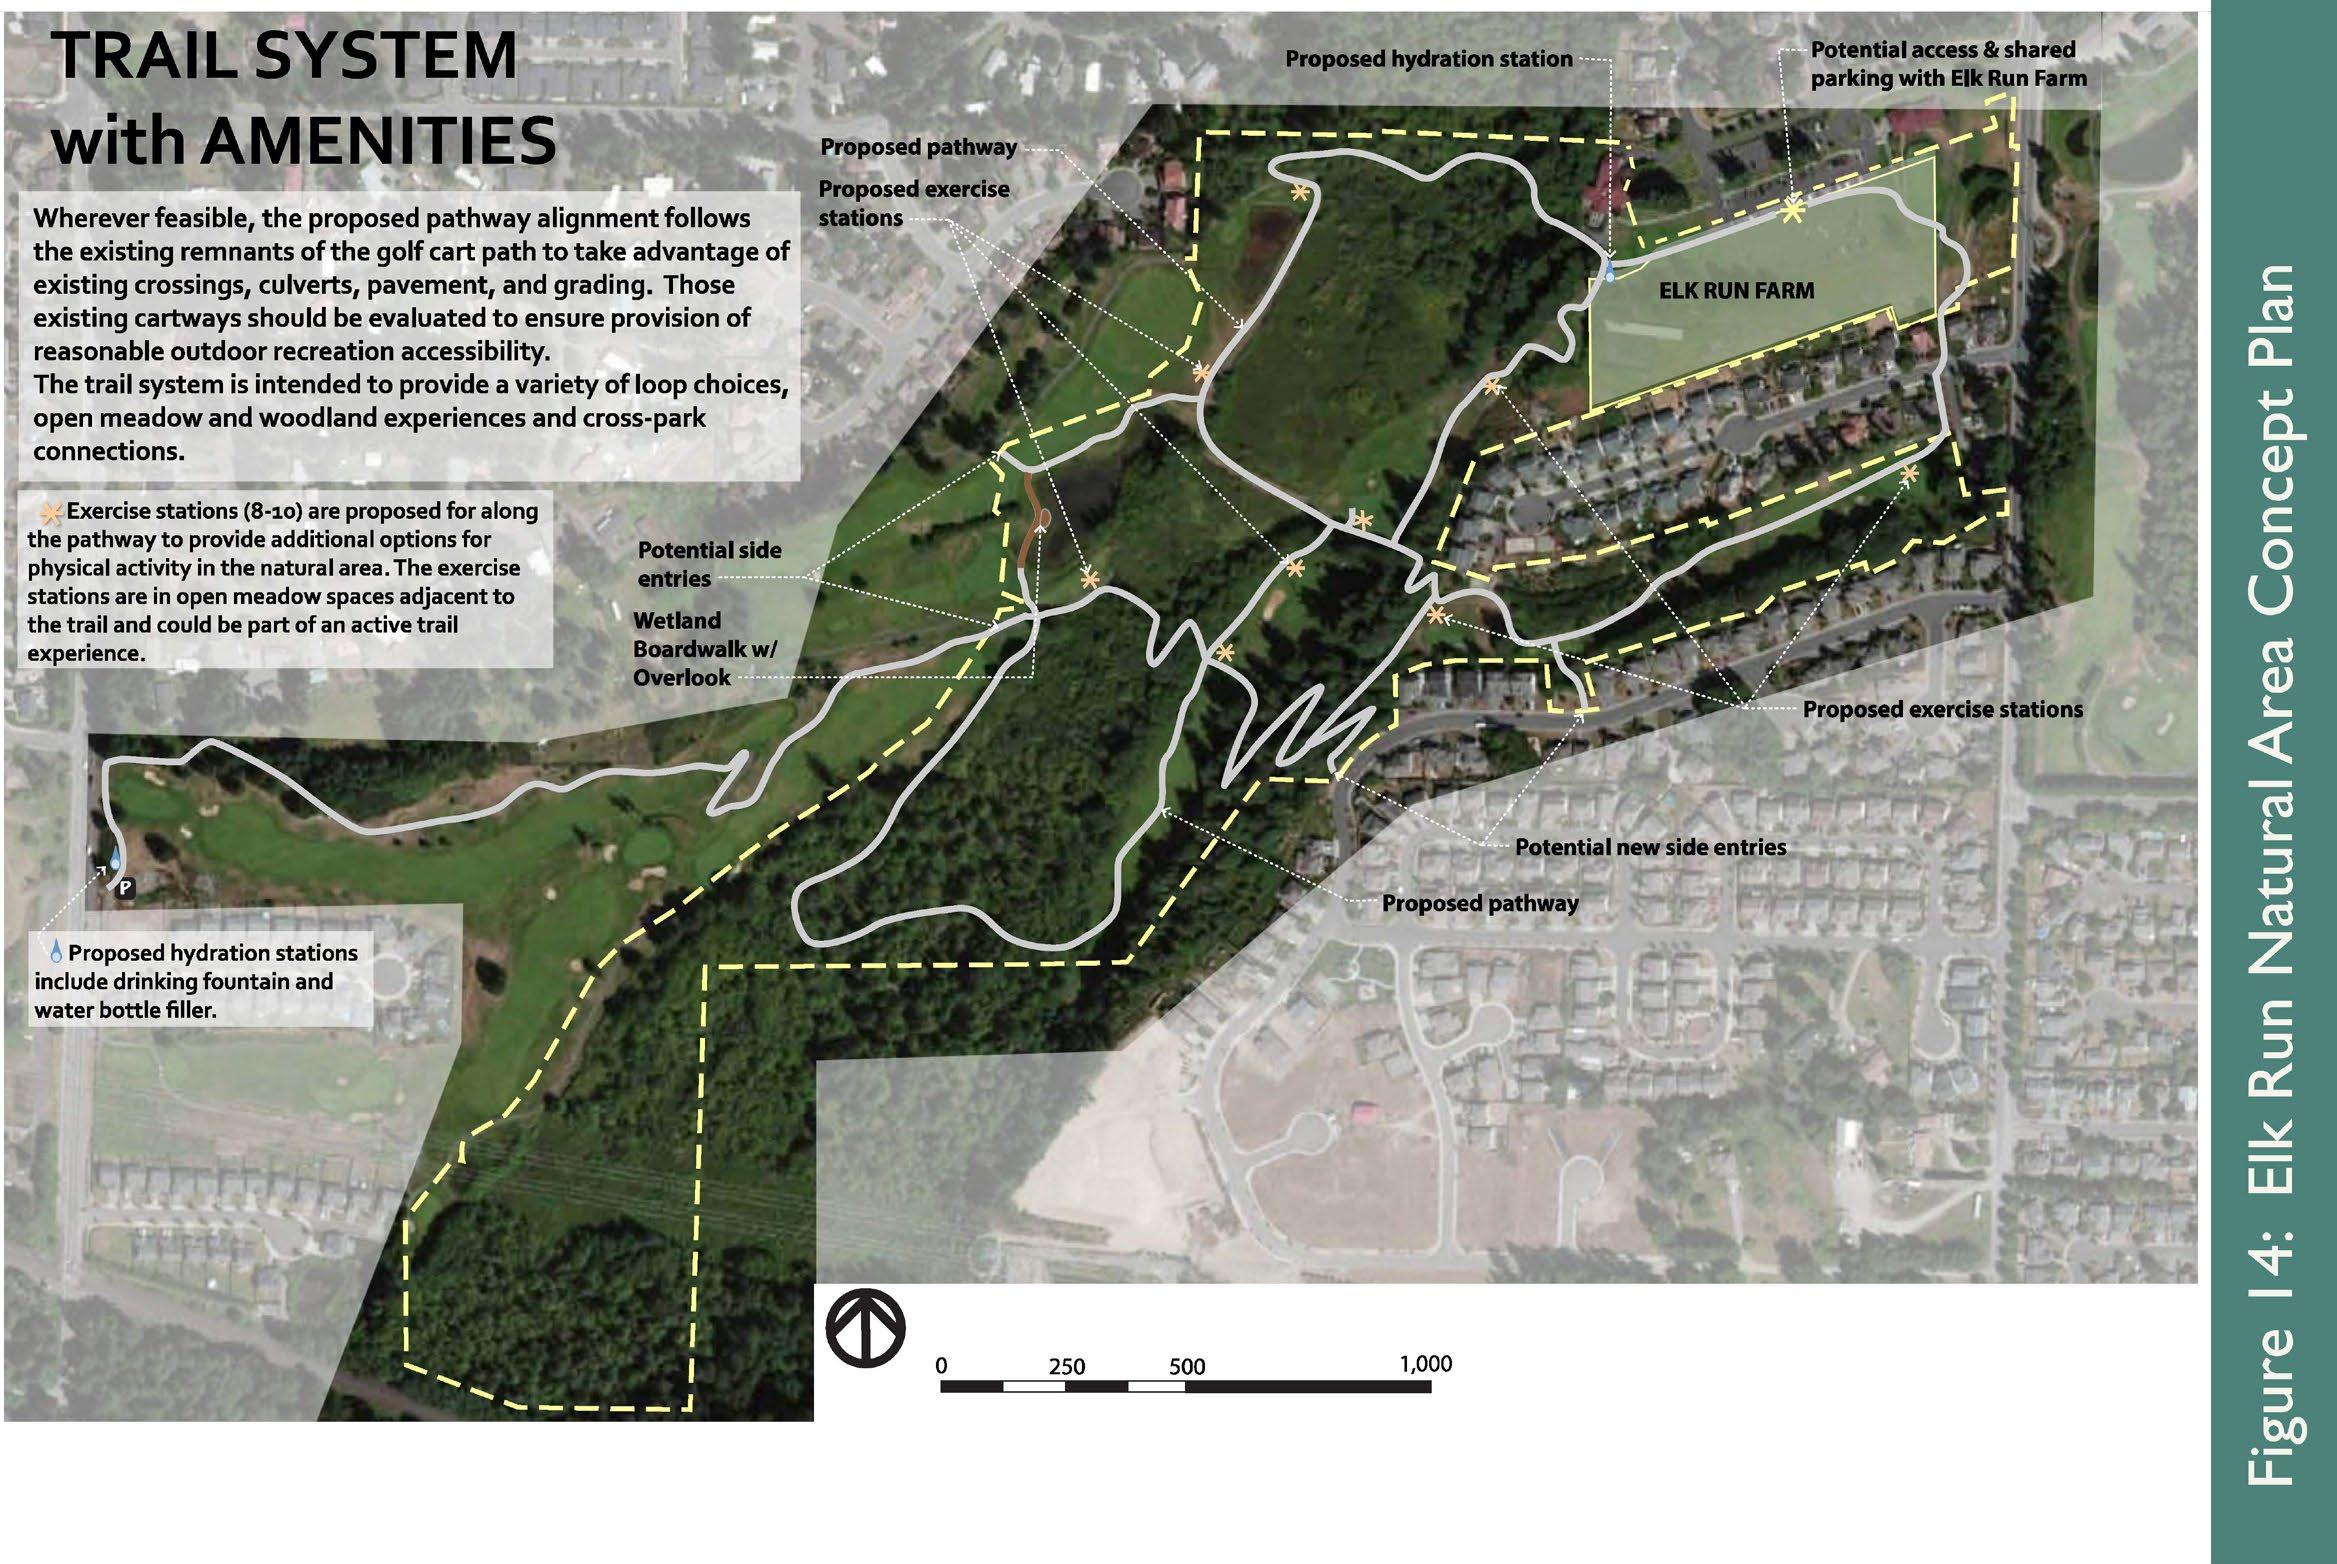
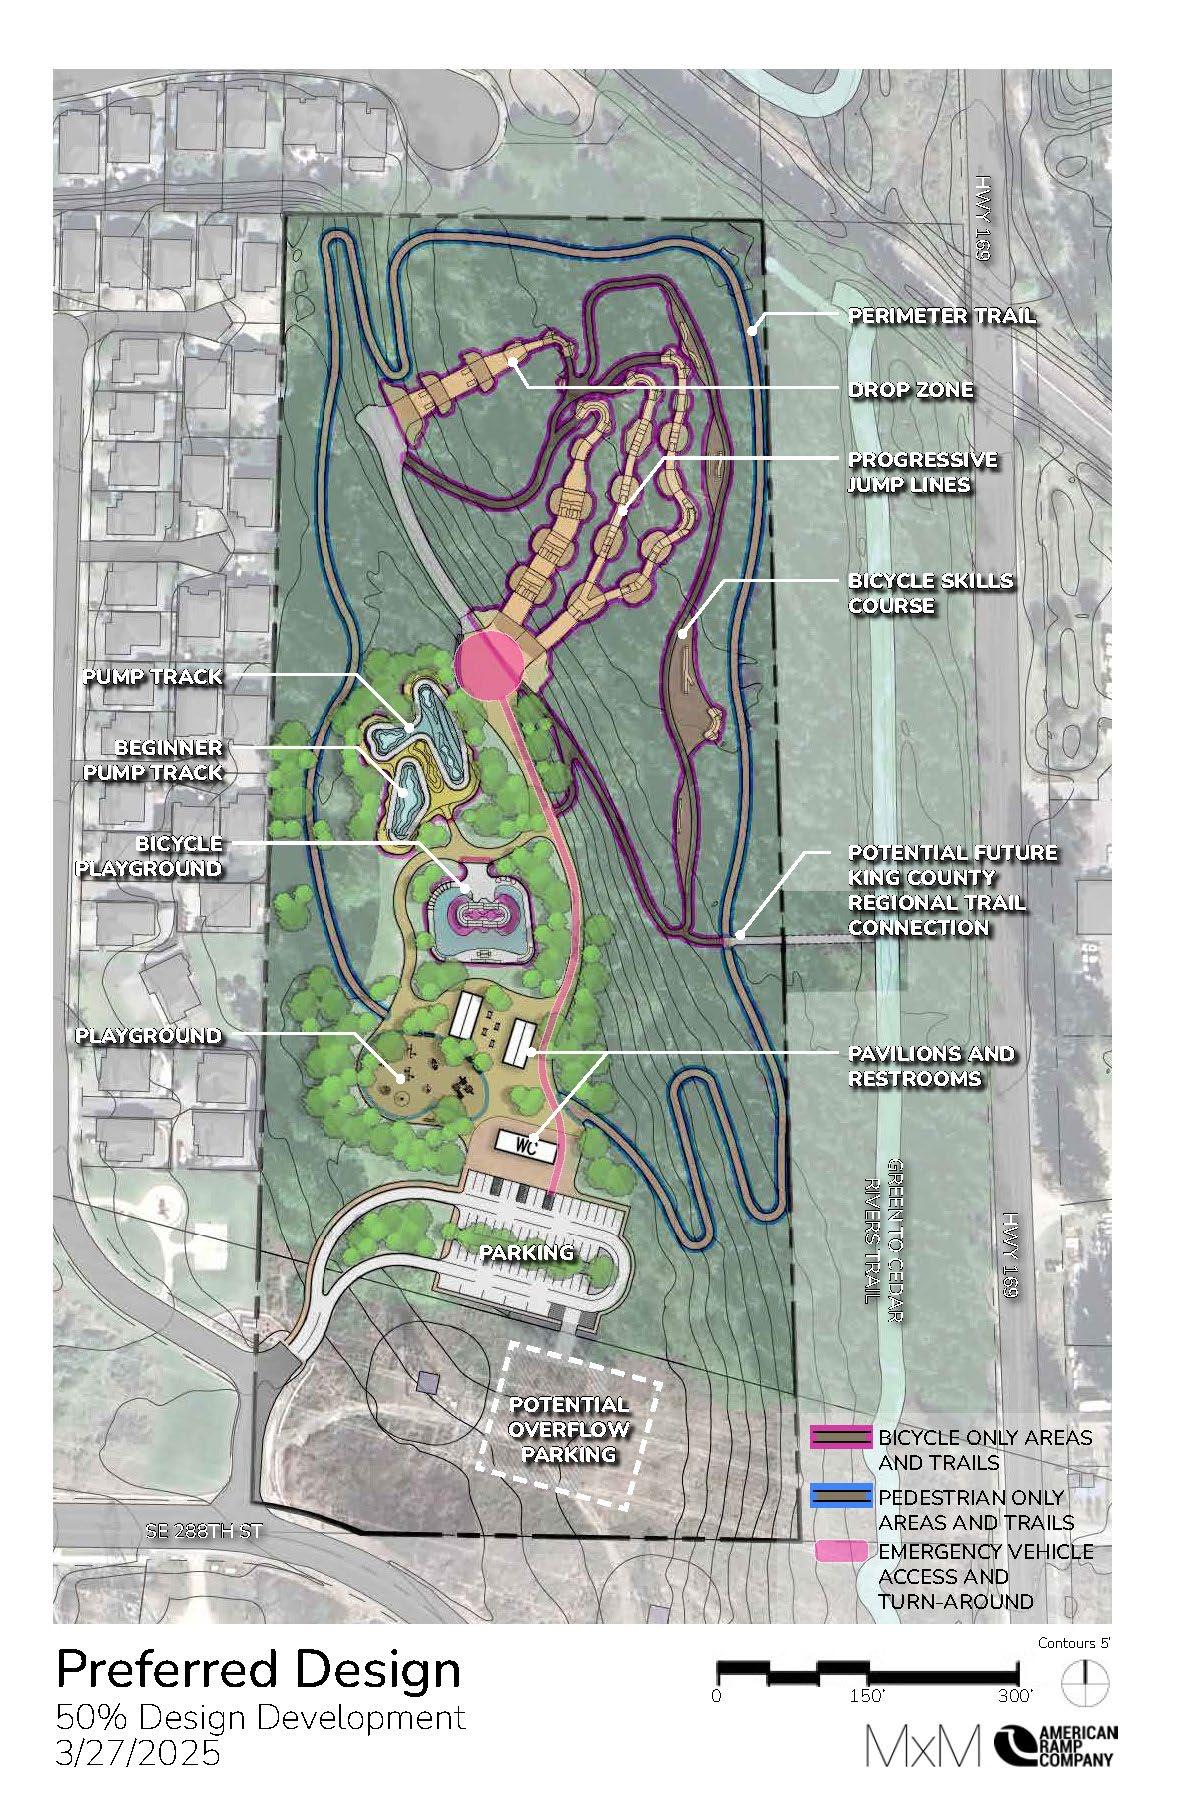
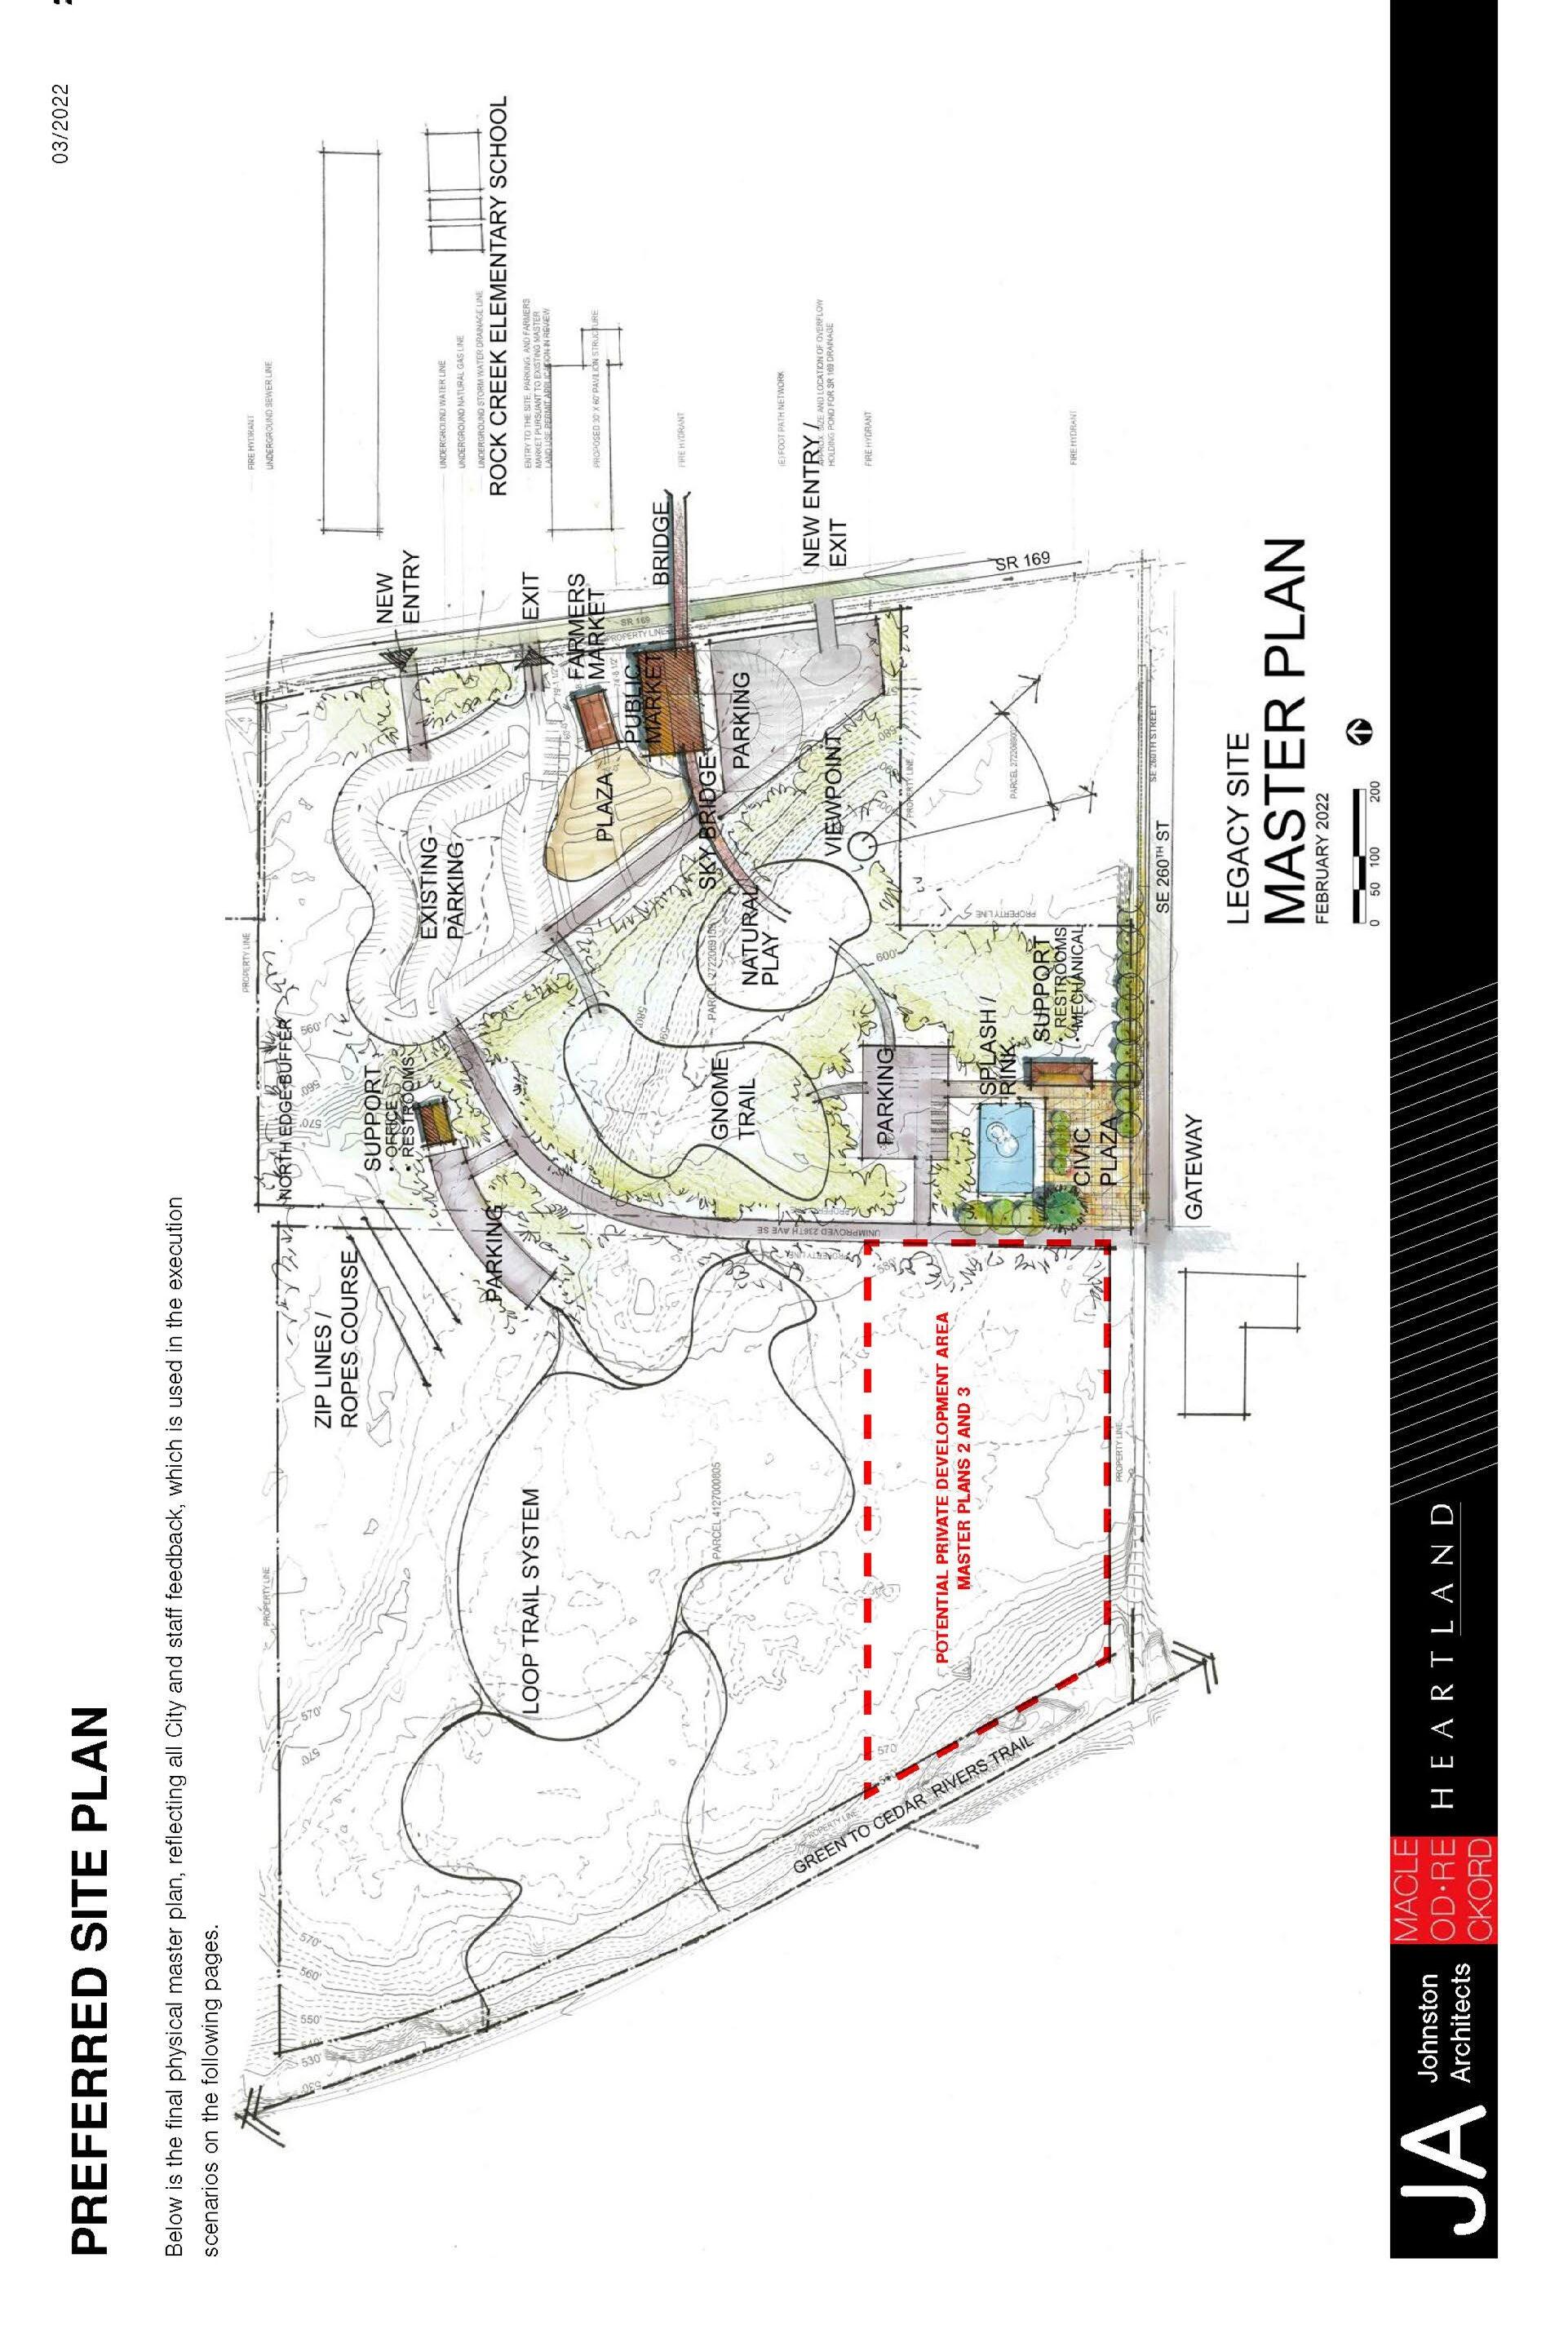

CAPITAL IMPROVEMENT PLAN
$5,000-$50,000 $50,001-$250,000
$250,001-$1,000,000
$1,000,001-$5,000,000
>$5,000,001
Note: Subject to change based upon available funding. Please refer to the budget for the most current Capital Improvement Plan.
$250,001-$1,000,000
Note: Subject to change based upon available funding. Please refer to the budget for the most current
Run Natural Area
“BerryDunn” is the brand name under which Berry, Dunn, McNeil & Parker, LLC and BDMP Assurance, LLP, independently owned entities, provide professional services in an alternative practice structure in accordance with the AICPA Code of Professional Conduct. BDMP Assurance, LLP is a licensed CPA firm that provides attest services, and Berry, Dunn, McNeil & Parker, LLC, and its subsidiary entities provide tax, advisory, and consulting services.
Berry, Dunn, McNeil & Parker, LLC leases professional and administrative staff to BDMP Assurance, LLP. These individuals work under the direct control and supervision of BDMP Assurance LLP, which is solely responsible for their performance.
The entities falling under the BerryDunn brand are independently owned and neither entity is liable for the services provided by the other entity. Our use of the terms “our Firm” and “we” and “us” and terms of similar import denote the alternative practice structure of Berry, Dunn, McNeil & Parker, LLC and BDMP Assurance, LLP.
©2026 BerryDunn | All rights reserved.
With offices and employees located in 40+ states— wherever you are based, we look forward to working together.