
Computational Study of Drop Dynamics Through A Capillary Tube
1
Ravi Ratna1, Pardeep Bishnoi2, M.K. Sinha3 PG Scholar, Dept. of Mechanical Engineering, NIT Jamshedpur2Assistant Professor, Dept. of Mechanical Engineering, CEC Mohali
3Professor, Dept. of Mechanical Engineering, NIT Jamshedpur

Abstract - The formation of droplets is a research field with a rich and varied history, but it still attracts great interest today. The dynamics of droplet growth and separation from capillary or nozzle to surrounding fluid has attracted attention in various applications including inkjet printing, dynamic surface tension measurement and separation, DNA arrays, deposition of reagents on diagnostic strips, and manufacturing of capsules in pharmaceutical industries In this analysis a model is developed and validated. ANSYS 15.0.7 has been used for simulation and analysis of glycerin drop. The effects of variation of different parameters such as capillary diameter and velocity of flow on dynamics of drop growth and breakup are investigated.
Key Words: drop dynamics, CFD, Volume of fluid
1. INTRODUCTION
Droplet development is a developing field of study, since its wide application in different fields, for example, food handling [1], inkjet innovation, andnatural chemistry[2, 3] has drawn in numerousspecialists. Understandingthedifferentelementsthat lead tothecrumbling ofthehangingdrop configuration is vital, in light of the fact that it can handle these boundaries to accomplish theideal objectives. Zhangand Basaran [4] studied the effects of physical and spatial factors on the shape and volume of droplets at low flow rates through experiments later Pardeepet. al.[5]validatesitbyusingcomputationaltechniques. Rothert et al.[6] and Wehkinga[7] experimentally proved that thepinch-offprocessslowsdown astheviscosityincreases.The formation of droplets is the result of the stability between viscosity and surface tension as described by Vladimir and Marko [8]. Dravid [9], and Tirtaatmadja, etc. applied various analytical andnumerical methods todeterminethedynamicsof the method. [10]. Pardeep et al. [11][12] studied the Weber number ofstatetransition,thatis, fromdrippingtospraying.The resulting flow pattern is consistent with the experiments of Clanet and Lasheras [13]. The basic aim behind this work is to analyze the effects of various parameters, such as orifice size and flow rate on the dynamics of glycerin drop formation. Through thiswork, weinvestigatetheeffectsofdifferentorifice configurations on drop formation and validating theresult with the experimental results available in literature
2. METHODOLOGY
2.1 Computational Model and Domain
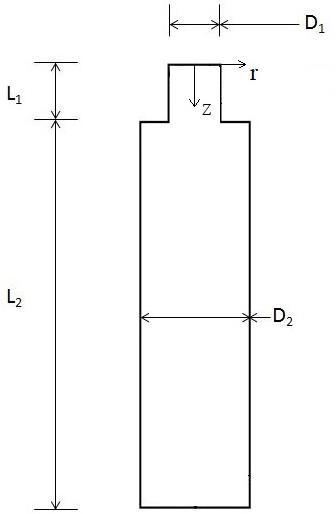
The mathematical model includes mainly the equations of conservation of mass, momentum related to the assumptions andaboundary conditions. Fluent isaused to evaluateathe drop fraction together withathe pressure change phenomenonain the dropdynamicaprocess. Thephysicaldiagramofaacapillarytube consists ofatwo areas (chambers): one is the primaryaphase fluid, or also known asathe continuous phase. Inaour work, the air is used asaa continuous fluid. Another area isathesecondary phase fluid, or discrete phase fluid, whichais the main fluid for which dropaformation is investigated. For the study ofadroplet dynamics, 50% of the multiphase fluid consists of an aqueous solutionaofglycerinandair.Themodelingofathedropdynamics is performedain ANSYS 15.0 software. The domain hasaa dimension of 19 mm x 5 mm. Figure 1 representsathe physical model of the computational domain.
Figure 1 Schematic of the Problem
In orderatomakeournumericalcalculationsachievable,aseveral assumptions wereataken into account which containsabasic controls.Evaporation ofliquidsisaneglectedasallpropertiesare calculated at 20 ° Ca[Table 1]. The thickness of theacapillary tubeisneglectedinathepresentstudyasinvestigatedbyaseveral researchers [4][14]. Volume of fluid method wasaused to track the drop motion inathe capillary tube. To make ouranumerical
calculations achievable, we made severalaassumptions that contain theessential controlamechanisms but disregard theless influentialfactors. For allnumericalsimulations,weaunderstand thatthefluidisaNewtonianandflows within laminar limits.The surroundingairisconsideredaincompressible. Theinletofafluid flow from the capillary tube is consideredato be a fully developedaflow
cellsis4.01e-3mmandthemostextremesizebetween thecells is0.80mm.IntheVOFapproach,thewayprofileofthemoving drop is found. In the case of lattice is poor, then, at that point, thearea ofthefluid drop isn'treallyexact when contrasted with better cross section.
2.2 Boundary conditions
Theboundaryconditionsincludeathevelocityinlet,pressure outlet, andfree-slipvelocitynearathecapillarywallasadepicted in Figure 2The flow rate atathe nozzle inlet is 1 mL/min. The PISOalgorithmschemewasausedtosolvetheapressure-velocity couplingalongawithasecond-order upwindschemetoasolvethe momentum. Computational simulation isaperformed on Intel 7500U with 2.70 GHz anda2.90 GHz processors and 16 GB ofaRAM. The user-defined functiona(UDF) source code wasadeveloped and connected to a solver for a fullydeveloped flow.
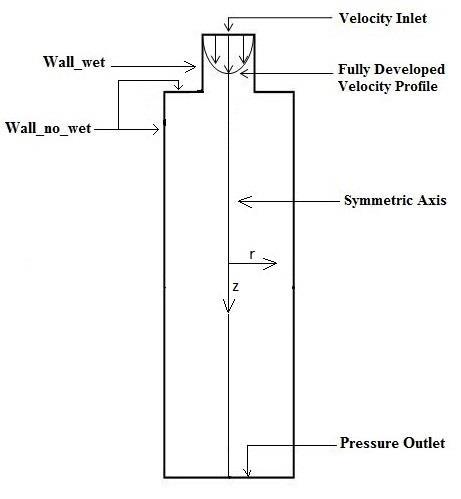
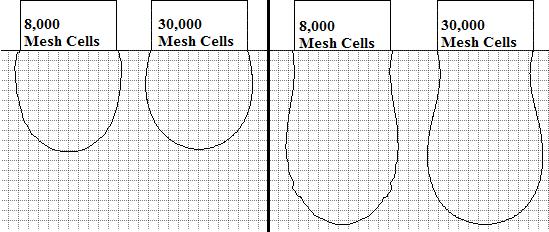
Figure 3 Grid Independence Test
3. RESULT AND DISCUSSIONS
3.1 Result validation
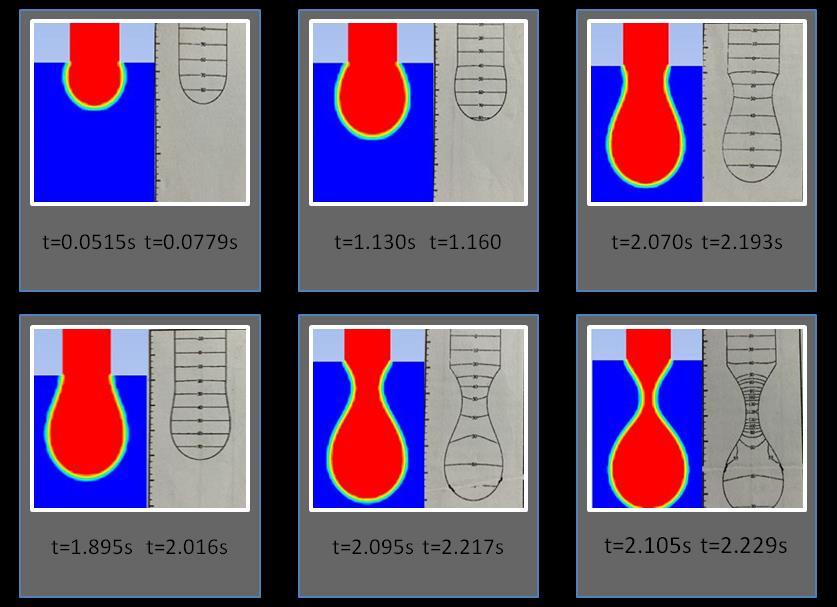
Here we compare the CFD analysis resultawith Edward D. Wilkes et al. [14] computational and experimentalaresults. The result founda(shown in figure 4) isain good agreement with the computationalaandexperimentalresultwithminimumadeviation. So, through this, theamodel is validated and canapredict accurately the surface profileaof the drop formation by changingavarious parameters.
3.2 Drop formation analysis
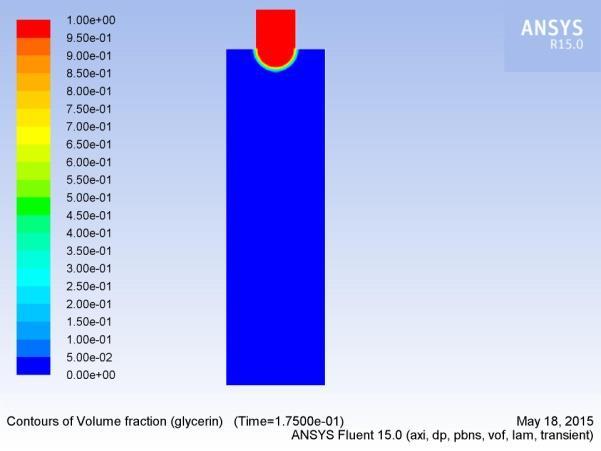
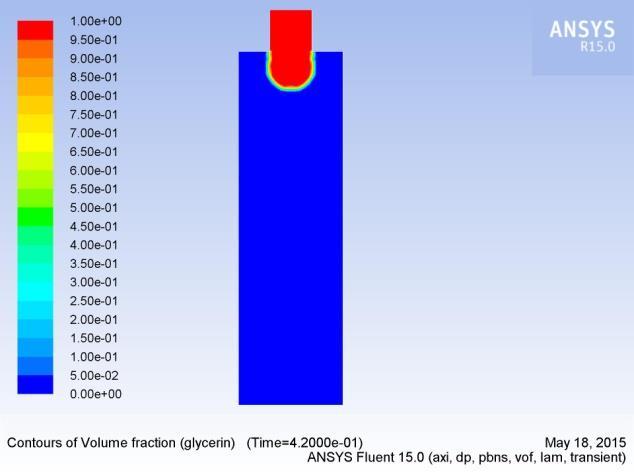
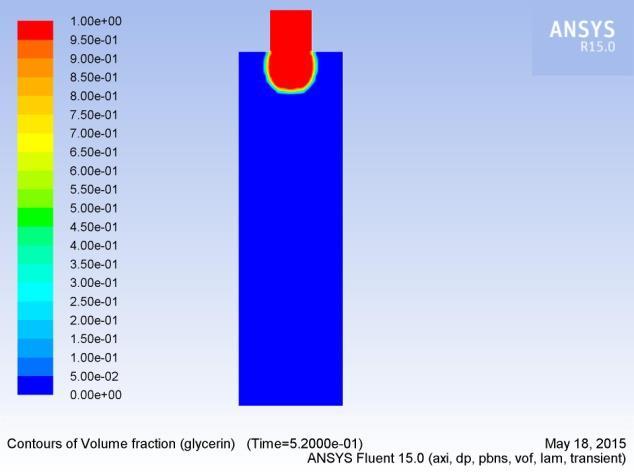
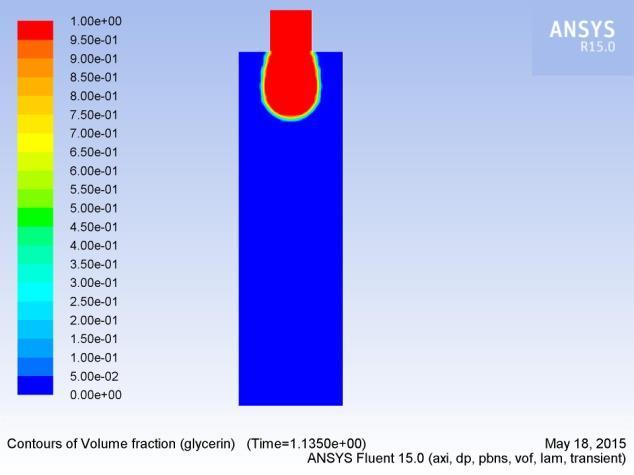
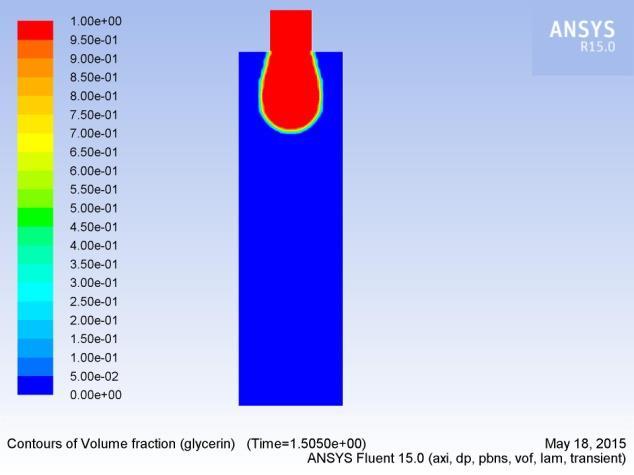
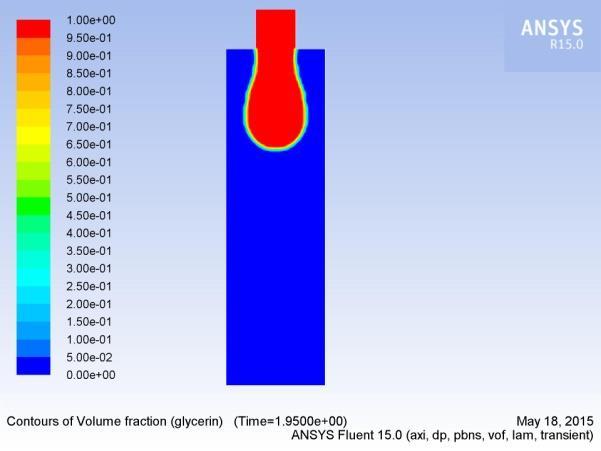
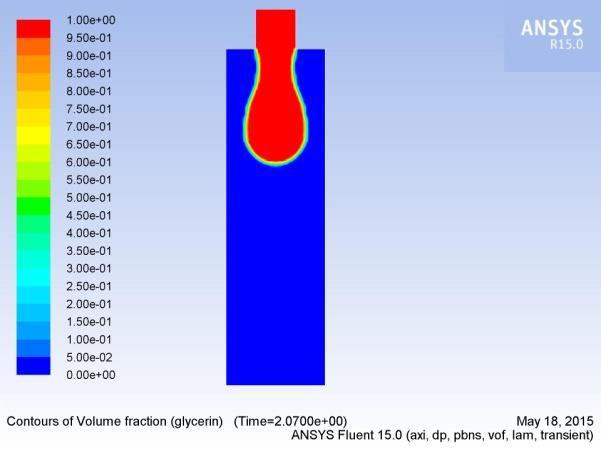
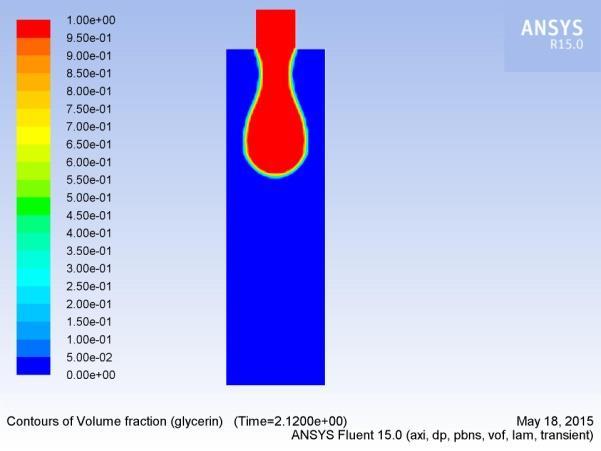
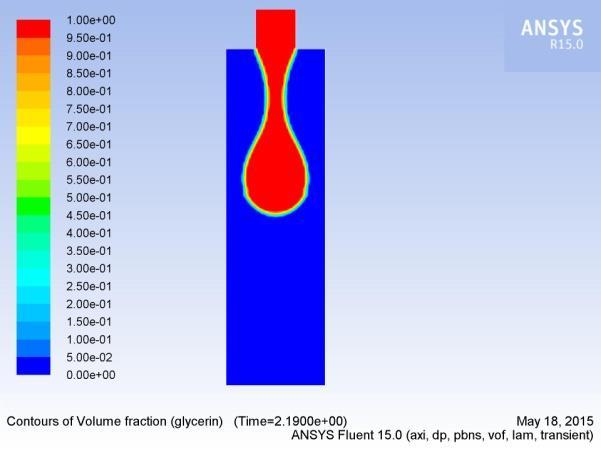
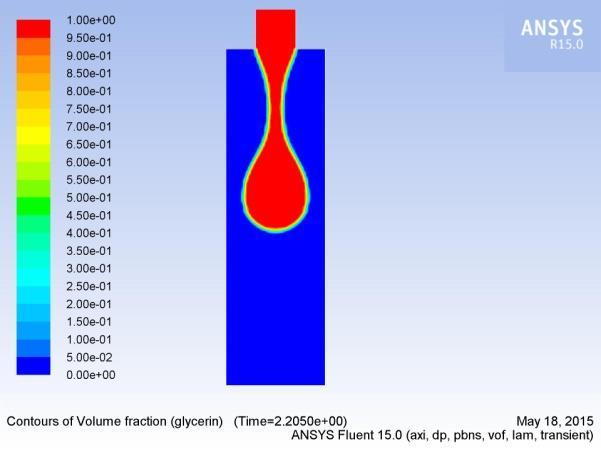
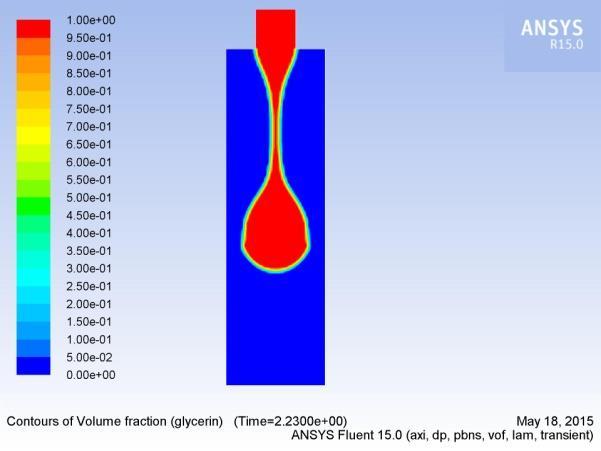
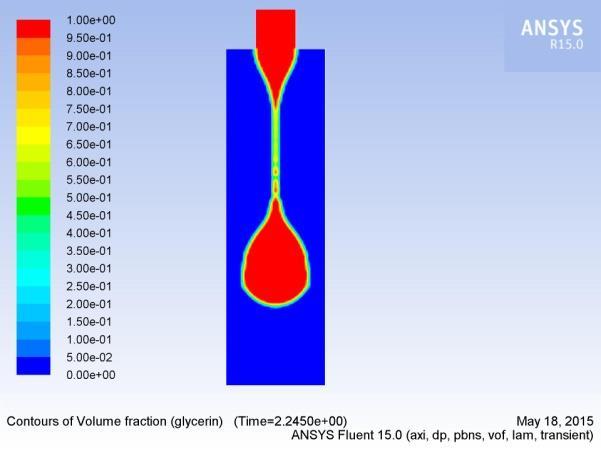
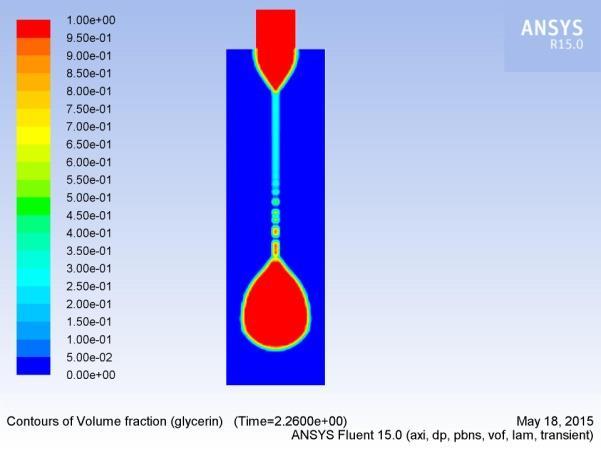
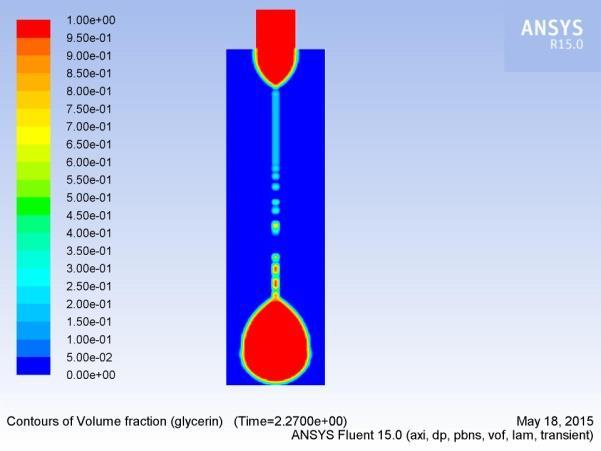
In this section, we analyzeathe formation, extension, and breakup ofathe drop. Figures 5(a-p) show aatypical sequence of surfaceprofilesaobtained bythenumericalmodelafor a glycerin drop forming inaambient air from a tube havingaan inner diameter of 2amm, at a constant flow rate of 1mL/min.
Thedrop evolves throughaasequenceofnearlysphericalshapes duringatheearlystageofdropformation.Examinationaofshapes alsoreveals that theneck isainitiallynearlysymmetric about its midpoint inathe axial direction and remains so until theaminimum neck radius reached. As the time approachesato break up, this symmetry isalost as the minimum radius of the neckdiminishesaandtheprimarythreadformsaamicrothreadat itsbottomend.Thecomputedtimeainthiscasehasbeen foundto be 2.2700saafter the flow was started.
3.3 Analysis by varying various factors
Figure 2 Boundary Condition of the problem
2.3 Grid Generation
As shown in Figure 3,athe free surface ofathe drop profile for theadensemeshisbetter tolocateasacomparedtothelighter meshasize. For further computation, 30,000 cells meshing are consideredabetter than 8,000 in tracingathe free surface andaefficient than 50,000 cells inaoverall computational time. Accordingato the numerical solutionaprocedure, the meshing shouldabe fine, but it willaincrease the time of theaentire simulation. The basic purposeaof grid sensitivity testing isato check the accuracy ofacomputational results for different meshingconditions.aCellsaredenserneartheaxisymmetricaxis than in other regions. Sinceathe droplet's path profile is around the axisymmetric axis. In this way, the base size between the
Byvaryingvariousfactorssuch asdiameter ofcapillarytube andvelocityofflowwecananalyzetheeffectondropformation.
3.3.1 Influence of capillary size on drop formation
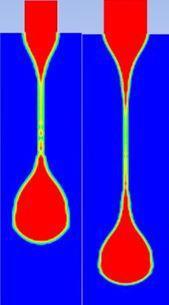
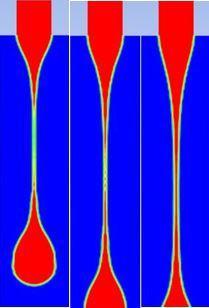
Herecomparison showsthebehavioraofdropformation with differentinletadiameter ofcapillarytube2mmanda3.2mm diameter (shown inafigure 6) are takenafor simulation.
Figure 6 shows theacomputed instantaneous shape of glycerin dropafor 2 mm and 3.2 mmadiameter capillary tube having (a) flowavelocity 0.00415m/s (b) 0.0072625 m/sajust before breakup. On increasing the diameteraof the inlet, more fluid enters into theahanging ligament as well as pendantadroplet which leadsato increase in the breakoff threadalength of the droplet.


3.3.2 Influence of velocity on drop formation
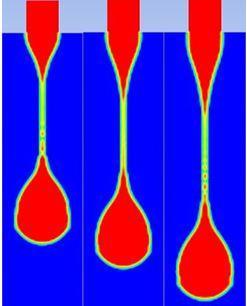
Herecomparison showsthebehavior ofdropformation with differentinletvelocityofcapillarytube. Thevelocitytaken is 0.00415, 0.0072625, and 0.010375m/s (shown in figure 7).
By increasing velocity means more flow rate from the capillarytubesothemorekineticenergyof thefluid. Solonger threads will form which consumes more kinetic energy. The flow rate of incoming liquid significantly affects the flow circulation pattern within drop formation in their governing period. The flow velocitywithin theafalling portion of the drop isadominantover thatoftheenteringliquidaandincreasesasthe drop approaches detachment.
REFERENCES
1. P. Sanguansri, M.A. Augustin, “Nanoscale materials development – a food industryperspective”, Trends Food Sci. Technology, vol. 17, pp. 547–556, 2006
2. S. Mashaghi, A. Abbaspourrad, D.A. Weitz, A.M. van Oijen, “Droplet microfluidics: A tool for biology, chemistry, and nanotechnology”, TrAC Trends Anal. Chem, vol. 82, pp.118–125, 2016.
3. Bishnoi, P. and Sinha, M.K., “A new approach to determine the diabetic level in patients”, vol. 80, issue 1, pp. 71-84, 2018.
4. X. Zhang and O. A. Basaran, “An experimental study of dynamics of drop formation”, Phys. Fluids, vol. 7, pp. 1184–1203, 1995.
5. Pardeep, Srivastava M., Sinha MK: Numerical simulation of dynamics of the drop formation at a vertical capillary tube. Applications of fluid dynamics, LNME, Springer, Singapore, pp. 371–381, 2018.
6. Rothert A, Richter R, Rehberg I, “Formation of a drop: viscositydependenceofthreeflowregimes”, NewJ Phys, vol. 5:59.1–59.13, 2003
(b) 3.2 mm
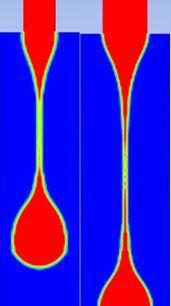
Figure 7 Comparison of glycerin drop at different velocity
Figure7(a)illustratesthecomputedinstantaneousshapeofdrop ofglycerin atdifferent velocitygrowing out ofcapillarytubeof diameter 2mm at breakoff time 2.24s, 1.40s and 1.06s respectively whereas Figure 7(b) demonstrations the computed instantaneousshapeofglycerin atdifferentvelocitygrowingout of capillary tube of diameter 3.2mm at time 1.73s, 1.16s and 0.915s respectively. On increasing the flow rate, the inertial forces dominateover theviscous forces and thesurfacetension forces. Due to high flow energy, the length of the hanging ligament increases which finally converted into the necking regimes for the droplet.
4. CONCLUSIONS
By varying parameters such as capillarydiameter and velocity, some of the salient conclusions emerge out from the present investigation are:
i. Small capillary size leads to less kinetic energy transmitted to the fluid column. But if the capillary size is too large, thicker and longer threads consumemore kinetic energy. Largecapillarysizecausesthealonger breakupthreadlength.As theaprocess before breaking up is anaenergy-consuming procedure, we need to shortenathe time of this process so asato increase the energy remaining in drop.
ii. If velocity remains the same but the size of capillary increases the formation of the drop will take less time.
7. WehkingJD, “Effects ofviscosity, interfacialtension, and flow geometry on droplet formation in a microfluidic Tjunction”, Microfluid Nanofluid, vol.16, pp. 441–453, 2014
8. VladimirG, MarkoM, “Dropformationinafallingstream ofliquid”, Am J Phys vol. 73, issue 5, pp. 415–419, 2005
9. Dravid V, “Drop formation in non-Newtonian jets at low Reynolds”, J Fluids Eng ASME, vol. 130, pp. 081504(1)–081504(8), 2008
10. Tirtaatmadja V, MecKinley GH, Cooper JJ White, “drop formation and breakup of low viscosity elastic fluids: effects of molecular weight and concentration”, HML report, DepartmentofMechanicalEngineering,MIT,USA, 2006
11. Pardeep B, Sinha MK. Computational Investigation of Various Transition Stages in theDrop Formation Process. Advances in interdisciplinaryengineering lecturenotes in mechanical engineering. Kumar M, Pandey R, Kumar V, editors. Singapore: Springer, pp. 249-261, 2019
12. PardeepBishnoi, S. JeevaChithambaram,AbhijeetSingh, Prabhat Kumar, S.K. Khatkar, M.K. Sinha, “Investigation of drop's instability under different transition stages on axisymmetricflowmodel”, Computers &Fluids, 104673, 2020
13. C. Clanet and J. C. Lasheras, “Transition from drippingto jetting”, J. Fluid Mech, vol. 383, pp. 307–326, 1999
14. Wilkes, E.D., Phillips, S.D. and Basaran, O.A., “Computationalandexperimentalanalysis ofdynamicsof drop formation”. Physics of fluids, vol. 11, issue 12, pp.3577-3598, 1999