Phased Goals and Actions


Dec. 28, 2022


Energy transition
Wind power, solar PV, system integration & energy storage, new energies (hydrogen, deep geothermal, ocean)
Industrial transition
High-tech, traditional manufacturing, construction, transportation electrification, food, agriculture and forestry, resource recycling
Lifestyle transition
Green transportation, electrified environment, residential and commercial lifestyle (behavior change)
Social transition
Just transition, public participation (social dialogue)
Foundations in Governance
Technology
R&D
Net-zero technology
Negative-emission technology
Climate Legislation
Regulations and policy
Carbon pricing and green finance
2015
The Paris Agreement requires parties to submit NDC every five years.
2021
COP26 Glasgow Climate Pact
Parties are required to submit updated NDC by the end of 2022.
2022
COP27 Sharm el-Sheikh

Implementation Plan


Parties are required to immediately scale up ambition and implementation, strengthen NDC target.
Japan Korea
Updated NDC Target
46% ~ 50% reduction in 2030 relative to 2013
(equivalent to a 41% ~ 46% reduction in 2030 relative to 2005)
Updated NDC Target


40% reduction in 2030 relative to 2018
(equivalent to a 14% reduction in 2030 relative to 2005)
Source: 1. Greenhouse gas net emission of each country is summarized from the UNFCCC website(https://unfccc.int/)
2. Korea, China and Singapore are not listed in reference 1 UNFCCC. Their net emission is summarized from the WRI website ( https://www.wri.org/)
3. Taiwan’s greenhouse gas net emission is summarized from the National Greenhouse Gas Emission Inventory released by the Environmental Protection Administration(2022 edition) (https://unfccc.saveoursky.org.tw/nir/tw_nir_2022.php)
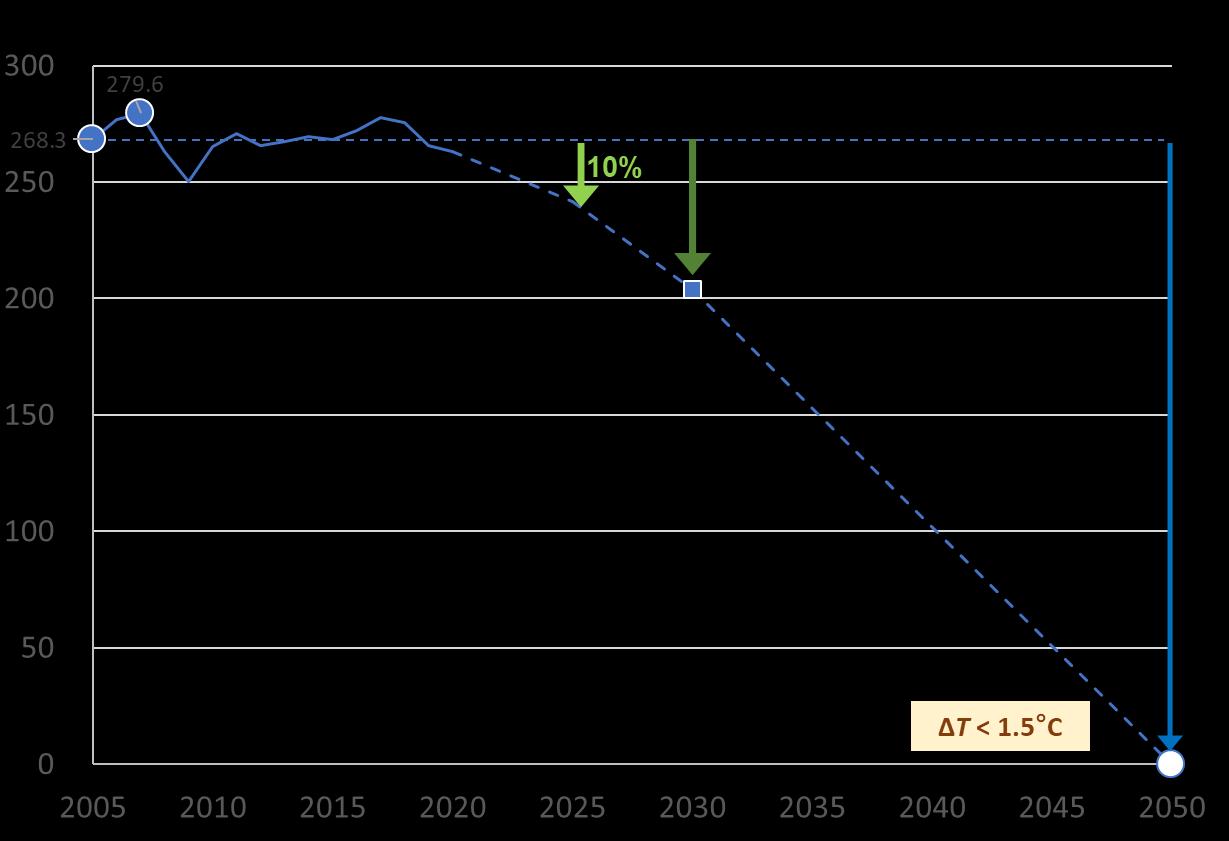
Since 2005, Taiwan’s GDP has increased by 79%, while the GHG emission intensity (CO2e/GDP) decreased by 45%.
Regulatory goals of each phase on a 5-year basic according to the GHG Reduction and Management Act
•Phase I (2020): 2% below the level of year 2005 (approved in Jan. 2018)
•Phase II (2025): 10% (approved in Sep. 2021)
Per COP26 Glasgow Climate Pact, it shall be proposed for update and review by the end of 2022.
According to law, it shall be proposed by the end of 2023.
2030 Updated NDC Key Strategies
All Renewables
Installed capacity increases from 9.6 GW in 2020 to 45.46 ~ 46.12 GW in 2030
(Offshore Wind 13.1 GW, Solar PV 31 GW)

Energy Saving
Increasing electricity saving by 34.57 TWh
Saving heat by 2,273 MLOE
Electric Vehicles
All urban buses and official vehicles are electric
New electric sedans up to 30%
New electric motor scooters up to 35%
Carbon Sinks and Negative Emissions
Natural carbon sinks (forests/soil/ocean):
1.4 MtCO2e
CCUS: 4.6 MtCO2e
International Collaboration
Responding to Article 6 of the Paris Agreement, promoting carbon reduction overseas
Integrated implementation of 12 key strategies
Expand central/local/public-private collaboration and international cooperation to increase carbon reduction efforts and cultivate negative carbon potential
2030 Updated NDC 24±1%
Equivalent to 29% of GHG emissions of 2020
New
CCUS process application
Industry: fossil fuel equipment
Buildings: household and service industry appliances
Transportation: electric vehicles
427.5 to
Equipment Electrification Forests, soil, ocean CCUS, International Cooperation - 31 ~ -39 Mt Forests, soil, ocean CCUS, International Cooperation -62.7 Mt Net Emissions: 201.2 to 206.6 MtCO2e Achieve Net-Zero target with emissions and absorption Offset by Carbon Sinks None lectricity Electricity Carbon Sinks 27~28 Mt 58~60 Mt 25~28 Mt Coal to Gas, Bioenergy Renewables 60-70% Hydrogen 9-12% Gas + CCUS 20-27% Pumped storage 1% Decarbonized Electricity 0 Mt 9
Improving in exterior designs, energy efficiency and appliance energy efficiency standards.
Changing in travel behavior, reducing demand for transportation, and electric vehicles.
Improving in energy efficiency, fuel switching, circular economy, and innovative technologies.
Scaling up renewable energy, developing new energy technologies, energy storage, and power grid upgrade.
Demonstration by 2030. At scale by 2050.
New public buildings are energy efficiency class 1 or nearly zero-emission.
All urban public buses and official cars are electric.
30% of cars sales are electric.
35% of urban public buses are electric.
35% of scooters sales are electric. The manufacturing industry gradually replaces the equipment.
15% of electricity consumption in the industry is green.
100% LED lights in commercial buildings
60% of air conditioners are operated optimized.
Electricity Others
Carbon sinks
No new coal-fired power plants
40GW of wind and solar power capacity
50% of existing buildings are upgraded to building energy efficiency class 1 or nearly zero-emission.
100% of cars sales are electric. 100% of scooters sales are electric.
Introduce low-carbon process into industrial demonstration (Ironmaking using hydrogen energy, recycle CO2 to synthesize hydrocarbon fuel)
60% of cars sold are electric
70% of scooters sold are electric.
100% of new buildings and over 85% of existing buildings are nearly zero emission.
Fully adopt low-carbon process
Installation of smart meters reaches 100%
Installation of CCUS in coal and gas-fired power plants
Renewable electricity accounts for more than 60%
Installation of smart substations reaches 100%


Laws and regulations
• Through three stages of development (demonstrative, potential and zonal) to steadily and pragmatically achieve the installation goal.
Market supports industrial development
Incentives and assistance measures
• Build independent key manufacturing capacity to accommodate the characteristics of domestic industry
• Build independent maritime engineering service capacity for the need of localization in service.
Incentives and assistance measures
• Develop new floating technologies, expand wind farms towards greater water depth area.
• Develop domestic digital OM technologies to cut down costs and stabilize power generation.
Incentives and assistance measures
• Provide GWO basic and advanced training programs to meet the demand for engineers from wind farms.
• Train professional technical talents in wind turbine operation and maintenance and marine engineering.
Exploring
developing appropriate installation location
Laws and regulations
• Inter-ministerial coordination with national land planning thinking to get a full grasp of available installation sites.
• Fishery and electricity symbiosis and areas with unfavorable conditions for agricultural first to create value from compound usage of lands.
• Develop high niche products and appropriate business models with integration of transportation facilities.
Incentives and assistance measures
• Accelerating the development of module efficiency to reduce land demand pressure.

Laws and regulations
• Integrating power generation, energy storage, smart grid for grid resilience.
• PV with energy storage system, OM and security technology to increase supply stability and reduce feeder demand.
• Prioritizing the installation of energy storage system in ground-based PV projects.
Laws and regulations
• Train inspection personnel through public association related to system to establish an OM reporting mechanism.
• High value-added reutilization of recycled module, while increasing the ratio of re-utilized modules and reducing processing costs.


Cooperating with major hydrogen energy producing countries, expanding imported hydrogen energy supply sources, and building a hydrogen energy production, transportation and storage foundation, including international supply chains, liquid hydrogen receiving stations, and transportation/storage facilities, to obtain long-term and stable supply.
Having state-owned enterprises demonstrate first, driving enterprise investment from the demand side, and establishing publicprivate cooperation
Establishing hydrogen energy mixed combustion/dedicated combustion operation and maintenance technology, completing the research, analysis and establishment of technology demonstration and verification field control specifications for the goal of hydrogen energy power generation accounting for 9% ~ 12% in 2050
*Emissions calculated by a factor of 0.502 kgCO2e/kwh; 891 MW in 2030 includes mixed hydrogen (91 MW) and mixed ammonia (800 MW).


Introduction and establishment of independent OM technology
Arranging imported material sources, developing self-produced technology, and stabilizing hydrogen sources
• Import: completion of import assessment, and gradually import as international supply and the costs are appropriate.
• Self-production: development of blue hydrogen in combination with the CCSU test plan; establishing key technologies for localized hydrogen production with demonstration sites.
Hydrogen Target


Administrative regulation for international cooperation, demonstration first, then establishment and improvement of transportation and storage facilities
• International cooperation: exchange storage and transportation models with hydrogen energy-leading countries, and assessing the demand and feasibility of domestic hydrogen transportation and storage facilities.
• Demonstration first: To meet short- and med-term application needs, first mobile hydrogen refueling station will be built in 2023.

9% ~ 12% of total electricity generation by 2050
• Introduce mixed/dedicated combustion power generation technology, complete 5% mixed combustion demonstration in 2030, and build domestic capabilities.
Parallel joining alliances and international cooperation, and existing Low-Carbon processes first
• Iron and steel manufacturing process: evaluating imported hot-briquetted iron; developing hydrogen energy iron smelting technology.
• Industrial process: low-carbonization of existing processes is preferred, and H2 reduction processes are deployed.
Forming an alliance to jointly establish hydrogen energy power modules and key technical energy
• Developing a MW-class module system, and establishing a platform for verification of vehicle components and subsystems.
• Promoting the introduction of hydrogen fuel-cell buses into routes for demonstration and verification.
Strengthening of economic incentives
The legal aspect is clearly regulated
Transparent and open resources
Technical expansion of energy
Building an applicable environment

Building a large burning system
Optimizing technology to expand capacity
Policy support clarifies the application procedures
Technology development effectively utilizes marine resources

Incentives and assistance measures
• Feed-in Tariff for small-scale power plants below 2MW
• Formulating incentives for exploration
Laws and regulations
Incentives and assistance measures
Laws and regulations
Laws and regulations
• Amendment of the Renewable Energy Development Act for exploration and development
Legal Resourc e
Incentives and assistance measures
• Investment in national resource surveys and expanding geothermal exploration
• Encouraging private companies and sharing risks

• Disclosing geothermal exploration data
Incentives and assistance measures
• Expanding drilling ability and accelerating geothermal capacity
• International cooperation to deploy geothermal technology
• Administrative regulation for international cooperation, demonstration first, then establishment and improvement of transportation and storage facilities
• Inventory of shore-based seawall locations and excellent marine energy fields
• Evaluating the ocean resource (such as offshore wind power, fish farms) and expanding the utilization of sea
• Introducing/developing generator sets adapting to Taiwan
• FIT and demonstration incentives for biomass/waste-to-power market
• In 2025, SRF power plants, agricultural waste, and biogas power generations
• Promoting the transformation of coal-fired units
Incentives and assistance measures
• Establish/introducing (coal to Biomass)-fired unit into system
• Laying out overseas biomass sources (pellet biomass)
Incentives and assistance measures
• Developing high-efficiency conversion technologies (thermochemical gasification, biological anaerobic biogas)
• Effective use of by-products (ash, biogas slurry/residue, etc.) to improve the economic benefits of biomass energy use
RE Forecast Accuracy
Storage System
Demand Response Program
AMI Smart Meter
Auto-Feeder Accidents Downstream within 5 Mins.
Increasing the grid-connected capacity of renewable energy
Increasing the grid-connected capacity of renewable energy: Increasing the capacity of offshore wind and solar PV grid-connected devices.
Expanding the transmission capacity of ultra-high voltage (UHV) transmission lines.
Activating ancillary service demand
Preparing ancillary service capacity precisely
Deploying ancillary service energy effectively

Reduce blackout loss
Reduce OM costs
Auto-Feeder Accidents
Downstream within 5 Mins up to 90%
Expand Resources
Replacing manpower with automated monitoring to improve Taipower's ability to detect abnormalities in power supply lines
Expanding the market and promoting storage/EV investment
5,500MW energy storage battery target in 2030
Laws and Regulations
Incentives and Assistance Measures
Promote grid IC integration
The increase of single purchases of smart meters, bid willingness, speed up the deployment of AMI and maintain the quality of smart electric meters
Automatic switch in localization policy
Refine Regional Scheduling
The ADMS stipulates the establishment of a local maintenance team during the bidding, improving the construction cooperation and maintenance time efficiency, and promoting the investment of domestic industry
Laws and Regulations
Formulate/revise national standards of smart grids

Introducing high proportion RE with supply balance and system resilience
Renewable Energy Enhanced Grid Project
Reduce transmission problems between regional grids
Following the Electricity Act to ensure electricity safety Introduce power quality control equipment to strengthen power system stability
Laws and Regulations
Update/Improve responsiveness of traditional plants
Application of energy storage system
Install compliant storage system based on user’s equipments, and contract qualified electrical company for the installation to ensure safety
Mastering renewables generation
Revise the RE regulations for better reporting realtime operation data and improve support and assistance for the system's frequency and voltage control
Refine Demand Response Management Measures
Expand electricity market
Revise relevant regulations such as "Rules for Setting Up Power Trading Platforms,” "Management Measures for Standby Power Supply Capacity,” and "Outline of Power Dispatching Principles"
• Save 12.73 billion kWh of electricity
• Save 0.628 million KOE of fuel
•
•
Industrial Equipment improvements, guidance with energy-saving targets, efficiency standards
Commercial Equipment/behavioral improvements, low-carbon transition, green-buildings
Residential Increased efficiency of buildings and electronics, advocacy and engagement

Transportation Expand and enhance the scope of efficiency standards, behavioral change
Technology
Innovation, energy efficiency, system integration
Governance
Subsidies
• Introduce educational and relevant capacities, train certified experts
Regulations
• Expand regulated scopes, promote local governance and private capacities

Best practice
Subsidies
• Encourage better efficiency in manufacturing, promote process improvements and guidance
Corporate responsibilities
Regulations
• Enhanced corporate targets, efficiency increase in the public sector
Smart system & innovation
Subsidies
Knowledge spillover
Subsidies
• Advocacy and promotion, visualization of electricity usage, subsidies

Building energy efficiency standards
Subsidies
• Promote green-building, subsidize efficiency improvements
Regulations
• Establish assessment and labelling mechanism, enhanced energy-saving design regulations
Goal
Maximize efficiency
Propose 7 strategies in 5 sectors including industrial, commercial, residential, transportation and technology
Vehicle efficiency
Subsidies
• Replace old vehicles, promote introduction of high-efficiency vehicles
Regulations
• World-aligned efficiency standards, management of public transport system, enhanced fuel efficiency
• Promote smart energy managements, R&D in innovative technologies

Target 2030 CCUS target: 1.76 - 4.60 million tons
● Increase CCUS capacities
● New technology with improved efficiency
● Lower cost for implementation
● Establish guidelines
● promulgate regulations

● Introduce subsidies
● Local CCUS database

● Establish research teams
● Assess CCUS potentials
● Establish techniques for exploration & monitoring
● At least 4 demonstration sites
● Engage > 9 companies with

> NT$2 billion
R&D investments
Two CCS demonstration verification projects by 2025
Just
● Policy package for just transition
● Establish platform or engagement
● Promote transparency
● Develop immature concepts and prototypes before 2030 to reach 2050 net-zero goal

● Enhance research capacities
R&D NSTC, Academia Sinica
● Develop low-cost CCUS technologies
● Promote CO2 utilization techniques
● Establish demonstration sites
● Experience sharing and scale-up best-practice

● Integrated assessment of net-zero pathways
● CCUS regulation on frameworks, methodologies and verification

● Connect with international entities, enhance R&D and training capacity
● Technical collaboration on potential demonstration sites
International Collaboration
NSTC, MOEA, EPA, Academia Sinica
National Development Council


(in collaboration with other ministries)
Electric buses
Rate of adoption
Official vehicles
Rate of adoption
% of new sales Electric sedans
% of new sales Electric motor scooters


1 Electrification
11,700 urban buses, 100% electrification for official vehicles
2 Infrastructure
Subsidize 0.5 million motor scooters, 500 electric taxies
Establish 400 charging areas, 6,365 slow charging stations, 802 fast charging stations

Re-training of professional skills, including 5,760 mechanics, 960 inspectors

Subsidies on the transition of 16,000 motorcycle shops
Promote local OEMS to invest in two new freight models
Encourage new companies to establish at least 2% charging stations in self-owned car parks
Domestic electric cars to reach 15% of new vehicle sales
Subsidies
• Encourage market demand
✔ Subsidize replacements for electric bus & taxi
✔ Subsidize electric motor scooters purchase
✔ Subsidize electric motor scooters for deliveries and postal services
✔ Subsidize R&D of electric freight vehicles
✔ Promote hydrogen vehicles, demonstration sites
✔ Subsidize electric passenger ships & airport vehicles
• Introduce tax incentives and loan packages
• Accelerate expansion of charging networks
✔ Establish charging stations in highway service areas, transport hubs, tourist sites.
✔ Promote charging stations in gas stations, industrial and science parks, exhibition centers, commercial and relevant sites
• Set dedicated rates for electric cars, establish single window for grid application, promote smart charging demonstration sites
Regulations
• Specification and building-related regulations
✔ Mandatory proportion of charging space for public carparks
✔ Revise building codes to include charging stations
Regulations
• Propose import standards, encourage market penetration of electric vehicles
• Enforce emission standards and improve transparencies to encourage low-emission transport
• Research and upgrade key technologies such as vehicle subsystem, smart charging, OEM capacities
• Promote local OEMs, expected sale by 2024
• Provide assistance & guidance on transition for mechanics, inspectors, motorcycle shops


3 Major Goals, 4 Strategies to be Promoted, 10 Key Items, 37 Measures to be Promoted, 71 Actions
Priority Strategies
■ Green design: Reduce the use of raw materials, promote circular procurement, and extend product life cycle.
■ Resource reutilization: Promote the conversion of waste into materials, energy and fertilizers.
■ Circulation network: Establish a regional circulation network or a virtual industrial park.
■ Technological and institutional innovation: Promote resource recycling and carbon reduction technology, combination with digital technology, and legal and institutional innovation.
Assistance and Incentives
■ Support small and medium-sized enterprises to establish a circular business model, and promote excellent resource recycling cases.
■ Assist companies that dealing with waste removal, treatment and reuse, and introduce carbon reduction processes or technologies.
■ Provide care and guidance services for self-employed recyclers.
Adding 10 Mt CO2e from carbon sinks annually by 2040

● Develop the measurement methodology of ocean and wetlands

● Develop the complex fish farming business models
● Increase ocean carbon sinks management measures and promote restoration of aquatic plants

● Increase forest coverage
● Enhance forest management
● Enlarge the utilization of timber products


● Strengthen soil management

● Develop carbon negative cultivation mode


For setting the foundation of carbon sinks, continue scientific and technological research and development on the three major paths of carbon sinks - soil, forests and ocean - before 2050.

Complete the inventory report of national greenhouse gas emissions
Develop innovative technology to increase carbon sinks
Promote the management of conservation
Methodology and incentive mechanism for establishing carbon rights conversion
Goal in 2024
Carbon sinks to increase by 10 Mt CO2e
Protect the rights of residents and all people as wetland, ocean and forest resources are protected.
Increase carbon sink benefits with multiple models:
Set up sharing mechanisms by introducing multi-sources, such as incentives and rewards, carbon rights mechanism, and agricultural ESG.
"Public Awareness of Green Living" is quantified with a yes/no question (such as “know/ don't know") to calculate the percentage of awareness.


75 points
80 points
"People's Green Behavior" is quantified with a 5-point scale ("always, often, sometimes, rarely, never") to calculate the target score.
Lifestyle education: Raise awareness of green living


Infrastructure: Build a green and friendly environment
Business model: Drive the green industry
Green products and services: Encourage green consumption

Behavioral change: Enhance green lifestyle and literacy
Green Lifestyle 10

Zero Waste and Low-carbon Diet
• Tableware sharing, green dining, local buying and selling, safe eating.
Environmentfriendly Fashion
• Environmentally friendly materials, energy-saving clothing, carbon labels.
• Passive energy-saving buildings, energy-saving equipment, carbon storage building materials, promotion of green labels.
• Common goals, responsibilities, and actions, information disclosure, education for all.
• Expand green products, prolong service life, recycle parts and components, replace purchase with service.
Implement green living from 2023 to calculate the carbon reduction benefits of life transition scenario, and set a net-zero pathway and goals.
• Public transportation, perfect walking and cycling environment, private vehicle management, and car sharing.
Provide subsidies and aid for organic farming, enhance citizen participation and green action.
Develop relevant guidelines to enhance public awareness and behavioral change.


• Encourage financial services firms to act on their own initiatives to respond to climate issues
• Promote responsible governance, investment and lending operations, and financial instruments to drive companies


targets
•
Disclose GHG emissions & promote value-chains reduction
Encourage financial services firms to conduct GHG inventory, ascertain GHG emissions status from their clients, and promote financial instruments and responsible governance to support corporations’ net-zero transition
Promote listed companies to conduct GHG inventory and assist them in setting reduction targets in response to making net-zero transition
Integrate information and data to enhance climate resilience
Construct and integrate an ESG info platform for individual financial services firms to assess climate-related risks and determine strategies and a risk management control scheme

Promote information value-added and field-crossing linkage applications of financial markets risks assessment and potential improvement aspects for enhancing climate resilience
Consolidate stakeholders’ consensus and seek to leverage a cooperative mechanism
Establish a cooperative platform of financial services firms based on their fund management capabilities and experiences to enhance corporations’ sustainable development in Taiwan
Promote a cross-ministerial level cooperation mechanism to accomplish a recommended national sustainable economy activity guidelines to support corporations’ net-zero transition

Ensure labor employment rights during a net-zero transition


Offer cross-ministerial efforts on re-training and hiringmatching to defuse possible unemployment impacts due to industrial structural change for laboring issues during a net-zero transition
Avoid increasing the burden of public living costs
Establish a benefit-sharing mechanism with cross-ministerial cooperation to put people at an advantage when making a green transition
Encourage meaningful public-private dialogues and cooperation opportunities

Expand the private sector’s engagement to ensure policy planning and assessment with the inclusion of multi-stakeholder opinions

Assist domestic industries in making a transition with low-carbon manufacturing processes
Conduct an industrial manufacturing shift with cross-ministerial cooperation to actively assist SMEs in building better capacity for GHG reduction
Protect the diversity of local groups and regional development
Balance rights to local groups and sustainability of the environment and ecology when promoting a net-zero transition
Effectively reduce potential resistance during a just transition process
Ease potential resentful responses from impacted employees, and encourage the general public to come to support the net-zero transition
Ensure a just policy-making process with civic engagement
The Taskforce consists of the main responsive ministry for 12 key strategies, the Ministry of Labor, and the Council of Indigenous Peoples
When developing net-zero transition strategies, identify impacted issues from labor, industrial, regional, and living aspects simultaneously to plot a Taiwan Just Transition Picture with response strategies
Convene the Taskforce meetings regularly to progress control, coordinate, and rolling adjust on just transition measures when implementing 12 key strategies
The Committee is convened by the Minister of National Development Council and consists of representatives from governmental agencies and civil society
Focusing discussions on labor, industrial, regional, living, and governance topics
Propose improvement recommendations for governmental just transition projects and measures

Organize Just Transition consultation meetings to gather experts’ opinions for policy planning references
Organize discussion forums and public hearings with involvement from central agencies, local governments, and social groups to gather opinions from all stakeholders


• Renewable energy
• Hydrogen power generation
Sustainable Energy
Low Carbon (mitigation)
• Grid resilience and system integration
• Energy storage
• Others
Introduce technology into society.
Promote a new net-zero lifestyle with the private sector.
• Industrial sector
• Green transport
• Residential and commercial sector
• Green construction project
Link technology research and development with local practice.
Circularity

• Carbon capture utilization and storage
• Natural carbon sink
Promote the development of the whole life cycle of the industry.

• Industrial and civil waste recycling
• Water recycling
• Biomass cycle
• Green lifestyle (Low Carbon Life)
• Net-zero strategy
• Green finance
• Just transition
• Benefit evaluation
Invest in technologies with high carbon reduction potential.
Explore breakthrough innovation research and development.


Collaborate with global benchmarking institutions.
Master key international leading technologies.
Amending the Greenhouse Gas Reduction and Management Act

Amending the Renewable Energy Development Act and the Energy Administration Act
Managing system for carbon capture and storage, Green Finance, and regulations for the construction sector
On April 21, 2022, the cabinet meeting of the Executive Yuan passed the amendment and sent it to the Legislative Yuan for review;
On May 11-12, joint review by 6 committees, including Social Welfare and Environmental Hygiene Committee of the Legislative Yuan was completed; on December 9 and 16, the Legislative Yuan conducted consultation among political parties
The national long-term goal is revised to 2050 net zero emissions
Coordination and integration by the National Council for Sustainable Development
Accelerate carbon reduction and enhance industrial competitiveness
Capacity building, scientific reports and risk assessment
Public participation to build power of climate action
Classification for management
Enhance verification capacity

Energy efficiency standard
Process for production

Manufacture or import vehicles
New buildings

For announced products, manufacturers, importers or sellers should obtain carbon footprint verification within a specified period and display it on the container or package

Encourage voluntary reduction and issue reduction credit

Establish a supply and demand mechanism to promote credit trading
For newly built or modified facilities up to a certain scale, the GHGs increments should be offset by a certain percentage
Use economic instruments to promote carbon reduction
Raise incentive by levy and expenditure
Amending the guidance and building capacity for carbon quantification and reporting, and verification, to respond to companies’ needs, and the EU CBAM, which will begin to operate from 1 October 2023 onward, with simplified rules initially, requiring sectors including iron and steel, cement, fertilizer, aluminum, electricity and hydrogen to fulfill the reporting obligations.
Collaborating with Ministry of Economic Affairs in 118 training sessions on carbon quantification and foot-printing and 48 advocacy activities about net-zero emissions and carbon quantification for industry associations.
Collaborating with Chinese National Federation for Industries on 3 5-day carbon quantification and reporting workshops.
Regulated entities: 287 (1st batch) + 250 (2nd batch)
Voluntary participants
Carbon Disclosure Project (CDP) / Dow Jones Sustainability Indexes (DJSI): hundreds of Taiwan’s companies invited to participate in 2021
Interested SMEs are welcomed to try online trial calculator

Paid-in Capital >NT$10 bn + Iron + Cement
Assurance acquired by 2024 (~0.1k companies)
Paid-in Capital NT$5~10 bn
Establishing 4 certification bodies and organizing GHG verifier training courses. Non-mandatory


Assurance acquired by 2027 (~0.1k companies)
Paid-in Capital <NT$5 bn
Assurance acquired by 2028 (~1.4k companies)
Non-mandatory
Stakeholders in supply chain


Greenhouse Gas Reduction and Management Act
Proposed to be renamed ‘Climate Change Response Act Act’; currently under legislative review
Renewable Energy Development Act
Parking Facility Act (amended on 30 Nov. 2022)
Energy Administration Act
Environmental Protection Administration

Ministry of Economic Affairs
Condominium Administration Act
Building Administration Division
Commodity Tax Act *
Sewerage Law
Ministry of Transportation and Communications
Ministry of the Interior
The Forestry Act
Ministry of Finance
Council of Agriculture
* In accordance with regulations in force, from 15 June 2021 to 14 June 2023, the commodity tax on electrical appliances which are classified as 1st - or 2nd grade of the energy-efficient levels approved by the Ministry of Economic Affairs shall be reduced. After the tax incentive is expired, the Ministry of Finance will coordinate with the policy authority and decide whether the provision will be extended according to the authority’s overall review of its necessity, validity and feasibility.
Some 50 key strategic social communication and symposium activities have been held
Relevant information is published on the Environmental Protection Administration's "Climate Citizen Dialogue Platform" (climatetalks.tw)
Wind /Solar
PV
Resource Recycling & Zero Waste
Energy Saving & Efficiency
10/27
11/18 11/22
Innovative Energy
Hydrogen Power Systems & Energy Storage
12/28
11/28 12/17
42
• Net-zero transition related budget: NT$44.5 billion

• The fourth phase of Forward-Looking Infrastructure Plan: NT$4.8 billion
• Operating and non-operating special foundation: NT$18.9 billion
Renewables and hydrogen: NT$210.7 billion
Grid and energy storage: NT$207.8 billion


Low carbon and negative carbon technology: NT$41.5 billion

Energy saving and boiler replacement: NT$128 billion
Existing Plans: NT$120 billion
Electrification of transport vehicles: NT$168.3 billion
Resource circulation: NT$21.7 billion
New Plans: NT$320 billion
Forest carbon sinks: NT$84.7 billion
State-run: NT$440 billion
Net-zero living: NT$21 billion
Energy saving and home appliances replacement
Subsidy for 640,000 level-1 energy-efficient air conditioners and refrigerators. Each appliance may receive NT$3,000 in grants.
Business equipment replacement and system energy saving projects
A NT$200,000 subsidy is available for the purchase of new air conditioner
Integrating system improvements such as AC, freezer/refrigerator, boiler, energy monitor et al. Each case may receive Max NT$5,000,000 in grants.
Carbon reduction demonstration in existing buildings


Combining disaster prevention functions, subsidy for 30 existing buildings to enhance carbon reduction benefits.
Accelerating vehicle Electrification
Subsidy for 11,000 urban electric buses
Subsidy for taxi/logistician/airport ground/catering service


Subsidy for developing charging stations and charging piles
Supporting conventional motorcycle shop transition
Subsidy for electric boat demonstration project.

Spurring private investment of NT$4 trillion
Silicon wafers

Solar cell modules Systems Components
Engineering Settings
Underwater foundation
Fan components
Electric equipment
Maritime engineering
Electric vehicles
Charging stations
Chargers
EV wire system integration
Site development
Battery cells/modules
Power converters
System integration
Improving the industrial process of six sectors
electronic/metal/petrochemical/cement/textile/paper


Promoting equipment
replacement in households and commercial sector
Up to NT$550 billion in output value


Energy Transition
More Secure Industrial Transition
More Competitive Lifestyle Transition
More Sustainable Social Transition
More Resilient
Lowering the risk of high dependence on imported energy
By 2030
Accelerating industrial transition and creating green growth momentum

Improving the quality of life and environmental sustainability
Driving private investment over NT$4 trillion
Energy dependency:
From 97.4% in 2011 to below 50% in 2050
Creating production value NT$5.9 trillion
Creating 551,000 jobs
Air pollution will be reduced by about 30%, compared to the level in 2019
Four major aspects
1 2 3 4 Carbon quantification and reporting


Improving mitigation capabilities


Updating information
Capacity building in financial industry
Two major cooperation modes
Major emitters take the lead and help others comply with the transition policy
Engaging with all sectoral associations while having state-owned enterprises serve as examples