Republic of China
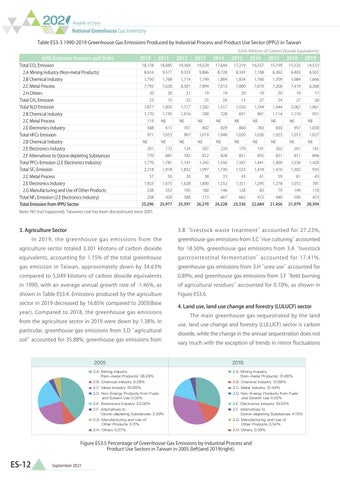
National Greenhouse Gas Inventory Table ES3-3 1990-2019 Greenhouse Gas Emissions Produced by Industrial Process and Product Use Sector (IPPU) in Taiwan GHG Emission Sources and Sinks
Total CO2 Emission
2010
2.A Mining Industry (Non-metal Products) 2.B Chemical Industry
18,178 8,616
18,985 9,577
1,750
2.C Metal Process
7,792
Total CH4 Emission
23
2.H Others
2011
1,768 7,620
20
Total N2O Emission
1,877
2.C Metal Process
119
2.B Chemical Industry
1,170
2.E Electronics Industry
588
Total HFCs Emission
971
2.B Chemical Industry
NE
2.E Electronics Industry
2.F Alternatives to Ozone-depleting Substances
Total PFCs Emission (2.E Electronics Industry) Total SF6 Emission
2.C Metal Process
201
20 15
1,805
1,195
NE
611
1,053
NE
172
770
881
1,770
2.E Electronics Industry
2.G Manufacturing and Use of Other Products
Total NF3 Emission (2.E Electronics Industry) Total Emission from IPPU Sector
1,714 8,301 21 23
1,717 1,016
NE
701
907
NE
124 783
50
30
1,923 258
25,296
9,333
1,141
1,918
238
19,369
1,781
2,218 57
2012
2013
19,529 9,866 1,749 7,894 19 25
1,582 780
NE
802
1,019
NE
207 812
2014
17,644 8,728 1,884 7,013 19
26
1,557 728
NE
829
1,048
NE
220 828
(Unit: Kilotons of Carbon Dioxide Equivalents)
2015
17,219
2016
16,557
8,345
7,108
1,854 7,000 15
19
20
1,744
691
961
NE
NE
860
783
1,020
1,026
NE
NE
170
191
851
6,262
1,709
27
1,550
15,199
1,760 7,670
20
2017
835
2018
15,525 6,403 1,684
7,208
7,419
24
27
19
1,944
2,067
1,114
1,110
NE
NE
830
957
1,023
1,013
NE
NE
202
201
821
811
1,345
1,556
1,347
1,441
1,409
1,536
38
33
43
41
59
81
1,852
1,997
1,615
1,628
1,800
1,552
1,351
1,295
1,278
1,072
420
388
773
667
662
472
440
509
252
25,977
195
25,397
160
26,270
1,730
146
24,228
1,523
1,418
128
23,336
82
22,684
1,416
1,302
79
21,456
2019
14,553 6,501 1,666 6,368 17 26
1,961 931
NE
1,030 1,027
NE
181 846
1,420
935 43
781
149
21,979
110 473
20,394
Note: NO (not happened). Taiwanes coal has been discontinued since 2001.
3. Agriculture Sector
3.B “livestock waste treatment” accounted for 27.23%,
In 2019, the greenhouse gas emissions from the
greenhouse gas emissions from 3.C “rice culturing” accounted
agriculture sector totaled 3,301 kilotons of carbon dioxide
for 18.50%, greenhouse gas emissions from 3.A “livestock
equivalents, accounting for 1.15% of the total greenhouse
gastrointestinal fermentation” accounted for 17.41%,
gas emission in Taiwan, approximately down by 34.63%
greenhouse gas emissions from 3.H “urea use” accounted for
compared to 5,049 kilotons of carbon dioxide equivalents
0.89%, and greenhouse gas emissions from 3.F “field burning
in 1990, with an average annual growth rate of -1.46%, as
of agricultural residues” accounted for 0.10%, as shown in
shown in Table ES3.4. Emissions produced by the agriculture
Figure ES3.6.
sector in 2019 decreased by 16.85% compared to 2005(Base year). Compared to 2018, the greenhouse gas emissions from the agriculture sector in 2019 were down by 1.38%. In particular, greenhouse gas emissions from 3.D “agricultural soil” accounted for 35.88%, greenhouse gas emissions from
4. Land use, land use change and forestry (LULUCF) sector
The main greenhouse gas sequestrated by the land
use, land use change and forestry (LULUCF) sector is carbon dioxide, while the change in the annual sequestration does not vary much with the exception of trends in minor fluctuations
2005
2019
2.A. Mining Industry (Non-metal Products) 38.29%
2.A. Mining Industry (Non-metal Products) 31.88%
2.B. Chemical Industry 9.28%
2.B. Chemical Industry 12.86%
2.C. Metal Industry 20.85%
2.C. Metal Industry 31.44%
2.D. Non-Energy Products from Fuels and Solvent Use 0.00%
2.D. Non-Energy Products from Fuels and Solvent Use 0.00%
2.E. Electronics Industry 23.00%
2.E. Electronics Industry 19.05%
2.F. Alternatives to Ozone-depleting Substances 3.39%
2.F. Alternatives to Ozone-depleting Substances 4.15%
2.G. Manufacturing and Use of Other Products 5.11%
2.G. Manufacturing and Use of Other Products 0.54%
2.H. Others 0.07%
2.H. Others 0.08%
Figure ES3.5 Percentage of Greenhouse Gas Emissions by Industrial Process and Product Use Sectors in Taiwan in 2005 (left)and 2019(right).
ES-12
September 2021
