Republic of China
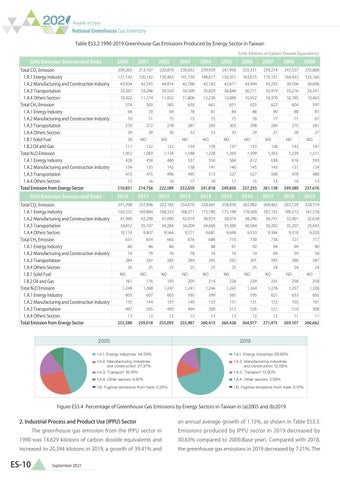
National Greenhouse Gas Inventory Table ES3.2 1990-2019 Greenhouse Gas Emissions Produced by Energy Sector in Taiwan (Unit: Kilotons of Carbon Dioxide Equivalents)
GHG Emission Sources and Sinks
Total CO2 Emission
1.A.1 Energy Industry
1.A.2 Manufacturing and Construction Industry 1.A.3 Transportation 1.A.4 Others Sectors
2000
2001
2002
2003
2004
2005
2006
2007
2008
2009
209,205
213,107
220,870
230,832
239,929
247,956
255,331
259,214
247,537
235,868
43,934
42,545
44,814
42,788
43,163
42,671
43,994
43,293
39,104
36,698
121,143
126,142
33,207
33,246
10,922
Total CH4 Emission
11,174
574
1.A.1 Energy Industry 1.A.3 Transportation 1.A.4 Others Sectors
28
1.B.2 Oil and Gas
NO
111
Total N2O Emission
1.A.1 Energy Industry
134
135
428
GHG Emission Sources and Sinks
Total CO2 Emission
1.A.1 Energy Industry
1.A.2 Manufacturing and Construction Industry 1.A.3 Transportation 1.A.4 Others Sectors
475
1.A.2 Manufacturing and Construction Industry 1.A.3 Transportation 1.A.4 Others Sectors
75
287 NO
32
159
75
295 NO
33
176
NO
33
137
90
78
303
29
133
27
138
597 81
71
289 NO
10,463
88
77
298 NO
604
33,541
67
275 NO
28
142
281 NO
27
141
1,188
1,228
1,269
1,299
1,303
1,239
1,211
138
141
140
145
143
131
124
537
142
556
584
261,138
249,380
237,676
2010
2011
2012
2013
2014
2015
2016
2017
2018
2019
251,708
257,096
253,183
254,070
258,481
258,476
262,982
269,462
267,129
258,719
165,522
169,884
168,333
168,271
175,180
175,198
178,569
187,135
189,212
181,318
34,652
35,107
34,284
34,209
34,666
35,506
36,584
36,202
35,207
35,443
41,360
42,298
9,807
663
86
74
NO
176
9,571 676
NO
193
9,681 686
NO
205
9,698 710
NO
214
38,296 9,533 730
NO
228
36,741 9,384
NO
239
14
33,401 9,310 721
94
NO
255
13
32,638
9,320 717
90
59
295 24
480
94
69
301 25
478
738
74
292 25
13
92
74
285 25
15
91
74
284 25
38,074
88
78
283 25
38,953
85
76
287 25
42,019
86
79
284
161
9,566
654
86
26
41,000
17
508
593
257,255
18
527
616
249,856
17
527
638
241,818
16
513
612
232,650
16
58
286 NO
24
258
287 NO
24
258
1,248
1,268
1,247
1,241
1,246
1,242
1,264
1,276
1,257
1,226
135
144
137
140
133
131
131
123
103
101
603
607
497 13
Total Emission from Energy Sector
88
622
10,785
222,589
NO
1.A.1 Energy Industry
480
84
625
10,370
33,216
155,166
214,756
1.A.3 Transportation
Total N2O Emission
132
1,134
81
631
35,419
164,432
210,831
1.A.2 Manufacturing and Construction Industry
1.B.2 Oil and Gas
30
10,952
170,131
495
1.A.1 Energy Industry
1.B.1 Solid Fuel
NO
12,089
73
278
36,771
12,230
78
75
36,846
163,615
496
631
1.A.4 Others Sectors
661
156,351
475
10,174
Total CH4 Emission
630
11,806
69
458
15
Total Emission from Energy Sector
122
1,083
1.A.3 Transportation 1.A.4 Others Sectors
30
1,052
1.A.2 Manufacturing and Construction Industry
585
272
29
1.B.1 Solid Fuel
35,859
71
270
148,677
34,509
70
70
141,730
34,542 11,052
565
66
1.A.2 Manufacturing and Construction Industry
130,463
253,588
603
595
505
495
494
259,018
255,093
255,987
12
2005
12
12
599 500 13
260,413
585 513 13
260,428
595
526 12
264,977
621
633
521 12
271,475
510 11
269,107
605 508
11
260,662
2019
1.A.1. Energy Industries 44.59%
1.A.1. Energy Industries 69.83%
1.A.2. Manufacturing industries and construction 27.37%
1.A.2. Manufacturing industries and construction 12.58%
1.A.3. Transport 18.18%
1.A.3. Transport 13.90%
1.A.4. Other sectors 9.61%
1.A.4. Other sectors 3.59%
1.B. Fugitive emissions from fuels 0.25%
1.B. Fugitive emissions from fuels 0.10%
Figure ES3.4 Percentage of Greenhouse Gas Emissions by Energy Sectors in Taiwan in (a)2005 and (b)2019.
2. Industrial Process and Product Use (IPPU) Sector
an annual average growth of 1.15%, as shown in Table ES3.3.
The greenhouse gas emission from the IPPU sector in
Emissions produced by IPPU sector in 2019 decreased by
1990 was 14,629 kilotons of carbon dioxide equivalents and
30.63% compared to 2005(Base year). Compared with 2018,
increased to 20,394 kilotons in 2019, a growth of 39.41% and
the greenhouse gas emissions in 2019 decreased by 7.21%. The
ES-10
September 2021
