Global EV Outlook 2022

Securing
supplies for an electric future

supplies for an electric future
The IEA examines the full spectrum of energy issues including oil, gas and coal supply and demand, renewable energy technologies, electricity markets, energy efficiency, access to energy, demand side management and much more. Through its work, the IEA advocates policies that will enhance the reliability, affordability and sustainability of energy in its 31 member countries, 10 association countries and beyond.
Please note that this publication is subject to specific restrictions that limit its use and distribution. The terms and conditions are available online at www.iea.org/t&c/
This publication and any map included herein are without prejudice to the status of or sovereignty over any territory, to the delimitation of international frontiers and boundaries and to the name of any territory, city or area.
Source: IEA. All rights reserved.
International Energy Agency
Website: www.iea.org
IEA member countries:
Australia
Austria
Belgium
Canada
Czech Republic
Denmark
Estonia
Finland
France
Germany
Greece
Hungary
Ireland
Italy
Japan
Korea
Lithuania
Luxembourg
Mexico
Netherlands
New Zealand
Norway
Poland
Portugal
Slovak Republic
Spain
Sweden
Switzerland
Turkey
United Kingdom
United States
IEA association countries:
Argentina
Brazil
China
Egypt
India
Indonesia
Morocco
Singapore
South Africa
Thailand
Few areas in the world of clean energy are as dynamic as the electric car market. Sales of electric vehicles (EVs) doubled in 2021 from the previous year to a new record of 6.6 million. Back in 2012, just 120 000 electric cars were sold worldwide. In 2021, more than that many are sold each week. Nearly 10% of global car sales were electric in 2021, four times the market share in 2019. This brought the total number of electric cars on the world’s roads to about 16.5 million, triple the amount in 2018. Global sales of electric cars have kept rising strongly in 2022, with 2 million sold in the first quarter, up 75% from the same period in 2021.
The success of EVs is being driven by multiple factors. Sustained policy support is the main pillar. Public spending on subsidies and incentives for EVs nearly doubled in 2021 to nearly USD 30 billion. A growing number of countries have pledged to phase out internal combution engines or have ambitious vehicle electrification targets for the coming decades. Meanwhile, many carmakers have plans to electrify their fleets that go further than policy targets. Finally, five times more new EV models were available in 2021 than in 2015, increasing the attractiveness for consumers. The number of EV models available on the market is around 450.
The increase in EV sales in 2021 was primarily led by the People’s Republic of China (“China”), which accounted for half of the growth. More vehicles were sold in China in 2021 (3.3 million) than in the
entire world in 2020. Sales in Europe showed continued robust growth (up 65% to 2.3 million) after the 2020 boom, and they increased in the United States as well (to 630 000) after two years of decline. The first quarter of 2022 showed similar trends, with sales in China more than doubling compared with the first quarter of 2021 (accounting for most of global growth), a 60% increase in the United States and a 25% increase in Europe.
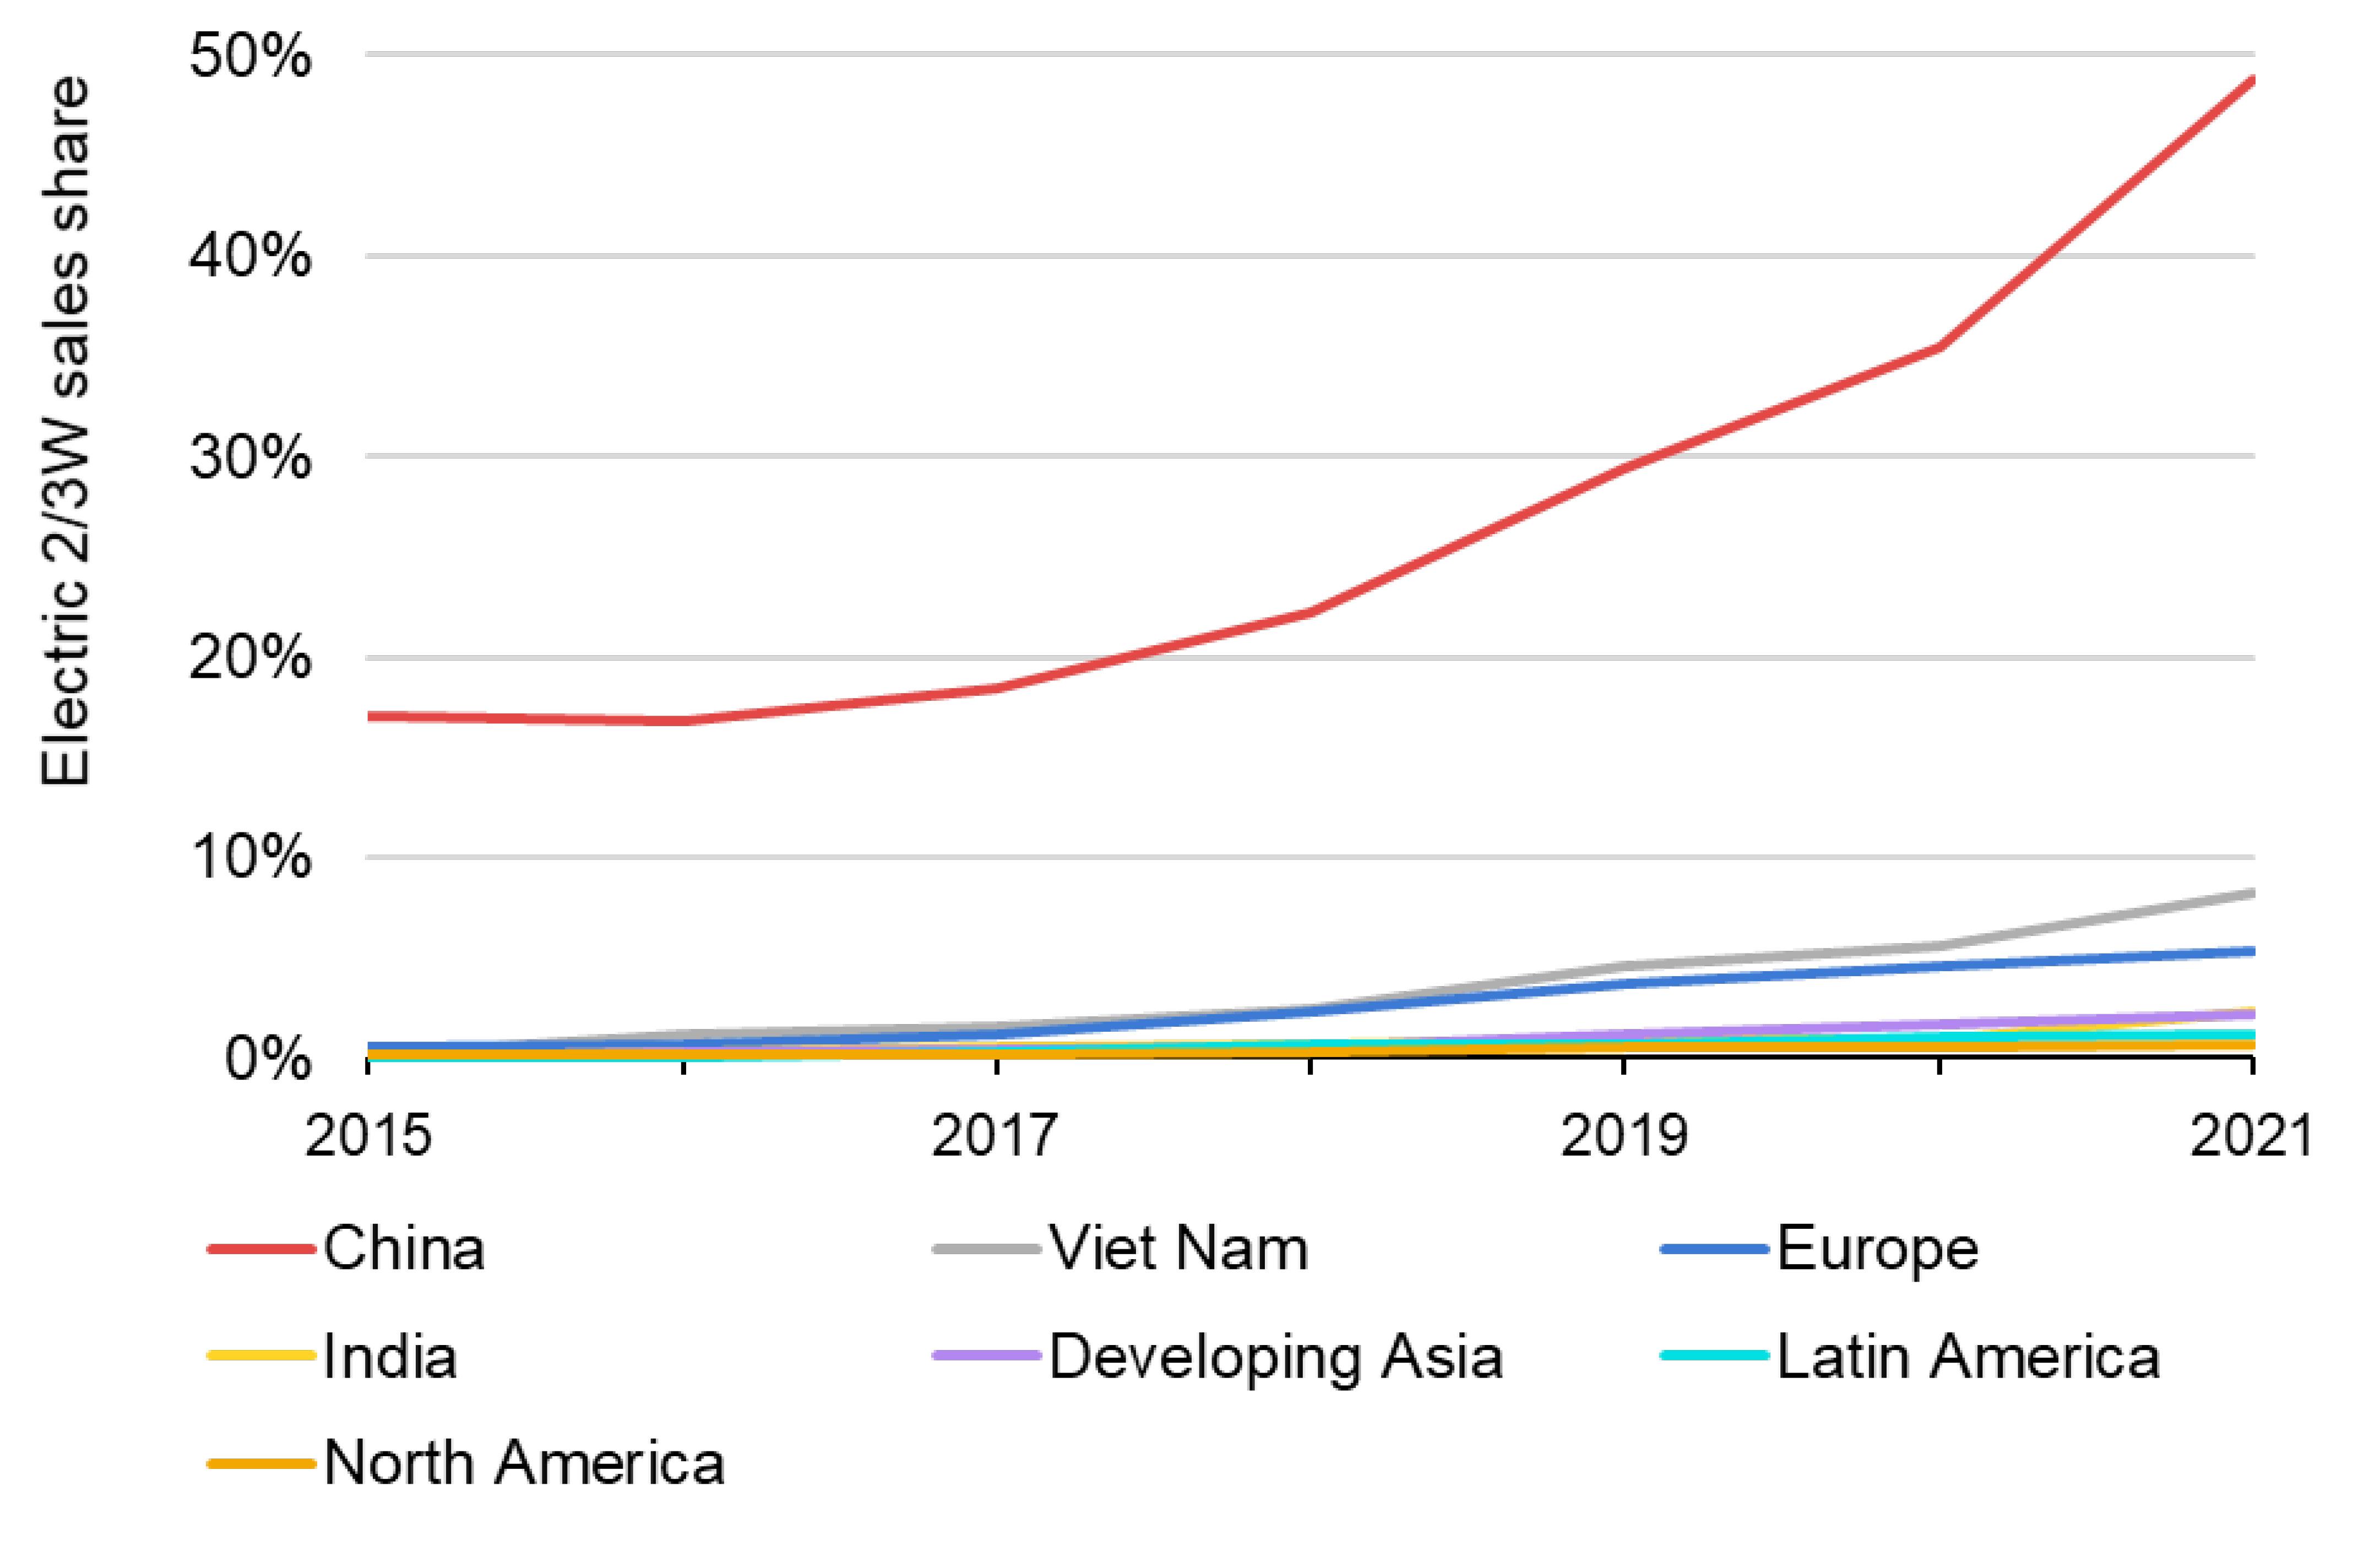
In China, electric cars are typically smaller than in other markets. This, alongside lower development and manufacturing costs, has contributed to decreasing the price gap with conventional cars. In 2021, the sales-weighted median price of EVs in China was only 10% more than that of conventional offerings, compared with 45-50% on average in other major markets. China accounts for 95% of new registrations of electric two- and three-wheeler vehicles and 90% of new electric bus and truck registrations worldwide. Electric two- and three-wheeler vehicles now account for half of China’s sales. The speed of charging infrastructure roll-out in China is faster than in most other regions.
By contrast, EV sales are still lagging in other emerging and developing economies, where the few models that are available remain unaffordable for mass-market consumers. In Brazil, India and Indonesia, fewer than 0.5% of car sales are electric. However, EV sales doubled in a number of regions in 2021 – including in India–
which could pave the way for quicker market uptake by 2030 if supporting investments and policies are in place.
The Covid-19 pandemic and Russia’s war in Ukraine have disrupted global supply chains, and the car industry has been heavily impacted. In the near future, EV delivery delays to customers may dampen sales growth in some markets. But in the longer term, government and corporate efforts to electrify transport are providing a solid basis for further growth in EV sales. The IEA Announced Pledges Scenario (APS), which is based on existing climate-focused policy pledges and announcements, presumes that EVs represent more than 30% of vehicles sold globally in 2030 across all modes (excluding two- and three-wheelers). While impressive, this is still well short of the 60% share needed by 2030 to align with a trajectory that would reach net zero CO2 emissions by 2050. Under current policy plans reflected in the IEA Stated Policies Scenario (STEPS), EVs reach just over 20% of sales in 2030, increasing the stock 11-fold from today’s levels to 200 million vehicles.
The global market value of electricity for EV charging is projected to grow over 20-fold in the APS, reaching approximately USD 190 billion by 2030, which is is equivalent to about one-tenth of today’s diesel and gasoline market value. Yet, the amount of public charging infrastructure that has been announced might be insufficient
to power the size of the EV market being targeted. There are important variations across countries in terms of charging infrastructure roll-out speed and need. The suitable number of chargers per EV will depend on local specificities such as housing stock, typical travel distances, population density and reliance on home charging. Charging at home and workplace are likely to supply much of the demand overall, but the number of public chargers still needs to expand ninefold and reach over 15 million units in 2030 to meet the levels envisaged in the APS and provide consumers with adequate and convenient coverage.
Electric trucks have so far been substantially deployed only in China, thanks to strong government support. In 2021, however, several other countries announced support for heavy truck electrification. Truck manufacturers have also developed new electric truck models: more than 170 were available outside China in 2021. Rapid deployment will be needed to keep pace with government announcements, and further efforts will be needed to meet net zero ambitions. The electric trucks accounted for just 0.3% of global truck sales in 2021. This needs to reach around 10% by 2030 in the APS, and 25% in the IEA’s Net Zero Emissions by 2050 Scenario (NZE). Short-haul trucks are the segment that can be electrified fastest, and for the most part these do not need a wide charging network if depot charging is available. Longer-range trucks will require high-power chargers that are currently expensive and often require significant grid upgrades. As a result, early planning and investments are crucial
to minimise the strain on the grid and provide a suitable network for the next stage of heavy-duty vehicle electrification.
The simultaneous electrification of road transport and the deployment of decentralised variable renewables such as rooftop solar will make power grid distribution more complex to manage. Grid simulations suggest that between now and 2030, EV loads in major car markets should not pose significant challenges. This is because EVs are likely to account for less than 20% of the overall vehicle stock in most countries. However, some early adopter cities could face grid congestion pressures between now and 2030. Digital grid technologies and smart charging hold the key to transforming EVs from a grid integration challenge to an opportunity for grid management.
Electrifying transport has multiple benefits. Russia’s invasion of Ukraine has brought the role of EVs in reducing oil demand to the fore; it is one of the 10 measures proposed by the IEA to cut oil use in the near term. EV deployment in line with the pledges and announcements in the APS suggests a displacement (excluding two and three wheelers) of 1.6 million barrels per day (mb/d) of oil by 2025, and 4.6 mb/d by 2030. In terms of climate change, EVs achieve net greenhouse gas emissions reduction of nearly 580 Mt CO2-eq in the APS on a well-to-wheel basis compared to an equivalent use of
ICE vehicles – more than Canada’s energy-related CO2 emissions today. Electrifying transport naturally boosts electricity demand: in the APS, EVs are projected to account for about 4% of total final electricity demand by 2030. At 1 100 terawatt-hours (TWh), electricity demand from EVs globally in 2030 in the APS is equivalent to twice today’s total electricity use in Brazil.
The rapid increase in EV sales during the pandemic has tested the resilience of battery supply chains, and Russia’s war in Ukraine has further exacerbated the challenge. Prices of raw materials such as cobalt, lithium and nickel have surged. In May 2022, lithium prices were over seven times higher than at the start of 2021. Unprecedented battery demand and a lack of structural investment in new supply capacity are key factors. Russia’s invasion of Ukraine has created further pressures, since Russia supplies 20% of global highpurity nickel. Average battery prices fell by 6% to USD 132 per kilowatt-hour in 2021, a slower decline than the 13% drop the previous year. If metal prices in 2022 remain as high as in the first quarter, battery packs would become 15% more expensive than they were in 2021, all else being equal. However, given the current oil price environment the relative competitiveness of EVs remains unaffected.
Today’s battery supply chains are concentrated around China, which produces three-quarters of all lithium-ion batteries and is home to 70% of production capacity for cathodes and 85% of production
capacity for anodes (both are key components of batteries). Over half of lithium, cobalt and graphite processing and refining capacity is located in China. Europe is responsible for over one-quarter of global EV production, but it is home to very little of the supply chain apart from cobalt processing at 20%. The United States has an even smaller role in the global EV battery supply chain, with only 10% of EV production and 7% of battery production capacity. Both Korea and Japan have considerable shares of the supply chain downstream of raw material processing, particularly in the highly technical cathode and anode material production, Korea is responsible for 15% of cathode material production capacity, while Japan accounts for 14% of cathode and 11% of anode material production. Korean and Japanese companies are also involved in the production of other battery components such as separators.
Mining generally takes place in resource-rich countries such as Australia, Chile and the Democratic Republic of Congo, and is handled by a few major companies. Governments in Europe and the United States have bold public sector initiatives to develop domestic battery supply chains, but the majority of the supply chain is likely to remain Chinese through 2030. For example, 70% of battery production capacity announced for the period to 2030 is in China.
Pressure on the supply of critical materials will continue to mount as road transport electrification expands to meet net zero ambitions. Additional investments are needed in the short term, particularly in mining, where lead times are much longer than for other parts of the supply chain. Projected mineral supply until the end of the 2020s is
in line with the demand for EV batteries in the STEPS. But the supply of some minerals such as lithium would need to rise by up to onethird by 2030 to match the demand for EV batteries to satisfy the pledges and announcements in the APS. For example, demand for lithium – the commodity with the largest projected demand-supply gap – is projected to increase sixfold to 500 kilotonnes by 2030 in the APS, requiring the equivalent of 50 new average-sized mines.
There are other variables affecting demand for minerals. If current high commodity prices endure, cathode chemistries could shift towards less mineral-intensive options. For example, the lithium iron phosphate chemistry does not require nickel nor cobalt, but comes with a lower energy density and is therefore better suited for shorterrange vehicles. Their share of global EV battery supply has more than doubled since 2020 because of high mineral prices and technology innovation, primarily driven by an increasing uptake in China. Innovation in new chemistries, such as manganese-rich cathodes or even sodium-ion, could further reduce the pressure on mining. Recycling can also reduce demand for minerals. Although the impact between now and 2030 is likely to be small, recycling’s contribution to moderating mineral demand is critical after 2030. In the NZE Scenario, demand grows even faster, requiring additional demandside measures and technology innovation. Today’s corporate and consumer preferrence for large car models such as sports utility vehicles (SUVs), which account for half of all electric models available globally and require larger batteries to travel the same distances, is exerting additional pressure.
As the electric car market matures, reliance on direct subsidies must decrease and eventually fade out. Budget-neutral feebate programmes – which tax inefficient internal combustion engine vehicles to finance subsidies for low emissions or EVs purchases –can be a useful transition policy tool. Stringent vehicle efficiency and/or CO2 standards have promoted EV adoption in most leading EV markets and should be adopted by all countries seeking to hasten the transition to electromobility.
More heavy-duty electric models are available, and electric buses and trucks are becoming competitive on a total-cost-of-ownership basis across more and more applications. Policy-led deployment can help kickstart this sector. Zero emission vehicle sales mandates, purchase incentives and CO2 standards can all help speed up the transition.
Electrification of road transport in emerging and developing economies should prioritise two/three-wheelers and urban buses, as these vehicle types are most cost competitive. Price signals and
charging infrastructure availability can also help the economic case for electrification.
Governments should continue to support deployment of publicly available charging infrastructure at least until there are enough EVs on the road for an operator to sustain a charging network. Continued government support, either through regulations requiring the building out of charging stations or through fiscal policies and support, should ensure equitable access to charging for all communities to ensure that nobody is left behind in the transition. Incentivising and facilitating the installation of home chargers in existing parking spaces is important. Mandating EV charging readiness for new buildings can help. At the same time, local authorities should support the installation of chargers in existing buildings. Co-ordinated plans on grid expansion and enhancements, including digital technologies to facilitate two-way communication and pricing between EVs and grids, are needed now to ensure that EVs can become a resource for grid stability rather than a challenge.
Electrifying road transport requires a wide range of raw material inputs. While all stages of the supply chain must scale up, extraction and processing is particularly critical due to long lead times. Governments must leverage private investment in sustainable mining of key battery metals and ensure clear and rapid permitting procedures to avoid potential supply bottlenecks.
Innovation and alternative chemistries that require smaller amounts of critical minerals, as well as extensive battery recycling, can ease demand pressure and avoid bottlenecks. Incentivising battery “rightsizing” and the adoption of smaller cars can also decrease demand for critical metals.
Governments should strengthen cooperation between producer and consumer countries to facilitate investment, promote environmentally and socially sustainable practices, and encourage knowledge sharing. Governments should ensure traceability of key EV components and monitor progress of ambitious environmental and social development goals at every stage of battery and EV supply chains..


The Electric Vehicles Initiative (EVI) is a multi-governmental policy forum established in 2010 under the Clean Energy Ministerial (CEM). Recognising the opportunities offered by EVs, the EVI is dedicated to accelerating the adoption of EVs worldwide. To do so, it strives to better understand the policy challenges related to electric mobility, help governments address them and to serve as a platform for knowledge sharing.
The EVI facilitates exchanges between government policy makers that are committed to supporting EV development and a variety of partners, bringing them together twice a year. Its multilateral nature, openness to various stakeholders and engagement at different levels of governance (from country to city-level) offer friutful opportunities to exchange information and to learn from experiences developed by a range of actors in the transition to electric mobility.
The International Energy Agency serves as the co-ordinator to support the EVI member governments in this activity. Governments that have been active in the EVI in the 2020-21 period include Canada, Chile, People’s Republic of China (hereafter “China”), Finland, France, Germany, India, Japan, the Netherlands, New Zealand, Norway, Poland, Portugal, Sweden, United Kingdom and United States. Canada and China are the co-leads of the initiative.


The Global EV Outlook annual series is the flagship publication of the EVI. It is dedicated to track and monitor the progress of electric mobility worldwide and to inform policy makers on how to best accelerate electrification of the road transport sector.

Global electric car stock, 2010-2021
IEA. All rights reserved.
Notes: BEV = battery electric vehicle; PHEV = plug-in hybrid electric vehicle. Electric car stock in this figure refers to passenger light-duty vehicles.
“Other” includes Australia, Brazil, Canada, Chile, India, Japan, Korea, Malaysia, Mexico, New Zealand, South Africa and Thailand. Europe in this figure includes the EU27, Norway, Iceland, Switzerland and United Kingdom.
Sources: IEA analysis based on country submissions, complemented by ACEA; CAAM; EAFO; EV Volumes; Marklines.
Over16.5 million electric cars were on the road in 2021, a tripling in just three years
Electric car sales more than doubled in China, continued to increase in Europe and picked up in the United States in 2021
Electric car registrations and sales share in selected countries/regions, 2016-2021
All rights reserved.
Notes: The countries/regions shown are the world’s largest EV markets and are ordered by size of the total car market (i.e. all powertrains) in the upper half of the figure and by sales share of electric cars in the lower charts. Acronyms and geographic groupings are defined in the Notes of the previous figure. Regional EV registration data can be interactively explored via the Global EV Data Explorer
Sources: IEA analysis based on country submissions, complemented by ACEA; CAAM; EAFO; EV Volumes; Marklines
Sales of electric cars reached another record high in 2021 despite the Covid-19 pandemic and supply chain challenges, including semiconductor chip shortages. Looking back, about 120 000 electric cars were sold worldwide in 2012. In 2021, that many were sold in a week.
After increasing in 2020 despite a depressed car market, sales of electric cars – battery electric vehicles (BEVs) and plug-in hybrid electric vehicles (PHEVs) – nearly doubled year-on-year to 6.6 million in 2021. 1 This brought the total number of electric cars on roads to over 16.5 million. As in previous years, BEVs accounted for most of the increase (about 70%).
EV markets are expanding quickly. Electric car sales accounted for 9% of the global car market in 2021 – four times their market share in 2019. All the net growth in global car sales in 2021 came from electric cars. Sales were highest in the People’s Republic of China (“China” hereafter), where they tripled relative to 2020 to 3.3 million after several years of relative stagnation, and in Europe, where they increased by two-thirds year-on-year to 2.3 million. Together, China and Europe accounted for more than 85% of global electric car sales
in 2021, followed by the United States (10%), where they more than doubled from 2020 to reach 630 000.
More electric cars were sold in China in 2021 (3.3 million) than in the entire world in 2020 (3.0 million). China’s fleet of electric cars remained the world’s largest at 7.8 million in 2021, which is more than double the stock of 2019 before the Covid-19 pandemic. Over
2.7 million BEVs were sold in China in 2021, accounting for 82% of new electric car sales. Electric cars accounted for 16% of domestic car sales in 2021, up from 5% in 2020, and reached a monthly share of 20% in December, reflecting a much quicker recovery of EV markets relative to conventional cars.
This impressive growth comes alongside government efforts to accelerate decarbonisation in the new 14th Five-Year Plan (FYP) (2021-2025), continuing the trend of progressively strengthening policy support for EV markets in the past few FYP periods. The current FYP includes medium-term objectives in transport such as
1 This report focuses on BEVs and PHEVs, i.e. EVs that are powered with electricity from the grid. All figures and discussion exclude fuel cell electric vehicles unless otherwise specified.
reaching an annual average of 20% market share for electric car sales in 2025. Notably, China had extended subsidies for electric cars for two years in the wake of the pandemic, with a planned scale-back of 20% in 2021 and 30% in 2022 – but by the end of 2022 they will be phased out. There are also a number of subnational regulations that give preferential treatment to EVs, such as local subsidies or tax breaks, financial incentives and exemptions from purchase limitations.
Growth in 2021 in spite of declining subsidies indicates the maturing of China’s EV markets. Consumer anticipation of declining subsidies may also have supported record high sales, although the pace at which subsidies effectively decline warrants further examination.
China’s electric car market can be expected to further expand in 2022 and beyond, as investments from previous years ramp up production capacity and bear fruit.
Europe sustains strong growth after its 2020 boom, reaching the world’s highest electric car penetration rates
In Europe, electric car sales continued to increase in 2021 by more than 65% year-on-year to 2.3 million, after the boom of 2020. EV sales remained strong even though the overall automotive market has not yet fully recovered from the pandemic: total car sales in 2021 were 25% lower than in 2019. Over the 2016-2021 period, EV sales
in Europe increased by a compound annual growth rate (CAGR) of 61%, the world’s highest, above China (58%) and the United States (32%).
Overall, electric cars accounted for 17% of Europe’s auto sales in 2021. Monthly sales were highest in the last quarter, when electric car reached a 27% sales share and surpassed diesel vehicles for the first time. However, the distribution is uneven across countries. The largest market in terms of number of EVs sold remains Germany, where electric cars accounted for 25% of new cars sold overall, which increased to one-in-three in November and December. Germany offers some of the highest subsidies in Europe.
The highest market share for new electric car sales in 2021 in Europe are Norway (86%), Iceland (72%), Sweden (43%) and the Netherlands (30%), followed by France (19%), Italy (9%) and Spain (8%). For the first time in 2021, the bigger market of the United Kingdom was not included in European Union-wide regulations, although it has put in place national law that mirrors EU regulations. The key driver underpinning EV growth in Europe is the tightening CO2 emissions standards that occurred in 2020 and 2021. The expansion of purchase subsidies and tax benefits in major markets also contributed to the acceleration of sales.
In 2021, there were about 5.5 million electric cars on European roads – more than three-times the stock of 2019 before the Covid-19
outbreak. As in previous years, new sales were evenly split between BEVs and PHEVs, in contrast to China where BEVs typically score a clear lead. In 2021, Europe’s stock of electric cars was about 55% BEVs, a share that has remained steady since 2015 and is lower than other regions such as China (80%) and the United States (65%). This may reflect a corporate strategy among European automakers and original equipment manufacturers (OEMs) of offering PHEV versions of many large and high-end car models to capitalise on their experience in developing conventional drivetrains (a necessary part of PHEVs), whereas their experience in electric powertrains is more recent. In addition, the CO2 regulation structure in Europe makes PHEVs very attractive for OEMs in terms of compliance.
After two years of consecutive decline of 10%, electric car sales increased in the United States in 2021. About 630 000 electric cars were sold – more than in 2019 and 2020 combined – bringing the total stock of electric cars to over 2 million. About 75% of new EV sales were BEVs, up from 55% just five years ago, resulting in a higher share of BEVs relative to PHEVs today over the total EV stock (65%) than in 2015-2016 (about 50%). Relative to other regions, the overall car market recovered faster from the pandemic in the United States, but electric cars still doubled their share to 4.5% in 2021. Tesla accounts for over half of all units sold, and there are generally
fewer models available in the United States than in other major markets. Some of the main drivers underpinning growth in the United States in 2021 were the increased production of Tesla models and the availability of new generation electric models by incumbent automakers.
Status and evolution of electric vehicle model availability, 2015-2021
IEA. All rights reserved.
Notes: BEV = battery electric vehicle; PHEV = plug-in hybrid vehicle. Small cars include A and B segments. Medium cars include C and D segments. Crossovers are a type of sports utility vehicle (SUV) built on a passenger car platform. Large cars include E and F segments and multi-purpose vehicles. Vehicle models do not include the various trim levels.
Sources: IEA analysis based on EV Volumes and Marklines.
Globally, there were over 450 electric car models available in 2021, an increase of more than 15% relative to 2020 offerings and more than twice the number of models available in 2018. Over the 20152021 period, the CAGR for new models was 34%. The increase in the number of available EV car models is associated with a notable increase in sale volumes in all markets. This reflects the interests of automakers to capture EV market share by producing new options quickly to appeal to an broadening pool of consumers.
As in previous years, China offers the broadest portfolio, with nearly 300 models available, compared with 184 in Europe and nearly 65 in the United States. Thanks to consistently high electric car sales, Chinese automakers have been able to diversify offerings and market a larger number of products over the years. Availability increased in all major markets relative to 2020, but increased more in Europe (26%) and the United States (24%) than in China (13%) as these markets catch up.
In 2021, global sales of conventional sport utility vehicles (SUVs) marked another record, setting back efforts to reduce emissions. This
development is also seen in EV markets. SUVs and luxury models typically generate much larger profit margins, which is one reason why automakers promote them and boost supply. About half of the electric car models available in major markets in 2021 were SUVs, far ahead of small (10%) or medium-size models (23%).
Small models found most success in China (13% of available models), with the example of the best-selling Wuling Hongguang Mini EV, and least in the United States (2%). In China, there were more than ten new offerings for small and medium cars relative to 2020 (up 13%), versus 22 new models offered for larger models and SUVs (up 13% as well). Meanwhile, there were many more new offerings for large models and SUVs in Europe and the United States – about 50 in total – than for small and medium EVs, hence the number of models available in these segments increased disproportionately. While smaller electric car models are BEVs for the most part, the share of PHEVs in larger models and SUVs is higher, especially in Europe and the United States. This may result from automakers discontinuing some high power, luxury conventional vehicle models to offer these as PHEVs instead. In 2022 and beyond, expectations are for even more electric SUVs to reach markets as automakers and OEMs accelerate efforts to electrify this fast growing segment to simultaneously seek profits from larger models and comply with
policy and market regulations. This is expected to result in even higher demand for large battery designs and the raw materials to produce them.
Over the 2015-2019 period, the sales-weighted average range of new BEVs increased steadily at a 12% annual growth rate on average, but then stagnated in 2019-2020, and only moderately increased in 2021 (up 3.5%), to reach 350 kilometres (km). The CAGR over the 2015-2021 period remained high at 9%, reflecting sustained efforts to improve vehicle efficiency and increase battery size. The salesweighted average driving range of new PHEVs increased by 8.5% in 2021 and exceeded 60 km for the first time, after several years of relative slow growth, resulting in a 2.7% CAGR over the 2015-2021 period. This increase in part is due to the availability of new PHEV models equipped with larger batteries and thus lower rated CO2 emissions.
Driving range remains an important consideration for consumers. Automakers typically aim for longer ranges to boost sales. On the other hand, increasing driving range typically implies larger batteries, increased resource needs and higher prices. In the long run, driving range is likely to plateau, as a market optimal vehicle range is reached and fast charging becomes more widely available.
IEA. All rights reserved.
Notes: Range is sales-weighted and normalised to the Worldwide Harmonized Light Vehicle Test Procedure for all regions. Range for PHEVs refers to the all-electric electric drive range.
Sources: IEA analysis based on EV Volumes.
Number of available EV models relative to EV sales share in selected countries, 2016 and 2021
2016 2021
Notes: EVs = BEVs and PHEVs. Vehicle models do not include the various trim levels.
Sources: IEA analysis based on EV Volumes
Number of available EV models
IEA. All rights reserved.
Electric car models available in selected emerging markets by segment (left), sales and models available by region 2016-2021 (right)
IEA. All rights reserved.
Notes: The countries shown are expected to receive funds from the Global Environment Facility (GEF) and be part of the Global E-Mobility Programme which aims to support countries with a shift to electromobility Africa includes Burundi, Cote d' Ivoire, Ethiopia, Ghana, Kenya, Madagascar, Mauritius, Mozambique, Rwanda, Senegal, Seychelles, Sierra Leone, South Africa, Tanzania, Togo, Tunisia, Uganda and Zambia. Asia includes Bangladesh, India, Indonesia, Maldives, Nepal, Philippines, Sri Lanka, Thailand and Viet Nam. Eastern Europe, Central and West Asia include Albania, Armenia, Belarus, Jordan, Uzbekistan and Ukraine. Latin America and Caribbean include Antigua and Barbados, Argentina, Belize, Colombia, Costa Rica, Chile, Dominican Republic, Ecuador, El Salvador, Grenada, Guatemala, Honduras, Jamaica, Nicaragua, Panama, Paraguay, Peru, St Lucia and Uruguay. The number of available models refers to unique models across the selected sample of countries (all “GEF countries” in the left figure, and by region in the right figure). In the top figure, the number of available models includes BEVs and PHEVs. Luxury models are excluded. Crossover models refer to small SUVs.
Electric cars have not met similar success in all regions in the last decade. China, Europe and the United States account for nearly twothirds of the overall electric car market and their aggregated sales represented 95% of total electric car sales in 2021. In large economies such as Brazil, India and Indonesia, EVs account for less than 0.5% of total sales, with some growth over the last years, albeit from low sales levels.
There were positive developments in 2021, however, possibly signalling stronger prospects. Electric car sales in emerging markets spiked to unprecedented levels in 2021: more than doubling in Asia to 33 000; in Eastern Europe, Central and West Asia to 32 000; and in Latin America and the Caribbean to 18 000. In Eastern Europe, Central and West Asia, this growth was led by BEVs, which accounted for about 65% of new electric car sales. In Latin America and the Caribbean, sales were more evenly split with PHEVs. Although electric car sales remained low across Africa, they increased by 90%, of which BEVs accounted for 85%.
Few EV models are available in emerging markets. In 2021, there were only 90 distinct models available across members of the Global Environment Facility’s Global E-Mobility Programme, which counts
more than 50 countries. Less than 20 models were available throughout Africa, and less than 40 in emerging Asian markets. In Latin America and the Caribbean 75 models were available, which are slightly above the number of models in the United States, but far behind Europe and China.
Available models tend to be the larger or more expensive ones in emerging markets. Across the countries in the GEF programme, twothirds of the available models were large cars and SUVs in 2021, which is similar to Europe and the United States despite stark disparities in purchasing power. In India, Tata’s Nexon BEV SUV was the bestselling model – accounting for two-thirds of EV sales – and most other offerings were SUVs as well. In South Africa, three-quarters of the available options for electric cars are from high-end brands. Similar observations can be made across the developing and emering economies.
For many years, major EV markets such as the China, Europe and United States also have been dominated by high-end models, before car manufacturers could offer less expensive, mass-market options. Even though some small electric vehicle models are now available, prices remain too high for mass-market consumers in emerging market countries. As a result, mostly consumers from high income groups are able to purchase EVs, thereby limiting mass-market adoption. The lack of widely accessible charging infrastructure and weaker regulatory push also contribute to slower market uptake in emerging markets and developing economies.
Consumer and government spending on electric cars, 2016-2021
Government spending on electric cars by region, 2016-2021
IEA. All rights reserved.
Notes: Government spending is the sum of direct central government spending through purchase incentives and foregone revenue due to taxes waived specifically for electric cars. Only central government purchase support policies for electric cars are taken into account. Consumer spending is the total expenditure based on model price, minus government incentives Incentives provided for company cars are not included.
Sources: IEA analysis based on EV Volumes
Consumer and government spending on electric cars doubled in 2021, led by considerable increases in China and Europe
Worldwide consumer and government spending on electric cars continued to increase in 2021. Consumer spending doubled to reach nearly USD 250 billion, about eight times what was spent five years ago. Government spending, such as through purchase subsidies and tax waivers, also doubled to nearly USD 30 billion. The resulting government share of total spending for electric cars remained at 10%, down from about 20% only five years ago.
In China, consumer spending nearly tripled to about USD 90 billion in 2021. Government spending also increased, doubling relative to 2020 levels to reach USD 12 billion. However, government spending on a per electric car basis decreased from about USD 5 000 to USD 3 750, in a declining trend since 2016 highs. The drop in 2021 reflects declining per unit subsidies and spiking sales.
Europe massively increased public spending on electric cars in the last two years. In 2019, public support for electric cars accounted for about USD 3.0 billion and levels have been rising steadily since 2016. In 2020, it more than doubled to USD 8 billion, and in 2021 it increased to USD 12.5 billion. Consumer spending similarly increased to USD 112 billion in 2021, resulting in a constant share of
government in total spending since 2019 at about 10%. While government spending to support electric car uptake increased as a whole, the per unit support level remained flat in the range of USD 5 000 - 6 000 over the 2019-2021 period. This reflects two mechanisms that balance each other: increasing per unit subsidies in Covid-related stimulus packages; and tightening eligibility requirements for subsidies with a vehicle price cap (for equity considerations).
In the United States, consumer and government spending increased in 2021, although they lag behind levels in China and Europe. Consumer spending doubled to USD 30 billion relative to 2020 levels and government spending tripled to USD 2 billion. Public spending on a per unit basis ranks lower than in other regions, at about USD 3 200, which is above the support level of USD 2 300 provided in 2020, but below the 2019 level of USD 4 500.
The global sales-weighted average price of BEVs in 2021 was just over USD 36 000, down 7% relative to 2020, and stable at USD 51 000 for a PHEV. However, these average prices are significantly skewed downwards by the market in China, which accounts for the highest sales and lowest prices. This is notably due to a stronger market position for small and medium models there,
lower production costs and more integrated domestic battery value chains. Excluding China, the average BEV price was just under USD 50 000 in 2021, up 3% relative to 2020, and over USD 57 000 for the average PHEV, up 4%.
Price distribution of electric cars compared to overall car market
PHEV average price. Both BEV and PHEV average prices were up 4% relative to 2020 average European prices. In the United States, BEVs are more expensive on average although they were cheaper than in 2020 by nearly 4% at over USD 51 000, driven by the dominate Tesla models. Meanwhile, the average PHEV cost about USD 50 000 in 2021, up 3.6% from 2020.
There are regional variations in terms of price differential between electric and conventional cars. In China, where electric models are smaller and less expensive on average, the price gap is narrower than in other major markets. We estimate that the sales-weighted median price for BEVs in China was only 9% higher than the overall car market, and that the average BEV was 20% more expensive than the average conventional vehicle, compared to about 45 - 50% in Europe and the United States for both metrics.
IEA. All rights reserved.
Notes: Figure shows only passenger light-duty vehicles. EV = electric vehicles (PHEVs and BEVs). Registration-weighted price distribution for the overall car market and for electric cars, mid-lines being medians. Europe includes: France, Germany and Italy.
Sources: IEA analysis based on IHS (2021) and EV Volumes
In China, the sales-weighted average BEV cost about USD 27 000 in 2021, down 6% from the previous year, and USD 40 000 for a PHEV, down 2%. In Europe, the average BEV cost about USD 48 000 in 2021, more expensive than Chinese models but less expensive than US BEVs, and over USD 58 000 for a PHEV, the world’s highest
Globally, decreasing EV prices and increasing driving ranges in 2021 relative to 2020 have resulted in a 10% decrease in the salesweighted average price-per-range ratio for BEVs and 14% for PHEVs. Excluding China, the drop was 7% for BEVs and an increase of 2% for PHEVs because average prices increased faster than the average range. The highest drop for BEVs was recorded in the United States (-8%), where the price dropped by 4% while the range increased by 5% on average. In Europe, while BEV driving range increased by 11% on average, prices also increased, resulting in a slower price-per-range decrease (-6%).
Electric light commercial vehicle (LCV) sales worldwide increased by over 70% in 2021. At a global level, the electric LCV market share is 2%, about four times less than for passenger cars. Even in advanced EV markets, the LCV share barely exceeds 12%. The economic case for electrifying LCVs is stronger than for cars in cases such as urban delivery since LCV fleets are driven intensively, often operate on predictable routes and can be charged at commercial depots. The fact that the uptake of electric LCVs has been slower than cars in most markets to date may be attributable to a mix of factors, including less stringent fuel economy and ZEV regulations, fewer model options, and a diversity of use profiles (including lower annual mileage).
China accounted for the largest number of LCVs sales in 2021, at 86 000, showing rapid growth consecutively for 2020 and 2021. Europe was the second-largest market with more than 60 000 electric LCV sales in 2021 and where sales have been quickly increasing partially in response to CO2 performance standards.
Korea has seen a very rapid increase in sales of electric LCVs, reaching 28 000 in 2021 (a 12% market share of overall LCVs), up from just 1 500 just two years prior. This increase is attributable to an innovative policy in Korea that incentivises the adoption of EVs for commercial use (see Chapter 2).
The vast majority of electric LCVs are BEVs, only a few PHEVs are sold in Europe. This may reflect that most electric LCVs are acquired for specific uses within fixed delivery areas and may not need an extended driving range. The average battery size of LCVs is 18% smaller than for passenger cars; this may be due predictable and shorter routes, or because total ownership and operation costs are key factors in fleet owner decisions to buy electric LCVs.
Electric LCV registrations by type and market, 2015-2021
Source: IEA analysis based on country submissions
IEA. All rights reserved.
Sales of electric two/three-wheelers in China continued to increase rapidly in 2021. The very small battery sizes needed to deliver adequate range for a daily commute and the simplicity of their manufacturing make them cheaper to buy than their internal combustion engine (ICE) counterparts in many regions. This is not the case in Europe and the United States where electric models still tend to be more expensive, but where the total costs of ownership and operation are lower than ICE analogues (assuming they are used relatively frequently for transport rather than for recreational purposes).
China dominates the market, reaching nearly 9.5 million electric two/three-wheeler new registrations in 2021 out of a global total of just over 10 million. 1 Electric two/three-wheeler sales in China increased on average by nearly 25% per year from 2015 to 2021 and now account for more than half the global market. Other high volume markets are Viet Nam where 230 000 electric two/three-wheelers were sold in 2021 and India with nearly 300 000. Electric two/threewheelers can displace the use of oil and cut emissions in these markets where they account for around half of gasoline consumption for all road transport. In Europe, the electric two/three-wheeler market share reached 5% in 2021 with 87 000 sales.
Several companies that entered the two/three-wheeler market focussing only on electric models are now large companies that sell their vehicles worldwide, such as Niu and Gogoro. This market continues to attract new investment. A notable example is one of the world’s largest electric two/three-wheeler factory being built in India.
Electric
IEA. All rights reserved.
1 Tracking sales of electric two/three-wheelers is not an easy task, as definitions vary across countries. Often, electric bicycles are included in the statistics. The accounting here includes only
Note: 2/3W = two/three-wheeler.
Sources: IEA analysis based on country submissions and Motorcycles Data vehicles that fit the UNECE definition of L2-L4. This year we have updated our data sources to Motorcycles Data
The Climate Group’s EV100 is a 122-member worldwide initiative that brings together forward-looking companies committed to accelerating the transition to electromobility by purchasing EVs and installing charging points.
The initiative welcomed 31 new members in 2021, including the first members headquartered in Brazil and Korea. Over the past year, EV100 members have increased their global ambition, with 5.5 million vehicles now committed across 98 markets worldwide, a 13% increase over previous commitments. Members are acting on these commitments and have collectively deployed over 200 000 EVs and 20 000 charging points at 3 100 locations worldwide.
New members that joined in 2021 include Donlen, a US based leasing company, which has committed to more than 150 000 EVs. Zomato, a food delivery service in India, has committed to more than 160 000 EVs. EV100’s first members in Korea, LG Energy Solutions Ltd. and SK Networks, together have committed to transition 200 000 corporate vehicles to electric. Unidas – the first Brazilian EV100 member – is one of the largest car rental companies in the country and aims to electrify 85 000 vehicles by 2027, while also working to install more than 1 000 charging points for staff and customers.
The majority of new vans are registered by businesses, which make vehicle purchase decisions based on the total cost of ownership. Recent research shows that in major European markets, electric vans are the cheapest option for all user groups when purchase subsidies are included. This reflects a global trend towards rapidly improving the business case for electric vans. The shift in cost is reflected in demand. Charging infrastructure, electric van driving range and availability of suitable vehicle types all remain barriers to uptake. However, the main challenge is ensuring that supply meets established demand.
Number of vehicles and chargers committed by EV100 members, 2017-2021
IEA. All rights reserved. Sources: IEA analysis based on EV100 data
EV sales target announcements, 2010-2022 (Q1)
IEA. All rights reserved.
Note: Dots represent the date of automaker announcements on sales or production targets for EVs.
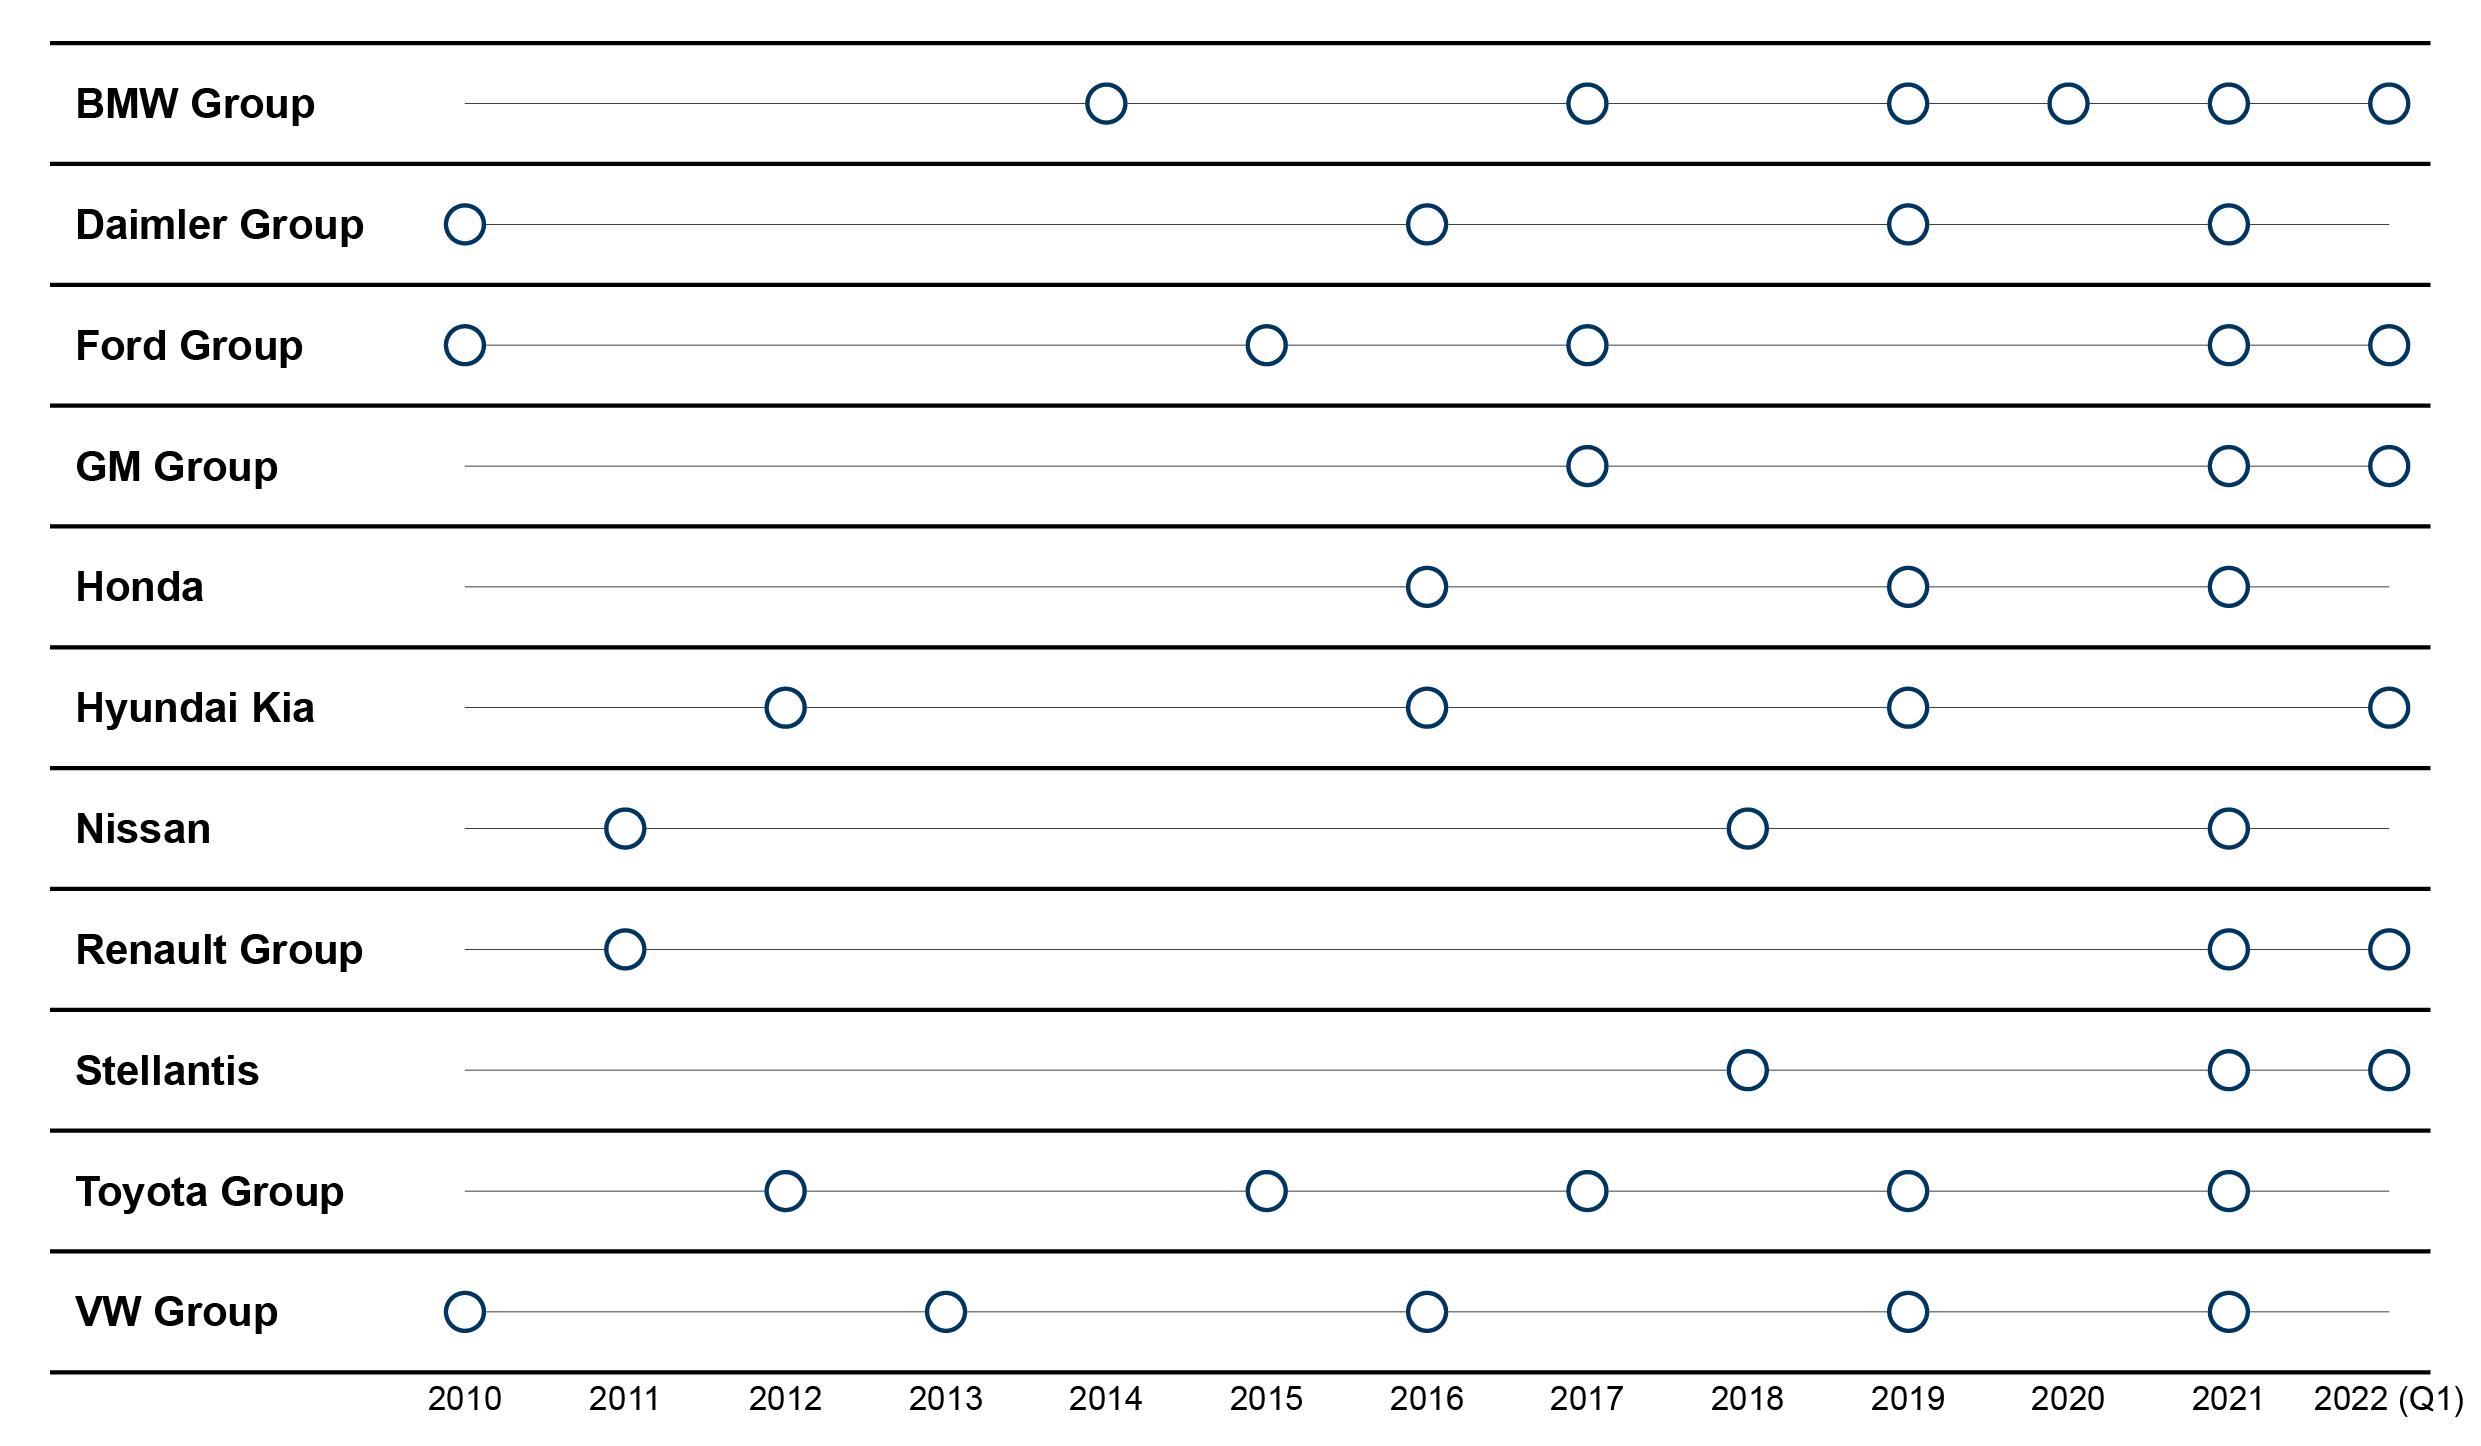
In recent years, automakers have been progressively fleshing out business strategies that consider electrification not only as a way to comply with policy regulations or respond to government incentives, but also as an opportunity to capture market share and maintain a competitive edge. Looking forward, one can expect increasingly aggressive pricing and the development of a wider range of models. In some market, the combined ambitions of OEMs are more ambitious than government announcements (see Chapter 3).
In 2021, several major automakers have announced plans to accelerate the transition to a fully electric future by developing new product lines as well as converting existing manufacturing capacity. Key examples include:
Toyota, the world’s largest car manufacturer, announced the roll-out of 30 BEV models and a goal of reaching 3.5 million annual sales of electric cars by 2030. Lexus aims to achieve 100% BEV sales globally in 2035.
Volkswagen announced that all-electric vehicles would exceed 70% of European and 50% of Chinese and US sales by 2030, and that by 2040, nearly 100% should be zero emissions vehicles.
Ford expects one-thid of its sales to be fully electric by 2026 and 50% by 2030, building on the success of its F-150 electric model, and to move to all-electric in Europe by 2030.
Volvo committed to becoming a fully electric car company by 2030.
Geely targets around 30% of electric cars in sales by 2025.
BMW aims for 50% of its vehicles sold to be fully electric by 2030 or earlier.
Mercedes announced that from 2025, all newly launched vehicles will be fully electric.
General Motors aims for 30 EV models and for installed BEV production capacity of 1 million units in North America by 2025 and for carbon neutrality in 2040.
Stellantis targets 100% of sales in Europe and 50% of sales in the United States to be BEVs by 2030.
Hyundai targets sales of 1.9 million BEVs annually by 2030 to secure a 7% global market share, and to end sales of ICE vehicles in Europe in 2035.
Kia aims to increase sales of BEVs to 1.2 million in 2030.
In China, some automakers are adjusting to reflect the goal of carbon peaking by 2030. Dongfeng plans to electrify 100% of its new models of main passenger car brands by 2024. BYD announced that it would only produce BEVs and PHEVs from April 2022 onwards.
Fuel cell electric vehicles (FCEVs) are zero emissions vehicles that convert hydrogen stored on-board using a fuel cell to power an electric motor. Although FCEV cars have been commercially available for about a decade, registrations remain more than two orders of magnitude lower than EVs. This is in part because hydrogen refuelling stations (HRS) are not widely available and unlike EVs, FCEVs cannot be charged at home. In addition, few commercial FCEV models are available, and high fuel costs and purchase prices result in a higher total cost of ownership than EVs.
Governments have funded, either fully or partially, the construction of HRSs to enable the deployment of FCEVs, including public buses and municipal trucks as well as cars. Today there are about 730 HRSs globally providing fuel for about 51 600 FCEVs. This represents an increase of almost 50% in the global stock of FCEVs and a 35% increase in the number of HRSs from 2020. Over 80% of the FCEVs on the road at the end of 2021 were LDVs with the majority being passenger cars. Buses and trucks each constitute almost 10% of global FCEV stock.
In 2021, Korea maintained the lead in FCEV deployment, with over 19 000 vehicles (almost double the stock at the end of 2020). The United States has the second-largest stock of FCEVs, increasing from about 9 200 at the end of 2020 to 12 400 at the end of 2021.
Together, Korea and the United States represent over 60% of global FCEV stock, though only a quarter of refuelling stations with 114 stations in Korea and 67 in the United States.
China has the largest fleet of both fuel cell buses and trucks, with a combined stock of more than 8 400 vehicles. China accounts for almost 90% of fuel cell buses worldwide and over 95% of fuel cell trucks.
Fuel cell electric vehicle stock, 2021
IEA. All rights reserved.
Notes: FCEVs = fuel cell electric vehicles (shown in the outer ring); HRS = hydrogen refuelling station (shown in the inner ring). PLDVs = passenger light-duty vehicles; LCVs = light commercial vehicles; RoW = rest of the world.
Source: IEA analysis based on data submission of the Advanced Fuel Cell Technology Collaboration Program (AFC TCP)
Registrations of electric buses and heavy-duty trucks increased in 2021 in China, Europe and the United States. Sales of electric buses increased 40% over the previous year even as the global bus market remained roughly constant. Global sales of electric medium- and heavy-duty trucks more than doubled over 2020 volumes, while total sales volumes remained at roughly the same level as the previous year. Electric medium- and heavy-duty truck sales totalled more than 14 200 in 2021, which represents less than 0.3% of the total number of registrations for medium- and heavy-duty vehicles worldwide.
In 2021, the global electric bus stock was 670 000 and electric heavyduty truck stock was 66 000. This represents about 4% of the global fleet for buses and 0.1% for heavy-duty trucks.
As in previous years, China dominates the electric bus market and new registrations continue to increase. However, sales of electric buses since about 2018 in the United States and throughout Europe have been chipping away at this dominance of the global market. India is finalising a tender for more than 5 500 electric buses, which should turn it into one of the world’s largest markets for electric buses.
The increase in electric bus sales in countries such as France, Germany, Spain and United Kingdom can be attributed to national
and/or city-level targets to transition to public procurement of only zero emissions buses, as well as to the EU Clean Vehicles Directive for member states.
China accounted for nearly 90% of electric truck registrations in 2021, down from nearly 100% in 2017. Sales in the United States and Europe have begun to rise rapidly in the past few years, driven by an increase in available models in those markets, policy support, rapidly improving technical viability and economic competitiveness of electric trucks in certain applications.
Electric bus and truck registrations and sales shares by region, 2015-2021
IEA. All rights reserved.
Notes: Other = Australia, Brazil, Canada, Chile, Korea, India, Indonesia, Japan, Mexico, South Africa, Thailand, Malaysia and New Zealand. Electric bus and truck registrations and stock data can be interactively explored via the Global EV Data Explorer
Sources: IEA analysis based on country submissions, complemented by ACEA; EAFO; EV Volumes.
The availability of electric heavy-duty vehicle (HDV) models continues to expand across all leading global markets. 2 According to the “beachhead model” of zero emissions HDV adoption, market expansion in heavy-duty segments and duty cycles where economics and supportive policy have already given EVs a strong basis for market growth, such as transit buses, can help to build manufacturing capacity, supply chains and technology transfer of key components of electric powertrains for subsequent waves of electrification. Initial deployment of HDVs in such applications can also build confidence in and familiarity with the faster charging needs and grid capacity which subsequent, HDV duty cycles depend.
The first step in EV adoption in the HDV segment will be successful deployment and proof of economic benefits and societal benefits (e.g. reduced noise and air pollution) in early applications. Subsequent roll out will build upon the operational experience, technology advances and infrastructure to deploy zero emissions HDVs in return-to-base operations such as urban delivery vans, shuttle and school buses, and garbage trucks. The aim is to make even longer distance applications with higher overall daily energy storage needs, such as regional and long-haul freight, competitive and convenient, and to increase their payloads as well as their flexibility and autonomy of operations. Commercialisation patterns of HDVs by segment clearly
2 Electric HDVs data were provided by CALSTART from their Global Drive to Zero’s
database, which is regularly updated and offers a detailed glimpse of
illustrate the progress across typical stages of technology development. They also show the steadily increasing range of models available in each segment.
Depot charging, which keeps costs down by charging (often overnight) at slow but sufficient speeds, is the common method used for commercial vehicles, regardless of duty cycle and application. Provision of high speed opportunity charging along routes may be necessary for applications with longer but regular routes or predictable operations, such as shuttles and public transit or school buses. Applications with highly variable routes, like urban delivery vans, may also benefit from charging on publicly available chargers in cities, e.g. while drivers take a break.
Very fast charging on highways will be needed to provide flexibility and autonomy for regional and long-haul electric trucks. Given the high construction and grid integration costs, the business case for very fast charging infrastructure of more than 350 kilowatts (kW), or even more than 1 megawatt (MW), may be uncertain, especially in the initial years of electric HDV market deployment. This uncertainty coupled with long lead times and investment requirements needed for HDV megawatt charging capacity along transport corridors are
challenges (see Chapter 5). Policies and measures to support the development of charging networks, may have an important influence in the timely roll out of charging infrastructure for EVs including HDVs. Strategic planning is required to optimise the design and development to be compatible with HDV operational needs. Co-ordinated roll out will need to focus first on the most heavily used freight corridors.
Other options to provide power to electric HDVs are battery swapping and electric road systems. Pilot programmes for battery swapping are underway by various companies in China, e.g. CATL, Foton New Energy Vehicle, Geely, China Energy Investment Corporation and Qiyuan Motive Power. These trials include battery swapping operations for fleets numbering from tens to low hundreds in heavyduty short-distance operations such as urban and regional delivery. A central government direction to pilot battery swapping across eight cities include three that aim to focus on swapping for HDVs and the ambition to scale up the number of trucks using battery swapping into the thousands in the coming few years. By early 2022, 159 new truck models on the Chinese market have battery swapping capabilities.
Electric road systems can transfer power to a truck either via inductive coils 3 in a road, or through conductive connections between the vehicle and road, or via catenary (overhead) lines. Catenary and other dynamic charging options may be promising from the perspective of competing favourably in terms of total capital and
operating costs This is in comparison, with very fast highway charging in which the key determinants of competitiveness are the costs and capacities of batteries for HDVs and the volume of freight traffic. By enabling charging-on-the-move, catenary systems could support operational flexibility of logistics operators.
Field trials of catenary systems installed by Siemens with Scania trucks have been used in real transport operations on motorways since 2016. Currently three systems of 13 km length are used by 15 trucks. Germany has announced innovation clusters that aim to roll out hundreds of kilometres of motorway equipped with catenaries, used in combination with stationary charging and refuelling. The United Kingdom aims to trial a catenary system for heavy-duty trucks. A few European countries, e.g. France and the Netherlands, have commissioned studies on the economic viability and environmental impacts of electric road systems. Catenary or other dynamic charging solutions also have the advantage of functioning on any zero emissions powertrain system (i.e. PHEV, BEV or FCEV) equipped with a pantograph or other on-board power transfer components.
3 Inductive solutions are further from commercialisation and face challenges to deliver sufficient power to trucks operating at highway speeds.

Current and announced zero emissions commercial vehicle models by type, release date and range, 2019-2023
IEA. All rights reserved.
Notes: Data are derived from CALSTART’s Zero Emission Technology Inventory. Although the inventory is continuously updated, this snapshot may not be fully comprehensive due to new model announcements and small manufacturers not yet captured in the inventory. ZEVs include BEVs, PHEVs and FCEVs. “Other” includes garbage, bucket, concrete mixer, mobile commercial and street sweeper trucks. The HD and step van figure includes announced models for 2023.
Sources: IEA analysis based on the Global Drive to Zero ZETI tool database.

IEA. All rights reserved.
Notes: Arithmetic return = sum of quarterly returns on a given stock (capital gains and dividends). The highlighted area in red represents a credit crisis. The highlighted area in blue represents a recovery period of capital markets followed by the Covid-induced credit shock in Q1 2020 Weekly financial performance of selected EV and battery companies plotted against the top-ten automakers and the broader public equity market benchmark, MSCI All Country World Index (ACWI) at an index level. All indices except MSCI ACWI are equalweighted, giving equal importance to each constituent company regardless of its market capitalisation. The EV index consists of 14 pure-play EV companies and the battery index consists of seven battery manufacturing companies. The stock financial performance and market capitalisation do not necessarily reflect the actual operational profits or losses of a company but inform on investors views and expectations of future returns.
Sources: IEA analysis based on Bloomberg Terminal (2022).
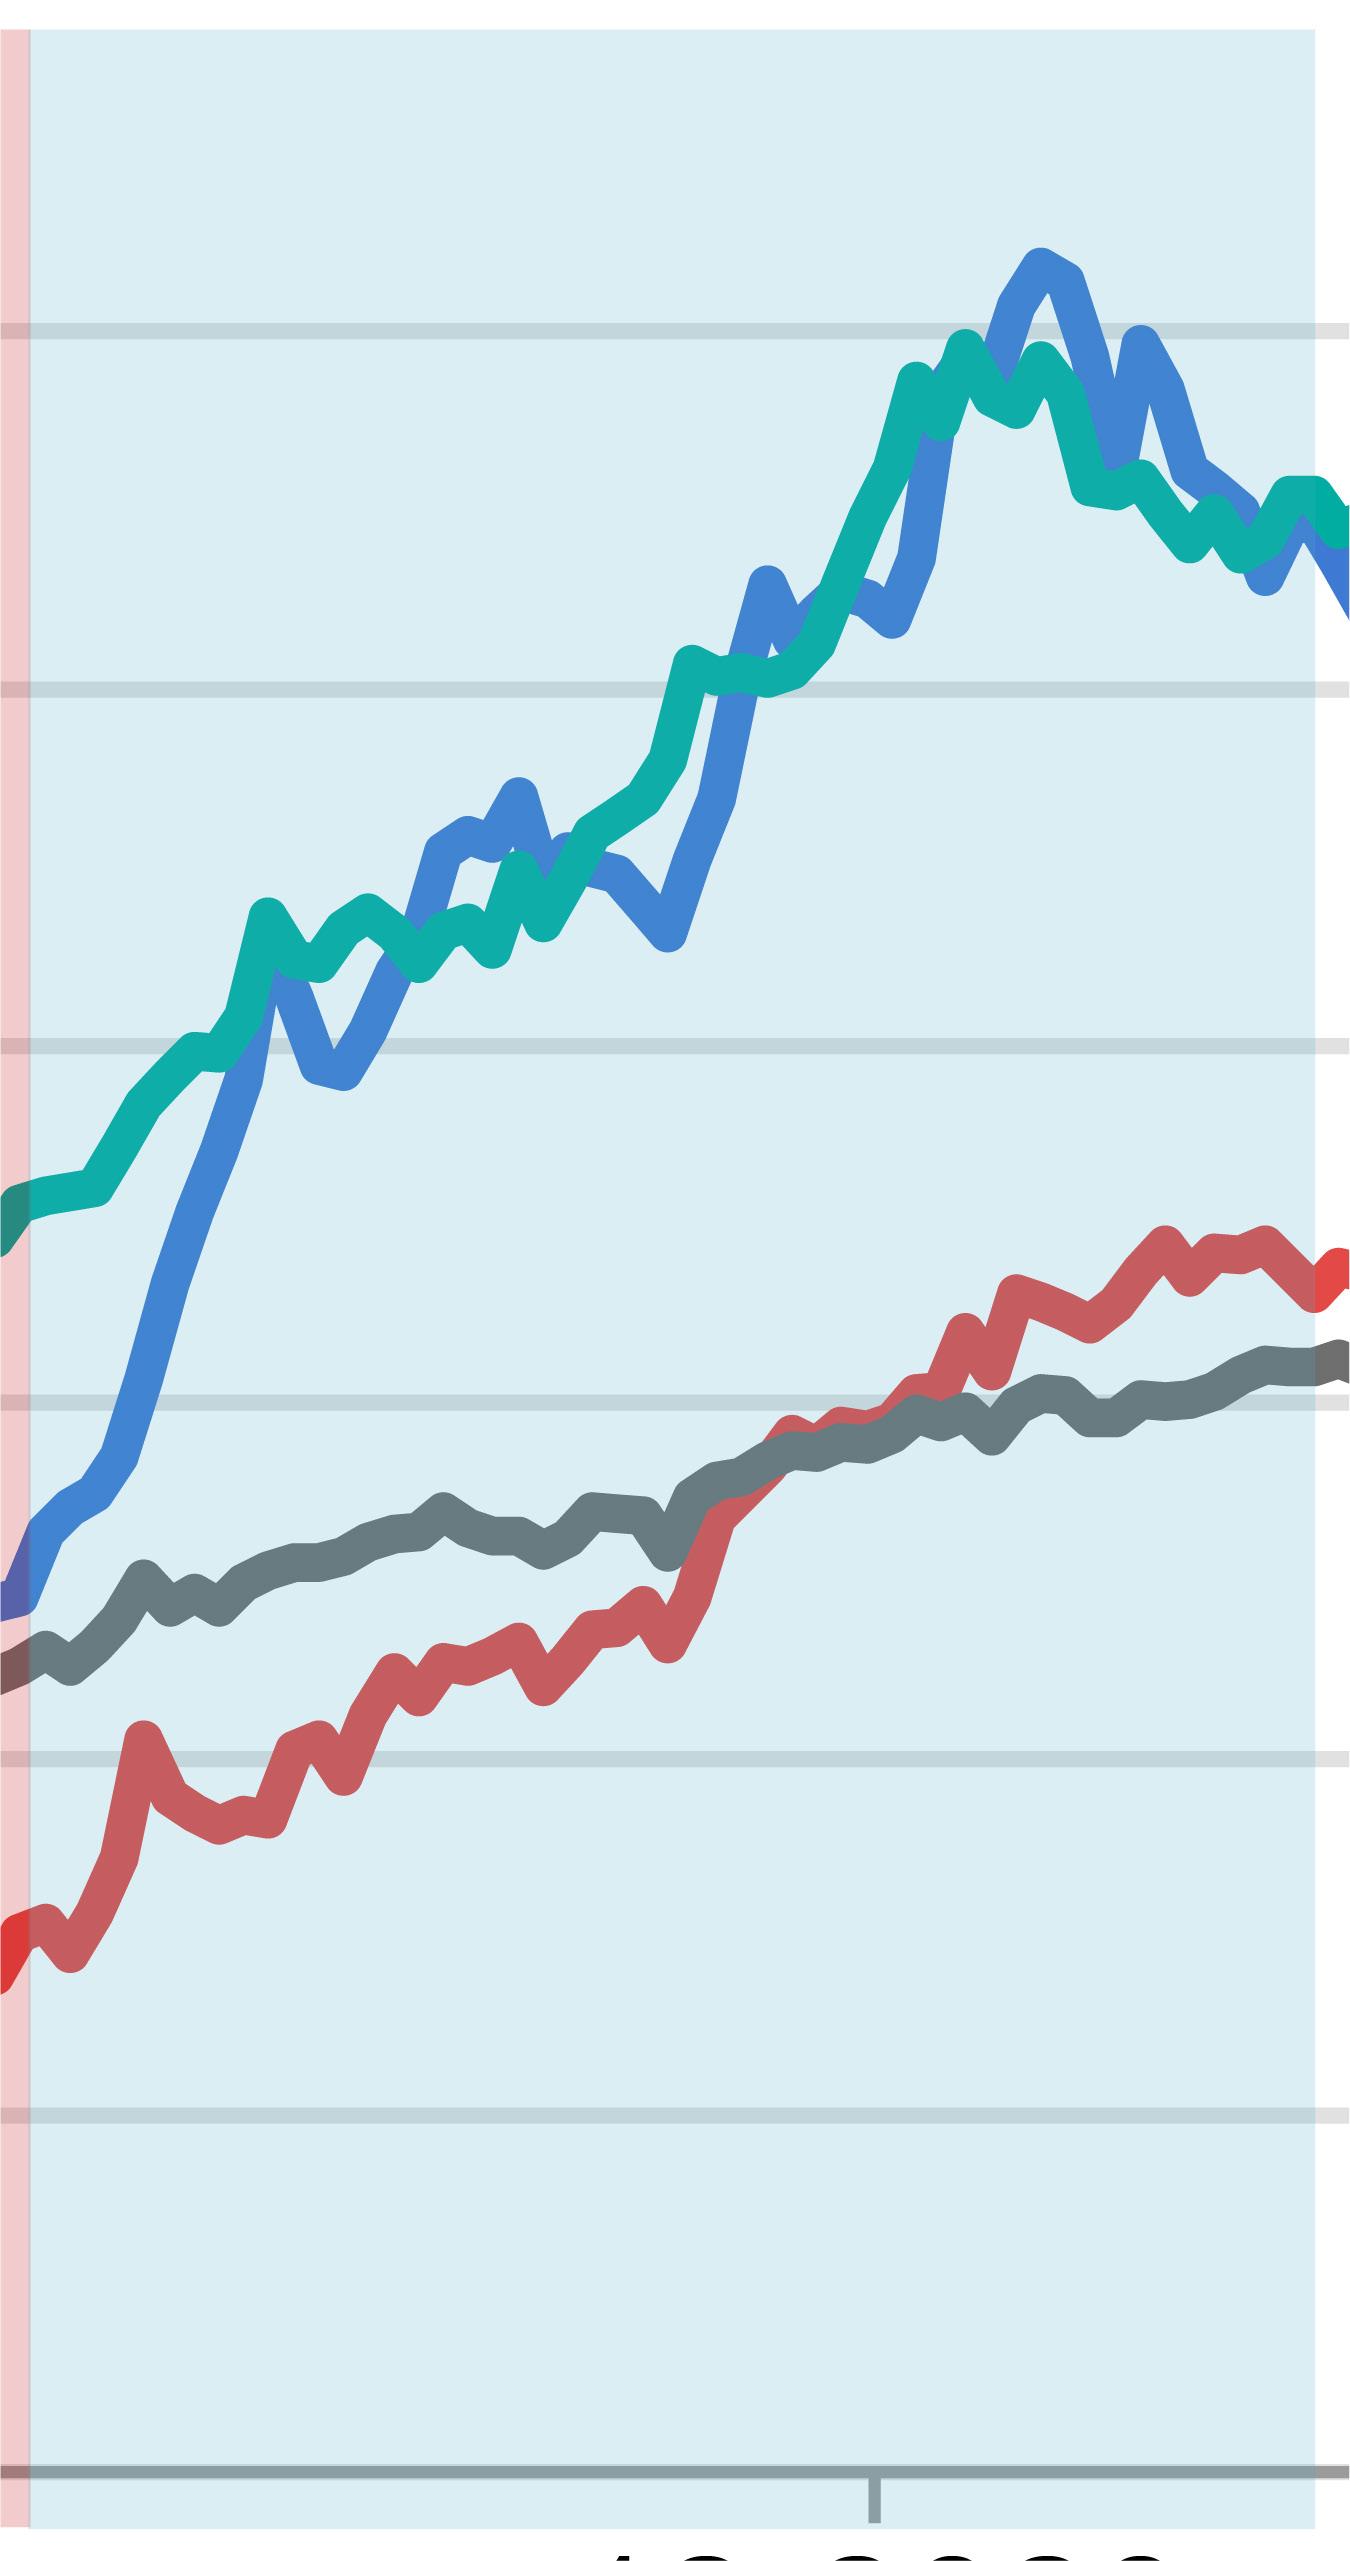
In the last two years, financial markets have amply rewarded EV and battery companies. Until 2020, the financial performance of EV stocks did not show a significant difference at portfolio level 4 with other automakers and was in line with overall market performance. At the close of 2019, the total market capitalisation of the selected 14 EV stocks stood at about 13% that of the top-ten vehicle manufacturers, and the EV index was slightly lower as well.
Since 2020, both the EV and battery indices have outpaced that of the top-ten automakers as well as the broader market benchmark. The Covid-19 crisis negatively affected all indices, but the pace of recovery varied. In the first half of 2020, the EV and battery indices recorded robust growth 70% and 40% respectively. This period coincides with announcements of green recovery packages and net zero pledges in major vehicle markets, establishing the EV as a future mode of transport in Europe, Japan and Korea, among other regions. At the close of 2021, the market capitalisation of EV manufacturers was 60% higher than that of the top-ten automakers combined. Such high levels can be primarily attributed to Tesla, which accounts for 80% of the total market capitalisation of 14 pure-play 5 EV companies.
In 2021, the EV and battery indices at hand remained above that of automakers and the broader market. The battery index outperformed
4 The financial performance at an equally weighted portfolio level tracks the average financial return on each selected stock regardless of market capitalisation at a given time.
that of EVs, reflecting the increasing importance of battery supply chains in major auto markets. The observed decline in returns for the EV index can be attributed to increased competition in passenger vehicle EV markets from traditional automakers. In 2021, the majority of the top-ten automakers expanded their EV businesses, making it more difficult to draw a sharp distinction between the pure-play EV makers and the top-ten automakers. This could have led environmental, social, and governance conscious investors to divert their investments from pure-play EV makers to a broader portfolio of auto manufacturers. OEMs are considering introducing their EV activity through separate initial public offerings in an effort to benefit from the higher market capitalisation enjoyed by pure-play EV makers. Financial markets believe that the future is electric.
Current market valuations for pure-play EV makers are significantly higher than for traditional OEMs relative to the number of vehicles produced. Tesla stands at USD 1.1 million for every vehicle sold in 2021, while NIO and Xpeng have between around USD 0.4-0.6 million. Incumbent automakers stand much lower, ranging at around USD 0.01-0.04 million. However, most EV manufacturers lag behind in terms of profitability, with many reporting marginal or negative return on total assets.
The high valuation of stocks could indicate that pure-play EV makers have comparatively easier access to capital from public equity markets. This allows EV companies to expand production and R&D facilities, thus increasing the overall capital expenditure on road transport electrification. On these grounds, high valuations could reflect that investors believe that EV-focussed automakers will capture significant market share, become profitable and provide high financial returns in the future. This implied vision of the future of the automotive sector is in line with a rising number of government plans for the decarbonisation of road transport.
One of the key factors underpinning this surge in valuations is that investors are seeking more sustainable and climate-friendly investments. The role of government policy and regulation in providing positive market signals to investors is critical. The EU taxonomy for sustainable activities, introduced in 2020, which includes the manufacturing of EVs and batteries, was an important step to guide investors towards low-carbon industries (see Chapter 2).
Companies included in the EV, battery and top-ten automaker indices
EV index Battery index
• Tesla
• Lucid Group
• Rivian Automotive
• NIO
• Li Auto
• XPeng
• Fisker
• Nikola
• Arrival
• Proterra
• Lion Electric
• Hyzon Motors
• Canoo
• Hyliion Holdings Corp
• LG Energy Solution
• BYD
• Contemporary Amperex Technology Ltd
• Samsung SDI
• Gotion High-Tech
• Eve Energy Co
• Farasis Energy
Gan Zhou
Top-ten automaker index
• Toyota Motor
• Volkswagen
• Kia
• General Motors
• Ford Motor
• Nissan Motor
• Stellantis
• Renault
• Hyundai Motor
• Mercedes-Benz Group
Publicly accessible LDV charging points by power rating and region, 2015-2021
IEA. All rights reserved.
Notes: Values shown represent number of charging points.
Sources: IEA analysis based on country submissions.
As EV markets swell, access to public charging will need to expand as well. Today most EV charging takes place at residences and workplaces. Consumers will increasingly expect the same services, simplicity and autonomy for EVs as they do for conventional vehicles.
Publicly accessible chargers worldwide approached 1.8 million charging points 6 in 2021, of which a third were fast chargers. 7 Nearly 500 000 chargers were installed in 2021, which is more than the total number of public chargers available in 2017. The number of publicly accessible chargers was up by 37% in 2021, which is lower than the growth rate in 2020 (45%) and pre-pandemic roll out rates. The average annual growth rate ranked almost 50% between 2015 and 2019. In 2021, fast charging increased slightly more than in 2020 (48% compared with 43%) and slow charging much slower (33% compard with 46%).
As in previous years, China is the global leader in number of publicly available chargers. It counts about 85% of the world’s fast chargers and 55% of slow chargers. This reflects China’s demonstrated
leadership in the EV sector as well as its very densely populated urban characteristics.
In 2021, installed slow chargers in China increased by 35% to about 680 000 publicly accessible units, more than four times the number of slow chargers available in 2018. However, growth has been much slower in the pandemic period than in previous years. Between 2015 and 2020, the average annual growth rate was over 60%.
Europe ranks second with over 300 000 slow chargers in 2021, a 30% year-on-year increase. The Netherlands leads in Europe with more than 80 000 slow chargers, followed by 50 000 in France, 40 000 in Germany, 30 000 in the United Kingdom, 20 000 in Italy and just over 12 000 in both Norway and Sweden. The stock of slow chargers in the United States increased by 12% to 92 000 in 2021, the slowest increase among major markets. In Korea, it increased by nearly 70% to over 90 000.
6 Charger values refer to charging points, i.e. the number of sockets that can charge vehicles at the same time. One charging location can have several charging stations, which in turn can have several charging points.
7 Fast chargers are more than 22 kW and can server LDVs with power ratings of up to 350 kW. Slow chargers are less than or equal to 22 kW.
Publicly accessible fast chargers facilitate longer journeys. As they are increasingly deployed, they will enable longer trips, encourage consumers that lack access to private charging to purchase an EV, and tackle range anxiety as a barrier for EV adoption.
Fast charging is being rolled out at a faster pace than slow charging in China, where fast charging installations (power rating >22 kW) increased by over 50% to 470 000 fast chargers in 2021, which is more than the 44% rise in 2020, but slower than the 93% high of 2019. In China, over 40% of publicly available charging units are fast chargers, well above other major EV markets. The drivers behind rapid deployment of public chargers in China are government subsidies and active infrastructure development by public utilities. With regulatory controls on electricity prices, public charging demand coming from urban dwellers as well as increasing electrification of taxis, ride-sharing and logistics fleets have improved the profitability of EV charging businesses. The massive speed and scale of EVSE roll out led to reductions in the costs of manufacturing charger modules for fast charging stations by 67% between 2016 and 2019.
In contrast to 2020, when Europe’s fast charging installations significantly outpaced slow charging ones, installations were about the same in 2021. The number of public fast chargers in Europe was up by over 30% to nearly 50 000 units. This includes 9 200 public fast chargers in Germany, 7 700 in the United Kingdom, 6 700 in Norway, 4 500 in France, 2 600 in Spain and in the Netherlands. The United
States counts about 22 000 fast chargers, of which nearly 60% are Tesla superchargers. Korea has 15 000 fast chargers, 50% more than in 2020.
Electric LDV per charging point in selected countries, 2010-2021
Charging point per BEV relative to the BEV LDV stock IEA. All rights reserved.
Notes: Charging points include only publicly available chargers, both fast and slow. In the right graph, each dot represents the combination of a given year and country between 2015 and 2021, except for Norway where the period is 2011 and 2021.
Source: IEA analysis based on country submissions.
In 2021, sales more than doubled to bring the total fleet of electric cars to about 16.5 million, a tripling relative to the stock in 2018. Meanwhile, the number of publicly available charging points also tripled to about 1.8 million. Current momentum in EV sales can only be sustained if ever larger shares of the population have access to convenient and affordable charging infrastructure, both publicly available and private chargers at residences and workplaces, among other destinations. Governments will have to continue facilitating investment and minimising barriers to the roll-out of charging infrastructure.
As the number of EVs on the road increases, the EV-per-charger ratio can help assess the suitability of the charging network. The charger power (kilowatts [kW]) per EV is an essential metric, since fast chargers can serve a higher number of EVs compared to slow chargers. The suitable number of charger per EV depends on a number of factors, including: housing stock, average distance travelled and population density. PHEV users require less public charging than BEVs. Therefore, it is not trivial to determine a suitable availability metric.
For most countries, we observe that as the stock share of BEVs increases, the ratio of charging point per BEVs decreases. Similarly,
countries with relatively small EV stocks tend to have low EV to charger ratios as initial infrastructure deployment may precede EV sales.
The EV per charging point ratio remained relatively flat over the 20152021 period at under 10 EVs per charging point in China, Korea, and the Netherlands. This reflects charging infrastructure deployment that matches the speed of EV stock growth. In the United States, the number of EVs on roads outpaced the number of public charging points, with about 18 EVs per charging point in 2021. A similar trend is observed in Norway, where there were only a handful of EVs per charging unit in the early 2010s versus around 29 by 2021. Both the markets in Norway and United States are characterised by widespread reliance on home charging, due to the high share of single family dwellings (with garages) by international standards. It appears that in countries that rely more heavily on public charging, the charging network is expanding accordingly, while for countries with high shares of residential charging, fewer public chargers can serve a higher number of EVs. As the market evolves and more consumers replace conventional vehicles with EVs, even in countries with high shares of single family dwellings, the reliance on public charging solutions will increase.
In the European Union, the 2014 Alternative Fuel Infrastructure Directive (AFID) regulates the deployment of public electric vehicle supply equipment. The policy recommended that EU member states reach 10 electric light-duty vehicles (LDVs) per public charger by 2020. Proposed new EU legislation (the Alternative Fuelling Infrastructure Regulation [AFIR]) would mandate 1 kW of publicly available charger per BEV and 0.66 kW per PHEV as well as the minimum public charger coverage on highways (see Chapter 2).
In 2021, the European Union’s average EV to charger ratio was 14, up from nearly 11 in 2020 and above the recommendation of 10
The average kW per EV ratio was just above 1 kW, which is the level proposed in the AFIR for 2030. Some countries have performed better than others in meeting targets, such as the Netherlands (5 and 2.6 kW per EV ratio) which followed a wide, on demand, slow charger deployment strategy. In fact, the share of fast chargers remains generally low at around 3% in the Netherlands. Italy roughly meets the recommended charger ratios (11 EVs per charger), mostly due to slow charger availability In Norway, the ratio is 34 EVs per charger and 0.7 kW per EV in 2021, but fast chargers account for nearly 35%.
There are promising prospects in Spain, which had 20 EVs per charger and 1.2 kW per EV and over 30% of fast charging in 2021, with an EV fleet now larger than Denmark’s. The largest markets in
Europe – France, Germany and United Kingdom – all do not meet the European Union’s recommended charger availability recommendations
The worldwide average in 2021 was 10 EVs per charger and 2.4 kW per EV. China’s market is pulling the global averages downwards with 7 EVs per charger and 3.8 kW per EV, along with 40% of fast charging.
Number of electric LDVs per charging point EV/EVSE (bottom axis)
kW/EV (top axis)
IEA. All rights reserved.
Notes: The line refers to the AFID for 2020 and the proposed AFIR target for 2030. Kilowatts per EV are estimated assuming 11 kW for slow and 50 kW for fast chargers Official national metrics might differ from these values as they can rely on more granular data.
Source: IEA analysis based on country submissions
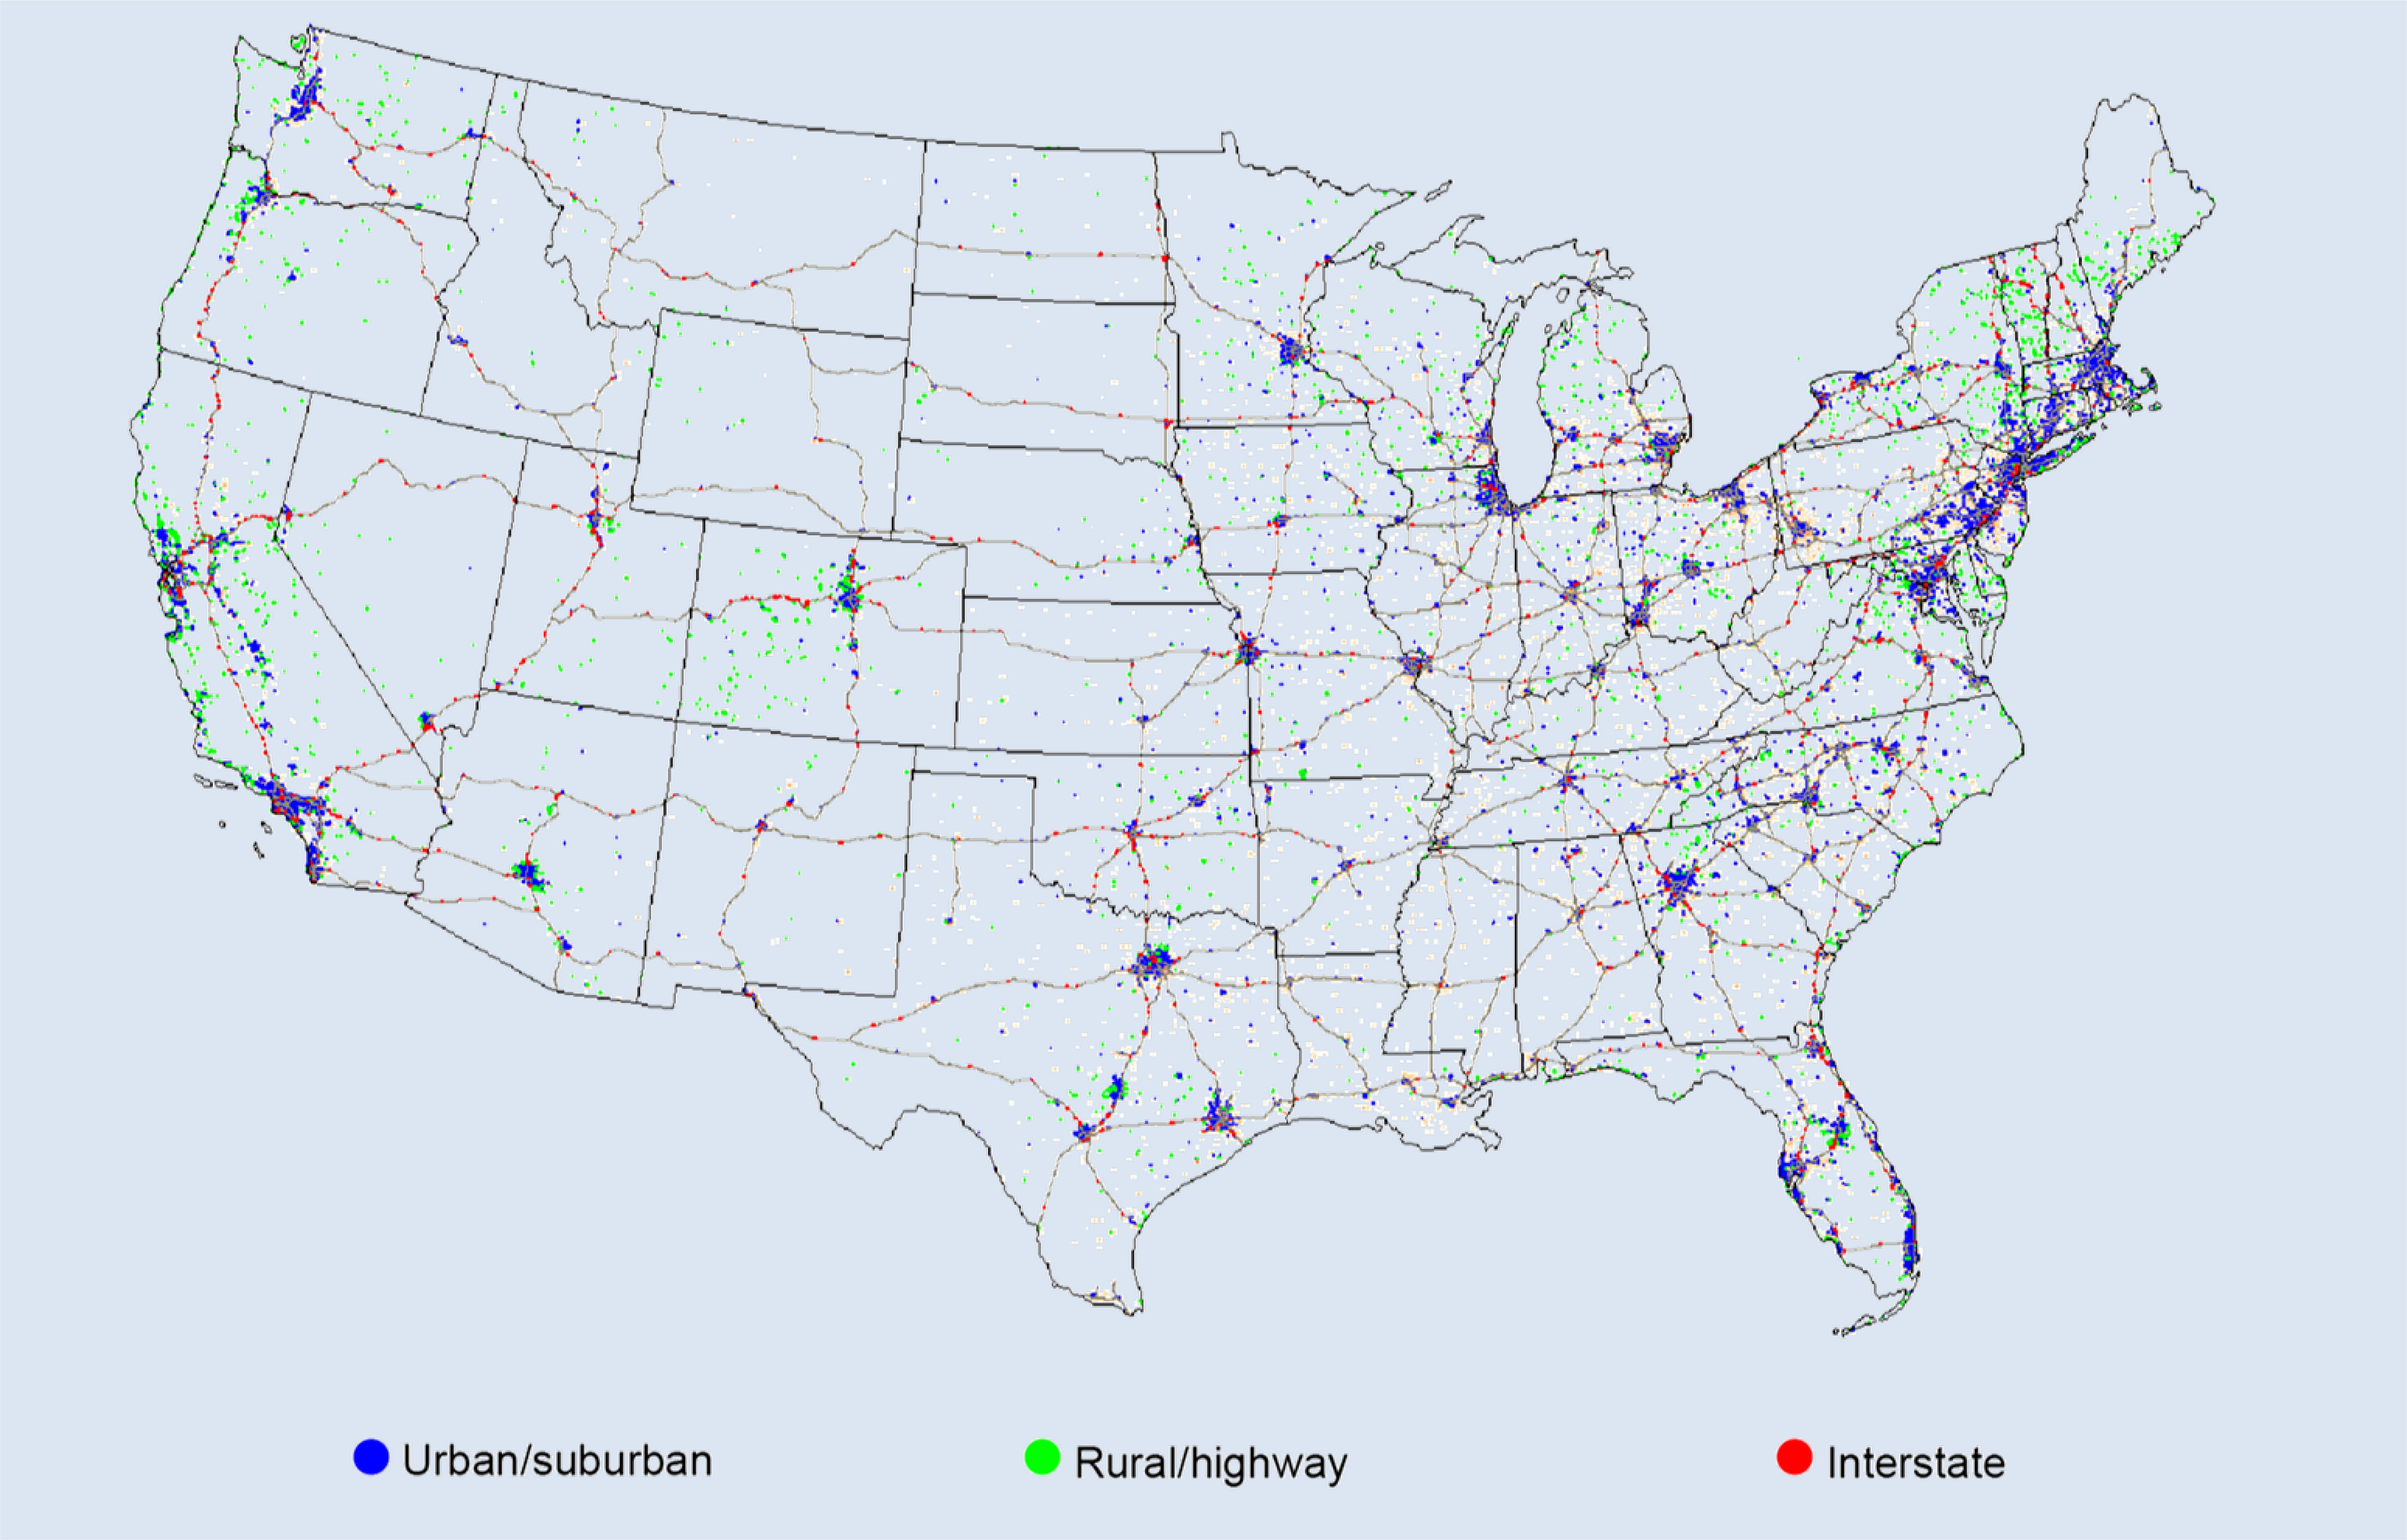
The Alternative Fuels Data Centre lists almost 50 000 EV charging stations currently in operation in the United States. Of these, 93% are publicly accessible, and 17% are on non-urban roads (including highways and other arterials). A disproportionate share of direct current (DC) fast chargers are public (99%) and located on highways (25%), reflecting the faster charging needs at these locations.
About 6% of charging stations are located along the interstate highway system, the backbone of the national road network. Stations along the interstate highways account for 16% of the total number of DC fast charging points. About 8% of the US population lives more than 10 km from a public charging station. Bringing this share down to less than 5% would necessitate building an additional 1 185 stations; bringing it down to zero would require building more than 5 000 additional stations.
Notes: Numbers are rounded to the nearest hundred. Shares, in italics, are based on non-rounded numbers and given out of totals for each category (by column). Shares do not add to 100% as sets of highway and interstate chargers are each subsets of public chargers. Total station counts include those mapped by the Alternative Fuels Data Center, which include some non-public charging stations, many of which are owned by federal, state or municipal governments, or other public institutions (e.g. hospitals) or businesses (e.g. car dealers).
Sources: IEA analysis based on AFDC API.
Source: IEA analysis based on the AFDC API.
EV charging stations in the contiguous United States, 2022
IEA. All rights reserved.
Policy developments for electric vehicles (EVs) in 2021 are highlighted in this section by countries and vehicle category, and those that influence the deployment of EV charging infrastructure. The Global EV Policy Explorer tracks key policies and measures that support the deployment of electric vehicles 8 and zero emissions vehicles 9 (ZEVs) for light-duty and heavy-duty vehicles.
In 2021, there was an unprecedented increase in electric cars with about 16.5 million on the world’s roads, up from 10 million in 2020. Governments heightened their policy focus on electrifying road transport in 2021 and put forward tangible milestones to stimulate emissions reductions to meet net zero emissions targets. In addition to a focus on ambitions 10 and targets 11 for ZEVs and bans on internal combustion engine (ICE) vehicles, governments triggered policy tools to accelerate the deployment of strategic EV charging infrastructure and to secure resilient EV supply chains (see Chapter 4). Based on 2021 sales volumes, about 25% of the global car market is subject to a 100% ZEV sales ambition or target, or ICE ban by 2035 according to government announcements. One path forward to reach net zero
– the IEA’s Net Zero Emissions by 2050 Scenario – would require all car markets to have 100% ZEV sales by 2035.
China, the leading EV market, progressively decreased subsidies for new energy vehicles (NEV) 12 as sales reached 16% in 2021 – more than tripling from 5% in 2020. China recently announced an ambition to develop sufficient charging infrastructure to meet the needs of 20 million NEVs by 2025. It also set guidelines to strengthen the management of its rapidly expanding lithium-ion battery industry, including minimum production requirements prior to expanding capacity, minimum technical battery performance standards, plant operating conditions and land development requirements.
In the United States, also a key EV market, the federal government announced its first targets that include 50% EV sales by 2030 and 500 000 public chargers. The targets are underpinned by existing incentives, and new funding packages of USD 7.5 billion to build charging infrastructure and USD 3 billion for advanced battery supply chains in the Infrastructure Investment and Jobs Act.
8 Electric vehicles include battery electric vehicles (BEVs) and plug-in hybrid vehicles (PHEVs).
9 Zero emissions vehicles include BEVs, PHEVs and fuel cell electric vehicles.
10 Ambitions are unofficial government goals or objectives set out in a policy document such as a deployment roadmap or strategy.
11 Targets are official government declarations set out in legislation, budgetary commitments, Nationally Determined Contributions to the Paris Agreement or national climate plans such as those submitted by member states to the European Union.
12 NEVs (China) include BEVs, PHEVs and fuel cell electric vehicles.
In the last year, Canada pushed forward the federal government’s target for achieving 100% zero emissions LDV sales to 2035 from 2040. Leading provinces (such as British Colombia and Quebec) scaled up their policy ambitions in response.
The Fit-for-55 package in the European Union brought forward a host of policy and stimulus measures to accelerate ZEV transitions. These include a proposal for 100% ZEVs by 2035 through its CO2 emissions standard and new mandated charging infrastructure deployment targets set under the Alternative Fuels Infrastructure Regulation proposal for both light-duty vehicles (LDVs) and heavy-duty vehicles (HDVs).
In 2021, Japan put forward a large funding package for EV purchase subsidies and charging following the doubling of its BEV purchase subsidies the previous year. Korea has almost tripled eligible funding compared to last year for slow chargers as well as extending its subsidies for EVs until 2025.
India, in 2021, extended its main EV demand stimulating FAME II policy to 2024. It also increased subsidies for electric two-wheelers and made budgetary commitments for battery swapping policies and the development of EV manufacturing and battery supply capacity.
Thailand and Indonesia aim to become leaders in EV markets in the region and to supply growing demand in other Asian countries. In 2021, Thailand, a new entrant in EV markets, announced ambitions of 30% of domestic vehicle production to be ZEVs by 2030 and 100%
of new vehicle registrations to be ZEVs by 2035. It also announced a package of incentives to promote EV deployment. Indonesia recently created a government-owned battery corporation that aims to build 140 gigawatt-hours (GWh) of battery capacity by 2030, of which 50 GWh will be for export. (Today’s global battery manufacturing production capacity is about 871 GWh).
In Latin America, Chile is an EV market leader. Its capital city, Santiago, boasts one of the largest electric urban bus fleets outside of China. Chile recently announced its National Electromobility Strategy, which sets enhanced ambitions to have 100% ZEVs in LDV sales by 2030 and 100% in public transport vehicles by 2035, as well as for long-distance trucks by 2045. Some cities in Colombia have established procurement programmes for electric buses to support national ambitions of 10% urban bus sales to be ZEVs by 2025 and 100% by 2035. Costa Rica provides tax and government procurement programme benefits to support its ZEV targets of 100% ZEVs in passenger LDV sales and 100% in all buses and taxis by 2050.
New EV market entrant countries are creating conditions to support electric mobility. Common measures provide tax benefits and cuts in customs duties for EVs and their components, such as in South Africa, Kenya, Rwanda, Egypt, Viet Nam and Malaysia. Some countries have also introduced transport sectoral targets.
IEA. All rights reserved.
Notes: In this figure, only countries and large regions that have 100% ZEVs in LDV sales ambitions (unofficial targets) in policy/strategy documents or announcements and those with internal combustion engine bans for LDV by 2035 encoded in law are represented. China, Japan and Israel have electrification targets for 2035, which include ZEVs (BEVs, PHEVs, FCEVs) as well as hybrid electric vehicles and therefore are not included in this figure. North America category here includes only Canada, California and New York (United States). Other Europe includes Norway, Iceland and United Kingdom. Shares of the global LDV market are based on 2021 LDV sales.
Sources: IEA analysis based on country submissions and Marklines. Sales data for California, New York, Iceland are from other sources
A 100% ZEV sales ambition/target by 2035 has been announced in 25% of today’s global LDV market; the Net Zero Scenario requires 100% ZEV in car sales by 2035
Global electric car sales broke records in 2021; more than doubling from volumes in 2020 even in the face of supply chain bottlenecks. Ambitious government policy announcements, strategies and budgetary commitments also characterised EV developments in 2021.
Government expenditure on subsidies for electric cars doubled in 2021 through a variety of policies to foster market uptake
Strong policy measures to boost nascent EV industries have been used over the years in some markets, e.g. China and European Union. Now some markets, such as China, Korea and United Kingdom, are steadily reducing per vehicle direct subsidies in recognition of the ongoing closing of the gap between the purchase price of electric and conventional cars, and to push auto manufacturers to lower costs. Others, such as the EU, are using regulatory measures such as tighter CO2 emissions standards. The European Union, India and Japan are increasing subsidies for EVs, in some cases as part of post-COVID19 recovery packages. In 2021, government expenditure on electric car subsidies almost doubledalmost doubled (see Chapter 1).
Governments announced more ambitious ZEV targets and policies in 2021 than ever before
Following the pathfinders for ZEV deployment, the number of countries that have announced some form of ZEV or electrification target increased significantly. Some employ a CO2 target which, in effect, would ban ICE cars by requiring zero tailpipe emissions, i.e., European Union. It has become increasingly clear that a growing number of countries have incorporated the electrification of cars and trucks as a key part of their strategy to reduce emissions as outlined in Nationally Determined Contributions or net zero targets.
Strategic direction and incentives provided by national and state governments can provide pivotal signals to shift investment to secure EV supply chains and for original equipment manufacturers to develop a wide variety of affordable ZEV car and truck models as manufacturing companies seek to meet stricter regulatory requirements and net zero commitments.
Cumulative number of government ZEV targets by region and type, 2010-2021
IEA. All rights reserved.
Notes: In this figure, the LDV markets of France, Germany, Ireland, Netherlands, Norway and United Kingdom are represented as Europe. North America represents the LDV markets in Canada and United States. Asia includes the LDV markets in China, India, Japan, Thailand and Indonesia. Announced targets and ambitions shown are for ZEVs in the light-duty vehicle market. There may be some ambiguity where announcements did not clearly specify the target vehicle segment.
Sources: IEA analysis based on government announcements.
• Share of global LDV sales in 2021: 2.0%
• Electric LDV market share in 2021: 5.5%
• Electric LDV year-over-year (YOY) increase: 71%
Canada’s Emissions Reduction Plan (ERP) 2030 contains key milestones that aim to meet its legally binding net zero by 2050 target. This includes a push to 2035 from the previous 2040 to achieve the 100% zero emissions LDV sales target, with interim targets of 20% ZEV sales by 2026 and 60% by 2030. The ERP aims to turn this target into a legally binding ZEV sales mandate. In March 2022, CAD 1.7 billion (USD 1.3 billion) was announced for incentives for ZEVs as part of the ERP.
To date, the federal government has invested more than CAD 1 billion (USD 769 million) to support ZEV deployment via infrastructure and purchase subsidies. In April 2022, the government increased its maximum vehicle price to allow for large ZEV cars such as SUVs, minivans and pick-up trucks, to be eligible for subsidies.
Previously at a flat maximum vehicle price of CAD 55 000 (USD 42 308), large ZEV cars, with a vehicle price of up to CAD 60 000 – 70 000 (USD 46 154 – 53 846), would be eligible to
receive subsidies. With increasing sales of SUVs occurring all over the world, higher sales of less efficient, electric SUVs rather than small electric cars would increase electricity demand for charging vehicles and also the demand for raw materials such as lithium, nickel and cobalt for batteries.
Leading provinces also continue to push ZEV deployment. For example, in British Columbia where ZEVs hold an 8% market share (2020), the provincial government aims to accelerate its ZEV mandate to 100% zero emissions LDV sales by 2035 (from 2040).
Quebec maintains a target to reach 100% zero emissions LDV sales by 2035, and aims to increase the stringency of its ZEV standard. Nova Scotia introduced a subsidy scheme in 2021 for ZEVs, along with Prince Edward Island, New Brunswick, and Newfoundland and Labrador.
• Share of global LDV sales in 2021: 0.4%
• Electric LDV market share in 2021: 0.2%
• Electric LDV YOY increase: 263%
In October 2021, Chile announced new ambitions to have 100% zero emissions LDV sales by 2035 complementing the existing ambition
of 40% ZEV stock by 2050. An initiative to promote the use of EVs for urban logistics within the Santiago Metropolitan Area was developed. Companies would be allowed to demonstrate pilot projects, with access to free charging and the use of a commercial LDV for eight weeks.
• Share of global LDV sales in 2021: 26.7%
• Electric LDV market share in 2021: 15.4%
• Electric LDV YOY increase: 183%
China extended its NEV subsidy scheme to the end of 2022, an extension from the previous expiry date of 2020, with a reduction in the base subsidy amount of 10%, 20% and 30% each year between 2020 and 2022. The range of purchase subsidies has steadily decreased over time. The intention is to gradually ratchet up standards on domestic technology innovation and promote the manufacturing and adoption of EV models that must meet increasingly stringent performance and efficiency targets to receive the subsidy, with a view to develop EVs for the export market. China’s subsidy scheme incentivises longer range battery electric vehicles
(BEVs) over time, with the effect that the average range of BEVs sold has increased by 50% since 2016.
Despite decreasing subsidies, EV sales in China have continued to increase, particularly in 2021. The sharp increase in sales may in part reflect a rush by consumers to qualify for subsidies before the end of the NEV subsidy programme, generating increased demand as well as other market-based reasons (see Chapter 1).
The 20% NEV by 2025 target was established in the Development Plan for the NEV Industry (2021-2035). Supporting regional five-year plans have followed suit. 13 Notably, several plans include targets to substantially increase the proportion of NEVs in car sales, while other features include targets to increase local production of NEVs across the auto manufacturing industry.
13 Regional FYPs include Beijing, Shanghai, Tianjin, Chongqing, Shandong, Guangxi, Ningxia, Guangdong, Guangzhou, Jiangsu, Zhejiang and Shaanxi
Driving range:
Subsidy vehicle price cap introduced
IEA. All rights reserved.
Notes: The subsidy values in this figure are derived by using base subsidy amounts according to electric drive range formula. The final subsidy amount is calculated via three multipliers: battery energy density; electric energy consumption; and ownership type. To derive the maximum subsidies shown in the figure, the battery energy density and electric energy consumption multipliers are assumed to be at their maximum for each year, ownership type is assumed to be private. Range categories of [> 80 km and < 150 km] and [≥ 150 km and < 200 km] are not displayed in this figure.
Sources: IEA analysis based on data from ICCT, 2017; ICCT, 2020; Zhou et al., 2020; ICCT, 2019; Ma et al. 2017.
• Share of global LDV sales in 2021: 14.6%
• Electric LDV market share in 2021: 14.8%
• Electric LDV YOY increase: 67%
The legally binding climate neutrality target to reach net zero emissions by 2050 was established in the European Climate Law A binding intermediate target aims to cut emissions by at least 55% by 2030 (relative to 1990 levels). The “Fit-for-55” package was launched in July 2021 and contains key proposals to meet the intermediate target for 2030.
The Fit-for-55 package includes a proposal by the European Commission to have more ambitious CO2 emissions standards (compared to current legislation). It would require fleet emissions reductions (from a 2021 starting point) of 55% for cars and 50% for vans by 2030, and 100% for both by 2035. This would effectively ban the sales of ICE vehicles from 2035, as it essentially mandates that all vehicles sold from that year produce zero tailpipe emissions (it excludes plug-in hybrids, which emit CO2 from the tailpipe). The proposal is currently sitting within the European Parliament awaiting approval, with negotiations ongoing.
There has also been significant policy progress among some EU member states, for instance including EV-related measures in
sustainable recovery components of Covid-19 economic stimulus packages. As part of a large recovery package announced in June 2020, Germany allocated funding for EV charging infrastructure deployment and battery development. Consequently electric car sales increased dramatically. It also increased government EV purchase/lease subsidies (now extended to the end of 2022) up to a maximum of EUR 9 000 (USD 10 647) (which includes EUR 6 000 (USD 7 098) from the government and EUR 3 000 (USD 3 549) from the manufacturer). The government’s portion of the subsidy will decrease over time until 2025 - EUR 4 000 (USD 4 732) in 2023 and EUR 3 000 (USD 3 549) in 2024. Subsidies for plug-in hybrid electric vehicles are likely to be scrapped at the end of 2022. Germany also offers beneficial tax rates such as benefit-in-kind of 0.25% for BEVs.
In Spain, pandemic-related recovery funding of EUR 400 million (USD 473 million) is being directed to EV incentive programmes as part of MOVES III Subsidies for ZEV purchases in Spain are maximised at EUR 9 000 (USD 10 647) (with scrapping). France experienced a significant increase in electric LDV sales in 2021, likely due to its ecological bonus programme which provides subsidies for ZEV purchases under its Covid-19 economic package, France Relance, which was extended to mid-2022 (although the subsidy level decreased from a maximum of EUR 7 000 to EUR 6 000 (USD 8 281 to USD 7 098) in mid-2021. Romania doubled the budget of its Rabla Plus programme, which offers purchase subsidies for BEVs and PHEVs.
• Share of global LDV sales in 2021: 4.2%
• Electric LDV market share in 2021: 0.4%
• Electric LDV YOY increase: 223%
India continues to move slowly on EV deployment compared with its other decarbonisation initiatives, e.g. its ambitious Intended Nationally Determined Contribution of 175 gigawatts (GW) of renewable energy capacity by 2022). Yet, India has been showing increasing promise with recent policy developments, such as the Faster Adoption and Manufacturing of (Hybrid and) Electric Vehicles
II (FAME II) scheme which was extended by the government from 2022 to the end of March 2024. The scheme was revised to include a 50% increase in purchase incentives for electric two-wheelers to Indian rupees (INR) 15 000 (USD 203) per kilowatt-hour (kWh) of battery capacity. Additionally, the limit on this incentive was relaxed from covering up to 20% of the purchase cost of a two-wheeler to 40%. The Ministry of Heavy Industries contracted with state-owned Energy Efficiency Services Limited to procure 300 000 electric threewheelers to spur government-led demand aggregation following the FAME II extension.
India had a little more than 1 million EVs on the road at the end of 2021, most of which were electric two/three-wheelers that account for less than 0.5% of all vehicles. FAME II is about halfway through its
expected programme life, yet has funded only around 10% of its target sales volumes. The recent FAME II modification may help address barriers to uptake by reducing upfront purchase cost and sparking innovation to provide broader EV model availability. The electrification of two-wheelers in India is seen as an opportunity to cost effectively electrify at scale, as it is the largest two-wheeler market in the world.
Nineteen states in India offer some form of policy support for EVs, such as purchase incentives, exemptions from road taxes, and subsidies for investment in battery manufacturing and related components. The states of Assam, Goa and Maharashtra recently introduced EV targets, policies and incentives. New Delhi, the capital, hosts the most ambitious EV targets in the country.
European Commission’s proposal for CO2 emission performance standards for cars and vas in the European Union, 2015-2040
IEA. All rights reserved.
Notes: NEDC = New European Driving Cycle (a testing procedure); PLDV = passenger light-duty vehicles; LCV = light commercial vehicles. The Fit-for-55 standards are proposed amendments to the regulation setting CO2 emissions standards for cars and vans on behalf of the European Commission. The proposal is currently sitting within the European Parliament awaiting approval, with negotiations ongoing.
Source: IEA analysis based on European Commission (2021)
• Share of global LDV sales in 2021: 6%
• Electric LDV market share in 2021: 1%
• Electric LDV YOY increase: 48%
Japan’s Strategic Energy Plan was approved to support its net zero by 2050 target. One of the major updates establishes 2030 targets for decarbonising its power generation mix. This is of particular importance to Japan’s 2035 electrification target, as its 2030 fuel efficiency standard (released in March 2020) now includes a well-towheel energy efficiency approach for all fuels (including electricity).
In November 2021, the government agreed to provide JPY 37.5 billion (USD 342 million) for e-mobility in a supplementary budget for 2021. Following the doubling of its subsidies in December 2020, the budget allocates JPY 25 billion (USD 228 million) for ZEV subsidies and the remainder for charging infrastructure.
• Share of global LDV sales in 2021: 2%
• Electric LDV market share in 2021: 7%
• Electric LDV YOY increase: 117%
Electric car sales surged in Korea in 2021, with EV sales (predominantly LDV) surpassing the programme target by 9%. This is in addition to an increase in cars eligibile to receive the subsidy from 99 650 KRW to 121 000 KRW from 2020 to 2021, an increase of 21%, as well as the battery performance, range and vehicle efficiency criteria for receiving subsidies became more stringent.
The new subsidy scheme introduced in 2021 limited subsidies to passenger cars priced less than Korean Won (KRW) 90 million (USD 78 671); cars priced from KRW 60 million to KRW 90 million (USD 52 448 to USD 78 671) received only 50% of the public subsidy amount. In 2022, subsidies were limited to cars priced less than KRW 55 million (USD 48 077), and only cars priced below KRW 85 million (USD 74 300) were eligible for 50% of the subsidy amount. Lower cost EV car models benefitted from these changes. In a context where overall government funding increased but maximum per car subsidies marginally decreased between 2020 –2021 and more markedly decreased by 33% in 2021-2022 , the sales shares of these lower cost models increased markedly. Korea also extended its subsidy scheme until 2025 and the number of eligible vehicles for subsidies in hopes to meet its vehicle electrification targets.
Per vehicle subsidies in 2021 and 2022 were substantially higher for light commercial vehicles (LCVs). Electric LCV models face fewer hurdles to obtain commercial registration permits than ICE LCVs, which resulted in dramatic growth in electric LCV sales over 2020
volumes. Depending on the model, LCVs can receive between KRW 9 million and 27 million (USD 7 867 and 23 601) in 2022. Total government funding for electric LCV subsidies increased from KRW 210 billion (USD 184 million) in 2020, to KRW 400 billion (USD 349 million) in 2021 and KRW 574 billion (USD 502 million) in 2022.
• Share of global LDV sales in 2021: 2.4%
• Electric LDV market share in 2021: 16.3%
• Electric LDV YOY increase: 80%
In mid-December 2021, EV car subsidies in the United Kingdom for ZEV cars decreased from GBP 2 500 to GBP 1 500 (USD 3 571 to USD 2 143), with the upper price limit falling from GBP 35 000 to GBP 32 000 (USD 50 000 to USD 45 714). Subsidies for small and large vans (emitting less than 50 grammes per kilometre (g/km) and capable of travelling 96 km with zero emissions), decreased from GBP 3 000 to GBP 2 500 (USD 4 286 to USD 3 571) for small vans and from GBP 6 000 to GBP 5 000 (USD 8 571 to USD 7 143) for large vans This came at a time when the government launched consultations in early 2022 to implement a ZEV mandate beginning in 2024 as part of its Net Zero Strategy. Tax incentives continue to be available for employee purchase or lease of ZEV company cars by
setting the tax rate for BEVs from 1% in 2021/22 and 2% in 2022/23 through to 2024/25 (2021-2023, 20% for ICE vehicle equivalent).
• Share of global LDV sales in 2021: 17.8%
• Electric LDV market share in 2021: 4.2%
• Electric LDV YOY increase: 114%
Electric car sales in the United States more than doubled in 2021 relative to 2020. Significant policy changes in 2021 focussed on building technological leadership and boosting domestic EV industries. An executive order issued in August 2021 set a new ambition for EVs to represent 50% of light-duty vehicle sales in 2030 – the first EV target announced at the federal level.
An executive order rescinded the less ambitious Safer, Affordable Fuel-Efficient Act (SAFE) and proposed more ambitious fuel economy targets that aligned with new ZEV and net zero ambitions. Finalised rulings established more stringent standards for both corporate average fuel economy (CAFE) and greenhouse gas (GHG) emissions for model years 2024-2026 (CAFE) and 2023-2026 (GHG emissions). The stricter emissions standards and reduced compliance flexibility reflect the current administration’s focus on accelerating ZEV adoption to foster GHG emissions reductions and a competitive domestic EV industry. The new GHG emissions
standards require between 5-10% emissions reductions each year, and thus require more rapid improvement than even the 2012 standards, albeit from a high fuel consumption baseline. The new CAFE standards will require fuel efficiency improvements of 8-10% between 2024-2026.
The Build Back Better Act was drafted in third-quarter 2021 and includes provisions for additional subsidies to a number of economic sectors, including the existing federal tax credit for EV purchases The bill is pending. It proposes to augment the federal tax incentive for the purchase of an EV to USD 12 000. This would be a restructuring of the USD 7 500 base incentive, plus an additional USD 4 500 for EVs equipped with batteries manufactured and produced with union labour in the United States.
Notably, the state of California has been allowed to reinstate its ZEV mandate rather than be subject to less ambitious federal standards.
For decades, California had followed its own state level regulations through a waiver. This capability was rescinded in 2019 in favour of the SAFE ruling. Nine other states have adopted California’s ZEV mandate. A California state government executive order in 2021 bans new ICE passenger vehicle sales by 2035. Similarly, the governor of New York signed legislation in 2021 for in-state sales of new LDVs to be 100% zero emission by 2035. The state of Washington has passed legislation (awaiting governor approval) to require 100% EV sales by 2030.
The state of California, which accounted for 11% of new LDV sales in the United States in 2021, proposed USD 6.1 billion for EV-related initiatives in January 2022 – the largest ever budget commitment for EVs at the state level. Of this amount, USD 1.2 billion will directly support the addition of 40 000 new passenger EVs. The initiative focuses on tax credits, charging infrastructure and vehicle subsidies.
The Taxonomy Regulation in the European Union provides a science-based classification system that defines various economic activities that can be qualified as environmentally sustainable, including investments related to electromobility. Companies are not obligated to align their economic activities with the Taxonomy Regulation. However, certain companies will be obligated to disclose their share of activities that align with the Taxonomy Regulation (via the Disclosures Delegated Act under Article 8 that came into force in January 2022).
The classification system enables more reliable public information for investors and stakeholders, and a more transparent and science-based comparison of investment options considered environmentally sustainable. It also helps companies more objectively plan and raise financing for sustainable economic activities.
A supplement to the Taxonomy Regulation is the Climate Delegated Act, which came into force in January 2022. It establishes technical screening criteria for economic activities, that make a substantial contribution and do no significant harm to the environment. Sustainable economic activities pertaining to electromobility state that cars with up to 50 g CO2/km of tailpipe emissions (or ZEVs, inlcuding PHEVs) count as a sustainable activity until 2025.
After 2025, only zero g CO2/km tailpipe emission cars qualify as sustainable. Other electromobility-related activities include infrastructure dedicated to the operation of ZEVs, such as electric charging points, electricity grid connection upgrades, hydrogen refuelling stations and electric road systems. Energy vectors used for road transport vehicles are included such as electricity and hydrogen if they follow emissions and sustainability criteria (less than 100 g CO2-eq/kWh).
The taxonomy has also been significant in pandemic-related recovery packages to steer financial flows to sustainable and physical activities such as offering taxonomy regulation compliant green bonds and infrastructure. At least 37% of the EU’s Recovery and Resilience Fund is to be climate aligned and 30% of the Next Generation EU funds are to be raised through green bonds. The European Union is also integrating elements of the Taxonomy Regulation into the Recovery and Resilience Fund.
Other countries are following suit. Korea has stated it will develop a taxonomy for green finance to achieve its net zero emissions commitments. Similarly, Japan has stated it will work with financial institutions to develop criteria for sustainable investment. An Executive Order on Climate-Related Financial Risk by the US government looks to support efforts in climate-aligned investment.
Momentum to catalyse ZEV deployment in heavy-duty vehicle segments picked up considerably in 2021. With decreasing costs and improvements in battery performance, the potential to electrify certain operations and vehicle types above 3.5 tonnes of gross vehicle weight is paired with a realisation of the transformative impact of electrifying these operations to achieve global climate goals. Although initiatives to roll out zero emissions HDVs at scale are generally aimed toward 2025 or later, these ambitions coupled with wider model availability have begun to set up the necessary regulatory climate to accelerate the electrification of HDVs.
In 2021, 15 countries 14 (representing roughly 5% of global mediumduty and heavy-duty vehicle [M/HDV] sales) announced support for the Global Drive to Zero campaign and programme. These countries demonstrated their support by committing to the first global Memorandum of Understanding (MoU) on Zero Emissions Mediumand Heavy-Duty Vehicles. Signatories intend to work together to achieve 2030 and 2040 targets for ZEV new truck and bus sales. Progress towards these goals will be reported annually and signatories are to develop plans to support such ambitions. Thirtynine companies, subnational governments and other key
stakeholders also endorsed the MoU, signalling additional industry support for these ZEV targets.
In March 2022, the ERP created zero emissions targets for the first time for M/HDVs: 35% ZEV sales by 2030. The government aims to create a M/HDV ZEV sales regulation requiring 100% ZEV sales by 2040, with interim mid-2020 and 2030 regulated sales requirements that vary based on vehicle category. Measures to support this target include CAD 547.5 million (USD 421 million) for a M/HDV purchase incentive programme, CAD 33.8 million (USD 26 million) for hydrogen trucking demonstration projects, and a tax write-off for business investments in heavy-duty ZEVs starting at a rate of 100% from 2020 to 2023 and decreasing thereafter. Canada also established a CAD 2.75 billion (USD 2.12 billion) Zero Emissions Transit Fund to help communities invest in zero emissions public transit and school buses, with a commitment to purchase 5 000 zero emissions buses over the next five years. Subsidies for M/HDV ZEV deployment are provided in British Columbia and Quebec.
The Global Commercial Vehicle Drive to Zero Program is a multistakeholder partnership program of over 130 government and industry leaders focussed on accelerating the deployment of zero emissions M/HDVs. Launched in 2018, Drive to Zero’s vision is that zero emissions M/HDVs will be commercially viable in first success applications and early-mover regions by 2025, and will dominate new vehicle sales by 2040. Drive to Zero is a campaign of the Clean Energy Ministerial under the Electric Vehicles Initiative, coordinated by CALSTART. It recognises the disproportionate impact that the largest vehicles on the road have on fuel consumption, GHG emissions and air pollution.
During COP26, Drive to Zero, working in collaboration with the government of the Netherlands, launched a Global Memorandum of Understanding on Zero Emissions Medium- and Heavy-duty Vehicles among 15 countries and endorsed by subnational governments and industry leaders. The Global MoU includes a target of 100% of new truck and bus sales being zero emissions by 2040 and an interim target of 30% by 2030.
Drive to Zero’s efforts are focussed on implementation and ensuring that the signatories and endorsers have the resources to make informed decisions that accelerate zero emissions M/HDV sales
and deployment. The Drive to Zero programme manages a number of industry leading tools including the Zero-Emission Technology Inventory (ZETI), a Total Cost of Ownership calculator (TCO) and most recently the Global MOU Progress Tracker Dashboard
Among goals announced in the release of the National Electromobility Strategy in January 2022, Chile set a target for 100% of public transport vehicles (buses, taxis and shared taxis) sold to be zero emissions by 2035, and by 2045 for freight transport (longdistance trucks) and intercity buses. Santiago, the capital, is already home to one of the largest electric urban bus fleets, outside of China. With more than 800 electric buses (including mini buses) on the road, new procurements by municipal governments for electric buses (now awaiting delivery) will add almost 1 000 buses to its fleet. Various partnerships have made this possible including the electric mobility project launched through a collaboration between Enel X, BYD Chile, and the public transport operator in Chile, Metbus, where 483 electric buses are to be supplied by more than 120 charging points in terminals.
In China, VI-a emissions standards for new urban HDVs took effect in 2020, followed by standards for remaining HDVs in July 2021. In July 2023, China will introduce VI-b emissions standards that establish more stringent testing requirements and monitoring systems.
development in China, where it is expected that the policy will likely mirror the NEV mandate for LDVs.
In addition to purchase incentives outlined in late 2020 for mediumand heavy-duty ZEVs, a four-year pilot programme was announced whereby select cities are to receive support for R&D and demonstration of fuel cell electric vehicles. In 2021, Beijing-TianjinHebei, Shanghai and Guangdong provinces were approved as the first demonstration cities.
The release of the 14th FYP for Green Transportation by the Ministry of Transport sets an ambition for NEVs to account for 72% of national urban public transport (including LDVs and buses) and 20% of logistics distribution by 2025. Regional policies for Shanghai, Ningxia and Guangdong have set targets for 96%, 45% and 100%, respectively, for all new buses to be NEVs by 2025.
Some sources state a new set of regulations requiring the sale of zero emissions new energy commercial vehicles may be under
As a part of the European Green Deal, the CO2 emissions performance standard for HDVs will be reviewed in the fourth-quarter of 2022. Currently, the regulation requires reducing specific CO2 emissions of regulated segments of medium- and heavy-duty trucks by 15% by 2025 and 30% by 2030, on average, relative to their 2019-2020 level. The proposed revision of the regulation extends its scope to other vehicle categories (such as buses) and also includes targets for 2035 and 2040.
The Clean Vehicles Directive was to be transposed into national laws by August 2021.The directive sets national targets for the public procurement of “clean vehicles” 15 for HDVs. In February 2022, the European Parliament approved a proposal for a directive amending the Eurovignette Directive. The amendments would benefit ZEV HDV operators, who would receive significant toll discounts and no longer face time-based toll charges, but distance-based charges instead (in most cases).
EU member states that are leading in the zero emissions HDV market, such as the Netherlands, have set ambitious targets for trucks, public buses and zero emissions zones. 16 To assist companies in this transition, the government has announced a Zero Emissions Trucks Purchase Grant (AanZET), offering a range of subsidies (beginning May 2022) for large, medium and small enterprises.
Other examples include Finland, where in addition to declaring HDV targets, an initiative was launched in 2021 to draft a law to provide purchase subsidies for heavyduty ZEVs (starting in 2022). In Sweden, a budget of SEK 120 million per year (USD 13.9 million) (until 2023) provides subsidies for public transport agencies and companies, municipalities and eligible companies that purchase electric buses and alternative fuel HDVs.
Austria’s 2021 Mobility Master Plan outlines targets to end the sale of conventional M/HDVs under 18 tonnes by 2030, and by 2035 for those over 18 tonnes. A total of EUR 46 million (USD 54 million) was available in 2021 to support electromobility, including EUR 60 000 (USD 70 980) offered for the purchase of eligible commercial heavy-duty ZEVs and up to EUR 130 000 (USD 153 790) for buses. EUR 46 million (USD 54 million) was available in 2021 to support electromobility, including EUR 60 000 (USD 70 980) for the purchase of eligible commercial heavy-duty ZEVs and up to EUR 130 000 for buses (USD 153 790).
Spain activated EUR 400 million (USD 473 million) to promote heavy road transport decarbonisation, which funds purchase subsidies for HDVs of up to EUR 190 000 (USD 224 770) (subsidy level varies based on vehicle class and beneficiary type).
State-owned Convergence Energy Services Limited aims to procure more than 5 500 electric buses as a part of its Grand Challenge Initiative. The initiative has been launched in five major cities across India, with a goal of expanding to nine cities. The initiative aims to aggregate demand, facilitate procurement and standardise the process across major cities. The tender is planned to be between INR 35 – 55 billion (USD 475 million-USD 744 million), pulling funding
15 A clean heavy-duty vehicle is defined as any truck or bus using alternative fuels, including hydrogen, battery electric, plug-in hybrid, natural gas (compressed natural gas, liquefied natural gas and biomethane), liquid biofuels, synthetic and paraffinic fuels, and liquefied petroleum gas.
16 As of July 2021, numerous cities (primarily in Europe) have implemented zero emissions zones or have announced plans to do so
from the FAME II scheme, acting as one of the largest tenders of this kind in the world. The date of bus deployment has not been publicised.
Norway has a target of 100% of new HDVs, 75% of new long-distance buses and 50% of new trucks sold to be zero emissions by 2030. These targets are supported by a subsidy scheme and a fuel tax imposed on HDVs of approximately EUR 200 (USD 237) per tonne of CO2.
The National Bus Strategy for England was published in March 2021, setting out how it will improve co-ordination in bus service and integrate with other modes of travel as part of a decarbonisation roadmap. This is in addition to a commitment (made in November 2020) to deliver 4 000 zero emissions buses by 2025. Funding of GBP 200 million (USD 286 million) was announced in March 2022 to keep this pledge on track. The country has committed to investing GBP 270 million (USD 386 million) to zero emissions buses through the ZEBRA scheme launched in 2021, in addition to the GBP 50 million (USD 71 million) through the All-Electric Bus Town or City Scheme.
by 2040. The government began consultations in March 2022 related to new non-zero emissions buses, coaches and minibuses that aims to set a realistic date to end the sale of these vehicles. To support fleet operators, the Department for Transport announced a GBP 20 million fund (USD 29 million) to support pilot projects. For eligible vehicles, a Plug-in Truck Grant offers a purchase subsidy of GBP 16 000 - GBP 25 000 (USD 22 857 - USD 35 714) In its most populated city, London, government has announced that all new public transport buses will be zero emissions by 2034.
California’s Advanced Clean Truck Regulation obliges minimum ZEV sales targets. In 2021 the states of New York, Washington, Oregon, New Jersey and Massachusetts followed suit. In April 2021 several of these state governments facilitated a request to set federal standards and programmes for 100% ZEVs in new sales of mediumand heavy-duty vehicles by 2045 or earlier.
A recently released California Blueprint earmarks USD 6.1 billion toward ZEV initiatives in the state, including support for the electrification of heavy-duty trucks.
In addition, the United Kingdom aims to phase out the sale of new small petrol and diesel trucks by 2035, and large trucks (>26 tonnes)
In December 2021, the California Air Resources Board adopted a new regulation that updates standards, testing and compliance regarding HDV emissions of nitrogen oxide (NOx) and particulate matter for model years (MY) 2024 to 2031. Shortly thereafter, the US Environmental Protection Agency announced plans to commence the
establishment of new standards for criteria pollutants (NOx) for heavy trucks (starting with MY 2027) to be finalised in 2022. The proposal, released in March 2022, would reduce NOx emissions by between 47- 61% by 2045. This will be followed by an update to current GHG standards to allow for ZEV powertrains starting as soon as MY 2030. Other proposed updates include a more stringent GHG standard for MY 2027 (1.5% more stringent than the original 2016 standard for vocational vehicles 17 and day-cab tractor-trailer trucks 18), stricter GHG standards for MY 2028 and 2029, and a revision to the advanced vehicle credit multiplier between MY 2023 – MY 2028 (to provide fewer credits for ZEVs due to faster than expected technology progress for HDVs).
The US federal administration announced funding of USD 7.5 billion toward the electrification of thousands of school and transit buses across the country. Additionally, USD 1.1 billion in grants have been made available for modernising transit bus fleets as part of the Low or No Emissions Program. A total of USD 5.5 billion will be allocated to the programme over five years, a portion of which would go towards ZEVs.
17 This includes Class 2b to 8 vehicles, defined as all HDVs that are not included in the heavy-duty pickup truck and van or the Class 7 and 8 tractor categories. Some examples include: service vehicles for urban delivery, refuse hauling, utility service, dump trucks, concrete mixing trucks, transit service, shuttle service, school buses, emergency vehicles and tow trucks.
Purchase subsidies and typical prices for ZEV heavy-duty freight vehicles in selected jurisdictions, 2021
New York (US state)
California (US state)
Quebec (Canadian province)
British Columbia (Canadian province)
IEA. All rights reserved.
Notes: Heavy-duty freight vehicles in this figure are those classified as Class 8 vehicles in the United States and Canada, and N3 vehicles in European countries. For China, we assume that heavy-duty tractor-trailers as defined in ICCT (2021) are equivalent. For regions other than China and the Netherlands, the estimated typical purchase price from ICCT (2022). The subsidy and typical retail price for China is calculated based on ICCT (2021) China has paused subsidies for FCEVs and is developing a new incentive measure.
Sources: IEA analysis based on: ICCT (2022). ICCT (2021) Sweden; Poland; Italy; France; Spain; Netherlands; New York; Quebec; California; British Columbia; Austria; United Kingdom.
China and Europe boast the largest EV charging networks in the world. Their charging networks supplied the largest percentages –48% in China and 33% in Europe of global EV stock in 2021. This should come as no surprise, as the deployment of charging infrastructure is critical to enabling ZEV adoption. Both China and Europe are looking to enhance charging infrastructure to meet escalating consumer demand in areas such as standardisation, improved charge point performance, broader locational coverage to include rural areas, customer service and increased flexibility for installing technological advances like high power chargers. Strategies for the long term focus on building smart and well connected EV charging networkst.
Announcements of ZEV deployment pledges were significant in 2021. A focus to deploy adequate publicly accessible charging infrastructure needs to go hand-in-hand to realise ZEV ambitions. Keeping pace with ambitious EV deployment requires significant investment in charging infrastructure. More mature EV markets need to not only further expand the quantity of charging stations to meet growing demand but also to ensure that a well connected network is developed to provide EV charging access in developed and rural areas, residences and key transport corridors. In emerging market
and developing economies, additional barriers may include electricity access and stable grid connections. Overall, decarbonisation of electricity systems is a critical factor to achieve the full emissions reduction potential of ZEVs.
Lessons learned from major ZEV markets demonstrate that the lack of strategic infrastructure development either by central government planning or incentivised by policy mechanisms, along with insufficient co-ordination across key players, e.g. various government entities, utilities, building operators and charge point providers, tends to lead to infrastructure concentrated in certain areas (often lacking in remote regions). Experience in more mature EV markets also demonstrates that access to property and grid connections, along with supporting building regulations, interoperability standards and efficient permitting can ease infrastructure development. Data on mobility patterns can help to understand charging patterns and behaviours in order to optimise EV network planning.
Other work is needed to deploy smart grid technologies, maximise the use of renewables for charging, incentivise and streamline charging infrastructure integration, and provide incentives to energy market participants to stimulate advances in related technologies. Gaps in where charging points are built because they may not be the
best business case do not always align with an evenly distributed charging network. Government measures to address this include: to prioritise EV charging infrastructure deployment in policy to attract investment; provide long-term contracts for electric vehicle supply equipment (EVSE); and bundle various location types in competitive EVSE procurements.
Number of electric LDVs per public charging point: 20 19
Number of public charging points per thousand LDV stock 20: 0.53
Canada’s Electric Vehicle and Alternative Fuel Infrastructure Deployment Initiative provided CAD 96.6 million (USD 74 million) toward building a coast-to-coast network of fast charging stations, and has now ended. The Zero Emissions Vehicle Infrastructure is a five-year programme to 2027 with CAD 680 million (USD 523 million) to address charging infrastructure gaps, for example at workplaces and multi-unit residential buildings. A target of 50 000 new EV chargers and hydrogen stations to be added to the charging network
19 Measures the ratio between total EV stock (2021) to total public charging points. A low ratio can be indicative of a high number of charging points, but also a low EV stock. This metric aims to provide a comparative analysis between countries on the state of charging infrastructure deployment.
was announced in late 2021. Subsequently, in March 2022, the ERP announced an additional CAD 500 million (USD 384 million) for ZEV charging stations and refuelling infrastructure from the Canada Infrastructure Bank.
Some provinces that lead in EV market share are allocating public funds to subsidise charging infrastructure development. In British Columbia, the CleanBC Roadmap to 2030 set a target of 10 000 public charging stations by 2030 and allocated CAD 1 million (USD 769 000) to assist public sector organisations to access rebates for the purchase and installation of level 2 chargers. Quebec’s Strategy to Electrify Transport 2021-2023 aims to increase the number of charging stations and creates reserved parking spots exclusively for EVs. Nova Scotia recently announced funding of CAD 500 000 (USD 384 615) for EV charging deployment. Ontario has announced a budget of CAD 91 million (USD 70 million) to install EV chargers at highway rest stops, recreational areas and carpool parking lots.
Number of electric LDVs per public charging point: 7
Number of public charging points per thousand LDV stock: 4
20
China has the largest EV charging infrastructure network in the world, with more than 1.1 million public charging points, which is 40% more than the previous year. As part of China’s electrification ambitions, ten ministries and commissions published guidance for enhancing EV charging infrastructure services in January 2022. It calls for charging infrastructure to meet the needs of more than 20 million EVs and 60-80% of expressway services (depending on the area) to have fast charging stations by 2025. An emphasis on building a well connected and distributed EV charging network, particularly in rural areas and along transport corridors is emphasised. At present, more than 70% of public charging points are located in Guangdong Province and Shanghai.
In order to achieve these goals, the government aims to install community charging facilities, construct urban and rural public charging networks, improve facility maintenance and enhance power supply. Various regions throughout China offer subsidies for EV charging infrastructure. The central government aims to encourage local governments to strengthen subsidy programmes, particularly for subsidies targeted at operations such as high quality service stations, demonstration projects for high power charging and vehicle grid interaction. It further seeks to enhance battery swapping through technical innovation, support for standards and to promote application of technology.
Of significant importance, the National Development and Reform Commission and the National Energy Administration (the
departments responsible for EV charging infrastructure delivery) announced the Opinion on Further Improving the Service Guarantee Capability of Electric Vehicle Charging Infrastructure to reinforce quality and safety supervision, to establish operational subsidy standards linked to service quality at the local level with increasing subsidies for new technologies, to support power grid construction, R&D and new technology applications, and the standardised development of charging facilities. In October 2021, the Ministry of Industry and Information Technology launched pilot programmes for battery swapping technologies in 11 cities with the goal of building 1 000 battery swap stations and producing more than 100 000 vehicles capable of battery swapping. The Ministry of Transport 14th FYP explicitly states the need to support the construction of charging stations in highway service areas, transportation hubs, logistic parks and bus stations.
China’s State Council released their 14th FYP for the Development of a Modern Integrated Transport System, which highlights the need to plan for constructing convenient, efficient and moderately advanced charging and battery swap networks, particularly in key areas The 14th FYP for areas such as Shanghai, Chongqing, Guangxi, Guangzhou and Shaanxi include either EV charging targets, financial subsidies or an increased focus on developing charging infrastructure. Currently, regions around China offer capital and operational subsidies that can vary significantly in the amounts offered between areas.
Capital and operating subsidies for charging infrastructure in selected Chinese provinces
IEA. All rights reserved.
* Regions where applications for subsidies were terminated in 2020.
Notes: The range in capital subsidies shown is due to variations in subsidy amounts offered to alternating current versus direct current charging stations, power of the charger, location (urban, suburban or highway) and/or accessibility (private or public). Operational subsidies can vary based on annual cumulative charging capacity or charging facility quality rating (e.g., Shanghai). Operational subsidies displayed for Beijing are provided to general charging service providers for government operated charging facilities.
Sources:IEA analysis based on Beijing; Chongqing; Chengdu; Guangzhou; Shanghai; Shenzhen.
Number of electric LDVs per public charging point: 14
Number of public charging points per thousand LDV stock: 1.1
The Sustainable and Smart Mobility Strategy of the European Union aims to deploy 1 million publicly accessible charging points by 2025 and 3 million by 2030, up from about 290 000 public charging points today. Achieving this will require massive investments in charging infrastructure, one study estimates that EUR 20 billion (USD 23.6 billion) would be needed to meet the 2030 target.
Actions to achieve the target and as part of the Fit-for-55 package of proposals, in July 2021, the European Commission proposed to transform the Alternative Fuels Infrastructure Directive into the Alternative Fuels Infrastructure Regulation (AFIR). Adoption of the AFIR would automatically and uniformly obligate all member states to meet the targets set under binding legislation without having to transpose them into national laws. The regulation also aims to address issues related to a lack of central co-ordination of strategic charging infrastructure networks and interoperability, due to a disjointed approach to EV charging network distribution.
Under AFIR, member states would be required to provide 1 kW of power output for every registered light-duty BEV in their jurisdiction and 0.66 kW for every light-duty PHEV. Minimum power and distance targets have also been proposed along main road corridors such as
the trans-European network for transport (TEN-T). For the first time, mandatory minimum power and distance targets have been set for HDVs: every 60 km of the core TEN-T network with a power output of at least 1 400 kW (at least one individual power output of 350 kW) by 2025 and 3 500 kW (at least two individual power outputs of at least 350 kW) by 2030. For the comprehensive network, targets remain the same but shift forward to 2030 and 2035 with a maximum distance of 100 km. In addition, the Alternative Fuels Infrastructure Facility, as part of the EU Connecting Europe Facility transport programme, will make EUR 1.5 billion (USD 1.77 billion) available by the end of 2023 for electric fast charging and hydrogen refuelling stations on the TEN-T network.
A proposed revision of the Energy Performance of Buildings Directive aims to complement more ambitious targets under AFIR. The directive revises mandatory requirements for at least one charging point in non-residential buildings and enables pre-cabling for installation at a later date. Similar revisions were proposed for new residential buildings.
Another important update in the European Union has been the proposal to revise the Renewable Energy Directive II, which sets a target to reduce the GHG intensity of transport fuels by 13% by 2030. The revision proposes a new credit mechanism to promote electric mobility, allowing renewable electricity suppliers that provide energy through public charging stations to earn credits on the electricity sold to consumers. This provision can help to improve the business case
for charging stations. Additional provisions in the proposal include ensuring smart charging capabilities for normal power private charging stations and possibilities for requiring vehicle-to-grid functionalities based on individual member state assessments.
stations across 25 states. In late 2021, the National Highways Authority of India set an objective to install EV charging stations every 40-60 km along national highways, covering 35 000- 40 000 km of highways by 2023.
In 2021, a number of EU member states allocated significant funding to EV charging infrastructure, making use of the EUR 672.5 billion (USD 796 billion) recovery stimulus package provided by the European Union. Belgium, Finland, France, Germany, Ireland, Italy, Spain and Sweden are the main member states to have applied additional funding to augment their EV charging infrastructure networks in 2021. Further, Sweden announced funding of Swedish kronor (SEK) 550 million (USD 63.9 million) in early 2022 for HDV charging infrastructure along key transport corridors. In the Netherlands, the National Knowledge Platform for Charging Infrastructure (NKL) has developed a Roadmap for deployment of a HDV charging network. NKL will oversee the Living Lab project consisting of testing heavy-duty charging solutions.
Number of electric LDVs per public charging point: 32
Number of public charging points per thousand LDV stock: 0.02
To date, the FAME II programme has provided subsidies (INR 10 billion, USD 135 million) to develop almost 2 900 charging
In January 2022, the Ministry of Power revised its guidelines and standards for EV charging infrastructure. The revisions include: easing provisions for EV owners to charge at home/office using existing electricity connections; a revenue-sharing model related to land use to make charging stations more economical; guidance on providing affordable tariffs; timelines for connectivity of charging stations to the grid; and a fixed ceiling on service charges for electricity.
India’s national government budget announcement for 2022-2023, includes provisions for a battery swapping policy that aims to provide “batteries or energy as a service”. In April 2022, the government (led by NITI Aayog) released a draft proposal of the policy which is open to comments from stakeholders until June. Key elements include: technical and operational requirements for interoperability, safety and performance between EVs, batteries and EVSE; development of unique identification numbers for batteries and swapping stations; testing and certification standards for battery swapping components; open and flexible mandate to enable different battery-as-a-service business models; expanding existing demand-side fiscal support measures (such as FAME II) to include battery swapping; preferential electricity tariffs for public battery swapping stations; and developing
standards for the re-use and repurposing of end-of-life EV batteries. The proposed policy is to be rolled out in phases. It will first focus on metropolitan cities with a population larger than four million in the first two years, followed by all major cities and state capitals by the third year.
Number of electric LDVs per public charging point: 12
Number of public charging points per thousand LDV stock: 0.4 Japan’s current target is to deploy 150 000 EV charging points by 2030. It allocated a total of JPY 37.5 billion (USD 342 million) to support ZEV deployment of which JPY 12.5 billion (USD 114 million) is for new EV charging and hydrogen refuelling stations.
Number of electric LDVs per public charging point: 3
Number of public charging points per thousand LDV stock: 5 In order to meet EV and charging infrastructure targets, Korea almost tripled eligible funding in 2022 compared with 2021 for slow chargers from KRW 24 billion to KRW 74 billion (USD 21 million to USD 65 million). Funding for fast chargers also increased from
KRW 4.5 billion (USD 3.9 million) in 2021, to KRW 37 billion (USD 32 million). The funding is expected to increase the number of charging points for apartments and facilities from 8 000 to 30 000 in 2022.
Thailand
Number of electric LDVs per public charging point: 15
Number of public charging points per thousand LDV stock: 0.16
Today, Thailand has a little more than 1 500 public charging stations. Its ambitions are high. The National Electric Vehicle Policy Committee sets EV production and use targets as well as infrastructure targets. The target is 12 000 fast-charging stations and 1 450 electric motorcycle battery swapping stations by 2030.
Thailand plans to use public-private partnerships to install more than 1 000 fast chargers every 50 km along the designated charging network. EGAT, the state-owned electricity generating authority, plans to increase the number of EV charging stations across all travel routes and has signed contracts with six automakers to launch a mobile app that allows customers to locate charging stations.
Number of electric LDVs per public charging point: 21
Number of public charging points per thousand electric LDVs: 1.0
The EV infrastructure strategy has allocated GBP 1.6 billion (USD 2.3 billion) since 2020 to support deployment of EV charging infrastructure. The strategy introduces numerous government funding schemes, including the GBP 950 million (USD 1.4 billion) Rapid Charging Fund to ensure an ultra rapid charging network along motorways.Other government investments include a GBP 500 million (USD 714 million) Local EV Infrastructure Fund to help local authorities scale up infrastructure deployment, and an On-Street Residential Chargepoint Scheme that will provide GBP 20 million (USD 29 million) through 2022-2023 for the provision of public charging for residents without private parking.
Legislation proposed in late 2021 would require EV charging infrastructure in new buildings and major renovations similar to the EU’s Energy Performance of Buildings Directive.
Number of electric LDVs per public charging point: 18
Number of public charging points per thousand LDV stock: 0.47
The Infrastructure Investment and Jobs Act, adopted in November 2021, allocates USD 5 billion funding under the National Electric Vehicle Infrastructure Formula Program to develop a national public EV charging network along designated “Alternative Fuel Corridors”, particularly along the interstate highway system. In addition, the EV Vehicle Charging Action Plan allocates USD 2.5 billion for areas that have historically received minimal investment in EV charging infrastructure such as rural and disadvantaged communities. The investment package is to underpin the US target to deploy 500 000 EV chargers and is the largest investment to date in its charging infrastructure. The United States currently has more than 100 000 public chargers.
At the state level, the California Public Utilities Commission approved new rules that require utilities to ensure the provision of electrical distribution infrastructure associated with EV charging stations. Previously customers that did not qualify for utility programmes had to bear the costs. The new rules create an even playing field for all customers and ultimately reduces the cost of installing EV charging stations by 25%.
Government funding for publicly available charging infastructure normalised by LDV stock and funding period, 2021
Total funding available (USD) per LDV stock per year
IEA. All rights reserved.
Notes: Funding shown reflects financing for all types of publicly available ZEV charging infrastructure that is currently available in select countries up to an announcement date of May 2022. Total funding amounts are based on total annual charging infrastructure budget announcements and programs which is then divided by the number of years the funding or programme is active. Annualised funding is then divided by the total LDV stock in 2021.
Sources: IEA analysis based on: United Kingdom; Germany; Sweden; France; United States; Canada; Korea; India; Japan.
So far, developments in electromobility have been limited in many low- and middle-income countries around the world. Electromobility offers countries and regions a variety of opportunities to leapfrog carbon-intensive transport transport patterns to support economic efficiency and bypass or alleviate negative impacts such as air pollution and traffic congestion and to foster domestic manufacturing and service capacity for EVs. Some countries are taking steps to develop appropriate regulatory and investment-ready frameworks to support EV uptake and production, and battery manufacturing. Policies and measures being employed include: national electric mobility strategies; fiscal incentives such as tax benefits and publicprivate partnerships; R&D support; and pilot and demonstration projects tailored for transport modes applicable to their situation, i.e. two/three-wheelers, shared mobility, taxis and buses.
Broadening the deployment of EVs in these countries/regions face additional challenges. For example, their stock may be heavily dependent on second-hand vehicles with EVs becoming available with a time lag. Deployment of charging infrastructure may be inhibited in regions with weak grids. Few have established emissions standards or they may be too low to serve as a driver to spur EV uptake.
This section highlights some of the EV-related policies in emerging market and developing economies that are not covered in the previous sections. It also summarises a global EV support initiative of the Global Environment Facility.
Only a small share of vehicle sales on the continent are EVs. South Africa is the market leader. Its uYilo eMobility Programme, established in 2013, is a multi-stakeholder platform that seeks to enable EV deployment through pilot projects and capacity development. It consists of a battery testing and systems laboratory for component modelling, and a smart grid simulator.
South Africa’s Department of Trade, Industry and Competition released a green paper 21 in 2021 on the advancement of new energy vehicles. Its proposed policy instruments are to reduce the ad valorem tax and eliminate duties on EV components, which currently are subject to an import duty of 25% compared to 18% for an equivalent ICE vehicle.
Currently, there are about 300 public EV charging points in South Africa. The government has chosen to mainly let private sector actors take the initiative to deploy EV charging infrastructure. Outlined in the
21 A green paper is a document published by government to stimulate discussion on a given issue, so as to inform changes to existing legislation and/or to create new legislation.
Green Transport Strategy, the government aims to work with the private sector to expand the number of EV charging stations powered by renewable sources. In 2015, BMW and Nissan signed a Memorandum of Understanding to jointly plan and build a national network of charging stations to be used by their vehicles. In 2018, this network was expanded with the launch of the Jaguar Powerway, a network of 22 charging stations along major highways plus 30 charging stations in major hubs. More recently, Audi partnered with GridCars to install ultra-fast (150 kW) and fast (22 kW – 80 kW) public charging stations across the country.
Elsewhere in Africa, Rwanda has identified that the total investment needed for EV charging infrastructure needs to be scaled up to around USD 900 million to be in line with their climate commitments as set out in their Nationally Determined Contribution. In April 2021, the Ministry of Infrastructure released a strategic paper on electric mobility adaptation, which outlines a strategy for implementing various incentives to promote deployment. One measure proposes a preferential corporate income tax rate of 15% for firms operating in emobility modes.
In Kenya, electrification of road transport has been identified as a key component to achieve the goal of reducing emissions by 3.46 million tonnes of carbon-dioxide equivalent by 2030 across the transport sector. To support this target, a reduction in excise duty for BEVs (carrying more than ten people) from 20% to 10% was proposed,
along with a target of 5% of imported vehicles to be electric by 2025. In January 2022, ROAM, a Swedish-Kenyan company formerly called Opibus, introduced its first African designed and manufactured electric bus in Kenya. This broadened its focus from domestic production of electric motorcycles and off-road vehicles since its inception in 2017. This is the first major step toward ROAM’s goal of demonstrating EV deployment in emerging markets and expanding to several markets.
In Uganda, Kiira Motors, the state-owned vehicle manufacturer, announced plans to launch production of EVs in 2021, with ambition to expand within the next few years.
In Egypt, electric cars less than three years old have been given a 100% exemption from customs duties, despite a countrywide ban on importing used vehicles since 2013. 22 This ban was reinforced with a presidential decree on import tariffs in 2018. Pilot projects are underway for electric buses in major cities. The Ministry of Military Production signed a partnership with Chinese automaker Foton Motors to produce 500 electric buses per year with at least 45% local components. Over the next four years, the partnership aims to produce 2 000 electric buses.
While EV deployment is in its infancy in Viet Nam, national planning documents state the ambition to advance the uptake of EVs.
Recently, the government enacted a decree that set registration fees for EVs to zero starting in March 2022 through to February 2027. After which, registration fees will increase to 50% of those applied to conventional vehicles.
In 2021, Indinesia’s Ministry of Energy and Mineral Resources indicated that a National Grand Energy Strategy was currently under development, which seeks to support the goal of achieving 2 million electric LDVs and 13 million electric motorcycle stock by 2030. This is coupled with a target to cut oil imports by 77 000 barrels/day by reducing fuel consumption, which will directly impact ICE vehicles and support the uptake of ZEVs. Although not yet reflected in government documentation, an ambition was recently announced for all new cars sold to be EVs by 2050. Other incentives include beneficial tax incentives on HEVs and ZEVs under its luxury sales tax. Existing policy to support these targets includes the Low-Carbon Emission Vehicle Program.
Indonesia’s Ministry of Energy and Mineral Resources introduced the Regulation on the Provision of Charging Infrastructure for BEVs in 2020. It aims to support businesses to establsih three types of business schemes: provider; retailer; and co-operation schemes as well as easing licensing procedures for charging stations.
Across Indonesian cities, the Ministry of Transport is exploring ways to adopt battery electric buses. The DAMRI E-Bus Project, which aims to replace diesel buses with electric buses, is in the first phase of scale up of electric transport in and around Jakarta.
In Thailand, a package of incentives to promote EV deployment was announced in February 2022. Measures include purchase subsidies for BEVs ranging from Thai Baht (THB) 70 000 (USD 2 191) (with a battery capacity of 10-30 kWh) to THB 150 000 (USD 4 695) (with battery capacity higher than 30 kWh), along with reductions in excise tax (until 2025) and import duties (until 2023). An agreement was signed between automakers and the government to launch domestic BEV production by 2025, and a similar package of incentives is provided to electric two-wheelers.
In Malaysia, a package of incentives to promote EV uptake was announced in the Budget 2022, following the release of the Low Carbon Mobility Blueprint of Malaysia in October 2021. Among the measures are a full tax exemption for locally assembled BEVs, and exemption from import and excise duties for imported BEVs. A 100% road tax exemption is also provided for BEVs, along with income tax benefits for EV charging.
Chile continues to be the market leader in terms of electromobility deployment in the region, as discussed in previous sections. Other countries in South America are ramping up EV-related activities and ambitions.
In Colombia, the city of Bogotá has a procurement process to acquire a target of 1 485 electric buses in 2022. Companies such as BYD and
Transdev have established supply and service contracts with the city. Currently less than 260 of the electric buses are in operation.
Approved in July 2021, Law 2099 in Colombia aims to promote efficient use of energy resources and to expand the use of nonconventional energy sources. Based on the law, the Ministry of Mines and Energy granted an exemption from the 20% energy consumption tax for electricity destined for EV charging in public stations and the public transport system.
Costa Rica provides incentives to support its ZEV targets. In a major step towards the electrification of road transport, the government is looking to reform a law, due to expire at the end of 2022, for the advancement and support for electric transportation. Established in 2018, the existing law includes several economic benefits for the purchase of new EVs and non-monetary perks for BEV and FCEV owners such as import tax exemptions and ownership tax exemptions. It also augments points for EVs in competitive procurements, mandates EVs for bus replacements and sets minimum requirements for new taxi registrations to be EVs. Currently under discussion, the reform (Number 22.713) of the law would look to extend the incentives and tax benefits and exemptions.
Costa Rica’s 2019 National Decarbonization Plan 2018-2050 sets a target for a decarbonised economy with net zero emissions by 2050.
Among the ten decarbonisation paths proposed, three are directly related to the transportation sector and include: transformation of public transport and LDV fleets to ZEVs by 2050, and transformation of freight to achieve net zero or the lowest emissions possible. In 2021, a demonstration project was carried out with three all-electric buses operated in an urban and an interurban bus route. The buses were donated by the German government.
The Global E-Mobility Programme provides support to low- and middle-income countries and their shift to electromobility. The fiveyear programme, co-funded by the Global Environmental Facility (GEF), other organisations and bilateral donors, consists of one global project and is executed by a number of organisations including the Asian Development Bank, Centro de Mario Molina, European Bank for Reconstruction and Development, International Energy Agency, United Nations Environment Programme and national governments. The Programme covers more than 50 countries of which 27 countries receive financial support for technical assistance and projects from GEF
This section explores several pathways to electrify road transport in the period to 2030. It assesses the projected uptake of electric vehicles across road transport modes and regions, and implications of EV adoption for charging infrastructure, energy demand, greenhouse gas (GHG) emissions, and revenues from road transport fuel taxation. It takes a scenario approach based on the latest market data, policy drivers and technology perspectives. Two IEA scenarios – the Stated Policies and Announced Pledges scenarios – inform the outlooks which are examined in relation to the Net Zero Emissions by 2050 Scenario at the global level.
The purpose of the scenarios is to assess plausible futures for global EV markets and their implications. They do not make predictions about the future. Rather, they aim to provide insights to inform decision making by governments, companies and stakeholders about the future of EVs.
The scenario projections related to GDP are based on the International Monetary Fund’s most recent publication (19 April 2022), which reflects impacts from the Russian Federation’s (“Russia” herafter) invasion of Ukraine. Given the unpredictability of how the geopolitical situation and its implications for energy markets will evolve raises the level of uncertainty in this edition of the Global EV Outlook projections in the period to 2030.
The Stated Policies Scenario reflects existing policies and measures, as well as policy ambitions and targets that have been legislated by governments around the world. It includes current EV-related policies and regulations and future developments based on the expected impacts of announced deployments and plans from industry stakeholders. The Stated Policies Scenario aims to hold up a mirror to the plans of policy makers and illustrate their consequences.
The Announced Pledges Scenario assumes that the announced ambitions and targets made by governments around the world, including the most recent ones, are met in full and on time. With regards to electromobility, it includes all recent major announcements of electrification targets and longer term net zero emisssions and other pledges, regardless of whether or not these have been anchored in legislation or in updated Nationally Determined Contributions. For example, the Announced Pledges Scenario assumes that countries that have signed on to the COP26 declaration on accelerating the transition to 100% zero emissions cars and vans will achieve this goal even if there are not yet policies or regulations in place to support it. In countries that have not yet made a net zero emissions pledge or set electrification targets, the Announced
Pledges Scenario considers the same policy framework as in the Stated Policies Scenario. Non-policy assumptions for the Announced Pledges Scenario, including population and economic growth, are the same as in the Stated Policies Scenario.
The Net Zero Emissions by 2050 Scenario (Net Zero Scenario) is a normative scenario that sets out a narrow but achievable pathway for the global energy sector to achieve net zero CO2 emissions by 2050. The scenario is compatible with limiting the global temperature rise to 1.5 °C with no or limited temperature overshoot, in line with reductions assessed in the Intergovernmental Panel on Climate Change in its Special Report on Global Warming of 1.5 °C.
There are many possible paths to achieve net zero CO2 emissions globally by 2050 and many uncertainties that could affect any of them. Therefore the Net Zero Scenario is a path and not the path to net zero emissions.
2050
Global EV stock by mode and scenario, 2021-2030
All rights reserved.
Notes: PLDVs = passenger light-duty vehicles; BEV = battery electric vehicle; LCVs = light commercial vehicles; PHEV = plug-in hybrid electric vehicle. The figure does not include electric two/three-wheelers. For reference, total road vehicle stock (excluding two/three-wheelers) in 2030 is 2 billion in the Stated Policies Scenario, 2 billion in the Announced Pledges Scenario and 1.8 billion in the Net Zero Emissions by 2050 Scenario.
Recent trends in EV sales and government policies bring projected EV adoption closer to being on track with the trajectory to net zero emissions by
In the Stated Policies Scenario, the global EV stock across all road transport modes (excluding two/three-wheelers) expands rapidly from almost 18 million in 2021 to 200 million vehicles by 2030, an average annual growth of over 30%. In this scenario, EVs account for about 10% of the road vehicle fleet by 2030. Total EV sales reach 18 million in 2025 and over 30 million vehicles in 2030, representing respectively 13% and over 20% of all road vehicle sales. This compares to almost 7 million in 2021.
In the Announced Pledges Scenario, based on the targets and pledges that go beyond stated policies, the global EV stock reaches over 85 million vehicles in 2025 and 270 million vehicles in 2030 (excluding two/three-wheelers). The share of EVs in the stock reaches 14% in 2030. EV sales in this scenario reach over 45 million vehicles in 2030, achieving a sales share of 33%.
For comparison, in the Net Zero Scenario, the global EV stock reaches over 100 million vehicles in 2025 and 350 million vehicles in 2030 (excluding two/three-wheelers). The share of EVs in the stock reaches 20% in 2030. In 2030, EV sales reach over 65 million vehicles, representing a sales share of almost 60%. This sales share is 80% higher than the Announced Pledges Scenario, indicating that government pledges fall short of reaching net zero by 2050.
Global EV sales by scenario, 2021- 2030
IEA. All rights reserved.
Notes: PHEV = plug-in hybrid electric vehicle. EV sales share = share of EVs (BEV+PHEV) out of total vehicle sales. PHEV share in EVs = share of PHEV sales out of EV (BEV+PHEV) sales. For the Net Zero Emissions by 2050 Scenario, only global values are reported. Sales of electric two/three-wheelers are not included in this figure. The regional breakdown of sales by vehicle type in the Stated Policies and Announced Pledges scenarios can be interactively explore via the IEA’s Global EV Data Explorer.
Light-duty vehicles, which includes passenger light-duty vehicles (PLDVs) and light commercial vehicles (LCVs), continue to be the main
market for EVs (excluding two/three-wheelers). This is driven by the combined effects of technology availability and maturity, policy support and the sheer size of the market. In the Stated Policies Scenario, the electric LDV stock rises from about 17 million in 2021 (95% of the total EV market) to nearly 70 million vehicles in 2025 and over 190 million vehicles in 2030, remaining over 95% of total EVs through 2030. Globally, the share of electric LDVs in the total stock of LDVs increases from just over 1% today to 10% in 2030. Sales of electric LDVs rise from almost 7 million in 2021 to over 17 million in 2025 (a sales share of about 15%) and over 30 million in 2030 (more than 20%).
In the Announced Pledges Scenario, about 265 million electric LDVs are projected to be circulating worldwide by 2030 (of which less than 25 million are LCVs), corresponding to an almost 15% share in the LDV stock. Sales of electric LDVs are projected to reach 45 million in 2030 (a sales share of 35%), 50% above the Stated Policies Scenario. These results reflect government net zero emissions pledges and electrification targets, including the COP26 declaration on accelerating the transition to 100% zero emissions cars and vans.
In the Net Zero Scenario, the sales share of electric LDVs is more than 60% in 2030, which is over one-and-a-half times higher than in the Stated Policies Scenario and 80% higher than in the Announced Pledges Scenario.
The global electric bus fleet is the second-largest EV market today when excluding two/three-wheelers; it increases from 670 000 in 2021 to 1.7 million in 2025 and 3 million in 2030 in the Stated Policies
Scenario, representing over 5% and 11% stock shares, respectively. Most of the electrification is limited to urban buses, in particular, driven by efforts to reduce air pollution. Intercity buses have lower levels of electrification, as they have longer routes and require longer charging times. In the Stated Policies Scenario, electric buses reach just under 20% sales share in 2030.
In the Announced Pledges Scenario, the deployment of electric buses accelerates to about 4.5 million in 2030, corresponding to over 15% of the stock. In 2030, almost one-third of buses sold are electric, a 50% higher sales share than in the Stated Policies Scenario. In the Net Zero Scenario, electrification of buses is further accelerated to a 55% sales share and almost 25% stock share in 2030.
There are over 65 000 electric trucks in operation today. In the Stated Policies Scenario the electric truck fleet expands to 2.8 million in 2030, reaching about 2.5% of the total truck stock. In the Announced Pledges Scenario, the electric truck stock reaches over 3 million (a 2.8% stock share) based on government net zero emissions pledges and electrification targets. In terms of sales, the share of electric trucks in total sales today is very small, but rises to 7% over the projection period (10% in the Announced Pledges Scenario). The Announced Pledges Scenario incorporates the memorandum of understanding on zero emissions medium- and heavy-duty vehicles signed by 15 countries, which has an interim goal of 30% zero emission vehicle sales by 2030 (which includes buses).
Electric trucks are particularly well suited for deliveries in urban areas and other applications where driving distances are relatively short (<300 km/day) and overnight charging is possible. However, the electrification of trucks is projected to be the lowest of all vehicle segments in the near term, in part because long-haul trucking requires further technology improvements for high power charging and/or large batteries. Despite these challenges, electric heavy-duty trucks may reach cost parity, on a total cost of ownership basis by 2030 in some regions, such as European countries, especially considering the lower operational costs. While, HDV fuel economy standards are currently not stringent enough to require electrification for compliance and other policy or regulatory measures, such as zero emissions vehicle mandates, tend to be less ambitious than for their LDV counterparts, there are signals that this could be changing. For example, the US Environmental Protection Agency (EPA) has proposed a new rule for clean trucks, which is expected to increase the stringency of GHG emissions standards for a subset of trucks and buses.
In the Net Zero Scenario, the sales share of electric trucks reaches around 25% in 2030, three-and-a-half times higher than in the Stated Policies Scenario and two-and-a-half times higher than in the Announced Pledges Scenario. This underlines the need for further government ambitions and the need to implement the required policies to put trucks on a pathway to reaching net zero emissions by 2050.
Two/three-wheelers 23 are relatively easy to electrify because their light weight and short driving distances require relatively small batteries, which also raises fewer issues related to charging infrastructure requirements. On a total cost of ownership basis, electrification already makes economic sense in many regions. With a sales share higher than 20% in 2021 (6% stock share), two/three-wheelers are the most electrified road transport segment today.
Electric two/three-wheelers are projected to continue to be the largest EV fleet among all road transport modes. Asia, where two/threewheelers are prevalent today, is the main centre of growth. The global stock of electric two/three-wheelers in the Stated Policies Scenario increases from over 35 million in 2021 to 245 million in 2030, accounting for over a quarter of the total stock in 2030. 24 Sales of electric two/three-wheelers increase from almost 10 million in 2021 to 40 million in 2030, when they account for more than half of all sales.
In the Announced Pledges Scenario, the global stock of electric two/three-wheelers rises to over 330 million in 2030, 35% of the total stock for two/three-wheelers. This corresponds to sales close to 55 million in 2030, amounting for about 65% of all sales.
In the Net Zero Scenario, electric two/three-wheelers reach a sales share of 85% in 2030, 60% and 30% higher than the Stated Policies and Announced Pledges scenarios, respectively.
23 Tracking sales of electric two/three-wheelers is not an easy task, as definitions vary across countries. Often electric bicycles are included in the statistics. Our accounting aims to include only vehicles that fit the United Nations Economic Commission for Europe (UNECE) definition of L2-L5
This year we have updated our data sources for L2-L4 vehicles to Motorcycles Data, a private data provider that is able to provide statistics according to this classification.
24 Historical data for two/three-wheelers in China were revised for this edition of Global EV Outlook; for details see the Annex
EV share of vehicle sales by mode and scenario in selected regions, 2030
IEA. All rights reserved.
Notes: STEPS = Stated Policies Scenario; APS = Announced Pledges Scenario; 2/3Ws = two/three-wheelers; LDVs = light-duty vehicles; BEV = battery electric vehicle; PHEV = plugin hybrid electric vehicle. The countries included in Europe are listed in the Annex Regional projected EV sales and sales shares data can be interactively explored via the Global EV Data Explorer
China continues to exceed expectations for EVs. In the LDV market, current trends suggest that the government’s target of a 20% sales share in 2025 may actually be achieved earlier. The combined effects of policy support and the increasing availability of affordable models in particular in the small car segment mean that the 20% share is reached by 2023 in the Stated Policies and the Announced Pledges scenarios. By 2030, the share of electric LDVs reaches 45% of all LDVs sales in the Stated Policies Scenario and 46% in the Announced Pledges Scenario.
China is currently the world leader in the electrification of buses and two/three-wheelers. China has the highest stock share of electric buses in the world, at over 10%, due in part to the large number of EV bus models available. The stock share of electric buses in 2030 is over 25% in the Stated Policies Scenario and over 35% in the Announced Pledges Scenario. For two/three-wheelers, over one-fifth of the stock is electric. China is projected to continue leading these markets to 2030 in both scenarios. Electric two/three-wheelers attain a stock share of 60% in 2030 in the Stated Policies Scenario and over 75% in the Announced Pledges Scenario. China also continues to lead in terms of the share of electric two/three-wheelers and buses in overall sales in both scenarios to 2030. The gap relative to other
countries closes, especially in the Announced Pledges Scenario, reflecting other countries’ ambitions to electrify buses.
While the current sales share of electric medium- and heavy-duty trucks is still less than 1% in China, it rises to 13% sales share in 2030 in the Stated Policies Scenario, higher than other major markets. The electric truck sales share remains similar in the Announced Pledges Scenario, as the sales are already on a trajectory to meet its carbon neutrality by 2060 ambition. Thus, in the Announced Pledges Scenario, China reaches a similar level of electrification of trucks as the United States, but lower than in Europe.
In China, the sales share of EVs across all road transport segments (excluding two/three-wheelers) reaches around 45% in 2030 in both the Stated Policies Scenario and the Announced Pledges Scenario. The existing policy framework and targets to 2030 in China as considered in the Stated Policies Scenario are designed to meet China’s long-term carbon neutrality target, making the two scenarios similar in terms of EV shares. In addition, electrification of road transport is an important policy priority in China and market dynamics are strong, suggesting that individual targets may be achieved sooner than expected and thus our projections exceed stated targets.
CO2 emission standards for both LDVs and heavy commercial vehicles in the European Union are expected to promote EV adoption across modes and maintain Europe’s position as one of the most advanced EV markets in the coming years. In the Stated Policies Scenario, the sales share of electric LDVs reaches over 35% in 2030. The Announced Pledges Scenario considers the European Union’s proposal to reduce emissions from cars and vans by 55% and 50% by 2030 (compared with 1990), as well as the United Kingdom’s proposed ICE ban for new PLDV sales in 2030 and the COP26 declaration on accelerating the transition to 100% zero emissions cars and vans. As such, electric LDVs reach a sales share of over 50% in Europe in 2030 in the Announced Pledges Scenario (about 55% in the European Union).
The European Union Clean Vehicles Directive sets minimum requirements for the procurement of zero emissions public buses and trucks. In the Stated Policies Scenario, the sales share of EVs in Europe is nearly 50% for buses and 7% for trucks in 2030 (55% and 10%, respectively, for the European Union). Given the European Union’s net zero emissions by 2050 pledge, in addition to a number of European countries signing on to the MOU on Zero Emissions Medium- and Heavy-Duty Vehicles, the EV sales shares in the Announced Pledges Scenario increases to over 55% of buses and 20% of trucks (over 60% and 20% in the European Union).
In Europe, the EV sales share across all modes is over 35% by 2030 in the Stated Policies Scenario. In the Announced Pledges Scenario, by 2030, Europe has a combined EV sales share of 50% (for electric LDVs, buses and trucks).
Under the current administration, the United States has enacted more stringent fuel economy standards and passed the Infrastructure Investment and Jobs Act (referred to as the infrastructure law) that includes funding for EV chargers. Both are expected to boost electric LDV market uptake. In the Stated Policies Scenario, the United States achieves more than 20% sales share of electric LDVs in 2030. In the Announced Pledges Scenario, it meets the 2030 target of 50% EV PLDV sales, reaching that level across all LDVs.
The 2021 infrastructure law also includes grants for buses and related facilities, with a provision that at least 25% of funds must be dedicated to projects for low or zero emissions buses. In addition, California’s Innovative Clean Transit regulation requires 100% of new purchases by public transit agencies to be zero emissions buses from 2029, with the goal to achieve a full transition to zero emissions buses by 2040. As a result, the electric bus sales share in the United States reaches 30% in 2030 in the Stated Policies Scenario. The Announced Pledges Scenario assumes an acceleration of the electrification of buses is needed to achieve the net zero by 2050 target, reaching a sales share of over 40% in 2030.
Since California passed the Advanced Clean Truck regulation in 2020, five other states (Oregon, Washington, New Jersey, New York and Massachusetts) have adopted the regulation, which requires zero emissions truck sales to reach 30-50%, depending on class, in 2030. In the Stated Policies Scenario, the United States sees an electric truck sales share of 6% in 2030. This increases to 12% in the Announced Pledges Scenario, accounting for net zero ambitions and that additional states are considering to adopt the Advanced Clean Truck regulation. Although, the US EPA proposed a new rule for clean trucks in March 2022, this proposal has not been included in scenario projections, as the EPA is requesting comments on the appropriateness of further increasing the stringency of the GHG emissions standards beyond what is in the current proposal.
In the United States, the EV sales share across all modes (excluding two/three-wheelers) is 20% in 2030 in the Stated Policies Scenario and almost 50% in the Announced Pledges Scenario.
In the Stated Policies Scenario, Japan atttains a 20% electric LDV sales share, driven by its current fuel economy standards and recent trends. In the Announced Pledges Scenario, electrification of LDVs increases more rapidly, reaching over 30% in 2030, in line with the 20-30% EV sales target for PLDVs.
Buses are expected to electrify at a faster rate than LDVs, reaching almost 30% of sales in the Stated Policies Scenario and over half of sales in the Announced Pledges Scenario in 2030.
In the Stated Policies Scenario, by 2030 EV sales share in Japan across all modes (excluding two/three-wheelers) reach about 20%. In the Announced Pledges Scenario, EV sales shares are 30% across all modes (except two/three-wheelers).
India has placed an emphasis on electrifying two-wheelers, as evidenced by the 50% increase in purchase incentives for twowheelers in the modifications to the FAME II scheme and local policies such as in Delhi. The sales share of electric two/threewheelers increases from 2% in 2021 to almost 50% in 2030 in the Stated Policies Scenario and further to 60% in the Announced Pledges Scenario. The rate of electrification of buses and LDVs is lower, reaching 6% and 12% in 2030 in the Stated Policies Scenario, respectively. In the Announced Pledges electric buses attain around 25% sales share and LDVs about 30% sales share in 2030, reflecting India signing on to the COP26 declaration to transition to 100% zero emissions LDV sales by 2040.
EV sales share across all modes (including two/three-wheelers) in India is above 30% in 2030 in the Stated Policies Scenario (just over 10% excluding two/three-wheelers). In the Announced Pledges
Scenario, EV sales shares in India scale up to almost 45% in 2030 across all road vehicle modes (30% excluding two/three-wheelers).
A number of countries around the world have not yet developed a clear vision or set targets for electromobility. Notably the Global E-Mobility Programme is working with governments to advance deployment of EVs. A lack of fiscal incentives for EVs, charging infrastructure availability, and higher purchase price hurdles contribute to lower EV sales shares in many countries. Across other regions, in the Stated Policies Scenario, the EV sales shares averages about 6% for both LDVs and buses, and 1% for trucks in 2030.
The Announced Pledges Scenario results in higher electrification across the world, though emerging market and developing economies tend to lag behind the more advanced markets in terms of electrification and net zero emissions ambitions. In the Announced Pledges Scenario, the other region category averages EV shales shares of 15% for LDVs and buses and 3% for trucks. However, some
of these countries, e.g. Canada, Chile, Colombia, Israel, Korea, Pakistan and New Zealand, have adopted policies and other measures to support vehicle electrification and have net zero emissions pledges, and therefore have significantly higher sales shares than the averages listed above. For example, Canada’s EV sales share across modes (excluding two/three-wheelers) is more than 25% in the Stated Policies Scenario and over 50% in the Announced Pledges Scenario. Similarly, Korea averages an EV sales share of around 30% across modes in the Stated Policies Scenario and over 50% in the Announced Pledges Scenario.
OEM targets and registrations in the Stated Policies and Announced Pledges scenarios, 2030
Range of OEM declarations (estimate)
Stated Policies Scenario (2030)
Announced Pledges Scenario (2030) 2021
IEA. All rights reserved.
Notes: OEM = original equipment manufacturer. For medium- and heavy-duty trucks, OEM pledges cover the European Union (EU) and the European Free Trade Association (EFTA) whose members are Iceland, Liechtenstein, Norway and Switzerland The figure compares OEM targets for HDVs (which, for some OEMs, include buses) relative to our projections for zero emissions medium- and heavy-duty truck sales (including fuel cell electric vehicles). Since annual sales of trucks substantially outnumber sales of buses, achieving HDV targets will require making and selling zero emissions trucks, which currently is a more challenging prospect than selling electric buses. The regional average market share in 2030 is calculated by collating announcements that explicitly mention ZEV market shares or ZEV sales by the top-15 OEMs in each region. Electric bus and truck registrations and stock data can be interactively explored via the Global EV Data Explorer.
Sources: IEA analysis based on country submissions, complemented by ACEA; EAFO; EV Volumes.
Major original equipment manufacturers (OEMs) have outlined their visions for transitioning to electromobility by setting targets for ZEV sales. Recently, announcements pertaining to LDVs have multiplied, and heavy-duty vehicle OEMs have also established ZEV targets.
Two major initiatives that aim to transition to ZEVs were announced at COP26 in late 2021. The declaration on accelerating the transition to 100% zero emissions cars and vans unites public and private sector actors who want to work towards the sale of ZEVs exclusively by 2040 (and 2035 in leading markets). For HDVs, the Global Memorandum of Understanding (MOU) on Zero Emissions Mediumand Heavy-Duty Vehicles aims to achieve 30% ZEV sales shares for medium- and heavy-duty vehicles in 2030, and 100% ZEV sales by 2040. Around 40 private sector stakeholders, including heavy-duty OEMs, have also endorsed the MoU.
OEM announcements are most ambitious in Europe, and also quite ambitious in China, which may well reflect the level of policy ambition and commitments to transition to net zero emissions by 2050 in the European Union and by 2060 in China. OEM announcements in the United States lag in comparison. For most regions, the EV sales shares implied by the collective sum of all OEM announcements are more ambitious than the IEA’s assessment of government pledges, as tracked in the Announced Pledges Scenario.
All the top international car manufacturers in China have announced electrification pledges that range from 50% to 85% by 2030 or 2035. Similarly, smaller Chinese OEMs have clear electrification targets for the end of this decade.
BYD, a major Chinese automaker, endorsed the Global MoU on Zero Emissions Medium- and Heavy-Duty Vehicles. Beyond this, Jeifang, the market leader in HDVs in China, has announced its goal to reach 20% sales shares of new energy vehicles by 2025, 50% by 2030, and 70% by 2035. Another major HDV maker, Beiqi Foton, aims to sell 20 000 new energy HDVs by 2025.
All major OEMs active in Europe have pledged to electrify the majority of their sales between 2030 or 2035. For example, Volkswagen and Stellantis, which together make up about 30% of Europe’s automotive market by volume, have pledged to sell 70% and 100% EVs, respectively, by 2030.
A joint statement was signed by the European Automobile Manufacturers Association (ACEA) and the Potsdam Institute for Climate Impact Research that targets 100% ZEV heavy-duty vehicle sales by 2040. For instance, Scania has pledged to offer an electric
model in every medium- and heavy-duty vehicle segment by 2025. Signatories of the statement collectively make up more than 90% of Europe’s HDV market.
OEMs in the United States have recently announced very ambitious electrification targets, with both Ford and General Motors aiming to exclusively sell ZEVs by 2035. Pure electric vehicle OEMs also play an important role. If Tesla’s production plans are successful, they would significantly contribute to the United States and global EV market share by 2030.
Among the major heavy-duty vehicle OEMs operating in the US market, Freightliner Western Star, a subsidiary of Daimler, aims to offer only CO2-neutral HDVs by 2039 in Europe, North America and Japan. The electric bus maker, Proterra, and the ZEV truck start-up, Nikola, have endorsed the Global MoU on Zero Emissions Mediumand Heavy-Duty Vehicles.
The EV30@30 Campaign – under the Electric Vehicle Initiative (EVI) – was launched at the 8th Clean Energy Ministerial meeting in 2017 to spur the deployment of EVs. It sets a collective aspirational goal for EVs (excluding two/three-wheelers) to reach 30% sales share by 2030 across all signatory countries. This is the benchmark against which progress is to be measured for the EVI members. Fourteen countries and 23 companies and organisations endorsed and support the campaign. Co-ordinated by the IEA, the campaign includes five implementing actions to help achieve the goal in accordance with the priorities and programmes of each EVI member country. These include:
• Support and track the deployment of EV chargers.
• Galvanise public and private sector commitments to incorporate EVs in company and supplier fleets.
• Scale up policy research and information exchange.
• Support governments through training and capacity building.
• Establish the Global EV Pilot City Programme to achieve 100 EV Friendly Cities over five years.
The target of collectively reaching 30% of EV sales by 2030 is now within reach of the Stated Policies Scenario for the campaign signatories. The same target, at a global level is close to the Announced Pledges Scenario.
Despite the ambition of the 30% target, for the world to reach net zero emissions by 2050, the market share would need to be twice as high.
All rights reserved.
Notes: STEPS = Stated Policies Scenario; APS = Announced Pledges Scenario; NZE = Net Zero Emissions by 2050 Scenario. The EV30@30 signatory countries include: Canada; Chile; China; Finland; France; Germany; India; Japan; Mexico; Netherlands; Norway; Portugal; Sweden; and United Kingdom.
Electricity demand for EVs in 2030 in the Announced Pledges Scenario is higher than total electricity generation in Japan in 2020…
Electricity demand from the global EV fleet by scenario, 2021-2030
Electricity demand by mode
Electricity demand by country/region
IEA. All rights reserved.
Notes: TWh = terawatt-hours; STEPS = Stated Policies Scenario; APS = Announced Pledges Scenario; NZE = Net Zero Emissions by 2050 Scenario; LDV = light-duty vehicle; RoW = rest of the world. The analysis is carried out for each region in the transport model within the IEA's Global Energy and Climate Model (GEC-Model) separately and then aggregated for global results. For the Net Zero Emissions by 2050 Scenario, only global values are reported. Regional data can be interactively explored via the Global EV Data Explorer.
The global EV fleet in 2021 consumed about 55 terawatt-hours (TWh) of electricity 25 (about 10% of which was for electric two/threewheelers in China), which equates roughly to current total electricity demand in the Czech Republic. Electricity demand from EVs accounts for less than half a percent of current total final electricity consumption worldwide.
The expectation is for rapid growth of the EV fleet. Electricity demand for EVs is projected to reach almost 780 TWh in the Stated Policies Scenario and over 1 100 TWh in the Announced Pledges Scenario in 2030. Notably, the Announced Pledges Scenario electricity demand is about 50% higher than in the Stated Policies Scenario, despite the stock of EVs only being 35% higher. This is in part because in the Announced Pledges Scenario, EV adoption accelerates in countries with relatively high average vehicle mileage, like the United States. Additionally the share of BEVs out of total EVs is higher in the Announced Pledges Scenario and it is assumed that in countries with net zero pledges, a larger share of energy consumption in PHEVs is provided by electricity (as opposed to gasoline or diesel). This is particularly relevant for LDVs, which account for about two-thirds of demand in both scenarios. By 2030, electricity demand for EVs
25 Note this value is lower than what was presented in the Global EV Outlook 2021 regarding EV electricity consumption in 2020 due to updated data and assumptions as described in the annex The majority of this difference comes from the reduced number of two/three-wheelers in China.
accounts for at least 2% of global final electricity consumption in both scenarios.
The EV fleet becomes an increasingly important factor for power systems in both scenarios, with its implications for peak power demand and transmission and distribution capacity being key considerations. Careful planning and fostering smart charging (managed charging to avoid contributing to peak load) is of crucial importance. Encouraging slow charging, the timing of which can be more easily managed to ensure optimal planning, smooth operation and resiliency of power systems, can also help. More than half of EV electricity demand in 2030 in both scenarios is via slow chargers.
China remains the largest consumer of electricity for EVs in 2030, although its share in global EV electricity demand decreases significantly (from 60% in 2021 to around 35% in the Stated Policies Scenario and 30% in the Announced Pledges Scenario). This reflects wider adoption of electromobility across other countries in the period to 2030.
Expanding the EV stock reduces oil use, which today accounts for over 90% of total final consumption in the transport sector and is a
critical energy security consideration. Globally, the projected EV fleet (excluding two and three wheelers) in 2030 displaces about 3.4 million barrels per day (mb/d) of diesel and gasoline in the Stated Policies Scenario and about 4.6 mb/d in the Announced Pledges Scenario, up from about 0.3 mb/d in 2021. For context, Germany consumed around 2 mb/d of oil products across all sectors in 2020. However, the recent price spikes for critical minerals that are important inputs to battery manufacturing, and the tense market situation for key materials such as steel, are a stark reminder that energy security considerations evolve in the transition to electromobility and require regular reconsideration.
Share of electricity consumption attributable to EVs relative to final electricity demand by region and scenario, 2021 and 2030
Sources: Electricity demand from EVs was derived with the road transport model of IEA's GEC-Model; total final electricity consumption from the World Energy Outlook 2021.
The sale of oil products for road transport is currently a business worth more than USD 1.4 trillion each year. 26 As EVs become more widespread, the demand for charging will increase, opening new market opportunities for utilities and charging station operators. Residential charging is a retail business opportunity for utilities, while charging station operators will draw revenue from public charging. Investments are needed now in order to develop adequate charging networks.
Electricity for home charging is generally priced at residential tariffs while depot charging for commercial vehicles and buses is generally priced at commercial tariffs. Residential rates may be the lowest cost for EV owners. As distributed generation such as from rooftop solar photovoltaics becomes more widespread, at home charging may get cheaper. Electricity from public chargers tends to be more expensive as charging operators need to build in the capital expenditure for the equipment and land acquisition or leasing, as well as higher fixed grid connection costs due to their high power rating.
There are also significant regional variations. Inthe United States and Europe, public fast charging prices tend to be two to four times higher than residential rates, while in China they are only two times higher than residential rates. This can be attributed to economies of scale in charger manufacturing, decreasing the capital expenditures, as well as higher utilisation rates of the infrastructure and differences in retail electricity markets.
Electricity sales to charge EVs currently accounts for about 55 TWh and are valued at almost USD 8.5 billion per year. The majority of revenue is from residential and depot charging (65%), while public charging takes the remainder of global sales today. China is the largest market with a value of almost USD 4 billion.
In the Stated Policies Scenario, the value of the electric charging market increases to USD 135 billion per year by 2030, reaching almost USD 190 billion if governments meet their domestic climate pledges. Europe is set to be the largest market in monetary terms
26 In this section, the market estimation is based on electricity prices and demand by charger type. There are other value-added opportunities, such as using EVs as a resource for the grid (V1G or V2G), but these are not included in this estimation.
due to higher average prices and a large projected EV stock. China follows suit as its even larger projected fleet has access to cheaper electricity.
Today public charging accounts for roughly a third of the charging market as the majority of EVs are charged at home. The current business case for investors in public charging infrastructure is challenging due to low utilisation rates and high grid connection costs. However, by 2030, utilisation rates of public chargers are expected to increase in all markets, significantly improving the business case for charging operators. In particular, the projected market size for fast chargers is expected to be larger than that for slow public chargers.
EV charging market size by scenario, 2021-2030
Charging market size by region
Charging market size by type of charger
IEA. All rights reserved.
Notes: STEPS = Stated Policies Scenario; APS = Announced Pledges Scenario; RoW = rest of the world; LDV = light-duty vehicle (includes passenger LDVs and LCVs); HDV = heavy-duty vehicle (includes buses, medium-duty trucks and heavy-duty trucks). For LDVs, residential and workplace chargers are slow chargers that provide power less than or up to 22 kW, while fast chargers provide more than 22 kW. (For additional details about LDV charger classification by rated power, refer to Global EV Outlook 2019. For HDVs, depot chargers are mostly for overnight charging with assumed power ratings between 50-100 kW, while opportunity chargers are assumed to be 150 kW and higher.
Public
Electric LDV charger stock
Electric LDV charger capacity
Electric LDV chargers and cumulative installed charging power capacity by scenario, 2021-2030 IEA. All rights reserved.
Notes: TW = terawatts; STEPS = Stated Policies Scenario; APS = Announced Pledges Scenario; LDV = light-duty vehicle. For reference, in 2020, 133 gigawatts of solar PV capacity was installed worldwide, which is similar to the estimated total installed capacity of LDV electric vehicle supply equipment (EVSE) in 2021. For 2021, public charger stocks are based on data from country surveys; private charger stocks are estimated. Regional projected EVSE stock data can be interactively explored via the Global EV Data Explorer.
chargers account for less than 10% of stock in 2030, but reach nearly 40% of installed capacity due to higher power ratings
Charging infrastructure needs to increase more than twelve-fold by 2030 to support the growth of electric cars projected in the Announced Pledges Scenario, adding 22 million charging points annually – 1.3 times more than cumulatively have been deployed so far. Suitable access to electric vehicle supply equipment (EVSE) is essential for electric LDV owners.
There are two broad categories of chargers:
Private Chargers: These are private chargers located at residences or workplaces (or in the case of some LCVs at a depot). They have power ratings that typically range from 3 kW to 22 kW. Electricity pricing through these chargers is typically similar to residential or commercial tariffs, and thus may offer the cheapest charging option. Today, this is the primary means of EV charging, with an estimated 15 million private charging points worldwide. Two/three-wheelers almost exclusively use private chargers (which can be as simple as a power socket).
Publicly accessible chargers. These are street accessible chargers that generally are located in urban areas, such shopping centres, parking garages or other sites, or along transport corridors. Their power ranges from 11 kW to 350 kW for PLDVs. The electricity pricing for public chargers tends to be higher than private chargers
since equipment and grid connection costs have to be recovered. Prices tend to be correlated with the power rating – we estimate that ultra-fast chargers (more than 150 kW) sell electricity for about a 40% higher price on average than slow public chargers (i.e. ≤ 22 kW).
Public charging networks are needed to enable EV owners to undertake long-distance journeys (such as on highways), and for EV owners without access to a home charger (such as in large cities). Currently, there are about 1.8 million public EV charging points worldwide.
EVSE projections for LDVs in this Outlook are based on the expected evolution of charging networks by charger type (i.e. private or public). This in turn depends on the building stock of each country (single family residences versus multi-unit dwellings), which serves as a proxy to represent access to residential chargers. The projections for publicly available chargers are based on region-dependent historical trends regarding the number of EVs per public charger and the EV stock share, where it is generally assumed that as stock share increases over time, the ratio of EVs to public chargers will also increase.
The estimated global number of private LDV chargers (residential and workplace) in 2021 is 15 million. As EV penetration increases, an increasing number of private chargers continue to account for the vast majority of charging infrastructure. Private chargers account for 90% of all chargers in both scenarios in 2030, but closer to 60% of installed capacity due to the lower power rating relative to public chargers. In addition, private chargers meet about 65% of the energy demand in both scenarios, 330 TWh in the Stated Policies Scenario and 500 TWh in the Announced Pledges Scenario by 2030.
Private charging, at home or workplace, is currently the dominant source of charging in many countries. Access to home chargers is the main determinant of private versus public charging behaviour. Most early adopters of EVs have access and use a home charger as a primary source of charging since they can benefit from lower electricity rates and are not dependent on a small, albeit expanding, public charging infrastructure. For example, today in the United States, 88% of EVs have access to residential charging.
Access to residential charging depends largely on the distribution of housing types and the vintage of buildings. Single-unit houses are more likely to have the option to install a residential charger. Newer buildings are more likely to have the required infrastructure to provide private charging to parking spaces. There is significant variation in residential charging accessibility across population groups within a country, as well as across countries. In the United States, for
example, 70% of detached single-unit households have access to home charging, while access can be as low as 10-20% for rented apartments. On the other hand, in China only about 40% of households have access to residential parking and fewer have access to a charger. This is common across regions where the majority of people live in multi-unit dwellings with limited parking spaces in urban areas. In addition to lower access to residential chargers in China, notable differences in charging behaviour are taken into account as even EV owners that have access to a home charger meet only 50% of their charging demand at home. This can be explained by the widely accessible public charging network with affordable prices in China.
Given the current composition of housing types and vehicle ownership, it is estimated that between 50% and 60% of all cars are owned by households that have residential charging access in Europe and the United States (and the share is higher when considering EV ownership). In China, the same value is below 40%.
By 2030, less than 15% of the car stock is electric in the Announced Pledges Scenario in most countries. Therefore, the majority of EV owners in 2030 plausibly will continue to have access to a residential charger. In China and European countries with higher EV penetration, with up to 20% of LDV stock being electric, we see a small decline in average residential charging access as more EVs are adopted by multi-unit dwelling households. The increased availability of workplace charging further strengthens the share of private
charging. By 2030, the share of energy delivered by private charging is projected to account for roughly 70% of all electricity delivered to electric cars in Europe and the United States, and around half in China.
Given the importance of private charging, it is key to ensure that residential and other private parking spaces have access to EV charging. For instance, China’s government target requires fixed parking spaces in newly built residential communities to have charging facilities or meet conditions for installations, which will make residential charging more available. In the European Union, the Energy Performance of Buildings Directive (and its more ambitious proposed revision) is expected to enhance residential and workplace charging opportunities. However, the relatively low share of new construction in Europe means that retrofitting of buildings will also have to play an important role. In parallel, policies need to ensure affordable and fair access for people that will rely mostly on public chargers to reduce charging barriers for those living in apartments
All rights reserved.
Notes: STEPS = Stated Policies Scenario; APS = Announced Pledges Scenario. Home and workplace chargers are slow chargers that provide power less than or up to 22 kW. Fast chargers provide more than 22 kW. For additional details about charger classification by rated power, refer to Global EV Outlook
Publicly accessible chargers accounted for almost 10% of global LDV chargers in 2021, of which 1.2 million were slow and a half a million were fast chargers. China accounts for 65% of all public chargers. As the number of EVs on the road increases, so does the number of installed publicly accessible chargers. The cost premium for public chargers is likely to decline as economies of scale help to decrease equipment costs; in China, charger costs declined 67% from 2016 to 2019. However, the benefits of economies of scale may be offset by additional costs associated with grid upgrades as further installation of chargers exceeds the limits of the current grid capacity.
There are more than 8 million slow public charging points and almost 5 million public fast charging points by 2030 in the Stated Policies Scenario. This accounts for 90 gigawatts (GW) of public slow charging installed capacity and almost 500 GW of public fast installed capacity. Publicly accessible chargers provide a third (170 TWh) of all electricity for EV charging in 2030.
In the Announced Pledges Scenario, there are nearly 10 million public slow chargers and 5.5 million public fast chargers by 2030 corresponding to installed capacities of about 110 GW and 550 GW respectively. In general, it is assumed that as the stock share of EVs increases as the number of public chargers per EV decreases. However, in the near term, when EV adoption is low, more chargers per vehicle are needed to encourage their uptake, yet until the
number of EVs increase the utilisation rate of each charger may be low. This makes it difficult to recover capital costs and earn profit for operators. In this phase, government support can help bolster the economic case for public chargers.
Public LDV chargers by region and scenario, 2021-2030
IEA. All rights reserved.
Notes: STEPS = Stated Policies Scenario; APS = Announced Pledges Scenario; EVSE = electric vehicle supply equipment; RoW = rest of the world. Regional projected EVSE stock data can be interactively explored via the Global EV Data Explorer.
As more EVs get on the road, it is expected that the charging networks will be better optimised and utilisation rates will increase. This higher utilisation rate of chargers means that the growth of public chargers from the Stated Policies Scenario to the Announced Pledges Scenario does not need to keep pace with the increase in EVs, as the same number of chargers can provide more energy when utilisation is higher. In the longer term, government support might still
be helpful to ensure that charging infrastructure is available to all citizens, including those in rural and lower income areas.
While many countries have allocated funds to support EVSE deployment, strategies differ by region. In the European Union obligations are proposed for public chargers based on minimum power per EV (1 kW for each BEV and 0.66 kW for each PHEV). In the Stated Policies Scenario, this minimum requirement would equate to 36 GW of public charging given expected EV deployment, and about 45 GW in the Announced Pledges Scenario. In our projections of public EVSE developments, public charging capacity is about 15% higher. In terms of the number of charging points in the European Union, the Sustainable and Smart Mobility Strategy describes a target of 3 million publicly accessible charging points in 2030. This target is 50% higher than our estimate of 2 million public chargers in 2030 in the Announced Pledges Scenario (a sevenfold increase over the current stock of public chargers in the European Union). In the Announced Pledges Scenario, we estimate 25 electric LDVs per public charger in 2030.
In March 2022, the United Kingdom government announced a goal to reach 300 000 public charge points by 2030. This target is aligned with oue estimate of just over 300 000 public charge points in the Announced Pledges Scenario in 2030, an eightfold increase compared to the current stock. Our projections of electric LDV and
EVSE stocks would equate to about 35 EVs per charge point, with about 10.5 GW of installed public EVSE capacity to support 7.5 million BEVs and about 3.5 million PHEVs in 2030 in the Announced Pledges Scenario.
In the United States, the 2021 Infrastructure Investment and Jobs Act set aside funds to support the target of 500 000 public EV chargers. In the Stated Policies Scenario and the Announced Pledges Scenario, the number of public chargers in the United States reaches over half a million by 2025. By 2030, the estimated number of public chargers is over 1.3 million in the Announced Pledges Scenario (almost a 12-fold increase compared to the current stock), with about 30 EVs per charge point. Thus, it is expected that private company investment will be needed to complement public funding and reach the number of chargers required to support the projected deployment of electric cars.
Similarly, in 2021 Japan allocated funding with the ambition to deploy 150 000 charging points by 2030. In the Stated Policies Scenario, the number of public chargers reaches more than 160 000 in 2030 and 180 000 in the Announced Pledges Scenario, representing a five to sixfold increase in the stock of public charging points. Based on our vehicle projections, and achieving Japan’s target of 30% EV sales share in 2030 in the Announced Pledges Scenario, the targeted 150 000 charge points in 2030 would imply a ratio of over 60 electric LDVs per public charger (even higher than the 50 EVs per charge point in our projections). Almost half of the electric LDV stock in Japan
in 2030 is expected to be PHEVs, which will not rely as heavily, if at all, on public charging infrastructure.
China aims to increase the total number of charging stations by a factor of 12 by 2025 (13 million slow charging stations and 0.8 million fast charging stations). In both the Stated Policies Scenario and the Announced Pledges Scenario, the estimated number of public chargers reaches less than 4 million in 2025 and about 9 million in 2030, about an eightfold increase in the period to 2030. In our EV projections, China reaches about 40 million electric LDVs in 2025; reaching their EVSE target would imply one public charge point for about every three electric LDVs. Therefore, reaching this target would make the charging network in China significantly more dense than other regions, with a risk of under utilised infrastructure. Our EVSE projections assume China maintains a relatively high ratio of public chargers per EV, however, the ratio is closer to 10 EVs per charge point, despite a decreasing share of residential chargers per EV.
Charging service providers are introducing faster chargers and, in parallel, the fast charging capabilities of EVs are increasing. New technologies, such as 800 Volt power systems are enabling faster charging, a trend that also helps keep charging times short even as batteries increase in size.
Chargers located on highways and other main transport corridors are perfect candidates for ultra-fast chargers of up to 350 kW. These types of chargers will be necessary to enable EV owners to seamlessly undertake long road trips.
A number of government policies and targets are in place to facilitate and expedite the installation of infrastructure along key highways. In China, the government targets at least 60% of the national highway infrastructure to be covered by charging stations. EV charging planning standards require charging stations to be sited within 50 km of each other on highways that connect major Chinese cities (Shanghai, Suzhou, Xichang and Guangzhou). India aims to install charging stations every 40 – 60 km along its highways. In Europe, the latest AFIR proposal includes gradual requirements to install charging stations every 60 km, in each direction of travel, with minimum charging pool of at least 300 kW by 2025 (with at least one ultra-fast charger) and 600 kW by 2030. Optimal sizing and location of highway charging stations is key, as grid connection costs can be extremely expensive for high power charging stations and such chargers put further strain on power grids.
Three classifications of chargers are considered: depot charging; destination charging (such as at distribution centres for trucks); and public charging. Depot charging is the cheapest and most convenient form to charge HDVs. Therefore, it is the preferred option, except when trucks and buses have duty cycles where the route length exceeds the electric driving range of the vehicle.
In the period to 2030, the adoption of battery electric HDVs is expected to be most rapid for city buses and urban and regional delivery applications with short range routes (under 200 km/day). For these cases, buses and trucks can be expected to rely mainly on depot charging, which can occur overnight or during breaks. As electrification of intercity buses and long-haul trucks increases, public chargers, especially along highways, will be required. For instance, more than 50% of journeys taken by European freight trucks today have a distance band more than 300 km, making highway charging imperative to reach the destination, though electric truck driving ranges are expected to increase over time.
The number of bus depot chargers increases from about 65 000 today to almost 600 000 in 2030 in the Stated Policies Scenario, with a total capacity of over 50 GW. In the Announced Pledges Scenario, the number of bus depot chargers increases to 750 000 with capacity of almost 70 GW. In 2030, the number of
opportunity chargers, along routes, for buses is two orders of magnitude lower than depot chargers, reaching less than 3 500 chargers in both scenarios. In general, depot bus chargers are assumed to have an average power rating between 50 kW and 100 kW, while opportunity chargers for buses are assumed to range between 150 kW and 500 kW.
Charger stock and capacity by type and scenario, 2021-2030 IEA. All rights reserved.
Notes: GW = gigawatts; STEPS = Stated Policies Scenario; APS = Announced Pledges Scenario.
To support electric trucks, the number of depot chargers increases from around 7 000 today to over 260 000 in 2030 in the Stated Policies Scenario and 390 000 the Announced Pledges Scenario. In
both scenarios, opportunity chargers for trucks constitute only about 5% of truck chargers in 2030, yet up to 20% of truck charging capacity, reflecting the high power rating needed for opportunity charging of trucks. Depot chargers for trucks have an assumed average power rating around 100 kW, while opportunity chargers for trucks range from 150 kW to 1 megawatt (MW).
Oil displacement by scenario, 2021-2030
Oil displacement by region
Oil displacement by mode
IEA. All rights reserved.
Notes: mb/d = million barrels per day; STEPS = Stated Policies Scenario; APS = Announced Pledges Scenario; NZE = Net Zero Emissions by 2050 Scenario; LDV = light-duty vehicle. For reference, today’s global car stock consumes about 20 mb/d of oil products. The analysis is carried out for each region in the road transport model of IEA's GEC-Model separately and then aggregated for global results. Regional data can be interactively explored via the Global EV Data Explorer.
Taxes on automotive fuels derived from oil are an important source of government revenue in many countries, often used to support core functions such as investment in roads and other transport infrastructure. By reducing consumption of oil products, the uptake of EVs lowers the amount of revenue that governments derive from oilrelated taxes, which may not be fully compensated by levies on the increased electricity use (assuming current tax rates). The net effect is a tax loss, stemming from the combined effects of lower overall energy consumption (EVs are two-to-four times more efficient than comparable internal combustion engine vehicles) and the different taxation levels of electricity and oil products.
Reductions in government taxes due to EVs are limited today, but the scale of the global EV fleet by 2030 implies a possible net fuel tax loss of almost USD 75 billion in the Stated Policies Scenario and USD 90 billion in the Announced Pledges Scenario. Europe is expected to see the largest net loss, around USD 35 billion in 2030, due to the relatively high tax rate on oil products.
It will be important for governments to anticipate this reduction in fuel tax revenues and design mechanisms that enable continued support for EV deployment while limiting the impact on tax revenue. A principal way to deal with the issue in the short term is to flexibly adapt existing taxation schemes to changes in the fuel market, balancing the net decline in use. However, these short-term measures cannot
be protracted in time, as they risk creating distortions and equity issues. In addition, the current volatile oil markets and very high prices at the pump as a result of Russia’s invasion of Ukraine mean that such a measure is unlikely to be practical in the near term.
Additional tax revenue from electricity and tax loss from displaced oil products by region and scenario, 2021-2030
IEA. All rights reserved.
Notes: STEPS = Stated Policies Scenario; APS = Announced Pledges Scenario. Fuel tax rates are assumed to remain constant after 2021.
Sources: IEA analysis developed with the road transport model of IEA's GEC-Model using taxes from IEA Energy Prices.
The longer term measures to stabilise tax revenues involve deeper reforms in tax schemes. These, for example, could include coupling higher taxes on carbon-intensive fuels with distance-based charges. Road taxes or distance-based charges applied to EVs serve better as longer term measures, once price parity has been reached, so that EV adoption is not slowed in the short term.
Widespread EV adoption will reduce air pollution and GHG emissions, implying reduced health and environmental damages and a reduction in their associated societal costs. Further, well-designed distance-based charges, such ones that vary by time, place and vehicle type, could also address negative externalities including traffic congestion, road infrastructure damage and noise.
Well-to-wheel GHG emissions from the global EV fleet by scenario, 2021-2030
IEA. All rights reserved.
Notes: Mt CO2-eq = million tonnes of carbon dioxide-equivalent; LDV = light-duty vehicle; ICE = internal combustion engine; GHG = greenhouse gases. Well-to-wheel emissions include those from fuel production and vehicle use, but not vehicle manufacturing. Positive emissions are from: global EV fleet (BEVs and PHEVs); associated with electricity production; and transmission and distribution. Negative emissions are those that would have been emitted by an equivalent ICE vehicle fleet, including gasoline, diesel and natural gas. The red dots denote net GHG emissions savings from EVs in comparison with an equivalent ICE fleet. Regional well-to-wheel GHG emissions can be interactively explored via the Global EV Data Explorer.
Sources: IEA analysis developed with the road transport model of IEA's GEC-Model using carbon intensity values from the Global Fuel Economy Initiative 2021 benchmarking report.
In 2021, EVs enabled a net reduction of 40 million tonnes of carbon dioxide-equivalent (Mt CO2-eq) on a well-to-wheel basis, roughly equivalent to the entire energy sector emissions of Finland. Despite its carbon-intensive electricity mix, the biggest savings were achieved from EVs in China, where almost 45% of the emissions reductions come from the electrification of two/three-wheelers.
The expanding fleet of EVs is set to continue to reduce GHG emissions on a well-to-wheel basis through 2030 compared to what would otherwise be a continued reliance on ICE vehicles powered by liquid or gaseous fossil fuels. The net GHG benefit of EVs increases over time as electricity decarbonises.The global average GHG intensity of electricity generation and delivery falls by 20% from 2021 to 2030 in the Stated Policies Scenario (30% in the Announced Pledges Scenario). Well-to-wheel emissions of gasoline and diesel also fall in the Stated Policies Scenario through the application of technologies to reduce methane emissions, but only by 2% (4% in the Announced Pledges Scenarios).
As a result, the net GHG emissions avoided from the use of EVs reaches 460 Mt CO2-eq in 2030 in the Stated Policies Scenario. The production of electricity to fuel the EV fleet in 2030 in the Stated Policies Scenario results in 280 Mt CO2-eq emissions, but this is
more than offset by the avoidance of 740 Mt CO2-eq that would have been emitted from an equivalent ICE vehicle fleet.
In the Announced Pledges Scenario, the GHG benefit of EV adoption increases further both from a higher stock of EVs and a lower GHG intensity of electricity generation. The net GHG emissions avoided in 2030 are nearly 580 Mt CO2-eq, where EVs are responsible for 340 Mt CO2-eq emissions, but also for the displacement of 920 Mt CO2-eq that would have resulted from the equivalent ICE vehicle fleet.
Recent IEA analysis indicates that EVs also currently provide lifecycle GHG emissions benefits (accounting for emissions from vehicle manufacturing – including mineral extraction and material production – and vehicle end-of-life, in addition to well-to-wheel emissions) on the order of a 50% reduction compared with conventional ICE vehicles on a global average. Although GHG emissions benefits could be partially eroded by future design aspects, such as an increasing battery size or alternative battery chemistries, it is estimated that overall lifecycle benefits of EVs will continue to increase as the energy system decarbonises, widening the gap between lifecycle GHG emissions of EVs and ICE vehicles.
Battery demand by mode, 2015-2021
Battery demand by region, 2015-2021
IEA. All rights reserved.
Notes: GWh = gigawatt-hours; PLDVs = passenger light-duty vehicles; other includes medium- and heavy-duty trucks and two/three-wheelers. This analysis does not include conventional hybrid vehicles.
Sources: IEA analysis based on EV Volumes.
Mineral composition of different battery cathodes LDV EV cathode sales share, 2017-2021
Lithium Nickel Cobalt Manganese Aluminium Iron and phosphorous
Notes: LDV = light-duty vehicle; LFP = lithium iron phosphate; NMC = lithium nickel manganese cobalt oxide; NCA = lithium nickel cobalt aluminium oxide. Low-nickel includes: NMC333. High-nickel includes: NMC532, NMC622, NMC721, NMC811, NCA and NMCA. Cathode sales share is based on capacity. Sources: IEA analysis based on EV Volumes.
IEA. All rights reserved.
High-nickel cathode battery chemistries remain dominant though lithium iron phosphate is making a comeback
Automotive lithium-ion (Li-ion) battery demand was 340 gigawatt-hours (GWh) in 2021, more than twice the level of 2020. This increase is driven by the increase in electric passenger cars (registrations increased by 120%). The average battery capacity of battery electric vehicles (BEVs) was 55 kilowatt-hours (kWh) in 2021, down from 56 kWh in 2020, whereas the average capacity increased for plug-in hybrid electric vehicles to 14 kWh in 2021, up from 13 kWh in 2020. Battery demand for other transport modes, including medium- and heavy-duty trucks and two/three-wheelers, increased by 65%. Average battery capacities for BEV light-duty vehicles changed regionally, with increases of more than 10% occurring in Korea and several European countries.
China experienced unprecedented growth and accounted for the largest share of automotive battery demand, with almost 200 GWh of battery demand in 2021, up 140% from 2020. Growth was also impressive in the United States where demand more than doubled in 2021, albeit from a lower base. Europe’s demand growth was slightly lower than last year, yet it still increased more than 70%.
The surge in battery demand was met in 2021 due to sufficient battery factory capacity. The nameplate capacity of a factory is the intended full-load sustained output of a facility. Calculated as total demand of EVs, consumer electronics, and stationary storage batteries over the nameplate capacities of all battery plants, the global average
utilisation rate for battery factories was 43% of nameplate capacity in 2021, up from 33% in 2020. The low global average utilisation rate is explained by two primary factors. First, there was strategic early investment in battery plant capacity to prepare for projected demand growth. Second, some factories are still ramping up production capacity to reach nameplate capacity, a process that can take from three to six years.
A key defining feature of batteries is their cathode chemistry, which determines both the battery performance and its material demand. For the automotive sector, three broad categories of cathode chemistry are most relevant today: lithium nickel manganese cobalt oxide (NMC); lithium nickel cobalt aluminium oxide (NCA); and lithium iron phosphate (LFP). NMC and NCA cathodes have become increasingly dominant as they offer high energy density based on higher nickel content in the cathode. Higher nickel content, however, requires more complex and controlled production processes. LFP is a lower cost and more stable chemistry, with lower risk of catching fire and a longer cycle life. It typically only has 65 - 75% of the energy density compared with a high-nickel NMC such as NMC811, although recent technology innovations have significantly improved their energy density. NCA is used exclusively by Tesla.
Nickel-based chemistries, such as NMC and NCA, were dominant in the electric car battery market in 2021 with 75% of cathode material demand share due to their advantages for driving range. However, there has been a major resurgence of LFP over the last two years, reaching an EV cathode material demand share of 25%, mainly driven by the increased uptake of electric cars in China. LFP is still used for most medium- and heavy-duty vehicle applications due to its superior cycle life, which suits intensive usage and frequent charging, and the fact that most electric medium- and heavy-duty vehicles are in China, where LFP is mainly used. The cost advantages for LFP in China became more apparent recently as subsidies that favoured high-nickel chemistries were phased out.
Cathode and anode demand surged alongside battery demand in 2021. Demand for cathode material reached 520 kilotonnes (kt), more than doubling from 2020. Demand for anode material also doubled to reach 300 kt. The significantly higher material requirement for cathode material is due to the much higher energy densities of the graphite anodes in comparison to leading cathodes, thus requiring less anode material per cell.
Battery cathode and anode material demand IEA. All rights reserved.
Notes: kt = kilotonnes; LFP = lithium iron phosphate. Nickel-based cathode includes: lithium nickel manganese cobalt oxide NMC333, NMC532, NMC622, NMC721, NMC811; lithium nickel cobalt aluminium oxide (NCA) and lithium nickel manganese cobalt aluminium oxide (NMCA).
Sources: IEA analysis based on EV Volumes
Nickel-based chemistries retained dominance of the market in 2021 with 85% of EV battery demand. However, there has been a major resurgence of LFP battery chemistries over the last two years with 15% of EV battery demand in 2021, doubling from 7% in 2020, primarily driven by increasing uptake of LFP in electric cars in China. LFP demand share in LDVs in China more than doubled from 11% in 2020 to 25% in 2021, despite the lower energy density of LFP than high-nickel chemistries. Given high battery metal prices, LFP has become more attractive as it contains no cobalt or nickel, instead using low cost iron and phosphorous (though remaining exposed to rising lithium prices). LFP relies on lithium carbonate rather than hydroxide used for nickel-rich chemistries.
The cost advantages of LFP in a high commodity price market are one reason for the resurgence. Another is the recent innovation of cell-to-pack (CTP) technology, eliminating the need for modules to house cells in the battery pack, thereby reducing the dead weight in the pack and improving the energy density of LFP batteries. CTP technology was pioneered by BYD with the Blade battery and it continues to be improved. CATL released their third-generation CTP battery increasing the LFP pack energy density to around 85% of a conventional NMC811 battery. CTP is also being applied to high-nickel chemistries to further improve their energy density.
LFP production is mostly limited to China – the traditional main hub for the LFP battery chemistry. One reason for this is LFP patents; the research consortium owning the patents formed an agreement with battery makers in China in which they would not be charged a licence fee for using LFP if only used in China. These patents and licence fees are set to expire in 2022 making production and sales abroad more attractive. Another key reason is the early subsidies in the LFP supply chain in China.
LFP is now set to surge globally. Recently, major non-Chinese EV manufacturers, such as Tesla and Volkswagen, announced moves to LFP chemistries for entry-level high volume EV models. Almost half of all Tesla EVs produced in the first-quarter of 2022 used LFP. LFP battery production is now planned in Europe and the United States to meet anticipated LFP demand for EVs in these regions.
A surge in LFP poses a challenge for battery recycling as it is difficult to make a profit recovering iron and phosphorous. Without valuable metals such as nickel and cobalt, the value that can be recovered from LFP batteries drops considerably from conventional recycling methods and its economic viability is a concern. LFP appears to require direct recycling to be profitable or will require regulatory intervention, frameworks or alternative business models.
High battery demand has spurred significant increases in demand for key metals used in their production. Between the start of 2021 and May 2022 lithium prices increased more than sevenfold and cobalt prices more than doubled. Nickel prices almost doubled over the same period reaching levels not seen for almost a decade.
The unprecedented battery metal price rises have been caused by a combination of surging battery demand, increasing pressure on supply chains and concerns around tightening supply. The supply constraints have been driven by three trends: first, production challenges caused by the pandemic; second, concerns around Class 1 nickel supply from Russia; and third, structural underinvestment in new supply capacity during the three years preceding 2021 when metal prices were low. Some producers delayed or even curtailed planned projects and expansions due to low lithium prices. For example, the Australian mining company Galaxy Resources reduced lithium mine production at its most important mine by about 40% in 2019 as did other Australian lithium mining companies. The last time there was a price surge in battery metal prices was for lithium and cobalt in 2017 due to optimistic expectations for growth in battery demand, before prices collapsed in 2018. Lithium has reached unprecedented price levels today being almost 200% higher than its previous peak.
Cobalt prices are also up sharply in recent months, although they are not yet at at the level experienced at its peak. This likely reflects lower demand expectations due to low cobalt chemistries gaining battery market share. Supply issues, such as disruptions in port operations in South Africa caused by the pandemic and civil unrest also contributed to the cobalt price increases.
IEA. All rights reserved. Sources: IEA analysis based on S&P Global
In March 2022 the price of nickel reached record levels and experienced highly volatile movement, causing the London Metal Exchange to temporarily close trade for the commodity. This was primarily driven by a short squeeze by market players, but recent
concerns about the supply of nickel from Russia due to its invasion of Ukraine has also fuelled price rises. Russia is the world’s largest producer of battery-grade (Class 1) nickel.
Price increases are usually followed by expansion in supply with new mines or life extension of existing ones. Drilling activity is an indicator of exploration in the mining sector. Since battery metal commodity prices have begun to rise, so have drill counts (from 2020 to 2021, +50% for nickel and a threefold increase for lithium). High prices may therefore be a long-term benefit for future battery metals supply, stimulating significant supply investment to compensate for the underinvestment during the years of low commodity prices.
Despite the recent commodity price surge, battery prices still declined in 2021 with BNEF’s annual battery price survey recording a salesweighted average price of USD 132/kWh, a 6% decrease from 2020. Although this represents a significant reduction from the 13% decrease from 2019 to 2020, there are several factors that partially insulated the average battery price from the commodity price rises last year. First, the rising prices incentivised chemistry substitutions. Many automakers switched to lower cost cathode chemistries with less commodity price exposure, such as LFP, which saw a significant
increase in adoption, over nickel-rich chemistries. Second, commodity prices were relatively low for the first half of 2021 which helped the average price decline. Third, the use of higher nickel chemistries such as NMC811 reduced the use of cobalt, the most expensive metal constituent in batteries per kilogramme (kg) (cobalt is around 5% of NMC811 cell price based on 2021 average price), also offsetting some costs, particularly in the first half of 2021.
However, a key reason is the impact of rising commodity prices has yet to fully materialise. Automakers increasingly use contracts in which material costs are linked with commodity prices for high volume battery orders, though, there is a time lag. Therefore, these automakers did not feel the result of the exceptional commodity price rises from the last three months of 2021 until the first-quarter of 2022.
If metal prices were to remain at levels experienced in the first three months of 2022 throughout the rest of the year, then we estimate that battery pack prices might increase by up to 15% from the 2021 weighted average price, all else being equal. The impact is likely to be mitigated by OEMs substituting other more cost-effective chemistries, but these price increases nonetheless will pose major challenges for automakers, increasing battery costs, decreasing manufacturer margins and raising costs for consumers.
Battery metals demand, 2017 - 2021
Notes: Class 1 nickel (>99.8%) is suitable for use in batteries and Class 2 nickel (<99.8%) is not applicable for use in batteries without significant further processing. Other batteries includes: batteries for stationary storage and consumer electronics.
Sources: IEA analysis based on EV Volumes and S&P Global
EV batteries are the main demand driver for lithium demand, but their importance is also rapidly rising for cobalt and nickel
The three most critical metals for Li-ion batteries are lithium, cobalt and nickel. All three metals are abundant in the earth’s crust, however, supply depends on mine production capacity. The exceptional rise in demand for batteries is now outstripping supply, with new mines not being built fast enough.
Lithium demand has almost doubled since 2017 to 80 kt in 2021, of which demand for EV batteries accounts for 47%, up from 36% in 2020 and only 20% in 2017. Lithium is also used in the production of ceramics, glass and lubricants. Batteries are now the dominant driver of demand for lithium and therefore set the price. The availability of lithium supply is of particular concern because it is irreplaceable for Li-ion batteries and there are no commercial alternative battery chemistries available at scale today that meet the performance of Liion batteries. Alternative lithium-free chemistries, however, are making progress, for instance, with Na-ion being commercially introduced by CATL in 2021.
Cobalt demand was 170 kt in 2021, of which the EV battery share was 24%, up from 18% in 2020. Cobalt is also used in superalloys, hard metals and catalysts. The cobalt intensity of Li-ion batteries has
decreased significantly over recent years as battery makers moved to higher nickel content chemistries to achieve higher energy densities and lower costs (cobalt is the most expensive constituent per kg of Li-ion battery metal). The additional concerns of human rights abuses and child labour related to cobalt mining in the Democratic Republic of Congo (DRC) have also motivated battery makers to move away from cobalt-intensive chemistries.
Nickel demand is dominated by stainless steel production. Total demand was 2 640 kt in 2021, of which the share of EV-related demand was 7%, up from 4% in 2020. Batteries require Class 1 nickel (>99.8% purity), while Class 2 nickel (<99.8% purity) cannot be used without further significant processing. Nickel-based cathodes are the dominant EV battery chemistries today and are expected to remain so in the future due to the demand for longer driving range EVs particularly in Europe and the United States. There is almost seven times more nickel than lithium by weight in an NMC811 battery, therefore, EV Li-ion battery prices are most sensitive to nickel prices. This is of significant current concern given the war in Ukraine because Russia is the world’s largest supplier of Class 1 battery-grade nickel, producing around 20% of global supply.
Share of total production of top-three companies at each stage of the EV battery supply chain, 2021
IEA. All rights reserved.
Notes: The figure shows production percentages of top-three companies for 2021: EV production by sales; battery production by MWh produced; cathode and anode by production capacity; mining by production capacity. Top-three companies by production (country where headquartered): lithium - Sociedad Química y Minera de Chile (Chile); Pilbara Minerals (Australia); Allkem (Australia); nickel - Jinchuan Group (China); BHP Group (Australia); Vale SA (Brazil); cathode - Sumitomo (Japan); Tianjin B&M Science and Technology (China); Shenzhen Dynanonic (China); anode - Ningbo Shanshan (China); BTR New Energy Materials (China); Shanghai Putailai New Energy Technology (China); battery production - CATL (China); LG Energy Solution (Korea); Panasonic (Japan); EV production - Tesla (United States); VW Group (Germany); and BYD (China).
Sources: IEA analysis based on Benchmark Mineral Intelligence; Bloomberg NEF; S&P Global.
EV battery supply chains consist of multiple complex stages that are spread around the world. From extracting the necessary mineral ores, refining to form sufficient purity chemicals, then advanced materials synthesis to form cathode and anode materials. Similar complex supply chains characterise other battery components such as electrolytes and separators. Cells are then fabricated and housed in modules within a battery pack which is integrated into the EV. To understand current trends and future prospects of EVs, it is critical to understand all of the stages in this complex supply chain.
The five key battery materials are lithium, nickel, cobalt, graphite and manganese. 27 Lithium is extracted from two very different sources: brine or hard rock. Lithium brines are concentrated salt water containing high lithium contents and are typically located in the high elevation areas of Bolivia, Argentina and Chile in South America with Chile being the largest producer. Brine deposits often contain large quantities of other useful elements such as sodium, potassium, magnesium and boron which offsets some of the cost of pumping and processing brine. Lithium hard rock (spodumene) is primarily mined in Australia. Novel processes are being developed to extract lithium from unconventional resources such as geothermal brine. Currently,
27 The battery metals focused on for this analysis are lithium, nickel and cobalt. For analysis of other critical minerals, see IEA’s The Role of Critical Minerals in Clean Energy Transitions report.
the top-five lithium suppliers account for about half of global lithium production. Major lithium suppliers include a mixture of large chemical and mining companies including: Sociedad Química y Minera de Chile SA (Chile); Pilbara Minerals (Australia); Allkem (Australia); Livent Corporation (United States); and Ganfeng Lithium Co. (China). Unlike for other battery metals, lithium extraction companies tend to be specialised in lithium mining and chemical companies.
Nickel is found primarily in two types of deposit – sulphide and laterite. Sulphide deposits are mainly located in Russia, Canada and Australia and tend to contain higher grade nickel. It is more easily processed into Class 1 battery-grade nickel. Laterite, however, tends to contain lower grade nickel and is mainly found in Indonesia, Philippines and New Caledonia. Laterite requires additional energy intensive processing to become battery-grade nickel. Nickel production is less concentrated than lithium with about nine companies supplying half of global nickel production. Key nickel suppliers include: Jinchuan Group (China); BHP Group (Australia); Vale SA (Brazil); Tsingshan (China); Nickel Asia Corporation (Philippines); and Glencore (Switzerland).
Cobalt is predominantly mined as a by-product of copper or nickel mining. Over 70% of cobalt is produced in the Democratic Republic of Congo (DRC) and Glencore (Switzerland) is the largest global producer. Other key cobalt suppliers include: Jinchuan Group (China); CN Molybdenum (China); and Chemaf (DRC). Artisanal and small-scale mining is responsible for 10 – 20% of cobalt production in the DRC.
Graphite is the dominant anode material and can be found naturally or produced synthetically. Natural graphite mining is dominated by China (80%), though global production is becoming more diversified, with many greenfield graphite mining projects being developed including in Tanzania, Mozambique, Canada and Madagascar.
Manganese resources are more widely distributed around the world than the other battery metals and remain available at relatively low cost. There is a general expectation that there will not be an ore shortage in the near term. The leading producers of manganese ore include South Africa, Australia, Gabon and China.
Batteries require high purity materials and therefore high-grade sources, as well as significant refining, is required to reach sufficient quality battery chemical precursors. These refining processes typically involve heavy industrial processes based on heat or chemical treatment (typically pyrometallurgy and/or hydrometallurgy) to refine the raw ore into the usual required chemicals, lithium
carbonate or hydroxide, or cobalt and nickel sulphate. Adding complexity, certain raw materials are more or only suitable for the production of battery precursors. For instance, lithium carbonate is produced from lithium brine, which is useful for wider lithium demand, however, unsuitable for use in leading high-nickel Li-ion batteries.
Lithium hydroxide is more suitable for high-nickel chemistries and is more easily produced from spodumene hard rock sources. Similarly, battery production typically requires nickel sulphate, typically only synthesised from Class 1 nickel, which is most economically produced from nickel sulphides. Class 2 nickel can be processed into Class 1 nickel but requires significant additional processing.
New processing technologies, however, are increasing the flexibility of nickel processing routes. These include:
• High-pressure acid leaching (HPAL) is a process which is able to produce Class 1 nickel from lower grade laterite resources.
• Mixed hydroxide precipitate (MHP), an intermediate product in nickel refining, can be further be refined into nickel sulphates at low cost from laterite resources.
• Nickel matte (a battery-grade nickel precursor) can be produced from laterite resources, but is more emissionsintensive than conventional production routes.
Raw material processing is highly concentrated. For example, in lithium carbonate and hydroxide production, five major companies
are responsible for three-quarters of global production capacity. Often the refining is done by the mining company together with the extraction. For example, Ganfeng, a Chinese mining company, has evolved to include processing and refining lithium and is increasingly focussed on boosting their lithium hydroxide production. In other cases, it is exported to third parties to do the refining, with many processing companies in China, such as Chengxin Lithium Group or Zhejiang Huayou Cobalt. This is particularly the case for Australian spodumene as almost no miners yet produce integrated lithium chemical supply.
While manganese resources are widely distributed, production of high-purity manganese sulphate raises concerns around geographical concentration of supply. China currently accounts for around 90% of the global production capacity, raising the need for new, diversified manganese refining capacity. New manganese sulphate projects are starting to come online in Australia, Europe, Indonesia and United States.
Batteries are comprised of several highly specialised components including cathode and anode materials, electrolytes and separators. These components require advanced materials chemistry and engineering for their production. The most complex processing is required to form the battery active materials from the high purity chemicals produced from raw material processing, such as lithium
hydroxide and nickel sulphate. These materials are further processed using specialised syntheses to produce active materials for the cathode and anode. The leading cathode active materials for Li-ion are transition metal oxides including lithium cobalt oxide, lithium nickel manganese cobalt oxide (NMC), lithium nickel cobalt aluminium oxide (NCA) and lithium iron phosphate (LFP). Seven companies are responsible for 55% of global cathode material production capacity. Key players include: Sumitomo (Japan); Tianjin B&M Science and Technology (China); Shenzhen Dynanonic (China); and Ningbo Shanshan (China).
The dominant anode active material is graphite which can be natural or synthetic. Producing graphite anode materials is more mature and established than cathode material production given graphite has been the dominant anode for a long time, though both graphite types require sophisticated processing. Flake natural graphite is used in batteries and is processed into spherical graphite to be more homogenous for use as anode material. Synthetic graphite is produced from refining hydrocarbon materials such as coke. To improve graphite anode performance, small and increasing fractions of silicon are being added to the graphite anode to increase energy density. Anode material production is even more highly concentrated with four companies responsible for half of global production capacity. The largest players include: Ningbo Shanshan (China); BTR New Energy Materials (China); and Shanghai Putailai New Energy Technology (China). The top-six companies are all Chinese and account for two-thirds of global production capacity.
Separators are engineered microporous membranes, typically made of polyethylene or polypropylene and often ceramic coated for improved safety for EVs. Separator production is also concentrated with five companies responsible for half of the global production capacity. Key players include: Zhuhai Enjie New Material Technology (China); Shanghai Putailai New Energy Technology (China); and SK IE Technology (Korea). Electrolytes are made of a salt and solvent and both require synthesis and then mixing. Jiangxi Tinci Central Advanced Materials in China alone produces 35% of global electrolyte salt. The top electrolyte producing companies include:
Zhangjiagang Guotai-Huarong New Chemical Materials (China); Shenzhen Capchem Technology (China); and Ningbo Shanshan (China). Most companies that engage in cell component manufacturing are highly specialised and only produce those components.
Producing the battery cells is a multi-step process with two broad stages: electrode manufacturing and cell fabrication. Though cell manufacturers have different cells designs, the cell manufacturing processes are similar, use mature technologies and are well established. These processes are energy intensive, being conducted in highly controlled clean and dry room conditions to avoid any impurities and moisture. Using low-carbon sources of electricity is key to reducing emissions in cell production. First electrodes are produced by mixing cathode or anode active materials with a binder,
solvent and additives before coating on aluminium (cathode) or copper (anode) foil current collectors. The electrodes are rolled (calendared) and subsequently dried. The cell is then created by stacking the electrodes with a separator in between.
Manufacture of the battery pack may be completed either by the cell manufacturer or by the automaker. Cells are first housed together in module frames, then the battery pack is assembled through integration of modules, the battery management system, electronics and sensors, all encased in a final housing structure.
Battery cell production is a capital-intensive process and production is highly concentrated, with the top-three producers in 2021, CATL (China), LG Energy Solution (Korea), and Panasonic (Japan), accounting for 65% of global production. Cell manufacturers from Japan and Korea tend to be established conglomerates having decades of experience making batteries for consumer electronics. There are also Chinese companies that began producing batteries for consumer electronics in the 1990s and then specialised in batteries for EVs such as CATL and BYD. A third wave of new battery makers is taking shape in Europe and North America, but today they are mostly in planning or upscaling stages. With recent supply chain strains many battery and automakers are becoming increasingly involved in the mining and processing of critical minerals to ensure access to production; Tesla, CATL and LG Energy Solution have all become directly involved in upstream stages.
The battery pack is integrated into the EV by the automakers, where it is connected with the electric motor, on-board charge module, high voltage distribution box, electric transmission and thermal systems, depending on the vehicle architecture. Automakers focussing only on EVs must develop greenfield factories, while for incumbent automakers pre-existing vehicle assembly factories can be retooled and repurposed for EV production. EV manufacturing is currently concentrated in a small number of OEMs, with the top-six companies responsible for 52% of production in 2021. This is a slight decrease from 2020 where the top-six were responsible for 55%. The three largest producers, Tesla (United States), VW Group (Germany) and BYD (China), accounted for a third of EV production in 2021. The rapid growth of BYD has been particularly impressive, it was not even among the top-six producers in 2020, but ranked as the third-largest producer of EVs in 2021.
Re-use or repurposing involves refurbishing EV batteries for less demanding second-life applications, typically in stationary storage. Spent EV batteries typically still have around 80% of their usable capacity, therefore, repurposing generates additional value from these batteries. Re-use requires disassembly of the pack, testing of the module/cells, and repackaging into new packs for new applications. The primary drivers of cost of refurbishing batteries are the logistics involved in their collection, testing of remaining useful
life, and the physical disassembly and repacking of cells/packs. Reuse, however, faces economic and regulatory challenges including ensuring reliable grading of cells/packs, liability and ensuring the cost of repurposing is competitive with new batteries.
There are three primary methods for Li-ion battery recycling: pyrometallurgy, hydrometallurgy and direct recycling. Pyrometallurgy involves smelting the battery in a high temperature oven, recovering only a fraction of metals from the cathode. Hydrometallurgy involves a chemical leaching process to precipitate out individual metals. Currently, most battery recycling uses a combination of pyrometallurgy and hydrometallurgy as they are well suited to a poorly sorted feedstock of cells. These methods rely on reclaiming the expensive metals specifically nickel and cobalt, and often the copper and aluminium. Current global capacity for battery recycling is around 200 kt/year with China accounting for about half. This dominant position is expected to be retained due to announced additional capacity. Most battery recycling companies are independent recyclers, but OEMs, battery manufacturers, miners and processors are starting to enter the market.
Direct recycling is an emerging process, offering improved recycling efficiency, as it does not break down the cathode into elements, but instead retains the material crystal structure and regenerates the cathode material. This retains the embedded energy and economic
value in cathode processing, avoiding the need to resynthesise from raw materials. It is well suited to cathodes containing little valuable metals such as LFP. However, it is limited by its inflexibility as it must be tailored to each cathode chemistry, and recovered cathodes can only be input into production of the same battery type. Though, new processing methods are under development to convert recycled chemistries into current chemistries e.g., NMC333 to NMC811.
Policy mandates, for instance, extended producer responsibility for battery recycling, are spurring the formation of joint ventures among OEMs, re-use and recycling companies. For instance, SK Innovation and Kia are developing both re-use and recycling initiatives; Kia evaluates used batteries and repackages ones suitable for re-use in stationary storage and the rest are sent to SK Innovation’s recycling process for material recovery. Renault, Veolia and Solvay have formed a consortium for the same purpose. BMW, Umicore and Northvolt have also formed a consortium to create a closed-loop for battery cells, involving both re-use and recycling.
Geographical distribution of the global EV battery supply chain
Cell components
IEA. All rights reserved.
Notes: Li = lithium; Ni = nickel; Co = cobalt; Gr = graphite; DRC = Democratic Republic of Congo. Geographical breakdown refers to the country where the production occurs. Mining is based on production data. Material processing is based on refining production capacity data. Cell component production is based on cathode and anode material production capacity data. Battery cell production is based on battery cell production capacity data. EV production is based on EV production data. Although Indonesia produces around 40% of total nickel, little of this is currently used in the EV battery supply chain. The largest Class 1 battery-grade nickel producers are Russia, Canada and Australia.
Sources: IEA analysis based on: EV Volumes; US Geological Survey (2022); Benchmark Mineral Intelligence; Bloomberg NEF
Current mining production versus reserves for battery materials
IEA. All rights reserved.
Notes: Li = lithium; Ni = nickel; Co = cobalt; Gr = graphite; DRC = Democratic Republic of Congo. Reserves refer to economically extractable resource as defined and determined by the US Geological Survey.
Sources: IEA analysis based on US Geological Survey (2022)
China dominates production at every stage of the EV battery supply chain downstream of mining.Three-quarters of battery cell production capacity is in China, with the same for the specialised cathode and anode material production, for which China accounts for 70% of cathode and 85% of anode material global production capacity. Over half of global raw material processing for lithium, cobalt and graphite also occurs in China. With 80% of global graphite mining, China dominates the entire graphite anode supply chain end-to-end. Europe is responsible for over a quarter of EV production, but holds very little of the rest of the supply chain apart from cobalt processing at 20%, mostly plants in Finland. The United States has a smaller role in the global EV battery supply chain, with only 10% of EV production and 7% of battery production capacity. Both Korea and Japan have considerable shares of the supply chain downstream of raw material processing, particularly in cathode and anode material production. Korea is responsible for 15% of cathode, and 3% of anode material production capacity while Japan accounts for 14% and 11%, respectively
In terms of raw material supply and extraction, battery metals are highly concentrated geographically and thus are relatively more vulnerable to supply shocks and constraints. More than half of the world’s lithium is produced in Australia while 70% of the world’s cobalt
is produced in the DRC. Nickel supply is slightly more diverse; Indonesia has the largest share of production with almost 40% of total nickel supply, yet today little of it is used in the EV battery supply chain as it mostly produces Class 2 nickel. Not only is Russia the world’s third-largest producer of nickel, more significantly, it is the world’s largest producer of Class 1 battery-grade nickel with around 20% of the global supply.
The geographical distribution of mineral extraction is unlikely to shift significantly in the near term given today’s project pipeline. However, when comparing current mining production to mineral reserves (reserves refer to the resources which could be economically extracted at the time of determination), there appears to be significant unrealised potential for diversification of extraction in the longer term. In particular, Australia, already the largest lithium producer, holds the joint largest reserves of nickel, alongside Indonesia, with 22% of global reserves. However, Australia is producing only 6% of current global production. Australia also has the second-largest reserves of cobalt with almost 20%, while accounting for a mere 3% of current production.
There is also significant potential to diversify natural graphite production with Europe holding the world’s largest share with over a quarter of global reserves, primarily in Turkey. Brazil has significant
potential for graphite and nickel, with 22% and 17% of global reserves, respectively. Nevertheless, there are several caveats which must be considered with reserves such as resource quality, particularly important for battery metals, investment and aboveground constraints which may limit potential as a reliable source of future supply.
There is a need for updated and improved geological surveys in emerging market and developing economies. Resource surveys in many low income countries were conducted long ago when battery metals were not in focus. An example is the East African Nickel Belt where the US Geological Survey indicates limited Africa nickel reserve numbers. However, in 2021, BHP struck a deal to invest USD 100 million in the Kabanga Nickel project in Tanzania, reporting it as one of the world’s largest nickel sulphide deposits. Similarly, Bolivia has abundant identified lithium resources, yet no reported reserves. This highlights the potential that updated geological surveys can bring in today’s market context.
On the other hand, the downstream supply chain distribution is set to change this decade, particularly for batteries. If current policies, announcements and investments are realised, by the end of this
decade a quarter of battery production capacity will be located in Europe and the United States. Similarly, there have been recent announcements related to cathode materials production in Europe and the United States. For example, Volkswagen announced a new partnership with Umicore that aims to build cathode material production capacity in Europe. Redwood Materials and L&F aim to build a US factory producing cathode material for 5 million EVs per year by 2030, with similar plans for Europe. Northvolt, the European cell manufacturer, intends to produce over 100 GWh per year of its own cathode material.
Anode material production is likely to continue to be dominated by China as it holds the entire supply chain from mining through to anode material production. In addition, almost all of the top-ten anode material production companies are Chinese, which makes new anode production overseas largely dependent on foreign investment by these companies. Moreover, graphite anode material prices are not high enough to significantly incentivise new production capacity. Although there are exceptions, such as Nouveau Monde Graphite which is constructing both a graphite mine and graphite anode active material plant in Canada.
Lithium, cobalt and graphite supply chains are less affected by the supply disruption caused by Russia’s invasion of Ukraine as relatively little supply and processing is from either country. However, there is concern regarding nickel; Russia is the thirdlargest producer, supplying about 9% and processing about 6% of global nickel in 2021. Though, more critically, Russia is the world’s largest Class 1 nickel supplier, producing about 20% of the world’s Class 1 battery-grade nickel, most of which is supplied by Norilsk Nickel.
Recent concerns for the supply of nickel from Russia, coupled with financial speculation by the founder of Tsingshan, a major Chinese steel producer, pushed nickel prices to an unprecedented level of USD 100 000 per tonne (the average price in 2021 was USD 18 500 per tonne), resulting in the London Metal Exchange temporarily closing nickel trade. Much of the exceptional price rise was due to a short squeeze, however, there was an underlying increase in price driven by Russian supply concerns in an already tight supply market. Trading resumed and the nickel price stabilised at around USD 33 000 per tonne, still exceptionally high. Nevertheless, significant concerns for nickel supply from Russia remain, which will likely keep prices high.
Nickel supply from Russia is a key source for the developing EV battery supply chain in Europe. BASF (Germany) is building a major cathode material precursor plant in Finland and already has a long-term nickel supply agreement with Norilsk Nickel. It is possible that Australia and Canada could fill the gap of supply from Russia for nickel sulphate in Europe, as well as Indonesia once HPAL projects are operational, though Europe will also be competing with North American demand.
All rights reserved.
Many countries have announced industrial strategies that aim to create and expand their prominence and within integrated supply chains. Major automotive manufacturing countries aim to extend their reach up the supply chain from making EV components and automobiles, to also securing stable upstream supply and refining capacity of minerals and metals
Some countries have identified battery and EV manufacturing to be strategic sectors and look to support domestic production. Some explicitly target investment in the sector to “future proof” economies, build a workforce to underpin a low-carbon future and secure a position to be a market leader in the high value-added steps in the burgeoning EV market.
China’s rise to the largest share of global EV battery production capacity in the world (77%) is a direct result of over a decade of government policies that support the industry. Korea, which accounts for 5% of global production capacity, along with Japan, at 4%, have recently launched large funding packages to bolster the competitiveness of their battery and EV industries.
While the European Union has been investing significantly over the last few years in R&D and manufacturing capacity, it will likely take time to develop the supply chains needed for an EU battery production industry. Similarly, the United States recently renewed its
focus on building domestic battery and EV supply chains, particularly leveraging its critical minerals supply and automotive sectors.
Other new entrants such as Indonesia and Thailand are putting a strategic focus on battery and EV production. They aim to become regional market leaders by leveraging their geographic proximity to Asian market leaders as well as upstream mineral and metal supplies. Indonesia and Thailand are attracting investments from major battery and EV manufacturers such as Great Wall Motors, Foxconn, LG Group and CATL
• Share of global EV battery production capacity: 0%.
• EV battery production capacity in 2021: 0 GWh.
In April 2022, the federal government and provincial government of Ontario announced a CAD 518 million (USD 398 million) package to supplement General Motor of Canada’s existing CAD 2.3 billion (USD 1.8 billion) investment in upgrading facilities in Ontario, which includes retooling facilities to produce EVs. In addition, Ontario received its largest automotive industry investment in history of CAD 5 billion (USD 4 billion) with a joint venture between LG Energy
Solution Ltd. and Stellantis N.V. to produce EV batteries with a production capacity of 45 GWh. The governments worked closely to foster this investment, such as providing favourable electricity prices and provincial and federal subsidies (which are being negotiated).
• Share of global EV battery production capacity: 76%.
• EV battery production capacity in 2021: 655 GWh.
China's leading role in EV battery production capacity is a direct result of more than a decade of policies that prioritise the development of an integrated domestic supply chain. China has long viewed batteries as a strategic industrial sector.
Released in mid-2021, China’s 14th Five-Year Plan (2021-2025) focusses on “strategic emerging industries”, which includes new energy vehicles (NEVs). It provides guidance for state and local governments to develop plans, including a focus on higher quality and standards for NEV manufacturing, as well as focussed R&D efforts for next-generation battery chemistries. Of particular note, are plans to promote the development of the Na-ion battery industry during the 2021-25 period, using industry and product standards to achieve scale, lower cost and improved battery performance. Regional five-year plans (e.g. Beijing, Shanghai, Guangdong, Tianjin, Jiangsu, Fujian and Shaanxi) focus on integrating NEV production
with related industies (i.e., battery manufacturing and recycling systems) in collaboration with large industrial EV car, component and battery manufacturers. They aim to bolster NEV production in industrial development zones through incentives such as tax exemptions, preferable loans and co-financing, and to develop industrial production bases.
Also released in mid-2021, China’s 14th Five-Year Plan for Circular Economy Development (2021-2025) aims to standardise management of resources from the battery recycling industry, as well as to introduce both NEV battery traceability and battery recycling traceability management systems. Administrative measures for the re-use of NEV batteries released in August 2021 aim to standardise and further develop the industry by requiring battery re-use enterprises to be responsible for managing the whole life cycle of reused product design and production, packaging, transportation and recycling of the batteries, ensure product quality, product certification and environmentally responsible disposal.
The Ministry of Industry and Information Technology in November 2021 released two draft guidelines for comment on the development of the Li-ion battery industry in order to strengthen management of the sector. The guidelines propose plant expansions to only occur if production can be assured to exceed 50% of capacity, technical standards on minimum energy density (no less than 180 Watthours per kilogramme), cycle life and the encouragement of the use of solar power in the manufacturing process. In January 2022,
technical specifications for pollution control and treatment for waste Li-ion batteries was implemented (for a trial period).
• Share of global EV battery production capacity: 7%.
• EV battery production capacity in 2021: 60 GWh.
The European Union has a strategic focus on the development of domestic battery supply chains.
In March 2022, the European Battery Alliance and the US Li-Bridge Alliance announced a collaboration to accelerate the development of Li-ion and next-generation batteries, including critical raw materials.
The Important Projects of Common European Interest (IPCEI) is a key strategic instrument with regard to the implementation of the European Union Industrial Strategy. A two-part IPCEI has been implemented to promote battery production: the IPCEI on Batteries and the IPCEI European Battery Innovation (EuBatIn). Both have in common that their participants represent the complete value chain, from material through the cells to the battery system and recycling. There is also a high degree of networking between the companies and the two IPCEIs. The Batteries IPCEI, established in 2019, brings together companies headquartered in seven EU member states from various parts of the battery value chain. The EuBatIn, established in
2021, brings together 12 EU member states and 40 companies to focus on battery supply chains and has secured funding for EUR 2.9 billion (USD 3.4 billion) for the period to 2031.
The European Commission proposed revisions to the EU Battery Directive to elevate it to a regulation as part of actions taken for the Green New Deal in late 2020. They introduce mandatory carbon footprint declarations for batteries sold in Europe, along with minimum requirements for recycled content and requirements for collection and recycling of automotive EV batteries. As of March 2022, the latest update indicates the European Parliament has reached a consensus on the proposed revisions with a few amendments. Of note, this includes the addition of a new battery category, “light means of transport” (e.g. electric bicycles) and minimum targets for recovered cobalt, lead, lithium or nickel from waste. The proposals are to be discussed with the member states in the Council of the European Union.
The Batt4EU Partnership was launched in June 2021 to combine efforts of the European Commission and members of the Batteries European Partnership Association, which includes industry and R&D stakeholders within the battery supply chain. The partnership will fund battery R&D and innovation projects within the framework of the Horizon Europe Programme. A MoU was signed between the two parties stating that the European Commission will direct up to EUR 925 million (USD 1 billion) in funding between 2021 and 2027 for battery research and innovation.
In February 2022, the European Commission granted EIT InnoEnergy EUR 10 million (USD 11.8 million) towards the European Battery Alliance Academy to help bridge a growing skills gap for the work force across the European battery value chain.
In France, a EUR 30 billion (USD 35 billion) overall investment plan was presented in 2021. It provides for up to EUR 4 billion (USD 4.7 billion) to support the automotive industry to produce 2 million EVs by 2030. In Germany, EUR 1 billion (USD 1.2 billion) in funding through 2022 was allocated by the Federal Ministry for Economic Affairs and Climate Action to establish the country as a global leader in battery cell production.
• Share of global EV battery production capacity: 0%.
• EV battery production capacity in 2021: 0 GWh.
India’s Production Linked Incentives scheme has a strategic focus on advanced automotive technology and components (including EV) and advanced chemistry cell battery (ACC) sectors. The automotive and auto components sector was allocated close to INR 259 billion (USD 3.5 billion). With an aim to build capacity of 50 GWh, the ACC sector was allocated INR 181 billion (USD 243 million). Subsidies are to be provided over a span of five years based on performance
metrics such as energy density (ACC only), battery cycle life (ACC only) and number of units sold or components manufactured in India.
A request for proposals was launched in January 2022 for both schemes, with the government to award contracts by March 2022. For the ACC scheme, bids totalled 130 GWh, close to three times the amount of the manufacturing capacity to be awarded . A total of 95 applicants were approved. Final recipients include both large auto manufacturers and OEMs as well as small and medium enterprises in the industry. For the advanced automotive technology and auto components scheme applications totalled a proposed INR 450 billion (USD 6.1 billion) for all vehicle categories, and were submitted by both incumbant automotive OEMs and new market entrants.
• Share of global EV battery production capacity: 4%.
• EV battery production capacity in 2021: 36 GWh.
Japan released a Strategic Energy Plan in 2021 which reemphasised targets under the 2020 Green Growth Strategy for increasing domestic production for vehicle batteries to 100 GWh by 2030.
The Battery Association for Supply Chains, formed in April 2021, includes key Japanese OEMs. Its founding document urged the
government to provide financial subsidies for battery production facilities. After consultations, the Japan’s government announced a package of JPY 100 billion (USD 910 million) for the fiscal year 2021 supplementary budget for domestic battery production.
• Share of global EV battery production capacity: 5%.
• EV battery production capacity in 2021: 41 GWh.
The mid-2021 announcement of the K-battery blueprint renews government focus on expanding tax incentives and R&D spending. The stated ambition is for Korea to be the number one EV battery manufacturing country in the world by 2030.
The formation of a “grand-alliance” between the top-three Korean (and global) domestic battery manufacturers (LG Energy Solution, Samsung SDI and SK Innovation) aims to build an industrial network. A fund of KRW 80 billion (USD 69 million) will be established, with contributions from the government, companies and financial institutions, to support battery technology, parts and materials development in collaboration with other companies and academia. An additional KRW 1.5 trillion (USD 1.3 billion) will be made available to support battery development in Korea through tax incentives, R&D and capital investments.
• Share of global EV battery production capacity: 7%.
• EV battery production capacity in 2021: 57 GWh.
An executive order in early 2021 mandated a thorough assessment of US supply chains. This includes the identification of risks in highcapacity battery supply chains.
With this focus on battery supply chains came a host of strategic policy announcements and blueprints. One included the release of the National Blueprint for Lithium Batteries (2021-2030), which elaborates a vision to establish secure battery materials and technology supply chains within the country. It aims to set guidance for policy makers, industry and investors for the long term by creating goals across the entire supply chain. These include: securing upstream raw and critical minerals and materials processing base; creating domestic electrode, cell and pack manufacturing sectors; end-of-life critical material recycling; and R&D efforts on battery technology development.
In October 2021, the US Department of Energy Argonne National Laboratory announced the creation of Li-Bridge. It is a new publicprivate partnership to bridge gaps in the domestic lithium battery supply chain. It marks the first collaboarion of its kind in the US battery industry.
In June 2021, USD 60 million was awarded for 24 projects to reduce CO2 emissions from passenger cars and light/heavy trucks. This includes projects to accelerate innovation for EV batteries, electric drive systems and new mobility system technologies (automated, connected, electric and shared vehicles). The government approved close to USD 3 billion to boost production of advanced battery supply chains in February 2022 under the Infrastructure Investment and Jobs Act (Bipartisan Infrastructure Law). This includes funding for upstream battery materials and refining as well as for production plants, battery cell and pack manufacturing facilities and recycling facilities.
• Share of global EV battery production capacity: 1.0%.
• EV battery production capacity in 2021: 8.7 GWh.
Thailand, which has one of the largest automotive production centres in Southeast Asia, released guidelines to promote EVs and states its ambition to have 30% of all cars produced domestically to be EVs in 2030. Recent statements by government officials signal an intent to strive for 100% ZEV sales by 2035.
Thailand’s Eastern Economic Corridor (EEC) is providing incentives for strategic manufacturing companies (including EVs) such as corporate tax breaks, infrastructure development and low interest
loans. This spurred deals for EV and battery production facilities, such as with Chinese automaker Great Wall Motors in June 2021 and a USD 1 billion 8 GWh battery production plant both in the Rayong EEC. PTT, the state-owned oil and gas group, signed a joint venture deal with Foxconn to make EVs starting in 2024 with a capacity of 50 000 electric cars per year and targeted to expand to 150 000 by 2030.
Indonesia has a production target of 600 000 electric LDVs and 2.45 million electric two-wheelers by 2030. It aims to leverage its large raw nickel ore reserves upstream while offering incentives further downstream for EV component producers and manufacturers. This follows on from the Presidential Regulation to prioritise domestic EV production. It aims to ensure a certain percentage of Indonesian sourced EV components and nickel are used in EV production.
The Indonesia Battery Corporation, a state-owned battery manufacturer, was formed in March 2021 by the Ministry of StateOwned Enterprises and four other state-owned entities. The investment needed for this holding is Indonesian rupiah (IDR) 238 trillion (USD 17 billion). The corporation’s production target is up to 140 GWh of battery cells by 2030, of which 50 GWh will be for export. For context, current global battery production capacity is about 871 GWh.
A memorandum of understanding (MoU) was signed in July 2021 for an EV battery factory between the Ministry of Investment and Hyundai Motor Company with a capacity of 10 GWh, with a price tag
of USD 1.1 billion. The factory, to be built with Korean LG Group, aims to incorporate battery precursor production with pack production, as well as mining, smelting and recycling facilities. This deal is a part of a larger MoU signed by Indonesia’s government and a consortium led by the LG Group for USD 9.8 billion to develop integrated EV supply chains. The consortium signed a non-binding agreement with PT Aneka Tambang Tbk, the state-owned mining company, and Indonesia Battery Corporation.
Gogoro (known for battery swapping) to facilitate battery manufacturing, and the development of EV supportive industries such as energy storage systems and battery recycling. This include Foxconn’s production of solid-state and lithium iron phosphate batteries.
Other potential deals include a USD 5 billion lithium battery plant with projected production in 2024 between China’s Contemporary
Amperex Technology (CATL) and Indonesia’s PT Aneka Tambang. In early 2022, Foxconn signed a MoU with the Indonesia’s Ministry of Investment and Chinese Taipei’s electric scooter manufacturer
In addition to policies, financial incentives and market penetration targets, technical regulations have an essential role to ensure the safe and sustainable deployment of EVs. The World Forum for Harmonization of Vehicle Regulations (WP.29), hosted by the United Nations Economic Commission for Europe, develops legally binding regulations covering technical requirements to improve vehicle safety and lower environmental impacts.
UN Regulation No. 100 / UN GTR No. 20 on Electric Vehicle Safety prescribes testing procedures to ensure EVs are safe for use. It details methodologies to test EVs and protect users from electrical shocks, ensure fire, water, vibration and mechanical resistance of key EV components, among other safety tests.
UN GTR No.22 on In-Vehicle Battery Durability was adopted in March 2022 and prescribes minimum performance requirements for the durability of batteries in electrified vehicles. It requires manufacturers to certify that the batteries fitted in their EVs will lose less than 20% of initial capacity over five years or 100 000 km and less than 30% over eight years or 160 000 kms.
The durability standard aims to prevent the use of low quality batteries and to ensure that only durable batteries are installed in EVs. This is crucial to increase consumer trust and to improve the environmental performance of EVs beyond their low emissions output. Making sure each battery lasts longer would help to ease the pressure on demand for critical raw materials needed for their production and reduce waste from used batteries. Similar provisions are now being developed for heavy-duty electric vehicles (e-buses and e-trucks).
The battery durability standard was adopted by many countries/regions that committed to transpose it into their national legislation. They are Australia, Canada, China, European Union, India, Japan, Korea, Malaysia, Norway, Russian Federation, South Africa, Tunisia, United Kingdom and United States. In the European Union, the provisions are expected to be part of the forthcoming Euro 7/VII legislation.
Major battery mineral and metal producers around the world have begun to prioritise not only mining but refining capacity to be able to securely supply materials for EV battery supply chains around the world.
Australia is the largest producer of lithium in the world and one of the top producers of nickel globally. In September 2021, the government released an AUD 1.3 billion (USD 980 million) loan facility for Australian critical minerals targeted for advanced sectors including EV battery production. In addition, a AUD 2 billion (USD 1.5 billion) fund was announced to increase critical mineral processing capacity, including for battery minerals and metals.
In December 2021, the federal government awarded “Major Project Status” to a AUD 2.4 billion (USD 1.8 billion) battery minerals complex in New South Wales for a nickel and cobalt mine, materials processing and recycling facility. Having major project status allows access to additional financial support, co-ordination and streamlined regulatory approvals. The facility is planned to be powered almost entirely by renewables, making it one of the world’s largest battery metal producers operating on renewable energy.
To implement its Critical Minerals Strategy, the government allocated CAD 3.8 billion (USD 2.9 billion) over eight years in the 2022 budget – the first budget announcement of its kind. Of this, around CAD 1.5 billion (USD 1.2 billion) is for infrastructure investment to support critical mineral supply chains, CAD 79.2 million (USD 60.9 million) is for integrated data sets for critical mineral exploration and development, and a new 30% tax credit for critical mineral exploration.
Chile remains one of the largest producers of lithium in the world, though there has been slow growth in developing new projects. To counter this trend, in October 2021 the government launched a special auction for operating contracts to explore and produce 400 000 tonnes of lithium. Divided into five tranches of 80 000 tonnes each, it provides successful bidders a period of seven years to conduct geological exploration, studies and 20 years for production. The government will take a royalty payment, plus a variable payment during production.
China continues to dominate in the mid- to downstream EV battery supply chain, though it currently owns less than 25% of upstream mining capacity.
The 14th Five-Year Plan for the Development of the Raw Materials Industry (2021-2025) was released in December 2021. It aims to focus technological innovation in key materials for development, including promoting the R&D of new, more efficient and environmentally-sensitive mining technologies and minerals, including salt lake lithium. The plan also aims to develop “urban mines” to support large-scale recovery of lithium, nickel, cobalt and tungsten at recycling bases and industrial clusters.
Formed in 2020, the European Raw Materials Alliance (ERMA) was created as a part of the EU’s Action Plan on Critical Raw Materials. Along with working on regulatory bottlenecks and stakeholder engagement, its focus is to act as a pipeline to catalyse investment for projects. ERMA has announced plans to launch a raw materials investment fund planned for 2022
In November 2021, the European Parliament voted in the Critical Raw Materials Strategy with a focus on “open strategic autonomy”, i.e. access to alternatives and competition when sourcing critical raw materials. Other aspects include sourcing critical raw materials from within the European Union member states, increased recycling and
circular use of resources, and investment in refining and separation capacities (including lithium). The European Parliament has asked the European Commission and member states to create an IPCEI on critical raw materials to focus on reducing criticality and dependence.
Indonesia is the largest nickel producer in the world. It aims to maintain that position as a key supplier for the EV battery manufacturing sector.
In 2020, Indonesia imposed a nickel ore export ban. This was followed in 2021 with consideration of imposition of a tax on the export of nickel products that contain less than 70% nickel content in an attempt to further develop domestic refining capacity. Today, most nickel products contain between 30-40% nickel and are generally exported to be further refined to have higher purity nickel products (70% or above) and could thus significantly impact exports.
In March 2022, the United States invoked the Defence Production Act to rapidly boost US production of critical minerals for EV and storage batteries, focussing on lithium, nickel, cobalt, graphite and manganese.
Over the past year, the United States has made significant efforts to enhance EV battery supply chains, including critical minerals. In February 2021, the US Department of Energy awarded
USD 44 million to the Mining Innovations for Negative Emissions Resource Recovery Program for technological development to increase domestic critical element supplies. The fund focusses on commercial-ready technologies that are either net zero or net negative emissions for critical minerals needed for the clean energy transition.
In April 2021, 13 critical mineral projects were selected to receive a total of USD 19 million. The fund focuses on projects that would help transition fossil fuel producing communities towards clean energy jobs, including increased recycling from critical mineral resources and waste streams, critical mineral and metal extraction from fossil fuel products and their waste streams for use in various applications including EV batteries.
In February 2022, the US departments of Energy, Defense and State signed a Memorandum of Agreement to support stockpiling of critical minerals that would facilitate the transition to clean energy, in particular for batteries and wind turbines, and to meet national security needs.
EV battery demand by mode, 2021-2030
EV battery demand by region, 2021-2030
LDV Two/three-wheeler Bus Trucks
Notes: STEPS = Stated Policies Scenario; APS = Announced Pledges Scenario; LDV = light-duty vehicle.
IEA. All rights reserved.
Increased EV sales necessitate a scale up of all elements of the battery supply chain. While for most components, EVs are not too different from conventional vehicles, batteries rely on distinct and critical materials dependent supply chains which must dramatically scale up this decade to meet projected demand. Most supply chain components can be scaled up rapidly; battery production factories can be built in under two years and the project pipeline is very large. On the other hand, raw material extraction requires investment long before production reaches scale.
In the Stated Policies Scenario, battery demand from EVs increases in 2030 to 2.2 TWh and to 3.5 TWh in the Announced Pledges Scenario. This is a more than sixfold increase from the production level in 2021 for the Stated Policies Scenario and a ten-fold increase for the Announced Pledges Scenario. Achieving such production levels requires the manufacture of an additional 52 gigafactories of 35 GWh annual production capacity in the Stated Policies Scenario and 90 gigafactories in the Announced Pledges Scenario.
Battery demand is driven by electric cars which account for 85% of the projected total by 2030 in both scenarios. Not only will electric car sales increase, but current trends and new model announcements suggest that vehicles will have increasingly higher battery capacity
due to demand for longer driving ranges and larger vehicles. This trend contributes to around a third of the rise in battery demand and is especially pronounced in North America.
China is projected to have the largest battery demand, though its global share shrinks from 60% in 2021 to 40% in 2030 in the Stated Policies Scenario and 25% in the Announced Pledges Scenario. The United States undergoes the fastest battery demand increase among major markets driven by rapid EV deployment as well as the largest battery capacity per vehicle, increasing share slightly in the Stated Policies Scenario with around 15% in 2030 from 11% in 2021 and increasing to above 20% in the Announced Pledges Scenario in 2030. The share of global EV battery demand is also projected to decrease in Europe from 25% in 2021 to 20% in both the Stated Policies and Announced Pledges Scenarios in 2030.
According to recent accounting by Benchmark Mineral Intelligence, the announced battery production capacity by private companies for EVs in 2030 amounts to 4.6 TWh, a higher value than for both the Stated Policies Scenario and Announced Pledges Scenario demand. If all the announced capacity successfully came online by 2030, using total battery demand, the utilisation factor of battery manufacturing would be 47% in the Stated Policies Scenario, slightly higher than in 2021 (43% based on nameplate capacity). Battery production capacity will still be concentrated in China (70%), yet more
investments are being directed to other regions, with a quarter of battery production capacity expected in Europe and the United States by 2030.
Anode and cathode production is slowly becoming more geographically diversified
Scaling up cell and battery production will require additional output from anode and cathode manufacturers. In the Stated Policies Scenario, there is a sixfold increase in cathode demand and a fivefold increase in anode demand in 2030 relative to 2021 production. For the Announced Pledges Scenario, cathode demand increases tenfold and anode demand eightfold. In the Stated Policies Scenario, cathode production reaches 3 300 kt and anode production 1 500 kt in 2030, requiring around 29 additional cathode material plants and 23 additional anode material plants. For the Announced Pledges Scenario, cathode demand is 5 200 kt and anode is 2 500 kt, requiring about 50 cathode and 40 anode plants. For each GWh of battery production, 1.5 kt of cathode and 0.9 kt of anode material are required. Current cathode and anode material production are highly concentrated; together China, Japan and Korea account for 97% of current cathode and and 99% of anode production. Looking forward, the picture does not change much in the near term. Assessing all current announced and under construction cathode and anode material production plants, which are set to be online by 2025, shows the United States and Europe together will only produce around 4% of cathode material and 2% of anode material in 2025. Increased
diversification is expected in the longer term based on announcements of planned production in Europe and North America. For example, by BASF with a planned cathode material production plant in Canada.
Number of mines to produce required levels of metals, anode/cathode production plants, battery gigafactories and EV plants required to meet projected demand in 2030 relative to 2021
IEA. All rights reserved.
Notes: STEPS = Stated Policies Scenario; APS = Announced Pledges Scenario. Number of additional mines/plants/factories required to meet projected demand from the 2021 demand level is shown by the arrows. Projected demand is annual. Metal demand is total demand including EV and non-EV demand. Assumes the average annual production capacities: lithium mine - 8 kt; nickel mine - 38 kt; cobalt mine - 7 kt; cathode plant - 94 kt; anode plant - 54 kt; battery gigafactory - 35 GWh; and EV production plant - 0.5 million vehicles. Nickel demand does not distinguish between Class 1 and Class 2 nickel.
Sources: IEA analysis based on S&P Global ; Bloomberg NEF; Benchmark Mineral Intelligence.
Lithium is the most critical metal for EVs as it has no commercially available substitute at scale. Therefore, it experiences the fastest demand growth of the battery metals. Practically, all of the increase in demand for lithium to 2030 is projected to come from EV batteries in both scenarios.
Lithium demand in the Stated Policies Scenario reaches about 330 kt by 2030, a fourfold increase relative to 2021 production (80 kt). For the Announced Pledges Scenario, lithium demand reaches 500 kt, a sixfold increase from 2021 driven by higher EV sales across all modes. EV batteries were responsible for almost half of global lithium demand in 2021. In 2030 this rises to 70% in the Stated Policies Scenario and almost 80% in the Announced Pledges Scenario. In order to meet this surge in lithium demand, around 30 new lithium mines are needed in the Stated Policies Scenario by 2030 and 50 new lithium mines in the Announced Pledges Scenario, assuming an average annual lithium mine production capacity of 8 kt.
By 2030, nickel is facing the largest absolute demand increase as high-nickel chemistries are the current dominant cathode for EVs, and are expected to remain so. High-nickel Li-ion batteries require far more nickel than even lithium. For example, a NMC811 battery requires almost seven times more nickel than lithium by weight. For cobalt, the opposite is true as battery makers continue to move to lower cobalt content chemistries (and even cobalt-free chemistries by
2030) to reduce costs and due to environmental, social and governance concerns. However, the surge in global demand for EV batteries still increases total cobalt demand this decade.
Share of total demand for battery metals from EVs and clean energy technologies, 2021 and 2030
IEA. All rights reserved.
Notes: STEPS = Stated Policies Scenario; APS = Announced Pledges Scenario. Clean energy technologies include: stationary energy storage batteries, renewables, nuclear, hydrogen technologies and grid technologies.
Sources: IEA analysis based on S&P Global.
In the Stated Policies Scenario, total nickel demand rises 60% to around 4 200 kt by 2030 while total cobalt demand increases 45% to 250 kt. Out of total demand for nickel, EV batteries account for a fifth of demand in 2030 and about a quarter of demand for cobalt in the Stated Policies Scenario. In the Announced Pledges Scenario, nickel and cobalt demand from EV batteries is 65% higher than in the Stated Policies Scenario, with an EV share of 30% and 40%, respectively. To meet the projected demand in 2030 in the Stated Policies Scenario, 41 nickel and 11 cobalt additional mines are needed – a significant scaling up requirement. For the Announced Pledges Scenario, 60 nickel and 17 cobalt new mines are required in 2030, (assuming average annual mine production capacity of 38 kt for nickel and 7 kt for cobalt).
Range of typical lead times to initial production for selected steps in EV battery supply chain IEA. All rights reserved.
Notes: Lead times for mines are calculated from completion of the preliminary feasibility study to the start of production. For other elements, lead times are calculated from investment decision to production.
Sources: IEA analysis based on Heijlen et al. (2021); Benchmark Mineral Intelligence; S&P Global
Meeting battery metal demand in 2030 and beyond requires investment to be mobilised now, particularly in new mining capacity
To meet the demand for projected EV deployment various elements in the supply chain will need to expand. Ramping up of countries’ climate-related amibitions and pledges will also increase demand further for metals to supply the necessary EV batteries. As observed in 2021, demand for EVs can increase very rapidly though scaling up supply requires time, as mines and factories cannot be brought online overnight.
Elements of the supply chains have various lead times. The downstream stage, EV vehicle assembly, is the most dynamic, since automobile production capacity is much higher than demand, automakers can retool existing factories to manufacture EVs. For example, work to retool (convert a plant from ICE vehicles to EVs) at Volkswagen’s Zwickau factory in Germany began in 2018 and the first EVs were produced in November 2019. Similarly, Tesla’s EV factory in Shanghai was completed in roughly one year after breaking ground in early 2019.
Battery production lead times can be more varied. In China, CATL has been able to deliver a new cell manufacturing facility in under one year due to experience in their production, while four years elapsed between the announcement of Northvolt’s first factory in Sweden and the beginning of production. Anode and cathode plants have lead times that are typical for chemical plants, which vary by region. Umicore announced production plans for a plant in Poland in 2018,
which is expected to begin commercial production in 2022, thus requiring four years. In China, cathode factories can be built in less than two years due to previous experience and the use of existing sites for expansion.
By far the longest lead times are in the extraction of raw materials. After an extractable resource is identified through exploration, it can take from four to more than twenty years for a mine to begin commercial production. Four to sixteen years can be required for the necessary feasibility studies, and engineering and construction work. Long lead times are often required to secure financing and the necessary permits. Securing permits can take from one to ten years due to some countries requiring multiple permits or due to permitting delays. There is some evidence that over the decades, the time required to bring mines online has increased and this can be partially attributed to longer permitting and feasibility study lead times.
In addition to the time required to begin commercial production, mines often require around ten years before they reach nameplate production capacity. An analysis of lead times across the supply chain indicates that with sufficient investment, downstream stages of the EV battery supply chain can ramp up to meet even rapid increases in demand in the 2030 time frame. However, upstream mineral extraction can cause major bottlenecks unless adequate investments are delivered well in advance.
Impact of 10% commodity price change on the battery pack price for selected battery chemistries
IEA. All rights reserved.
Notes: Na-ion = sodium-ion. Manganese-rich chemistries: LMR-NMC = lithium-manganese-rich NMC; LNMO = lithium nickel manganese oxide. LNO = lithium nickel oxide. NMCA = lithium nickel manganese cobalt aluminium oxide. LFP = lithium iron phosphate. NMC = lithium nickel manganese cobalt oxide (NMC622 and NMC811). Battery pack price sensitivity to commodity prices. All chemistries modelled with graphite anode. Cathode thickness kept constant at 120 µm with cathode loading adjusted. Modelled with 2021 average commodity prices as the base and then with 10% increase in lithium, nickel and cobalt prices. Na-ion contains no lithium, nickel or cobalt.
Sources: IEA analysis based on BatPaC (2022); Dhir et al (2021); Greenwood et al (2021); Bloomberg NEF.
The evolution of battery chemistries will determine which metals will face the greatest demand. Given the long lead times required to increase metal production, optimising and diversifying battery chemistries will play an important role in reducing demand for specific critical metals.
Today, lithium-ion batteries for EVs are either nickel-based (NMC and NCA) or lithium iron phosphate (LFP). The former have higher energy density and account for the vast majority of EV batteries outside of China. LFP has lower energy density but also lower cost and is widely used in China for both light- and heavy-duty vehicles.
Battery chemistries will be more diversified by 2030 as manufacturers select battery chemistries to serve specific vehicle characteristics. As exemplified by Volkswagen’s announcement, chemistries will be adapted to the vehicle category: premium vehicles can be expected to use the most high energy density batteries available, likely higher nickel content chemistries such as NCA95, NMCA and NMC9.5.5, or potentially those with even higher energy density, such as lithium nickel oxide (LNO) or lithium-manganese-rich NMC (LMR-NMC) if research challenges can be solved and commercially viable cycle life is achieved. For lower end, high volume and principally urban vehicles, LFP will be the primary chemistry as driving range is not the priority, and instead it is cost. Moreover, due to high commodity prices for nickel and cobalt and the expiry of key patents, LFP is set for
major growth in volume models in Europe and the United States in the coming years. Announcements have been made by key automakers such as Tesla and Volkswagen for LFP use for standard range EVs in both markets. The possibility of battery packs containing both LFP and high-nickel recently became reality with NIO announcing their CTP pack including both LFP and NMC cells to utilise the benefits of both chemistries.
For mid-range vehicles, the manganese-rich chemistry (lithium nickel manganese oxide [LNMO]) is a strong contender as it has a higher energy density than LFP, yet does not reach the levels of the highnickel chemistries. The larger proportion of manganese in LNMO reduces material costs and commodity exposure considerably compared to high-nickel chemistries. However, LNMO is still under development. Volkswagen has indicated its long-term strategy to pursue manganese-rich chemistries for mass-market EV models.
For medium and heavy-duty vehicles, LFP will account for the vast majority of installations as cost and reliability will be more important for the early applications of electric trucks. LFP has the best cycle life of the leading chemistries which suits frequent, short trips and being recharged often. On the other hand, longer range electric trucks are likely to use nickel-based chemistries with the highest energy density, but their deployment in the period to 2030 is limited.
The future of battery chemistries is not set in stone. There are advantages and disadvantages of the various chemistries. A sustained period of high battery metal prices may therefore have a dramatic impact on battery chemistries, accelerating the shifts already underway and anticipated due to current high prices. Sustained high commodity prices would support a shift towards chemistries with lower critical mineral intensity. Two primary impacts can be expected. First, a stronger shift to commercial chemistries with lower critical material intensity, particularly LFP which contains no nickel or cobalt. Second, an acceleration in the development of new chemistries which rely on less critical minerals, such as the manganese-rich cathode chemistry LNMO and even alternative lithium-free battery chemistries similar to Li-ion such as sodium-ion (Na-ion).
While researchers across the world are working to develop battery chemistries that do not use lithium, the closest most viable option today is Na-ion technology. Na-ion is currently being developed by one of the world’s largest battery makers, CATL, which commercially introduced Na-ion in 2021 and plans to form a basic industrial supply chain by 2023. Alongside the developments from CATL for Na-ion, the Chinese government plans to promote the development of the Na-ion battery industry in its 14th Five-Year Plan, with industry standards to achieve scale, lower cost and improve performance. Naion cells will have just over half the energy density of leading high-
nickel chemistries and therefore, will not be used for high energy density applications. However, it is comparable with LFP with only around 20% lower energy density than the leading LFP cells. Therefore, for applications where energy density is not critical, for example urban EVs or grid-scale storage, Na-ion is suitable. CATL is also mitigating the energy density limitations through their new AB battery pack design which can integrate both Li-ion and Na-ion cells in one pack.
The critical advantage of Na-ion over Li-ion is that it relies on abundant and low cost minerals. The cathode material for the CATL Na-ion battery (Prussian White) is made of low cost elements sodium, iron, nitrogen and carbon. Na-ion cannot use graphite anodes, so instead uses hard carbon. In addition, less copper is required as Naion can use aluminium anode current collectors, unlike Li-ion. While Na-ion has advanced beyond the research stage with demonstration of commercially viable performance, there are no supply chains today for its cathode and anode materials. The main uncertainties around the deployment of Na-ion is the scalability of the production processes for these materials and the time required to develop an industrial scale supply chain. Fortunately, due to the similarity of Naion and Li-ion, it is relatively simple to adapt current cell factories to the production of Na-ion cells.
To illustrate the impact of the possible trends, we present the Constrained Chemistry Case. It focusses on cathode chemistries to assess the impact of prices remaining high for longer, coupled with a strong reaction from automakers to high prices. The most significant change is major substitution from high-nickel cathode chemistries to LFP. In the Constrained Chemistry Case for the Stated Policies Scenario, global demand for nickel is reduced by 10% or about 440 kt per year, while the demand for cobalt is reduced by 15% equivalent to 35 kt per year. The reduction in nickel is substantial as it is almost twice the 2021 total production of nickel in Russia (the world’s largest Class 1 nickel producer). For the Announced Pledges Scenario, the demand reduction is even more significant with 15% total demand reduction for nickel and 20% for cobalt.
Lithium demand would be slightly reduced in the Constrained Chemistry Case, with only a 3% reduction in both the Stated Policies and Announced Pledges Scenarios mainly due to LFP having a slightly lower lithium intensity per kWh than high-nickel chemistries so its much larger deployment also reduces lithium demand. LNMO also has lower lithium intensity so it supports lithium demand reduction. The introduction of Na-ion by 2030, being the only chemistry that does not contain lithium, notably decreases lithium demand with only a small share. Therefore, in the short term, lithium demand cannot be significantly reduced, though there is potential in the longer term.
Light-duty vehicle battery chemistry projections, Constrained Chemistry and Base cases, 2021 and 2030
IEA. All rights reserved.
Notes: Battery cathode chemistries include: Na-ion = sodium-ion. LNMO = lithium nickel manganese oxide. LMO = lithium manganese oxide. LFP = lithium iron phosphate. LNO = lithium nickel oxide. LMR-NMC = lithium-manganese-rich NMC. NMC = lithium nickel manganese cobalt oxide. NMC-highNi includes: NMC811 and NMC9.5.5. NMC-medNi includes: NMC532, NMC622 and NMC721. NMC-lowNi includes: NMC333. NMCA = lithium nickel manganese cobalt aluminium oxide. NCA = lithium nickel cobalt aluminium oxide. NCA+ includes: NCA85, NCA90, NCA92 and NCA95. The Base and Constrained Chemistry cases refer to different battery chemistry shares in 2030. The Base Case is what is expected taking into account optimal allocation of chemistries to appropriate use-cases as well as recent price movements. The Constrained Chemistry Case depicts the consequence of a prolonged period of high commodity prices, coupled with strong reactions by automakers to price signals.
anodes, dramatically improving driving range capability, opening other applications and eventually driving down costs. There has been considerable activity and industry announcements for ASSBs recently from both start-ups and established battery makers. For instance, Nissan is starting pilot production in 2024 and aims to produce EVs with ASSBs in 2028, having just opened a prototype production facility in Kanagawa, Japan. Quantumscape and Volkswagen have a joint venture that plans a pilot production line to start in 2024. Samsung SDI began construction of a pilot solid-state battery production line in March 2022, and aims to develop prototype cells by 2025 and start mass production in 2027.
IEA. All rights reserved.
Notes: STEPS =Stated Policies Scenario; APS = and Announced Pledges Scenario. The percent of total metal demand reduction in the Constrained Chemistry Case is relative to the Base Case including EV and non-EV demand.
All-solid-state batteries (ASSBs) are the anticipated next step-change improvement in battery performance. ASSBs can enable the use of a lithium metal anode which can result in battery energy densities around 70% higher than the current best Li-ion batteries with graphite
Despite the activity and announcements, major technical challenges remain to be solved before ASSBs can make significant impacts. Current state-of-the-art performance often relies on impractical pressures to solve the contact problem, or on currently unscalable, expensive production processes to reach viable performance. Though progress is being made, ASSBs are not expected to have a significant impact until after 2030.
Total demand and supply for lithium, nickel and cobalt, 2020 - 2030 IEA. All rights reserved.
Notes: NZE = Net Zero Emissions by 2050 Scenario; STEPS = Stated Policies Scenario; APS = Announced Pledges Scenario. The NZE bar represents variability in demand if demand-side measures are taken to reduce battery and critical metal demand.
Sources: IEA analysis based on Benchmark Mineral Intelligence for supply capacity.
In comparing metal supply estimates by mining industry experts with the IEA demand scenarios, it appears that EV battery metals demand in the Stated Policies Scenario will likely be met for all metals up to 2025 if announced new supply comes online as scheduled. When looking to 2030, the situation is more uncertain, but a continuation of trends should generally be sufficient to meet demand for all metals if all anticipated supply comes online, though with a small margin. Nonetheless, this still requires a significant effort: dozens of mining projects will have to enter the market and reach capacity on schedule and tens of new mineral processing and precursor plants will have to be commissioned. Also, in order to translate this into EV deployment, tens of cathode and anode plants, gigafactories and EV production plants are required.
Demand for lithium will greatly exceed current supply projections by 2030 in the Announced Pledges Scenario. To meet climate and zero emissions targets, additional investments will have to flow into the mining industry. Lithium requires a 45% increase in demand in the Announced Pledges Scenario compared to the Stated Policies Scenario or a 33% increase from projected supply in 2030 – roughly 15 additional mines would be required on top of projected supply. For nickel, demand in the Announced Pledges Scenario is just over supply, however the total projected supply includes both Class 1 and 2 nickel whereas batteries require Class 1 or significant additional
processing of Class 2 nickel. Therefore, significant investments are needed.
In the Constrained Chemistry Case, the demand for all metals will decrease, in particular for nickel and cobalt. Nickel demand in the Announced Pledges Scenario would be reduced to be the same as in the Stated Policies Scenario in 2030. For cobalt, the Announced Pledges Scenario demand is met by projected supply, but the Constrained Chemistry Case would reduce the Announced Pledges Scenario demand to 22% below supply estimates, a considerable supply surplus. For lithium, this would reduce the gap between the Announced Pledges Scenario demand and projected supply by 13%.
Though the price of cobalt is rising and the supply of cobalt is highly concentrated geographically and thus more vulnerable to supply shocks, it is expected that in the long term cobalt supply will likely not be as much of an issue as lithium and nickel. This is due to the trend of moving away from cobalt in cathode chemistries, coupled with the expansion of recycling as cobalt is the most valuable battery metal per kilogramme.
In the long term, recycling will contribute significantly to supply. However, only small contributions from recycling are expected by 2030, particularly for lithium and nickel. From analysis of the dates of expected retirement of EV fleets and their battery chemistry
compositions, there is less than 1% of total projected demand (in both scenarios) available from recycling for lithium and nickel by 2030. For cobalt there is a small contribution available from recycling, expected at around 2% of total 2030 demand for both scenarios.
Reuse in second-life batteries
Secondary production from recycled minerals
Share of recycled minerals in total demand
The projected demand for battery metals in the Net Zero Emissions by 2050 Scenario (Net Zero Scenario) is significantly higher than current demand. Demand in this scenario in 2030 is projected to increase by 30% per year for lithium, 11% for nickel and 9% for cobalt. By comparison, supply of lithium in the past five years has increased 6% per year, nickel by 5% and cobalt by 8%. Therefore, meeting the Net Zero Scenario demand for electrification requires large investments in the supply of battery minerals – just as in all other clean energy technology sectors. However, actions can be taken to minimise demand by addressing two key levers: mineral intensity of batteries and average battery size per vehicle.
Average battery sizes increased by 60% between 2015 and 2021. This reflects both increased average driving range and increased average energy consumption, as a larger share of electric cars are SUVs. Vehicles with more than 110 kWh batteries are already being produced. In the coming years, if current trends continue, we expect battery sizes to continue to increase by up to 30% in 2030. In the Net Zero Scenario, this trend could be curbed by enacting policies that discourage vehicles with extremely large batteries, for example by linking incentives to battery sizes or, in the longer term, taxing EVs with large batteries. If by 2030 battery sizes remained equal to today, 16% of incremental battery metal demand could be avoided.
Innovative battery chemistries in the Net Zero Scenario scenario are developed more rapidly, following an increase in investment for innovation. For example, all-solid-state batteries are expected to enter the market earlier than in the Stated Policies Scenario. If innovation focussed on minimising the material footprint in the Net Zero Scenario, by following the Constrained Chemistries cathode mix, demand for the key battery metals would decrease by up to onethird.
In addition, the Net Zero Scenario investment in innovation may also bring forward novel extraction and processing technologies, such as DLE, clean HPAL and re-mining from mining waste, that can all contribute to increasing supply.
Direct lithium extraction (DLE) is a process largely in the pilot stage today. It bypasses the time-intensive need to evaporate the unconcentrated brine water and chemical removal of impurities. Instead, DLE technologies directly extract lithium from unconcentrated brine either through adsorption, ion exchange or solvent extraction techniques. DLE relies on high selectivity technologies which can extract lithium from complex and varied brines and reject impurities.
As well as offering cost and lead time advantages, DLE has sustainability advantages and widens the pool of economically extractable lithium supply. For example, areas unsuitable for evaporation ponds such as lithium-rich geothermal brines, where there is significant resource, such as the Salton Sea in California. Environmental impacts can be considerably reduced compared to conventional hard rock mining and evaporative pond processes.
Nevertheless, achieving robust selectivity and scaling up DLE technologies remains challenging. For example, many DLE technologies must be tuned to the conditions of the brine. DLE is an emerging process yet to be tested at scale, however, several companies are leading in the development of DLE projects such as POSCO, Standard Lithium and Vulcan Energy. There are mining companies looking to use DLE as well as companies developing DLE technology, with a number of joint ventures being formed.
Batteries require Class 1 nickel, typically from sulphide deposits. Most production growth in the near future, however, is coming from regions with significant laterite resources, which produce Class 2 nickel, such as Indonesia and the Philippines.
There are novel technologies which can convert low grade laterite resources into Class 1 nickel. HPAL (high-pressure acid leaching) is a form of hydrometallurgy that uses acid separation under high temperature and pressure to produce nickel at Class 1 grade suitable for battery applications.
HPAL however, comes with significant challenges, predominantly due to cost and lead times. Capital costs for HPAL projects typically are double that of conventional smelters for oxide ore and take about four to five years to reach capacity. Recent projects have also suffered from major delays and cost overruns. Nevertheless, projects are coming online with China leading investment in HPAL projects, particularly in Indonesia. Indonesia’s first HPAL battery nickel project, a joint venture between Indonesian company Harita Group and Chinese company Ningbo Lygend Mining Co. started operating in 2021. There are also concerns with the environmental impact of HPAL as it often uses coal or oil-fired boilers for heat, thus emitting up to three times more GHG emissions than production from sulphide deposits. There are companies attempting to make HPAL more sustainable such as Clean Teq, a company developing a solar-powered HPAL project in Australia, where steam and heat are also recovered.
Mixed hydroxide precipitate (MHP) is becoming increasingly important as an intermediate product produced from laterite, which can be refined into nickel and cobalt sulphates needed for batteries at low cost. MHP can also be processed into nickel and cobalt products from selective acid leaching, a process with a lower environmental footprint. MHP, often produced from HPAL, is becoming an important feedstock over nickel metal due to its lower cost and the expected increase in availability.
Another method being explored is the conversion of nickel pig iron (low grade 3-12% nickel) into an intermediate grade nickel matte (>50% concentration), a precursor to nickel sulphate used for batteries. This would significantly increase the pool of potential nickel able to be used in batteries, however, it is a highly emissions-intensive process (four times more than HPAL) and much more than conventional sulphide production. Tsingshan, the major Chinese steel producer, is pursuing this process and made its first shipment in 2022. The economics are uncertain with another facility in New Caledonia having closed as it was too expensive. Tsingshan is looking to utilise clean energy for its operation to reduce the impact, however, the process uses a significant amount of direct fuels, raising into question its realisable potential for reducing emissions in line with other techniques.
Recovery from mining waste, refered to as re-mining, is a novel process of extraction of valuable minerals and metals from mine tailings, waste water and rock. This is a potentially significant source of supply that so far has been unrealised. For example, tailings for nickel and copper mining were 4 billion tonnes in 2017. There are several start-ups focussing on this including the Rio Tinto backed start-up Regeneration.

A common concern related to EV charging is whether power systems can handle increased demand for electricty as electric vehicles are deployed in greater numbers. Power system operators must balance supply and demand on the grid at all times. To do so requires sufficient power resources through generation or storage and ample network capacity.
Bulk energy: Sufficient power resources are required to serve the increase in load from EVs In the large economies that today are leaders in EV deployment, e.g. China, Europe and the United States, EVs account for under 5% of total electricity consumption in the Announced Pledges Scenario in 2030. At such a level, smart charing of EVs could provide value to the power system.
Network capacity: Adequately sized and equipped transmission and distribution networks are required. The relationship of EV uptake to upgrade needs is not necessarily straightforward. For example, a distribution system may have high levels of electricity demand but some lines may be sized for small capacity due to low loads and low predicted load growth, such as in rural areas compared to urban areas. Clustering effects especially in residential areas could pose problems even at low EV uptake.
Network upgrades are generally expensive. Maximising the use of the network over a 24-hour period can be more cost-effective than
upgrading assets to serve peak periods that occur for relatively short periods over a daily period.
EV charging is but one of many additional sources of demand that are putting increasing demand pressure on power grids. For instance, switching to electric heat, adding an air conidtioner and other applicances, not to mention the expanding array of plug-in devices in homes, offices businesses and the like are contributing to higher level of electricity demand at different times of the day Besides more demand, power system operators are balancing an increasing proportion of variable renewables (VRE) in the bulk power supply and at the distribution level which are driving changes in system operations and requiring network upgrades. In many cases, PVs factor more into network upgrades compared to EV charging or other newly electrified loads.
Four cases are presented that reflect the situation of most markets in terms of EV penetration speed and VRE deployment. We consider challenges to the grid as well as opportunities in relation to these four illustrative cases.
In the Global EV Outlook 2020, we explored the peak load impact of projected electromobility in 2030 and found it to be less than 10%, even if unmanaged. In this version of the Outlook, we explore the impact of EVs at distribution grid level..
1 Slow EV growth. Low loads due to slow uptake of EVs or uptake of small EVs (two/three-wheelers). Non-EV loads could also be increasing.
Delhi, Australia EV load may not be significant in relation to the current network capacity, or to the planned upgrades caused by growth of non-EV loads (e.g. heating, cooling, and appliances).
There may be room to encourage higher penetration of EVs along with non-EV loads so that grid upgrade plans have more robust considerations.
Prepare market design and regulation to be adaptable for passive measures.*
2 Increasing EV load along with non-EV load.
Increasing baseline energy service demand, electrification of heating and uptake of air conditioning
3 A Increasing EV load with high VRE generation.
VRE uptake is already high or has high potential, at either bulk or distribution energy scale.
3 B EV-led growth. Other loads not expected to increase as many end-uses are already electrified
France, Germany Infrastructure would likely be upgraded to handle new essential loads such as electrified heating. This leads to increased capacity to service more EV charging.
Higher capacity might be needed if EV charging coincides with newly electrified loads that are less flexible.
California, Hawaii Upgrading infrastructure would be needed to handle variable generation from various sources. The challenge is often to make loads more flexible.
Smarter and more co-ordinated charging control measures could be established early to help reduce the cost of new infrastructure, especially if VRE uptake is expected.
Norway Network capacities might be robust enough due to high existing capacity. Though deploying fast charging could entail costly upgrades.
High opportunity or requirement to have EVs participate in local or bulk flexibility through V1G or V2X to help increase VRE uptake
Passive measures might be sufficient, especially if flexibility needs are minimal.
Connection fees or non-firm connection for fast chargers could help lower the grid investment costs and accelerate connection.
*Passive measures for EV charging could include differentiated tariffs (e.g. time-of-use, time-of-day and dynamic) or other means to encourage charging at off-peak times (e.g. workplace daytime charging where daytime generation is abundant)
Note: V1G = charging is unidirectional where the grid supplies power to the vehicle. V2X = any charging that is bidirectional where the vehicle could discharge power back to the grid (V2G), a building (V2B) or a house (V2H).
Share of grid infrastructure requiring upgrades for a given stock share
EV stock by regions grouped by stock share and scenario
IEA. All rights reserved.
Notes: STEPS = Stated Policies Scenario; APS = Announced Pledges Scenario. The share of grid assets requiring upgrades was simulated for a medium voltage grid in the city of Dresden in Germany (urban) and Töging am Inn in Germany (rural). The simulation includes a projection of current trends in terms of space heating electrification and distributed solar uptake. Only electric PLDVs are included in the simulation. 60% of charging is assumed to occur at residences with chargers ranging from 2.3 kW to 11 kW.
Sources: IEA and RWTH Aachen University analysis.
With most EV charging expected to occur at residences, their distribution grids will need to manage significant additional loads. As usual when new types of loads are added to distribution networks, some will require equipment upgrades such as low and medium voltage transformers and lines. After an initial location-specific EV load threshold for which no grid upgrades are needed is surpassed, the grid upgrade requirements in the EV roll out phase are roughly proportional to the number of EVs.
Grid simulation results based on German distribution grid case studies show that until EVs reach around 20% of all vehicle stock, upgrade requirements are rather sparse and mostly focussed on transformers that require upgrades to deal with voltage control (similar conclusions were found in an Australian study). This is a switch from passive to active transformers that can control voltage levels on the low voltage side, so-called intelligent or on-load tapchanging transformers. Rural areas, with relatively weaker grids might be the first to require upgrades. The simulation indicated that beyond 20% EV stock share, the required grid adaptation becomes significant. With up to a quarter of all transformers requiring upgrades in rural areas and 10% in urban areas. Line upgrades, which are the most complex and expensive operations, are likely to remain limited to less than 2% of the total line asset even with 40% EV stock share,
based on the case study simulation. The results of this simulation are representative of most countries that fall in Cases 2 and 3.
There are three reasons why grid upgrade needs are relatively low for moderate EV penetration levels. First, while the load of an individual EV is high compared to typical houshold loads, when several EVs are in a system, not all their loads are coincident. When a sufficient number of users are considered, the effective maximum load is only a fraction of the maximum possible load. Second, by 2030 current distribution grids will have to continue to expand to serve additional loads coming from the installation of small-scale solar photovoltaics and the electrification of heat, among other increased electricity demands. Third, in most industrialised countries, distribution grids historically have been over designed and many retain significant spare capacity.
Scenario most regions have EV stock shares ranging between 1020% by 2030, and roughly a third of all EVs will be in regions with a stock share below 10%. Existing grids should be able to handle the added power demand from EVs in Europe, China and North America in most circumstances.
While country level stock shares will remain below critical thresholds in the next decade, certain cities or provinces might reach higher local stock shares and thus experience stronger grid impacts which require upgrades before 2030. In some cases, cities that are early EV adopters are also ahead in terms of space heating electrification or distributed VRE. These additional loads can result in grid congestion already. As the energy transition proceeds, more issues of grid congestion might occur in frontrunner cities, well before 2030.
The addition of charging stations for heavy-duty vehicles can add stress to a grid given their high power ratings. Flexibility in the location of the charging point, that is, locating the charging station where connection capacities are available, can help. However, existing bus depots (where tens of buses need to charge) often do not have this flexibility and thus might require distribution grid upgrades for the electrification of the fleet.
The situation is different in emerging market and developing economies where existing networks are sized to smaller loads and therefore are weaker. Such countries are expected to account for 10% of the global EV stock by 2030 in the Stated Policies Scenario and 13% in the Announced Pledges Scenario. Their adoption of electric cars is slower compared to their markets; therefore, most developing and emerging countries fall under Case 1. Several
studies, e.g. Brazil, Thailand and India, have been conducted on the impact of electromobility on transmission system level peak load. These studies show that in terms of bulk energy, the impact of EVs expected by 2030 is within the existing generation margins. At the distribution level, the grids in these countries are faced with continuously increasing loads (mostly from appliances), thus grid upgrades are required irrespective of EV loads. However, studies looking at the specific distribution grid impact of EVs remain scarce. The IEA will publish a manual for policymakers in developing and emerging markets on EV grid integration as part of the Global Environment Facility E-mobility programme.
After 2030, EV stock shares are set to rapidly increase in all major markets in association with increased electrification of other energy services. Grid operators must ensure that that the necessary investments are made to accommodate these increasing loads beyond 2030: significant upgrades are likely to be required. Effective demand-response measures related to EV charging will be necessary to avoid extreme peak load events and disproportionate investment in grid upgrades.
…yet, grid upgrades will be needed for heavy-duty EVs, frontrunner cities and in developing and emerging markets
Investment
IEA.
Notes: PLDV = passenger light-duty vehicle; HDV = heavy-duty vehicle. Costs represent a global average weighted by EV stock. Distance to next substation 5 km in urban areas and 15 km in rural areas.
Sources: IEA analysis based on University of Wuppertal (2016); Netbeheer Nederland (2019); Bloomberg New Energy Finance 2020 Commercial EV Charger Price Survey.
Satisfying demand for EV charging for all types of trips and for all vehicles modes will require the development of extensive charging networks along main transport corridors. Existing grids are expected to be able to accommodate most of the EVs that are projected to come into use in both urban and rural areas in the period to 2030. Highway charging, however, presents some specific difficulties. When transport corridors are located in areas with existing grids, the installation of chargers does not have major barriers, provided that the grid is not already congested. But to provide charging in more remote locations, grid upgrade costs can become a barrier.
A typical roadside charging hub with several chargers suitable for LDVs is unlikely to demand more than a 2 megawatt (MW) connection, and thus is suitable to be connected to a low voltage network. In this instance, investment costs are proportional to the required length of line. The situation differs for HDV charging with up to 4.5 MW chargers are being considered by industry actors, over ten times more than the fastest chargers currently installed for LDVs. Such powerful chargers require connection to a medium voltage grid. Charging hubs able to serve several trucks at the same time (as would be required along major transport corridors) require connection capacity of more than 10 MW to a high voltage grid, which leads to notably higher cost. For electric truck charging hubs in more remote locations, the costs can skyrocket to USD 8 million per hub. Costs
vary across regions. They are lower in China, less than a third for chargers and half of the grid connection cost compared with Europe.
Technological progress can help alleviate some of these challenges. Technology development and learning-by-doing for fast chargers for LDVs has brought cost declines, and this is likely to be the case for electric truck chargers. In addition, innovative modular and containerised solutions for substations and transformers are likely to help lower costs for these components. However, power line costs are unlikely to decrease significantly as they are very mature technologies. Alternative solutions such as installing batteries or including distributed renewable capacity at charging stations can help alleviate the grid infrastructure costs required to connect these stations to the grid.
Creating and upgrading grid connections is a complex task involving a multitude of planning, approval and procurement steps, each of which requires significant lead times.
Permitting processes including impact studies, involvement of multiple stakeholders, discussions of alternative routes can double the estimated time to bring a connection project online. In case of higher voltage connections, total project time can exceed four years. The permitting time varies considerably across regions and jurisdictions.
Engineering, procurement and construction of substations and chargers can follow predictable timetables. The most time critical element is transformer procurement, as transformers tend to have long manufacturing lead times. The construction of new lines can also require significant time, especially for higher voltage connections.
The lack of an extensive charging infrastructure network can slow EV adoption. It is of paramount importance that the required grid upgrades are put in place as swiftly as possible while taking into account the legitimate claims of all stakeholders. Clear approval timelines and enhancing the administrative processing capacity of entities tasked with approval processes will help to accelerate EV deployment.
Given the long lead times, co-ordinating power system planning to adequately reflect the multitude of increasing demand sources and their load profiles is a must to avoid bottlenecks. Co-ordination across government departments could help ease the time needed for permitting and construction. Recent intitiatives in this direction were taken in the United States.
Typical
IEA. All rights reserved.
Note: Permitting of charging infrastructure includes all necessary approvals for the hub, e.g. civil works.
Sources: IEA analysis based on Netbeheer Nederland.(2019) and ENTSO-E (2010)
Uncoordinated EV charging risks compounding concerns for grid operators to balance supply and demand, as well as placing additional pressure on networks. This could necessitate additional investment in peaking resources. The impacts can be difficult to manage, especially at very high EV stock penetrations and in systems with a weak grid. Co-ordinated smart charging of EVs offers the potential to help smooth increases in peak demand. Time-of-use tariffs can facilitate demand-side response by giving consumers price signals to shift EV charging to off-peak periods. An effective approach to minimise the need for grid investment due to EV loads will be to make network constraints known at a granular level, identifying areas that are under the most stress, including at the distribution system level. This allows smart charing to be tailored accordingly. Deployment of smart charging for EVs faces a number of challenges:
Lack of distribution grid transparency: Network operators in medium and low voltage systems may not be able to forecast or have adequate data on real-time loads at a geographically granular level. Aggregation and analysis of data from smart meters and the installation of distributed grid sensing equipment can help to overcome this barrier.
Lack of demand-response technologies on a large-scale at the load level: Technologies to send and receive detailed signals for individual loads exist. However, their current application is limited to a few pilot projects and businesses. This reflects lack of a strong business case currently for these technologies
Inadequate market framework: The market design and regulatory framework in most countries does not provide a mechanism for contracting flexibility services between distribution system operators (DSOs) and consumers. Co-ordination between transmission system operators and DSOs needs to be strengthened to ensure coherence between the call for flexibility for local congestion and for system balancing.
Smart grids that monitor load and control smart charging are being demonstrated in a number of countries, e.g. United States and Portugal. By the end of this decade, at least partial application of smart grid technologies is projected to help curb the need for investment in grid upgrades due to EV charging by ensuring that peak load events are subdued or avoided.In the longer term, as EVs account for more than one-third of the stock, smart grids will be necessary to avoid very high investment requirements.
Eventually, the development and deployment of vehicle to grid technologies will enable vehicles to be plugged into smart chargers to contribute to balancing the system. In this manner, EVs will contribute to grid stability rather than being a source of instability to network balancing needs. Countries that fall in Case 3 A are more likely to require this technology.
Higher shares of variable renewables in in the generation mix are contributing to the transition needed to meet decarbonisation targets. Demand for electricity is increasing to power EVs, rising numbers of connected devices, improved energy access and a multitude of services. With rising demand comes the importance of power system flexibility, smart infrastructure and digital connectivity. New sources of flexibility can help to ensure that power systems are in balance at all times. The IEA projects that for the energy sector to reach net zero by 2050 globally, flexibility in electric networks needs to quadruple in that period. EVs and their batteries could provide a huge reservoir of flexibility to facilitate the energy transition.
There are three main types of smart charging:
• Off-peak charging: Uses simple signals, such as a time-of-use tariff to incentivise users to charge during off-peak hours or when there is a surplus of generation from renewables.
• Unidirectional managed charging: Charging time, rate and duration are controlled and optimised by adapting to price signals and power system needs. It requires signals on grid and renewable supply availability to be sent by a power system operator or an aggregator.
• Bidirectional managed or vehicle-to-grid (V2G): Charging for EVs that are technically able to input electricity into the grid. In this
practice, EVs serve as distributed energy storage, dynamically charging at times when system availability is the highest and providing additional power supply when called upon.
For all types of charging, optimisation criteria are fundamental. Consumers can take advantage of flexibility options to manage their own consumption; match it with the output of their rooftop solar panel, and reduce the electricity bill if time-of-use tariffs are available. They may also be able to sell flexibility services to the wholesale and balancing markets of the power system. This can help to manage balance and peaking on the system. For example, it can offer local flexibility services to the DSO to smooth grid constraints through voltage support or congestion management. Of course, this is in addition to serving the charging needs of the consumer’s EV.
Ensuring that markets and regulations reflect the value of flexibility options for the system is a first step to boost smart EV charging adoption. Consumer provided flexibility services will incur costs, for instance, in terms of battery degradation that must be appropriately valued. This value can be reflected at every level of the power market.
Cost-reflective time-sensitive consumer tariffs will incentivise drivers to charge their EV when it does not stress the network or when output
from renewables is high. This helps to minimise the need for costly network reinforcements
Smart charging can provide services along the power supply chain
Policy makers willing to harness smart charging flexibility potential can take measures to ensure their markets are adapted to distributed energy resources. One is to ensure that aggregators, and generally speaking every type of distributed flexibility provider (e.g. energy communities, peer-to-peer trading), have access to markets on a level playing field basis with traditional flexibility providers, such as power plants or large industries. The most appropriate way to incorporate EV charging flexibility will vary depending on the power system and market specificities. But fundamentals such as the right to participate, product specifications, rules for control and flexibility measurement should be assessed to ensure that undue burden is not placed on the distributed flexibility providers. Regulations should leave room for businesses to develop innovative pricing solutions and business models that best fit both consumers and power system needs.
Open markets that include wholesale markets and those for flexibility services such as balancing, congestion management and voltage control can provide tailored incentives by rewarding flexibility options where and when they have the most value.
The higher the granularity of such price signals in time and space, the more value they bring to the system, but also the more complex they get. Consumers alone cannot be expected to deal with highly detailed signals or to navigate several layers of energy markets. This role is can be undertaken by aggregators (either independent or utility subsidaries) that contract with individual customers to provide flexibility services and manage a pool of flexibility providers to maximise revenues and benefits to the participants and the system.
A major pre-condition for smart charging business development is the availability to control the charging of a large number of EVs. Interoperability allows aggregators to pool vehicles more easily and without burdensome procedures and interventions at consumer residences. This is key to smart charging development. Standards should be robust and cover cybersecurity, data accessibility and minimum requirements that can be applicable for both private and public chargers
Notes: Limited = For ancillary services in Chile, participation is limited to large centralised power plants while in Portugal, the market is in its early stages as frequency regulation has been mandatory for conventional power plants Seasonal tariffs are not included in this table as they are not considered to be enabling since EV charging patterns are based on daily variations. In Greece, the e-mobility law specifies that all public access charging points must be smart chargers and private charge points must be smart charge capable to qualify for a subsidy. In Italy, the Ministerial Vehicle-to-Grid Decree authorises EVs in the ancillary services market and covers the cost to convert existing connections to smart chargers. In New Zealand, several electricity retailers offer plans with lower off-peak rates or rates that track wholesale spot prices, and some plans specifically target EV owners. There are no established standards or policies for smart charging in New Zealand, though voluntary guidelines introduced in 2021 include specifications for smart charging. In the United Kingdom, the DSOs are developing local flexibility markets to help manage constraints as an alternative to local network reinforcement.
Source: IEA analysis based on country submissions.
As part of its goal to ban new ICE cars by 2030, effectively shifting to EVs and PHEVs, the United Kingdom took action to mandate smart EV chargers. The Automated and Electric Vehicles (AEV) Act 2018, mandates that all EV charge points sold and installed in the country have smart functionality and meet minimum device level requirements.
The United Kingdom was an early adopter of a policy to mandate smart charger functionality; others such as France have followed suit. Germany and Greece mandate smart charging for private chargers to qualify for subsidies. Greece mandates smart chargers for all publicly accessible charging points. Portugal mandates smart chargers at publicly accessible charging points.
In July 2021, the UK government released its smart charging strategy that is based on a two-phased approach. This enables policy makers to set out the framework in phase 1 while providing visibility to stakeholders on the policy direction, yet having an opportunity to develop and adjust for more complex topics that will be adressed in phase 2.
Phase 1 requires that new charge points, public or private, be smart chargers and be set by default to charge only at off-peak times of the electricity system. Smart functionality is defined at the device level and includes: the ability to send and receive information; to modify the time of charging in response to information received; and to use the functions to provide demand-response services. It also incorporates basic cybersecurity standards (existing cybersecurity standard ETSI EN 303 645), basic interoperability to ensure that charge points are not designed to block change of supplier, and data accessibility, including customer access to consumption data. The specifications are outined in regulations for EV smart charge points that come into force in June 2022.
Phase 2 topics include full charge point operator interoperability (the ability of consumers to switch operators) and more in-depth analysis of elements such as cybersecurity and grid stability.
A new IEA modelling framework, the Global Energy and Climate Model (GEC-Model), is used in this edition of the Global EV Outlook. It combines the models that underly the IEA’s two flagship series, the World Energy Outlook and Energy Technology Perspectives, and was used to develop the Stated Policies Scenario and Announced Pledges Scenario projections. 28 The road transport model within the GEC-Model includes a number of updates and improvements in historical and projected vehicle data, including historical sales and stocks, mileage and scrappage, benchmarked and projections of fuel economy, and the modelling of electric vehicle supply equipment.
Following extensive data work conducted for the IEA report, An Energy Sector Roadmap to Carbon Neutrality in China, we have reassessed stocks and sales of electric two-wheelers in China, excluding electric bicycles, which were unintentionally included in previous editions of the Global EV Outlook. Stocks and sales of electric two-wheelers in China now account for electric scooters and motorbikes only, which leads to a considerable downward revision both in electricity demand and oil displacement provided by electric two-wheelers in China. Additional revisions to the electric twowheeler sales and stocks in other East and Southeast Asian
28 The results presented for the Net Zero Emissions by 2050 Scenario are based on modelling done for the IEA’s Net Zero by 2050: A Roadmap for the Global Energy Sector published in 2021
countries (including India, Indonesia, and other Association of Southeast Asian Nation [ASEAN] countries) have been made on the basis of more detailed data.
Further revisions to the data in China include the energy intensity estimates of electric buses based on updates on the split of electric bus sales by size, and on the split between light commercial vehicles and medium- and heavy-freight truck sales. These revisions are based on data compiled from the China Automotive Industry Yearbook and other industry articles.
In addition, due to differences in regional aggregation in the GECModel, the definition of Europe in this edition is broader than in previous ones. Previously, Europe included the member states of the European Union plus Iceland, Norway and the United Kingdom. This year, it also includes eastern European countries (excluding Russia), Turkey, Switzerland and Israel.
Revisions to the IEA road vehicle database draw upon available surveys, studies and modelling to estimate vehicle category-specific scrappage and mileage decay curves. After calibrating these curves
to ensure that they match country level and regional panel data, these parameters are projected to evolve depending on changes in GDP.
This update enables a more detailed and nuanced exploration of how different vintages of two-wheelers and cars, but especially of commercial vehicles (light commercial vehicles, buses and trucks) are used. It reflects the reality that newer vehicles are driven more, and hence make up a larger share of fuel consumption. This implies that electrification and other efficiency technologies have a faster potential to displace oil and to contribute to decarbonisation than would otherwise be projected.
Mileage assumptions for EVs also have been recalibrated.. The mileage of plug-in and battery electric vehicles has been assumed to be similar to the gasoline or diesel counterparts for light commercial vehicles, buses and trucks through 2030. In regions where low mileage estimates are used to calibrate to match historical trajectories of gasoline and/or diesel consumption as reported by country energy, statistics and/or transport ministries, these mileages are projected to converge to the global average mileage of that vehicle category.
For projections of the deployment of electric vehicle supply equipment (EVSE) required to support EV adoption, the modelling uses historical EVSE-to-EV stock ratios by region to inform future ratios. The current and projected share of EVs with access to
residential chargers is informed by current population distributions by dwelling type and provision of home charging. Benchmarking for historical estimates and projections of electricity demand by charger type are based on these data on dwelling type, plus surveys of historical and current charging patterns. Projections for public lightduty vehicle chargers are based on public charging capacity per EV, where the public capacity required per PHEV is assumed to be less than per BEV (since PHEVs have the option to fuel with petrol as opposed to full dependency on electric charging).
EVSE projections are also provided for buses and trucks, based on estimated electricity consumption, EVSE utilisation rates and assumed driving behaviour.
ACC advanced chemistry cell
ACEA European Automobile Manufacturers Association
AFC TCP Advanced Fuel Cell Technology Collaboration Partnership
AFDC Alternative Fuels Data Center
AFID Alternative Fuel Infrastructure Directive
AFIR Alternative Fuels Infrastructure Regulation
APS Announced Pledges Scenario
ASSB all-solid-state batteries
AUD Australian dollar
BEV battery electric vehicle
BMW Bavarian Motor Works
BNEF Bloomberg New Energy Finance
BYD Build Your Dreams
CAD Canadian dollar
CAFE Corporate Average Fuel Economy
CAGR compound annual growth rate
CAMM China Association of Automobile Manufacturers
CATL Contemporary Amperex Technology Co. Limited
Co cobalt
CO2 carbon dioxide
CTP cell-to-pack
DC direct current
DLE direct lithium extraction
DSO distribution system operator
DRC Democratic Republic of Congo
e-buses electric buses
e-mobility electric mobility
e-trucks electric trucks
EAFO European Alternative Fuels Observatory
EEC Eastern Economic Corridor
EFTA European Free Trade Association
EPA Environmental Protection Agency
ERMA European Raw Materials Alliance
ERP Emissions Reduction Plan
EU European Union
EUR Euro
EV electric vehicle
EV100 The Climate Group’s EV100 Initiative
EVI Electric Vehicle Initiative
EVSE electric vehicle supply equipment
FAME II Faster Adoption and Manufacturing of Electric Vehicles
FCEV fuel cell electric vehicle
FYP five-year plan
GBP British pound sterling
GEF Global Environment Facility
GHG greenhouse gases
GM General Motors
Gr graphite
HDV heavy-duty vehicle
HEV hybrid electric vehicle
HPAL high-pressure acid leaching
HRS hydrogen refuelling station
ICCT International Council on Clean Transportation
ICE internal combustion engine
IDR Indonesian rupiah
IEA International Energy Agency
INR Indian rupee
IPCEI Important Projects of Common European Interest
JPY Japanese yen
KRW Korean won
LCV light-commercial vehicle
LDV light-duty vehicle
LFP lithium-iron-phosphate
Li lithium
Li-ion lithium-ion
LMO lithium manganese oxide
Ni nickel
NMC nickel-manganese-cobalt
NMCA nickel manganese cobalt aluminium oxide
NOx nitrogen oxide
NZE Net Zero Emissions by 2050 Scenario
NKL National Knowledge Platform for Charging
Infrastructure
M/HDV medium- and heavy-duty vehicle
MHP mixed hydroxide precipitate
MoU memorandum of understanding
MSCI
ACWI MSCI All Country World Index
MY model year
OEM original equipment manufacturer
PHEV plug-in hybrid electric vehicle
PLDV passenger light-duty vehicle
RoW rest of world
LMR-
NMC lithium-manganese-rich NMC
LNO lithium nickel oxide
LNMO lithium nickel manganese oxide
Na-ion sodium ion
NCA lithium nickel cobalt aluminium oxide
NEDC New European Driving Cycle
NEV new energy vehicle
SAFE Safer Affordable Fuel-Efficient (SAFE) Vehicles Rule (United States)
SEK Swedish krona
STEPS Stated Policies Scenario
SUV sport utility vehicle
TCO total cost of ownership
TEN-T Trans-European Transport Network
THB Thai bhat
USD United States dollar
VRE variable renewables
VW Volkswagen
V2G vehicle-to-grid
ZETI Zero-Emission Technology Inventory
ZEV zero-emission vehicle
2/3W two/three-wheeler
Units of measure
°C degree Celsius
g CO2 grammes of carbon dioxide
g CO2/km grammes of carbon dioxide per kilometre
GW gigawatt
GWh gigawatt-hour
g/km Grammes per kilometre
km kilometre
km/lge kilometre per litre of gasoline equivalent
kW kilowatt
KWh kilowatt-hours
kt Kilotonnes
L/100km litres per 100 kilometres
lbs pounds
mb/d million barrels per day
Mt CO2-eq million tonnes of carbon-dioxide equivalent
MW megawatt
MWh megawatt-hours
t CO2 tonne of carbon dioxide
t CO2-eq tonne of carbon-dioxide equivalent
TW terawatt
TWh terawatt-hour
The Global EV Outlook 2022 was prepared by the Energy Technology Policy (ETP) Division of the Directorate of Sustainability, Technology and Outlooks (STO) of the International Energy Agency (IEA). The project was designed and directed by Timur Gül, Head of the Energy Technology Policy Division. Araceli Fernandez Pales provided strategic guidance throughout the development of the project. Leonardo Paoli co-ordinated the analysis and production of the report.
This principal IEA authors and contributors were (in alphabetical order): Ekta Meena Bibra, Elizabeth Connelly, Shobhan Dhir, Michael Drtil, Pauline Henriot, Inchan Hwang, Jean-Baptiste Le Marois, Sarah McBain, Leonardo Paoli and Jacob Teter.
Colleagues from the World Energy Outlook (WEO) Division led by Laura Cozzi provided essential support on modelling and analysis, with overall guidance from Stéphanie Bouckaert. Apostolos Petropoulos, Bruno Idini and Hyeji Kim contributed to the analysis on EV projections.
The development of this report benefitted from contributions from other IEA colleagues: Vahid Aryanpur, Tanguy De Bienassis, George Kamiya, Tae-Yoon Kim and Luis Lopez. Special thanks go to AndreasUlbigandhisteamat RWTH Aachen University (Christopher Hauk, Marc Trageser and Chris Vertgewall) for their analytical
input on EV integration in electricity grids. Valuable comments and feedback were provided by Keisuke Sadamori, Laura Cozzi and Brian Motherway.
Thanks also to Jon Custer, Astrid Dumond, Merve Erdil, Grace Gordon, Jethro Mullen, Isabelle Nonain-Semelin, Julie Puech, Taline Shahinian, Therese Walsh and Wonjik Yang of the Communications and Digital Office. Caroline Abettan, Reka Kozcka, Diana Louis and Per-Anders Widell provided production support
Debra Justus edited the manuscript.
The work could not have been achieved without the financial support provided by the EVI member governments, including Canada, Chile, China, Finland, France, Germany, India, Japan, the Netherlands, New Zealand, Norway, Poland, Portugal, Sweden, United Kingdom and the United States.
The report benefited from the high calibre data and support provided by the following colleagues: Abhay Bakre and Sameer Pandita (Bureau of Energy Efficiency, India); Daniel Barber (Energy Efficiency and Conservation Authority, New Zealand); Lisa Bjergbakke (Centre for Systems Analysis, Denmark), Klaas Burgdorf (Swedish Energy Agency); Albert Dessi (Department of Industry, Science, Energy and Resources, Australia); Nishi Hidetaka and Watanabe Kensaku (Ministry of Economy, Trade and Industry, Japan), Menno van Ginkel (Netherlands Enterprise Agency); Sita Holtsag (Ministry of Infrastructure and Water Management, the Netherlands); Rene-Pierre Allard, Nick Clark, Colin Dobson, Aaron Hoskin, Rahul Malik
and Thierry Spiess (Natural Resources Canada); Kaja Jankowska and Marek Popiołek (Ministry of Climate and Environment, Poland);
Sylène Lasfargues (Ministère de la transition écologique, France); Yi Liang (China Society of Automotive Engineers); Ana Lourenço (Mobie-E, Portugal); Gereon Meyer (VDI/VDE-IT, Germany); Matteo Muratori (Department of Energy, United States); Tommi Muona (VTT Technical Research Centre of Finland); Hiten Parmar (Regus Business Centre Randburg, South Africa); Kitchanon Ruangjirakit (King Mongkut’s University of Technology Thonburi); Nele Sergeant (Brussels Capital Region), Daniela Soler Lavín and Luz Elena Ubilla Borquez (Ministry of Energy, Chile); Joscelyn Terrell (Office for Zero Emission Vehicles, United Kingdom); Daniel Thorsell (Norwegian Public Roads Administration) and Katerina Vardava (Hellenic Ministry of Environment and Energy).
Peer reviewers provided essential feedback to improve the quality of the report. They include: Daniel Barber (Energy Efficiency and Conservation Authority, New Zealand); Harmeet Bawa (Hitachi Energy); Esteban Bermúdez Forn (Global Environment Facility Secretariat); Annika Berlin, Luis Felipe and Alex Koerner (UNEP); Natalie Berry and Renske Schuitmaker (Fastned); Mridula D. Bharadwaj (formerly CSTEP); Georg Bieker and Josh Miller (The International Council on Clean Transportation; Tomoko Blech (CHAdeMO); Klaas Burgdorf and Peter Kasche (Swedish Energy Agency); Francisco Cabeza (Element); Jennifer Carrasco (Boston Consulting Group); Sebastian Castellanos (World Resources Institute); Ryan Castilloux (Adamas Intelligence); Pierpaolo Cazzola
(Independent consultant); François Cuenot (UNECE); Giovanni Coppola (Enel X Way); Maria Isabel del Olmo Floréz (IDAE, Spain); Laurent Demilie (Federal Public Service Mobility and Transport, Belgium); Alberto Dessi (Department of Industry, Science, Energy and Resources, Australia); Mario Duran Ortiz (Independent consultant); Michael Dwyer (Energy Information Administration, United States); Andre Dzikus (UN Habitat); Aaron Fishbone and Maria Andreeva (ChargeUp Europe); Hiroyuki Fukui, Takashi
Matsumoto, Takashi Nomura and Koichi Numata (Toyota); Lew Fulton (UC Davis); Claire Goldfinch and Sandra Roling (The Climate Group); Frederic Hauge (Bellona); Nishi Hidetaka and Kensaku
Watanabe (Ministry of Economy, Trade and Industry, Japan); Cabell
Hodge (National Renewable Energy Laboratory) ; Aaron Hoskin (Natural Resources Canada); Kieran Humphries, Magnus Lindgren and Aaron Loiselle-Lapointe (Advanced Motor Fuels Technology Collaboration Programme); Kaja Jankowska and Marek Popiołek (Ministry of Climate and Environment, Poland; Kevin Johnsen (Nordic Energy Research); Hiroyuki Kaneko (Nissan Motor Co., Ltd); Tarek Keskes and Yanchao Li (World Bank) ; Rua Kitchanon and Yossapong Laoonual (King Mongkut’s University of Technology
Thomburi, Thailand); Ram Krishan (The Energy and Resources Institute, India); Sylène Lasfargues (Ministry of Ecological Transition, France); Francisco Laveron (Iberdrola); Dan Levy (Crédit Suisse);
Chengxi Li (Shanghai International Automobile City); Yi Liang (China Society of Automotive Engineers); Pimpa Limthongkul (Entec, Thailand); Xiao Lin (Botree Cycling), Sebastian Ljungwaldh
(Northvolt); Maurizio Maggiore (European Commission); Mark Major (SloCaT); Mattia Marinelli (Technical University of Denmark); James Miller (Hybrid and Electric Vehicles Technology Collaboration Programme and Argonne National Lab); Sonja Munnix (Netherlands Enterprise Agency); Matteo Muratori (Department of Energy, United States); Hannah Murdock (REN 21); Khac-Tiep Nguyen (GreenID Vietnam and former UNIDO); Andi Novianto (Ministry for Economic Affairs, Indonesia); Huzaimi Omar (Malaysian Green Technology and Climate Change Corporation); Maria Pedroso Ferreira (Energias de Portugal); Baldur Pétursson, Sigurður Ingi Friðleifsson, Jón Ásgeir H.
Þorvaldsson and Anna Lilja Oddsdóttir (National Energy Authority, Iceland); Dan Plechaty (ClimateWorks); Davide Puglielli (Enel), Lucija Rakocevic (Think-E); Caspar Rawles (Benchmark Mineral Intelligence); Simon Roberts (C40 Cities); Justyna Saniuk (Polish Chamber of Electromobility Development); Emanuela Sartori (Enel X), Sacha Scheffer (Ministry of Infrastructure and Water Management, the Netherlands); Matthias Schmidt (Independent consultant); Wulf-Peter Schmidt (Ford); Takayuki Shibata (Tepco Ventures); Sudhendu Jyoti Sinha (NITI Aayog); Urska Skrt (World Business Council for Sustainable Development); Daniela Soler (Ministry of Energy, Chile); Robert Spicer (BP); Jacopo Tattini (Joint Research Centre) ; Joscelyn Terrell (Office for Zero Emission Vehicles, United Kingdom); Daniel Thorsell (Norwegian Public Roads Administration); Lyle Trytten (Independent consultant); Bianka Uhrinova (Equinor); Andreas Ulbig (RWTH Aachen University); Francesco Vellucci (ENEA); Ilka von Dalwigk (InnoEnergy –
European Battery Alliance); Katerina Vardava and Thanos Zarogiannis (Hellenic Ministry of Environment and Energy); Nicholas Wagner and Yong Chen (IRENA); Michael Wang (Argonne National Laboratory) and Martina Wikström (Ministry of Infrastructure, Sweden).
This publication reflects the views of the IEA Secretariat but does not necessarily reflect those of individual IEA member countries. The IEA makes no representation or warranty, express or implied, in respect of the publication’s contents (including its completeness or accuracy) and shall not be responsible for any use of, or reliance on, the publication. Unless otherwise indicated, all material presented in figures and tables is derived from IEA data and analysis.
This publication and any map included herein are without prejudice to the status of or sovereignty over any territory, to the delimitation of international frontiers and boundaries and to the name of any territory, city or area.
IEA Publications
International Energy Agency
Website: www.iea.org
Contact information: www.iea.org/about/contact
IEA. All rights reserved.
Typeset in France by IEA – May 2022
Cover design: IEA - Photo: @GettyImages