


Healthcare
Pharma
Life Sciences
Veterinary
Social Care
Sector Insights


BARCELONA | BRUSSELS | DUSSELDORF | HAMBURG | LISBON | LONDON | MADRID | MUNICH | PARIS
HELP BUY, SELL AND CREATE VALUE IN BUSINESSES mansfieldadvisors.com
WE
4
Contents

8

Healthcare Insights
Location, location, location...
The supply-side market forces that drive location selection and the patterns created in the retail pharmacy, veterinary and private medicine sectors
Adam Scott and Ty Lantz
Roll up, roll up to HCIT investing
Private equity healthcare IT deals slowed in 2023, but add-ons have continued to grow
Adam Scott and Johan Ottosson


Pharma Insights
Female pharmaceutical gaining prominence
Examining opportunities for pharmaceuticals in women’s health
Penny Sherlock and Adam Scott
Life Science Insights
14

19

24
30

32

38

44

Quality matters - a closer inspection of the CQC
The CQC has moved to a system of more targeted inspections ‒ what are the implications for investors?
Abhishek Patel
Managed markets
Comparing the German and UK private hospital sectors
Arne Berndt and Paul Fegan
Investors show strong interest in ophthalmic product space
Deals in the surgical ophthalmic equipment and products market reached a record high in 2022, with PE backed transactions also attaining new highs
Johan Ottosson and Dr Victor Chua
Prospects for private investment in Spanish and British hospitals
Spanish and British health services are remarkably similar, but where the countries differ is the scale and scope of private hospitals
Paul Fegan and Henry Elphick
Scanning the opportunities
Increasing diagnostics capacity is key to driving down waiting times in the NHS. But despite claims of success, imaging remains surprisingly constrained
Tom Atherton and Adam Scott
NHS waiting lists - behind the headlines
Waiting lists are likely to be a key factor in the next General Election and there is renewed government focus on reducing them
Adam Scott and Ali Bahram
Is there wisdom in investing in European Dentistry?
Examining the state of dentistry across the UK and larger European countries and delving into some of the big trends affecting dentistry everywhere
Ty Lantz and Stephanie Yeung


Investing in non-theapeutic antibodies
Where are the trends in the non-therapeutic antibodies market and how can investors create value?
Victor Chua and Will Johnson
Veterinary Insights
No chicken feed
The global animal feed market is growing faster than the population at 4%. We consider the growing importance of this market
Arabella Zuckerman and Adam Scott
US veterinary consolidation - a land of opportunity
In 1987, VCA Animal Hospitals acquired its first independently owned companion animal clinic, sparking the beginning of a consolidation process
Freddie Evans and Adam Scott


Social Care Insights
Fostering - a brave new world
Where next for independent fostering agencies and yhy there is room for optimism
Paul Fegan and Henry Elphick
Breaking the cycle
We need to attract more people into social care and, importantly, retain them. What can be done to possibly transform the profession?
Paul Fegan and Ty Lantz
Leading the way
When it comes to care home construction in England, who is building what, where and for whom?
Johan Ottosson and Henry Elphick
48
52
58
64
69
75
79
Sector Insights | 3 To keep up to date with Mansfield Advisor's Insight features visit www.mansfieldadvisors.com/insights/


Every sector in health and care has its own nuances. However, in all of them, location is critical all the way down from the broad national level to individual site selection. Regarding site selection, when speaking to a real estate advisor, one might hear ‘many things matter and the first three are location, location, and location’. But, at Mansfield, we are strategy advisors so what does it mean to be strategic about site selection for healthcare businesses?
The topic comes up in several contexts:
• Market entry which are the best markets to enter, and where within a market should one operate?
• Portfolio analysis how can we optimally meet the needs of our customers? How are individual sites performing relative to the suitability of their locations? Which sites should be combined or split?
• Mergers and acquisitions how do two companies fit together? Are the locations complementary or is there risk of cannibalisation? Should the merged portfolio be rationalised?
Location, location, location…
• Roll-up runway what are the limiting factors of consolidation? How much further can the industry or any individual company go?
In healthcare services, location selection typically hinges on four dimensions: supply, demand, funding, and access to staff. The importance and scope of each varies by sub-sector, and many industry veterans will have an intuition for finding good locations, but often the interaction of variables is complex.
For example, care home operators targeting the private-pay market might locate in affluent areas with an aging population, but staff costs can be 60% or more of revenue and many workers rely on public transportation. Care homes with few nearby transit links can go understaffed, become reliant on locum workers, and fall out of profitability quickly.
We recently encountered a care home positioned a 10-minute walk up a steep hill from the nearest bus station. This walk was so troublesome that the operator had tried hiring a private driver and aligning shifts with the bus schedule, and they eventually bought a van to shuttle employees to and from the station. The lesson is,
in care homes, access to staff is so key to profitability that well-connected homes near the boundaries between affluent and less-affluent areas often perform best.
One can develop heuristics like this via long years in industry, by speaking with experts, or via examining large portfolios to discover what works. However, even the savvy industry vet can learn something from intense data interrogation, and the application of geographical and social sciences, and advances in computing allow us to explain and discover location phenomena that drive access to care and sustainable growth.
Forces
Imagine a sunny Spanish beach in Menorca or Ibiza (you decide). The beach is butted on both ends by cliffs, and a boardwalk runs parallel to the sea. Two entrepreneurs, who are competitors, decide to sell sunscreen from rolling carts to the beachgoers who are distributed evenly along the beach. The competitors are the only sellers on the beach. Where do they choose to put their carts?
In the simplest case, if they both position themselves equidistant from the
4 | Sector Insights Healthcare Insights
Adam Scott and Ty Lantz explore some of the supply-side market forces that drive location selection and the patterns that they create in the retail pharmacy, veterinary, and private medicine sectors
ends, anywhere along the beach, they share the market evenly. Regardless of the initial configuration, eventually one of the sellers will realise that moving either toward the other or the centre will gain him or her incremental market share. The other seller will react in turn by moving similarly, and so it goes until the carts are next to one another at the midpoint.
Once there, the sellers reach a state of a Nash equilibrium, named after the mathematician John Nash, in which a unilateral move away from the midpoint would cost the mover market share. This scenario is described by Hotelling’s law and is one of the reasons you might see competitors like Starbucks and Pret a Manger sharing street corners.
Now imagine the beach is very long and the tourists prefer not to walk long distances for sunscreen. If the sellers recognise that the tourists bear search costs, a different configuration will arise.
The carts will distance themselves, and each seller will be able to charge a premium up to the cost a tourist bears by walking all the way to the other cart. If the sellers get particularly wise, they may also realise that they can further change the ‘distance’ to the next cart by offering differentiated products. In this case, a buyer’s preference for a product may offset some of the burden of a far walk and win the seller with preferred products additional share. This phenomenon was first discussed by economists Edward Hastings Chamberlin and Joan Robinson and is known as monopolistic competition because the sellers remain in competition despite having small local monopolies.
One may experience this market force when comparing prices between corner stores and supermarkets. In most cases, a shopper chooses the corner store for convenience so shop owners charge inflated prices for late-night snacks.
Let’s add yet another kernel of reality to the situation: imagine the sellers bear greater transportation and delivery costs the further they distance themselves from the beach access point. With this constraint, the sellers would place themselves at the points that balance the benefits and costs of distance. If the costs are significant, the sellers may end up next to each other once more. The sellers may even benefit from overall lower delivery costs because the other is nearby. In the field of urban economics, this network effect is called the agglomeration effect,
which posits that businesses can profit from returns to scale not only as a single competitor grows but also as an industry within a region scales – perhaps without any single competitor growing.
In the classical theory, the benefits come from transportation costs, labour availability, and knowledge distribution. As a knock-on effect of agglomeration, some regions become famous for particular goods or services and companies can benefit from the signalling they are there. Examples include old-world tailors on Savile Row in London and new-world tech companies in Silicon Valley.
IN MOST CASES, A SHOPPER CHOOSES THE CORNER STORE FOR CONVENIENCE SO SHOP OWNERS CHARGE INFLATED PRICES FOR LATE-NIGHT SNACKS
Thinking more broadly about network effects in location strategy, one may also consider the presence of participants in other industries. For instance, restaurants, coffee shops, and clothing retailers thrive in areas with high foot traffic and are often seen together because they benefit from the presence of customers drawn by the other types of stores.
So how does this work in real-life healthcare sectors?
Patterns
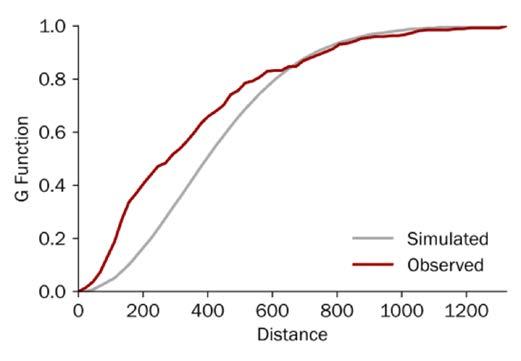
In the accompanying figures we examine the distribution of competitors in three healthcare industries, retail pharmacy, veterinary, and private medicine across a portion of London.
In the cases of veterinary clinics (see Figure Two) and private medical offices (see Figure Three), a visual inspection of each map can provide some quick insights. However, in the case of retail pharmacies (see Figure One), the pattern is more ambiguous.
In general, humans are surprisingly bad at discerning patterns from randomness,1 so we lean on statistical approaches to identify and measure patterns. In this case, we use an analysis called Ripley’s G, which allows us to measure the level of clustering or dispersion for a range of sizes of ‘neighbourhood’ by measuring the proportion of locations whose nearest neighbour (think competitor) is within a given range. We then compare the observed distribution with a set of simulated random patterns: observed curves above the simulated curve exhibit clustering and curves below the simulated curve exhibit dispersion.
Retail pharmacies
Retail pharmacy is a relatively undifferentiated industry, so the sector mostly follows Hotelling’s Law: chemists are often best off on high streets, where there is the most foot traffic, and they split the local market with co-located competitors. While the distribution of pharmacies around London may visually appear random, nearly all have a competitor within a very short walking distance (see Figure One).
The line graph demonstrates that chemists are more often very close to one another than they would be under a random process (c.40% have another store within 200m), so the industry is exhibiting Hotelling-like features.
Chemists are primarily fixed cost businesses, and sites can usually move within a few hundred metres without a change of license, so being subtle about exactly where the pharmacy is on the high street can be quite impactful.
Furthermore, because competitors are piled onto the same street, there is opportunity to extend the ‘virtual distance’ by investing in the environment or improving the service level to lure customers the
Sector Insights | 5
RETAIL PHARMACIES

50 metres past competitors to a nicer experience.
Revisiting the chart, interestingly, the observed distribution mimics the random one in some cases, which indicates that there are some pharmacies that unexpectedly sit further apart from others. These more isolated locations may be on quieter streets with differentiated offerings, or they may be on streets with a supply/demand mismatch.
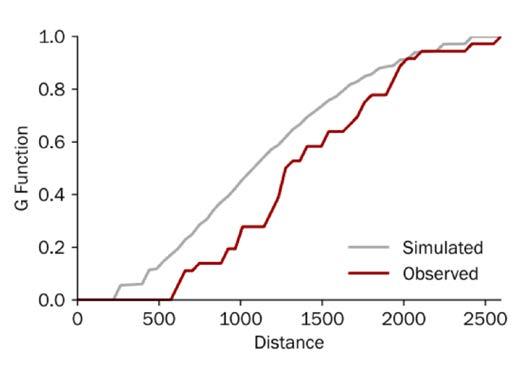
Veterinary clinics
In contrast to pharmacies, and the simulated distribution, veterinary practices are particularly dispersed (see Figure Two). In fact, in this region, no first-opinion practice has another one within 575
VETERINARY CLINICS
metre as the crow flies, an approximately 12-minute walk.
In our own research, we found that proximity is the number one reason for choosing a first-opinion clinic and it ranked well above perceived value, which means that customers want convenience, and the market is likely exhibiting monopolistic competition.
Importantly, this does not mean that veterinarians are exerting excess market power, it just means that customers are willing to pay for convenience and for many customers their nearest practice is a bit closer than others. On the contrary, we have also found that pet owners are perfectly willing to travel for differentiated services, for instance specialist care.

On the other hand, one could also argue that general practice vets are distributed in urban areas because the purchasing decision is driven so much by proximity, the distances people are willing to travel are small, and the population density is generally low enough that there is only enough demand to support one practice within the range that pet owners are willing to travel. In either case, we primarily find veterinary clinics on quiet residential streets because vet clinics are actually damaged by an over-abundance of nearby activity – no one wants to walk their sick puppy through a crowded street – which is why there are no practices in the busiest parts of town (the gap near the centre and bottom of the map).
6 | Sector Insights Healthcare Insights
SOURCE MANSFIELD ANALYSIS
FIGURE ONE
FIGURE TWO
SOURCE MANSFIELD ANALYSIS

Now that we know the typical distribution of practices, we can programmatically scour similar areas around the country to identify gaps in supply that could be attractive places to build new practices.
While dispersion among veterinary clinics benefits many pet owners, dispersion among hospitals would benefit much of society.
Emergency care is, tautologically, urgent, and universal access is in the mandate of state-sponsored care. However, as one can discern from cursory analysis of NHS Acute Trust catchment populations, services are not optimally located, and this is due to the constraints of the built environment.
Veterinarians can open, close, and move clinics with ease, which allows market forces to promote an optimal configuration, but hospitals are huge and have important infrastructure requirements, which makes their location subject to path dependence, and the equality of an arrangement of services erodes as people and needs move.
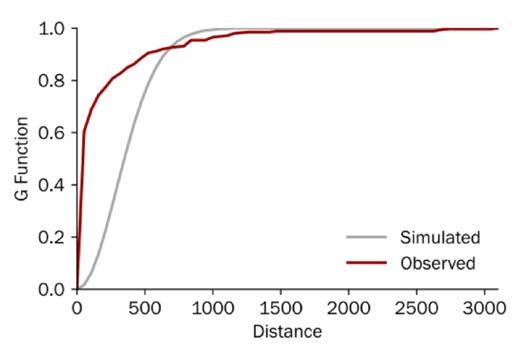
Private medical offices
Finally, private medical practices are intensely clustered, mostly around Harley Street, which has been a hub for private practitioners since the end of the 19th century.
In earlier years, the benefits of the agglomeration effect (knowledge sharing and so on) were likely more powerful than they
BUILDING MODELS THAT EFFECTIVELY EVALUATE WHETHER A LOCATION IS SUITABLE FOR A BUSINESS IS BOTH A COMMERCIAL AND ACADEMIC PROCESS
are today, but most practices on Harley Street are single-specialty or few-specialty groups and they benefit from the ability to refer patients to nearby practices.
Probably the greatest benefit of being on Harley Street today is the economic signal: most people in London assume that the best private doctors practice there. In addition to hefty lease payments, Harley Street doctors garner prestige from their choice of location.
Economics professors would argue that much of the signal comes from the high rents – the ability to afford the space means those doctors must create significant value for their patients. Anyone wanting to establish a premium brand would struggle to find a better place than Harley Street for a flagship clinic. Moving up a level, spontaneously creating these types of networks is very difficult, but local government, property estates, and landlords play a very important role in either limiting or fostering their development.
So, where next?
We have examined some phenomena and how we measure them, and you might be thinking this is all a bit academic. But building models that effectively evaluate whether a location is suitable for a business is both a commercial and an academic process. Much like in the beach example, we iteratively layer-in reality and theory and then test outputs using statistical methods. This requires deep understanding of how a market works, what makes a location good for a particular business, and the academic approaches to identify and quantify market opportunities.
NOTES
1 Williams, Joseph Jay and Thomas L. Griffiths. Why are People Bad at Detecting Randomness? Because it is Hard. (2008), princeton.edu.
Sector Insights | 7
SOURCE MANSFIELD ANALYSIS
THREE
MEDICAL OFFICES
FIGURE
PRIVATE


Roll-up, roll-up to HCIT investing
Riding the Covid-19 wave, PE healthcare IT (HCIT) deals, including buyouts, add-ons, and growth investments, grew by a record CAGR of 18.6% between 2019 and 2021. That level of exuberance has slowed in 2023, but the run-rate for addons continues to grow and this year is set to become the second most active for such transactions in the past decade.
Recent deals have included CVC Capital Partners’ acquisition of UK-based System C Healthcare and its partner company Graphnet Health in 2021 (HCIT systems and services), ARCHIMED’s acquisition of Italy-based Cardioline in 2021 (cardiology diagnostics and cardiology-focused telemedicine), and Hg and TA Associates backed The Access Group acquisition of UK-based Servelec in 2021 (provider of healthcare and case management software, which the previous month had acquired Elemental, the most widely used digital social prescribing platform in the UK and Ireland).
We believe the HCIT space offers an attractive theme for investors combining defensive (healthcare) with growth assets (tech) and offering strong customer stickiness and attractive recurring revenue streams. We forecast the market to grow, driven by system pressures and new models of care delivery, underpenetrated markets, and strong public funding tailwinds.
Investors should focus on rolling-up solutions that are geared towards clearly defined and prioritised problems that can easily integrate into existing HCIT landscapes, and that offer high security standards. To pick the right assets, investors will need to really understand the clinical and patient models of markets in which target assets operate.
Broad landscape
There is an ever-increasing number of digital health solutions, also covering apps and wearables, but we will focus on second generation technology in the care provider setting as this is a more mature market and hence more relevant for private equity (PE) investors. These assets include solutions for decision/risk analysis, enterprise system management, Electronic Health Records/Electronic Patient Records (EHR/EPR), outcome management, telehealth solutions, and other related HCIT services (see Figure One).
Grand View Research valued the European digital health market at US$45.3bn in 2022, expecting it to grow at a CAGR of 16.0% from 2023 to reach US$148.5bn by 2030.1
In the UK, LaingBuisson estimates that HCIT spend in 2020 was £5bn (US$6.33bn), of which c.33% went on clinical systems, c.30% to staffing and workforce, c.20% on infrastructure spending (e.g. hardware, networks), c.15% went on non-clinical systems (e.g. HR, finance, governance), and c.2% on so-called third generation technology (e.g. apps, patient facing services).2
Three players dominate the UK market with a combined c.40% to c.60% of the Electronic Prescribing and Medicines Administration (ePMA), EHR/EPR, and Patient Administration Systems (PAS) markets: Italy-based Dedalus (backed by Ardian), US-based Cerner (acquired by Oracle in 2022), and UK-based System C (backed by CVC Capital Partners). These markets differ slightly, however, in terms of exact make-up and who leads.
Remaining larger players in these markets tend to be US-based, and often listed. UK-based and privately held Nervecentre is a notable exception in the UK EHR/EPR market - the company has recently been chosen as the preferred
supplier for a new joint EPR system by two Derbyshire trusts.3
Some trusts have also constructed their own EHR/EPRs (c.8.3% or the market in England in 2022) and 10% of acute Trusts in England lack an EHR/EPR altogether. Further, c.30% lack an ePMA system, and c.50% lack a digital document management system.4,5,6
Record growth in Europe during pandemic
PE HCIT deals in Europe grew by a record CAGR of 18.6% between 2019 and 2021 (see Figure Two) and grew faster than PE deals overall (4.3% CAGR). HCIT deals as a percentage of the total also reached alltime highs of 1.5% in 2021 and 2022, and 1.6% in (year-to-date) 2023.
Although there has been a slowdown in the number of completed deals in the first three quarters of 2023 (see Figure Three), reaching its lowest point since Q3 2020. The current year is still positioned to be a strong year for HCIT.
For HCIT companies relying heavily on growth, inflation can diminish the value of future returns, especially for companies with lower pricing power. Inflation, coupled with a high interest rate environment impacting investor willingness to pay, has resulted in a decrease in both buyout and growth investment deals. Hence, Livingbridge’s investment in T-Pro (AI-powered speech technology and clinical documentation solutions) is the only growth investment in 2023 YTD. This is compared to five growth deals in 2022 and 2020, and three in 2021.
Add-ons have also been impacted, with the number of deals falling both in Q2 and Q3 this year, but these transactions remain at similar levels per quarter as registered in 2022.
8 | Sector Insights Healthcare Insights
in 2023,
Private
equity healthcare IT deals slowed
but add-ons continued to grow, say Adam Scott and Johan Ottosson, who look at the rationale for investing in the sector
FIGURE ONE THE HEALTHCARE IT LANDSCAPE IN CARE PROVISION SETTINGS
Article focus
Setting

Main industry specific systems (nonexhaustive)
Supporting industry agnostic systems
Care provider Setting
Clinical systems
• Screening and diagnostics
• Telehealth
• Electronic Patient Records Systems (EPR/EMR/EHR)
• Picture Archive and Communication System (PACS), and Radiology Information System (RIS)
• Electronic Prescribing and Medicines Administration (ePMA)
• Patient Administration Systems (PAS)
Non-clinical systems
• Workforce management
• Facilities and supply chain management
• Regulatory and legal
• Contract management


Homecare setting
Communication and patient engagement systems
• Patient portals
• Referral pathways
Platform and infrastructure
Analytics
Other support systems
Remote and self-care systems
• Apps
• ‘Doctor on demand’ services
• Home monitoring
• Social prescribing
Run-rating all deals in 2023, this year is still positioned to be the third most active for PE HCIT deals since 2014 illustrating that investor interest remains strong.
The UK: Europe’s largest HCIT deal market
Some 29.3% of all PE HCIT deals since 2014 have involved British assets, making it the most active market in Europe. The UK is followed by Germany (16.6%), and the Netherlands (12.7%)
Recent PE buyouts of UK HCIT assets include CVC Capital Partners’ acquisition of System C in 2021, Ardian backed Dedalus’ acquisition of swiftQueue Technologies in 2021 (healthcare appointment and patient engagement solutions), and Livingbridge’s acquisition of Nourish Care Systems in 2022 (digital care planning software).
Investor landscape consolidating
The investor landscape is very fragmented, with c.66% of HCIT investors having only completed one deal, and c. 18% only two deals in the past decade.7
There have, however, been examples of PE asset roll-ups, with HCIT add-ons growing more than both buyouts and growth investments in the past ten years. A prominent example is RLDatix, a UK-based company that develops and supplies risk management and patient safety software (see Figure Six).
Since TA Associates invested in RLDatix in 2018, joining existing investor Five Arrows Principal Investments, the software company has proceeded to roll up multiple other healthcare software businesses in the UK and the USA. These include Verge Solutions in 2020 (credentialing software), Allocate in 2021 (human capital management solutions), and
Galen Healthcare Solutions in 2022 (implementation, optimisation, data migration and archival solutions for HCIT systems provider).
Another example is Ardian backed Dedalus, which acquired Agfa HealthCare’s IT business in 2019 (healthcare information solutions and integrated care activities) as well as Dosing GmbH (SaaS medication safety solutions) and swiftQueue Technologies, both in 2021.
HCIT roll-ups makes sense to investors as it represents a shortcut to expanding an asset’s offering; it can offer salesforce synergies and economies of scale.
According to Martin Bell, a former board CIO in the NHS, the former deputy MD of EMIS Health, and the author of the LaingBuisson Digital Health UK market report, private equity is particularly well suited for these roll-up plays.
‘Especially medium to large sized companies can benefit from PE roll-ups. These companies often have quite a few bits
Sector Insights | 9
SYSTEMS WILL EXIST ACROSS ALL CARE SETTINGS. MAPPING EXCLUDES PHARMA, MEDTECH, GOVERNMENT AND RESEARCH
MANSFIELD ANALYSIS
NOTE NOT ALL
SOURCE
B2B
HEALTHCARE IT LANDSCAPE TARGETING THE CARE PROVIDER SETTING COVERS A BROAD RANGE
SERVICE
B2B2C THE
OF
FIGURE TWO GLOBAL PE HEALTHCARE IT DEALS ‒ ANNUAL
AFTER A SHARP INCREASE IN PE HEALTHCARE IT DEALS POST-COVID WE ARE NOW SEEING A SLOWDOWN NUMBER OF COMPLETED DEALS, EUROPE, 2014‒2023 YTD

WE ARE SEEING A STEADY DECLINE IN THE FIRST THREE QUARTERS OF 2023 NUMBER OF COMPLETED DEALS, EUROPE, PER QUARTER YTD
10 | Sector Insights Healthcare Insights NOTE HEALTHCARE IT ASSETS ARE DEFINED AS COMPANIES ENGAGED IN PROVIDING SOFTWARE OR TECHNOLOGY PLATFORMS TO THE HEALTHCARE INDUSTRY. THESE INCLUDE SOLUTIONS FOR DECISION/RISK ANALYSIS, ENTERPRISE SYSTEM MANAGEMENT, MEDICAL RECORD SYSTEM MANAGEMENT, OUTCOME MANAGEMENT, AND OTHER RELATED HEALTHCARE INFORMATION TECHNOLOGY SERVICES. 2023E RUN RATE SOURCE PREQIN – DATA UNTIL 30 SEPTEMBER 2023, MANSFIELD RESEARCH AND ANALYSIS 12 8 10 10 14 11 5 17 16 9 1 4 5 5 10 5 3 5 2 7 7 11 23 14 17 0 5 10 15 20 25 30 35 40 45 15 12 19 16 26 21 ‘14 43 35 27 2 1 ‘15 ‘16 1 ‘17 ‘18 ‘19 ‘20 ‘21 ‘22 ‘23E 21 Total CAGR ’14-’19 38.0% -1.7% 7.0% ’19-’22 ’19-’23E Buyout PE deals total across all industries Growth Add-on Run rate PE Healthcare IT deals as % of total deals 1.6% 1.5% 1.5% 1.0% 1.0% 1.1% 0.7% 1.0% 0.7% 1.0% -100% 14.7% -4.0% 7.5% N/A 11.9% 13.3% 18.6% N/A Covid-19
6 1 2 2 4 1 1 3 5 5 1 6 5 6 3 2 2 2 3 6 4 2 1 3 5 1 2 6 4 3 4 1 1 7 1 2 1 5 8 5 2 3 4 ‘19 Q2 ‘19 Q3 ‘19 Q4 ‘20 Q1 ‘20 Q2 ‘20 Q3 ‘20 Q4 ‘21 Q1 ‘21 Q2 ‘21 Q3 ‘21 Q4 ‘22 Q1 ‘22 Q2 ‘22 Q3 ‘22 Q4 ‘23 Q1 ‘23 Q2 ‘19 Q1 8 6 6 3 4 8 11 15 7 10 13 10 6 6 9 7 5 ‘23 Q3 Buyout Growth Add-on
FIGURE THREE GLOBAL PE HEALTHCARE IT DEALS ‒ QUARTERLY
missing that can’t be filled by third parties who may or may not be out there. It makes the cost of operations, partnerships, delivery operations so much higher. The ability to acquire add-ons and integrate them is what PE is good at. It’s a consolidation play.’
Conversely, some providers may be too small to succeed on their own ‒ for instance lacking the salesforce or capabilities needed to compete in larger tenders ‒ and will therefore benefit from the scale offered by a consolidator.
Profitable drivers to fuel growth
System pressures and new models
Demographic changes and staff shortages have led to significant pressures on healthcare systems, which have often been made worse by the pandemic and subsequent backlogs. Care providers therefore need to find efficiencies, something that digitalisation can offer.
Models of care delivery are also changing, and patients will have a growing want and need for data accessibility to support care provision outside of, but linked to, a hospital setting.
Consequently, the volume of healthcare data has been growing rapidly, with RBC Capital Markets projecting a CAGR of 36% in global healthcare data until 2025.8 With increasing volumes, however, there is a greater need to store, transfer, and process this data. Here HCIT solutions play an important role.
Underpenetrated markets
The percentage of clinicians using digital technologies varies significantly between European countries. In a 2020 Deloitte survey, 97% of Dutch clinicians reported using EHRs, versus 77% of German clinicians, and 69% of Italian clinicians. Similarly, digital prescription was used by 97% of Dutch clinicians, versus 73% or Danish clinicians, and only 13% of German clinicians.9 Further, 10% of acute Trusts in England lack an EPR, and 30% lack an ePMA system.10
These disparities should provide significant headroom for HCIT companies to grow.
Funding tailwinds across Europe
As the largest healthcare market outside of the US, Germany launched The German Hospital Future Act (KHZG) in 2020, making €4.3bn in funding available for investments into patient portals, electronic documentation of care and treatment services, digital medication management, and the introduction or improvement of telemedicine.11
In France, the Ségurdudigitalensanté programme, also launched in 2020, includes a €2bn (US$2.18bn) investment into development of digital health. The programme’s objective is to ensure the smooth and secure exchange of health data between health professionals and users.12
At the European level, the EU has committed €1bn towards digitalising healthcare over the coming seven years. This includes the creation of the European Health Data Space (EHDS), which among

Sector Insights | 11
NOTE HEALTHCARE IT ASSETS ARE DEFINED AS COMPANIES ENGAGED IN PROVIDING SOFTWARE OR TECHNOLOGY PLATFORMS TO THE HEALTHCARE INDUSTRY. THESE INCLUDE SOLUTIONS FOR DECISION/RISK ANALYSIS, ENTERPRISE SYSTEM MANAGEMENT, MEDICAL RECORD SYSTEM MANAGEMENT, OUTCOME MANAGEMENT, AND OTHER RELATED HEALTHCARE INFORMATION TECHNOLOGY SERVICES. 2023E RUN RATE SOURCE PREQIN – DATA UNTIL 30 SEPTEMBER 2023, MANSFIELD RESEARCH AND ANALYSIS 3 6 5 7 8 6 16 12 2 1 1 7 4 3 6 7 5 3 1 5 1 4 3 8 2 2 3 1 2 2 3 2 2 4 3 1 1 1 2 1 1 2 1 1 3 3 8 4 8 6 7 11 8 ‘14 ‘15 2 ‘16 2 ‘18 ‘21 2 2 ‘19 ‘22 2 ‘20 ‘17 ‘23 YTD 15 12 19 16 26 21 21 43 35 21 Covid-19 29 3% 16.6% 12 7% 10 5% 26 2% 4 8% UK Germany Netherlands France Spain
UK BASED ASSETS ARE THE MOST TRADED ONES NUMBER OF COMPLETED DEALS, EUROPE, 2014-2023 YTD FIGURE FOUR TARGET COUNTRIES
Other UK Germany Netherlands France Spain Other
THE INVESTOR LANDSCAPE IS FRAGMENTED, WITH c.66% OF HCIT INVESTORS HAVING ONLY COMPLETED ONE DEAL NUMBER OF COMPLETED DEALS, EUROPE, 2014-2023 YTD
Acc. Deals
other things, aims to digitise all medical records in the bloc by 2025, making it easier for individuals to access and share their data with medical professionals, particularly when in another EU country.13,14
In England, the Frontline Digitisation programme, launched by NHS England (NHSE) and the government in 2021, set a target that 90% of acute NHS trusts would have EPRs by December 2023. This was achieved in mid-November 2023. The remainder are to follow by March 2025.15,16,17,18
However, a NHSE guidance letter sent to trusts in November 2023 suggested that parts of the Frontline Digitisation programme could be pulled from all but the least digitised trusts to counter the impact of strike action. The programme had already been reduced from £2.6bn to £2bn in FY23.19
Funding will likely remain one of the key growth challenges in England. Hence, although 2020 digital health spending represented on average c.2% of NHS Acute Trust turnover (up from the c.1.4% a decade ago), this is significantly below, for instance, the Nordics at an estimated c.6‒8%.20
Focus for investors
Clearly defined and prioritised problems
For HCIT solutions to be attractive investments, they need to be geared towards clearly defined problems, and ideally, should prove either substantial risk mitigation or improved patient outcome, improved efficiency and cost reduction, revenue increase (preferably in-year if targeting public sector clients), and/or enhanced clinician experience.
Solving a problem is not enough, however, as healthcare providers will often have constrained budgets and will need to prioritise their spending.
‘If you’re selling something that has ringfenced specific funding, and if it’s really fixing an urgent thing, then you can get traction,’ says Bell.
Further, solutions, unless stand-alone, also need to easily integrate into the end users’ existing technology landscape, the broader organisational structure and ecosystem, and existing care pathways (both digital and physical).
Finally, solutions need to have high security standards (both cyber security and patient data compliance).
Proven growth track record
Healthcare providers are typically risk averse when it comes to changing systems and will want to see robust evidence of safety and efficacy before adopting a new system; changing systems requires a lot of effort in what are often strained organisations.
‘The reason for stickiness is multifactorial,’ says Bell. ‘One of the biggest things is the amount of effort required - write a business case and go through procurement - while you have so many other priorities as a healthcare provider.’
This slow pace of technological adoption and long sales cycles/adoption means that investors sometimes find it hard to validate returns. Companies with a track-record of growth ‒ by either displacing competition or growing accounts ‒ and that have long customer relationships and can show surviving evaluation cycles, should provide attractive targets for HCIT investors.
Roll-up recommendation
Roll-ups enable investors to rapidly build their capabilities: gaining clear salesforce synergies and the possibility to provide scale to smaller assets.
Investors must consider the local conditions of markets in which the target assets operate. This includes understanding diverse and often fragmented commissioning landscapes, regulatory variations by region and country, clinical and patient models (such as patient access to care and patient pathways), interoperability challenges, and privacy and data security concerns (mainly regulatory limitations, but sometimes also cultural perceptions). Though not all these challenges will be specific to HCIT, these can significantly limit the scalability of HCIT.
Conclusion
There has been a lot of investor interest in the HCIT space in recent years, and we expect that to continue.
Favourable market drivers and strong funding tailwinds, coupled by underpenetrated markets leaving headroom for growth, make the HCIT space an attractive theme for investors. Interested investors should focus their attention on solutions geared towards clearly defined, and prioritised problems, and roll up assets with a proven track record of growth.
12 | Sector Insights Healthcare Insights
ANALYSIS 4 deals 6 deals 2 deals 50% % of total deals # of deals 100%
of deals per investor
SOURCE
PREQIN – DATA UNTIL 30 SEPTEMBER 2023, MANSFIELD RESEARCH AND
Number
FIGURE FIVE HEALTHCARE IT DEALS INVESTORS
FIGURE SIX
RLDATIX HAS ROLLED UP MULTIPLE HCIT COMPANIES IN THE UK AND US CASE


SELECTION TA Associates invests in Datix Five Arrows Principal Investments, an existing investor, maintains a significant equity stake in Datix Datix acquires RL Solutions, a provider of healthcare quality and patient safety software and rebrands to RLDatix
RLDatix acquires Verge Health, a US based provider of credentialing software for healthcare sector
NOTE 2018 2018 2020 2021

RLDatix based provider of contract management solutions for healthcare, insurance, life sciences and other industries RLDatix acquires Galen Healthcare Solutions, a US-based implementation, optimisation, data migration and archival solutions for HIT systems provider
2022 2021

NOTES
1 Grand View Research - Europe Digital Health Market Size, Share & Trends Analysis Report By Technology (Tele-healthcare, mHealth, Healthcare Analytics, Digital Health Systems), By Component, By Region, And Segment Forecasts, 2023‒2030 - Press release
2 Digital Health UK market report – third edition, LaingBuisson
3 DigitalHealth.Net (3 November 2023): Two Derbyshire trusts pick Nervecentre as preferred supplier for joint EPR. Available at: https:// www.digitalhealth.net/2023/11/two-derbyshire-trusts-pick-nervecentre-as-preferredsupplier-for-joint-epr/#:c. :text=for%20joint%20 EPR-,Two%20Derbyshire%20trusts%20 pick%20Nervecentre%20as%20preferred%20 supplier%20for%20joint,patient%20record%20 (EPR)%20system. (accessed 27 November 2023)
4 Digital Health UK market report – third edition, LaingBuisson
5 Mansfield interview
6 NHS Digital (16 November 2023): 90% of NHS trusts now have electronic patient records. Available at: https://digital.nhs.uk/ news/2023/90-of-nhs-trusts-now-have-electronic-patient-records (accessed 21 November 2023)
7 Preqin
8 RBC Capital Markets: The healthcare data explosion. Available at: https://www.rbccm. com/en/gib/healthcare/episode/the_healthcare_data_explosion#:c. :text=Today%2C%20

ONLY SOURCE PREQIN – DATA UNTIL 30 SEPTEMBER 2023, MANSFIELD RESEARCH RLDatix acquires Allocate Software, a UK based provider of human capital management solutions for the healthcare sector
approximately%2030%25%20of%20the,for%20healthcare%20will%20reach%20 36%25.https://emerj.com/ai-sector-overviews/ where-healthcares-big-data-actually-comesfrom/ (accessed 20 November 2023)
9 Deloitte (September 2020): Digital transformation: Shaping the future of European Healthcare. Available at: https://www2.deloitte. com/content/dam/Deloitte/uk/Documents/lifesciences-health-care/deloitte-uk-shaping-thefuture-of-european-healthcare.pdf (accessed 16 November 2023)
10 Digital Health UK market report – third edition, LaingBuisson
11 Healthcare IT News (22 September 2020): German hospitals to get €3 billion funding boost for digitalisation. Available at: https:// www.healthcareitnews.com/news/emea/german-hospitals-get-3-billion-funding-boost-digitalisation (accessed 20 November 2023)
12 Ministry of Solidarites and Health (Ministère de la Santé et de la Prévention): Le Ségur du numérique en santé. Available at: https:// esante.gouv.fr/segur (accessed 16 November 2023)
13 Healthcare IT News (8 June 2023): European healthcare digitalisation at inflection point. Available at: https://www.healthcareitnews. com/news/emea/european-healthcare-digitalisation-inflection-point (accessed 16 November 2023)
14 European Commission: European Health Data Space. Available at: https://health. ec.europa.eu/ehealth-digital-health-and-care/

european-health-data-space_en (accessed 17 November 2023)
15 NHS England: Digitising the frontline. Available at: https://transform.england.nhs.uk/ digitise-connect-transform/digitising-the-frontline/ (accessed 21 November 2023)
16 NHS South, Central and West (SCW): Frontline digitisation programme supports ambitious Electronic Patient Records targets. Available at: https://www.scwcsu.nhs.uk/case-studies/ frontline-digitisation-programme-supports-ambitious-electronic-patient-records-targets (accessed 21 November 2023)
17 NHS Digital (16 November 2023): 90% of NHS trusts now have electronic patient records. Available at: https://digital.nhs.uk/ news/2023/90-of-nhs-trusts-now-have-electronic-patient-records (accessed 21 November 2023)
18 DigitalHealth.Net (25 July 2023): EPR frontline digitisation target declared ‘unachievable’. Available at: https://www.digitalhealth. net/2023/07/epr-frontline-digitisation-target-declared-unachievable/ (accessed 21 November 2023)
19 DigitalHealth.Net (15 November 2023): Frontline digitisation funds at risk to cover industrial action costs. Available at: https:// www.digitalhealth.net/2023/11/frontline-digitisation-funds-diverted-to-cover-industrial-action-costs/ (accessed 21 November 2023)
Sector Insights | 13
OF ACQUISITIONS
20 Digital Health UK market report – third edition, LaingBuisson AND ANALYSIS
EXAMPLE - RLDATIX ACQUISITIONS
The CQC has moved to a system of more targeted inspections, designed to help accelerate improvement where it is most needed, but that can mean long gaps between inspections for the best performing facilities.
Abhishek Patel takes a deep dive into the impact of the changes on acute and mental health hospitals and discusses the implications for investors


AQuality matters a closer inspection of the CQC
t the forefront of any investor’s key priorities when assessing providers in health and adult social care, must be the topic of quality. Acquire a poor-quality service, and significant management time and resource will be required to turn things around; conversely, a good-quality service will be more profitable and more valuable.
In England all health and adult social care services are independently regulated by the Care Quality Commission (CQC), an arm’s length body of the Department of Health and Social Care which monitors and inspects sites and publishes quality reports with a simple 4-point rating scale (outstanding, good, requires improvement, inadequate). Other parts of the UK have equivalent independent regulatory bodies – Health Inspectorate Wales, the Care Inspectorate and Healthcare Improvement Scotland, and The Regulation and Quality Improvement Authority in Northern Ireland.
But while these reports provide a useful site-level proxy for quality, they mask the nuances behind ratings at a sub-sector and provider type level and are ultimately a ‘snapshot in time’ – the periods between inspections can be long and a lot can change. As a result, careful expert diligence is required to truly understand a provider’s real quality and their outlook.
This article analyses some key operational metrics for the CQC over the last five years, before taking a deep-dive into acute and mental health hospitals.
A brief background to the CQC
The CQC was established in 2009 to independently regulate all health and adult social care services in England, thereby consolidating its three predecessor organisations (the Healthcare Commission, the Commission for Social Care Inspection and the Mental Health Act Commission). Its primary aim is to ensure all services provide people with safe, effective, compassionate, high-quality care. More specifically, its key roles are to (1) register all health and adult social care providers; (2) monitor and inspect services to ensure they are safe, effective, caring, responsive and well-led, and subsequently publish quality ratings; (3) enforce changes through legal action when poor care is identified.
Ian Trenholm was appointed CEO in August 2018, taking over from Sir David Behan who had been in post since 2012. Whereas Behan had a strong social care background prior to joining the CQC, with executive positions at the Commission for Social Care Inspection and the Department of Health, Trenholm started his career as an Inspector in the Royal Hong Kong Police Service. He subsequently held executive positions at NHS Blood and Transplant, the Department of Environment Food and Rural Affairs (Defra), and the Royal Borough of Windsor and Maidenhead before joining the CQC. Under his leadership, the CQC has weathered the storm of Covid-19 which caused significant disruption to inspection activity, and
has moved towards a risk-based ratings approach where struggling providers are prioritised to drive improvement. In tone, the CQC is seen as moving from a more collaborative regulator seeking to help providers improve performance to a more proactive and assertive regulator, looking to prosecute more poor providers.
In 2021, the CQC set out four strategic priorities:
1. People and communities focus on the experience of people and what is important to them when they access, use and move between services
2. Smarter regulation provide up-todate and high-quality information and ratings, simplify interactions and ensure responses are more proportionate
3. Safety through learning prioritise learning and improvement to ensure stronger safety cultures
4. Accelerating improvement empower systems to improve quality of care where it is needed most
But how does this reflect in the numbers, and have we seen a change in activity since Trenholm’s appointment as CEO in 2018? We analysed some of the key operational metrics to understand how the CQC’s recent activity stacks up against its funding and resources.
14 | Sector Insights Healthcare Insights
FIGURE ONE
CQC INCOME AND EXPENDITURE
THE CQC RECEIVES c.50% OF ITS INCOME FROM INDEPENDENT SECTOR PROVIDERS
NOTES FINANCIAL YEARS END 31 MARCH 1 THIS CONSTITUTES c.90% OF TOTAL CQC REVENUE; THE REMAINDER IS MOSTLY DHSC-PROVIDED GRANT-IN-AID FUNDING 2 INCLUDES HOSPITALS, COMMUNITY, SINGLE SPECIALTY AND DENTISTS 3 INCLUDES ENFORCEMENT, INDEPENDENT VOICE AND OTHER ACTIVITY NOT FUNDED FROM FEES (SUCH AS THEMATIC REVIEWS)
SOURCE CQC ANNUAL REPORTS, MANSFIELD ANALYSIS
Stable resources, more complaints, fewer inspections
The CQC receives c.£200m income from fees charged to registered providers (see Figure One), which constitutes c.90% of its total revenue; the remainder is mostly DHSC-provided grant-in-aid funding. Around half of its fee income is from independent sector providers, predominantly adult social care (c.40%), but also hospitals, community and single specialty providers, and dentists (together c.10%). Income and employee numbers have remained largely flat over the last five years, which indicates relatively stable resource capacity, although funding may have been hit by recent inflationary pressures – the average salary for a CQC inspector is now estimated to be £38,328.
During the Covid-19 pandemic, expenditure shifted away from inspection towards monitoring, given extreme pressures which prevented on-site inspections. However, while expenditure on inspections has somewhat recovered to pre-pandemic levels, a closer look at overall inspection frequency reveals a longer-term decline that predates the pandemic (see Figure
Two). Mansfield sent an FOI request to the CQC to segment inspection activity by provider type; the results show adult social care and primary medical services have seen the greatest decline since 2016 of 12‒15%, but hospitals have also seen a marked 7% drop in inspection activity. Given all health and adult social care services must be registered with the CQC, fees charged to providers is effectively a ‘tax’ on the independent sector to be appropriately regulated and for quality standards to be maintained. It follows that all independent sector providers might reasonably expect frequent monitoring and inspections (and more importantly re-inspections) to give a current and relevant quality rating.
However, while CQC employee numbers have remained around 3,000 over the last six years, the number of inspections per employee has declined by c.2x since 2016. Taken together, this indicates inspection activity has been in sharp decline despite relatively stable resources and is yet to return to peak levels. This trend cannot be explained by the Covid-19 pandemic given inspections have not returned to pre-pandemic levels and resourcing is similar, but by key changes
in the CQC’s inspection strategy.
Historically, if a service was rated ‘good’ or ‘outstanding’, the CQC aimed to conduct a full inspection within five years. However, since 2021 the CQC has been taking a more ‘risk-based’, targeted approach to inspection, and only inspects sites where there is a clear risk to safety (i.e. prioritising struggling sites). For all other sites, the CQC has conducted c.20,000 ‘direct monitoring activity’ (DMA) assessments over the last three years – these entail speaking to service users and analysing data directly from providers, without going on-site to conduct a full inspection.
The CQC is also rolling out its new ‘single assessment framework’ for reports, which replaces key lines of enquiry (KLOEs) with new, standardised ‘quality statements’. However, there is an even greater risk of losing context at the expense of striving for consistency.
Caroline Barker, non-practising solicitor at the law firm Ridouts points out: ‘While these new quality statements are better aligned to regulations compared to the KLOEs they replace, it remains to be seen whether the proposed ‘ongoing assessments’, rather than inspection, will
Sector Insights | 15
70.4 FY20 18.2 17.5 68.2 Other independent2 94.1 95.8 FY18 20.9 19.6 NHS trusts and GP practices FY19 93.9 67.7 23.0 89.8 98.1 23.5 204.3 FY21 65.9 23.1 FY22 Adult social care (residential) Adult social care (community) 193.7 204.0 205.2 207.9 18.8 20.2 20.7 65.7 CAGR 2018-2022 1.8% 4.3% 6.2% -0.8% £m, income from fees charged to registered providers1 Income and employee numbers have remained largely flat Expenditure shifted away
inspection towards monitoring during the Covid-19 pandemic 2.2% £m, share of total revenue expenditure (excl. non-cash items) FY18 106.1 FY22 71.1 Monitoring 93.4 221.6 FY19 FY20 29.7 227.7 218.4 FY21 Inspection Registration Other3 212.2 215.4 79.7 22.8 31.9 110.8 30.2 59.8 17.7 33.2 42.4 33.9 86.2 28.0 Split not disclosed in annual reports CAGR 2019-2022 -1.8% 7.1% -3.7% -2.6% -1.8% 3.2k 3.1k 3.0k 3.1k 3.1k 3.0k Employees Covid-19
from
CQC INSPECTION ACTIVITY WAS DECLINING EVEN BEFORE COVID-19, AND REMAINS c.50% BELOW PRE-PANDEMIC LEVELS
‘000S, CQC INSPECTIONS
be used as a means to avoid the CQC’s statutory obligations to produce a full written report that a provider can review and respond to. We’ve also seen more enforcement action by the CQC over the last five years, and it’s become harder to get changes to reports than it used to be – so we might find more judicial reviews with the new system.’
So, while dedicating resources to struggling sites aligns with the CQC’s key strategic pillar to accelerate improvement where it is needed most, its implementation also creates uncertainty over the quality of services rated ‘good’ or ‘outstanding’ in inspections that in some cases were six or seven years ago. Moreover, complaints and whistleblowing enquiries (see Figure Three) are on the rise and at their highest ever levels, so it is surprising this has not resulted in more inspections.
Private acute and mental health hospitals: a tale of contrasting ratings
Private acute hospitals and mental health hospitals are two provider types that have seen contrasting trends in CQC ratings over the last five years.
16 | Sector Insights Healthcare Insights
15.2 3.8 2017 11.6 2016 2018 12.7 2.5 2019 6.2 2020 7.4 3.8 20231 1.1 17 7 2021 8.1 2022 23 0 18 5 16 2 7 7 9 6 11 7 9 0 6.5 4.4 3.7 1.1 1.5 1.3 1.1 1.2 1.0 1.0 0.7 13.1 (Annualised) Adult social care Hospitals Primary medical services Total inspections CAGR 2016-2023 -12 5% -12 1% -15 0% -6 8% Covid-19 7.9 5.8 5.2 5.8 2.5 3.1 3.8 N/A Inspections per employee2 NOTES 1 ACTUAL DATA FROM 1 JANUARY TO 15 AUGUST 2023 2 REVENUE AND EMPLOYEE NUMBERS ESTIMATED FOR EACH CALENDAR YEAR BY AVERAGING ACROSS PERIODS (AS ANNUAL REPORTS ARE BY FINANCIAL YEAR) SOURCE FOI REQUESTS, MANSFIELD ANALYSIS
2020 2018 2019 2021 2016 2017 2022 38.6 20231 39.9 43.2 43.2 47.6 65.6 40.3 60.0 +5.8% ‘000s ‘000s 2016 2017 20231 17.2 2018 2019 2021 2020 2022 7.6 7.7 8.9 14.4 10.6 14.5 15.9 +9.6% Complaints Whistleblowing enquiries COMPLAINTS AND WHISTLEBLOWING ENQUIRIES ARE AT THEIR HIGHEST LEVELS NOTES 1 ACTUAL DATA FROM JANUARY TO MAY 2023, ANNUALISED SOURCE PANNONE CORPORATE, FOI REQUESTS, CQC ANNUAL REPORTS, MANSFIELD ANALYSIS
INSPECTION ACTIVITY
FIGURE TWO
COMPLAINTS AND WHISTLEBLOWING ENQUIRIES
FIGURE THREE
THE QUALITY GAP BETWEEN THE NHS AND THE TOP SIX PRIVATE GROUPS HAS WIDENED SIGNIFICANTLY OVER THE LAST FIVE YEARS
%, SHARE OF LOCATIONS RATED ‘GOOD’ OR ‘OUTSTANDING’
The top six private acute hospitals have seen their CQC ratings increase consistently, whereas their NHS counterparts have seen a steady decline since Covid-19 (see Figure Four).
While these groups have always had superior quality ratings to the NHS, the gap has widened significantly. Roughly 95% of locations from the top six groups are rated ‘good’ or ‘outstanding’ compared to just c.55% of NHS acute hospitals; a stark difference which not only articulates the extreme pressures faced by the public healthcare system, but also indicates how strong leadership and effective collaboration with the CQC in the independent sector can drive quality improvements.
Private acute hospitals saw more inspections than pre-Covid-19 in 2022 (see Figure Five), with c.25% of rated locations inspected (similar to 2019 levels), following reduced activity during Covid-19. Of the 44 locations inspected, only three decreased in rating; 11 increased, 21 saw no change, and nine were inspected for the first time.
In contrast, NHS acute hospital inspection frequency has not recovered to pre-pandemic levels yet and many rating for both NHS and private are out
ROUGHLY 95% OF THE TOP SIX GROUPS ARE RATED ‘GOOD’ OR ‘OUTSTANDING’ COMPARED TO JUST c.55% OF NHS ACUTE HOSPITALS; A STARK DIFFERENCE WHICH ARTICULATES THE PRESSURES FACED BY PUBLIC HEALTHCARE
CQC filtering methodology
• Location primary inspection category: Acute hospital
• Top six private groups:
o Circle Health Group (formerly BMI Healthcare)
o Spire Healthcare
o Ramsay Health Care UK
o Nuffield Health
o HCA
o Practice Plus Group
of date. As at August 2023, the average time since last inspection for NHS acute hospitals was 3.8 years for ‘good’ or ‘outstanding’ sites compared to 1.9 years for ‘requires improvement’, and 1.2 years for ‘inadequate’; therefore, ‘good’ or ‘outstanding’ sites were being rated c.2x less frequently.
However, for the top six private groups, the average time since the last inspection was 3.7 years for ‘good’, ‘outstanding’ and ‘requires improvement’ locations, so the rating appears to have no impact on inspection frequency.
Private mental health hospitals have seen a very different profile – five years ago independent providers had 14% more ‘good’ and ‘outstanding’ ratings than the NHS, while today they have 9% fewer. They have seen a steady decline in CQC ratings by 10 percentage points since Covid-19, while NHS mental health trusts have largely been unchanged (see Figure Six).
A number of leading private providers including St Andrew’s Healthcare, InMind and CareTech have had multiple services downgraded. A closer look at the key lines of enquiry (KLOEs) in inspection reports reveals safety and leadership concerns
Sector Insights | 17
Jan-20 Jan-18 Jan-19 Jan-21 Jan-22 Jan-23 Jan-24 70% 50% 60% 80% 100% 0% 90% Top six private groups NHS +39pp +25pp
NOTES WE HAVE EXCLUDED LOCATIONS NOT RATED FROM THIS ANALYSIS SOURCE CQC CARE DIRECTORY, MANSFIELD ANALYSIS
FOUR ACUTE HOSPITALS – RATINGS
FIGURE
FIGURE FIVE ACUTE HOSPITALS – INSPECTION FREQUENCY
INSPECTED MORE IN 2022, FOLLOWING REDUCED INSPECTION ACTIVITY DURING COVID-19
INSPECTED
FIGURE SIX MENTAL HEALTH HOSPITALS – RATINGS
‘GOOD’ OR ‘OUTSTANDING’
as the key drivers for lower ratings. The mental health sector as a whole has faced profound system pressures since Covid-19, with high staff churn and persistent shortages, and a lack of training often cited.
Nevertheless, it is clear that staffing capacity and investment is needed in a sector which faces increasing demand and that often deals with the most challenging of patients in the health system.
Conclusion
Without consistent monitoring and frequent inspections, can providers be credibly held to account over service quality? The CQC rightly provides critical and necessary regulatory oversight to ensure patients receive the best care possible. However, when investors are looking to buy assets, CQC reports and summary ratings mask the nuances at the sub-sector and provider type level.
A private mental health hospital provider with a high proportion of ‘good’ or ‘outstanding’ sites should be considered particularly attractive when contextualised to the overall decline in ratings in this sub-sector.
Conversely, a private acute hospital provider with declining ratings should be approached with caution given the high and increasing ratings of the top six groups.
In addition, diligence now also needs to encompass how providers participate in an integrated health and care economy. Chris Day, director of engagement at the CQC, points out: ‘Six years ago, quality was about how well you manage inside your organisation – having good processes and workflows; what will define the next six to seven years will be how well they take part in that wider system, particularly in the NHS.’
Investors always require assurance on quality, but ratings from inspection reports are only a starting point - to truly understand quality, there is no substitute for in-depth site visits, conversations with key site-level personnel and the expertise of a commercial due diligence specialist.
18 | Sector Insights Healthcare Insights
25 43 14 15 44 15 147 150 83 131 132 79 2018 2019 2020 2022 2021 2023 YTD1 NHS Top six private groups 14.8% 24.2% 8.1% 8.7% 24.4% ~ 49.8% 48.2% 26.6% 42.4% 41.5% Top six private groups NHS %, share of hospitals rated Reduced inspection activity due to Covid-19 NOTES 1 ACTUAL DATA FROM 1 JANUARY TO 15 AUGUST 2023 2 REVENUE AND EMPLOYEE NUMBERS ESTIMATED FOR EACH CALENDAR YEAR BY AVERAGING ACROSS PERIODS (AS ANNUAL REPORTS ARE BY FINANCIAL YEAR) SOURCE FOI REQUESTS, CQC CARE DIRECTORY, MANSFIELD ANALYSIS PRIVATE HOSPITALS WERE
NUMBER
LOCATIONS
Jan-23 Jan-24 Jan-20 70% 80% 90% Jan-18 Jan-19 Jan-22 Jan-21 0% Private hospitals NHS mental health trusts +14% Covid-19 -9%
CQC RATINGS FOR INDIVIDUAL NHS MENTAL HEALTH HOSPITALS
COLLATED
CQC DIRECTORY;
WE HAVE
CQC REPORTS
EVERY NHS MENTAL HEALTH TRUST AT DECEMBER OF EACH YEAR SOURCE CQC CARE DIRECTORY, MANSFIELD ANALYSIS
MENTAL HEALTH HOSPITALS
SEEN
CQC RATINGS DOWNGRADED MORE THAN THE NHS
COVID-19 %, SHARE OF LOCATIONS
OF
NOTES
ARE NOT
IN
THEREFORE,
LOOKED AT
FOR
PRIVATE
HAVE
THEIR
SINCE
RATED
Germany has a large private hospital sector in comparison to the UK. Arne Berndt, partner at WMC Healthcare, and Paul Fegan consider whether the differences in respective sectors are due to contrasting healthcare systems, and whether any of the conditions that result in Germany’s large private hospital sector are transferable to the UK


Managed markets comparing the German and UK private hospital sectors
In April 2023, Mansfield Advisors compared UK and Spanish private hospitals, highlighting the significant differences in scale and scope of the two sectors, despite both having similar tax-funded universal healthcare systems with complementary private health insurance. Our article (see page 20) concluded that Spain has created the conditions for large private hospitals to thrive by having a far larger privately insured population and regional governments more willing to experiment with public-private solutions.
Germany has an even larger private hospital sector. Eurostat data shows nearly 60% of hospital beds in the €114bn acute hospital market are private , while only 40% are run by public hospitals. This is in marked contrast to the UK, where roughly 5% of beds are in the private sector, and Spain, with 32% in the private sector (see Figure One). Like Spain, German private hospitals include ‘full-service’ general hospitals, in contrast to the UK’s small sites offering a limited range of elective procedures.
Structure of Germany’s acute hospital sector
Germany has a lot of beds, both in absolute terms (437,000) and relative to population (see Figure Two).
Excluding psychiatric beds, German federal statistics for 2021 show 33% of beds (146,000) are not-for-profit and 19% (83,000) are for-profit. The for-profit sector is highly concentrated, with the four biggest groups accounting for 61% of for-profit beds (12% of total beds). By contrast, the not-for-profit sector is much more fragmented (the top five have 15% of not-for-profit beds) and public hospitals
are even more fragmented (see Figure Three).
About half (48%) of all hospital beds are in large hospitals (>500 beds), and nearly two-thirds of these are in public hospitals. At the other extreme, 15% of beds are in small hospitals (<200 beds), and 42% of these are for-profit. The latter partly reflects the prevalence of highly specialised small hospitals, such as those focussing on sports surgery, which can be highly profitable.
Social and private health insurance
Germany’s universal healthcare system is the original social insurance model. Employees and employers contribute to public health insurance funds, with the federal government setting a contribution rate for salaries up to c.€65,000. These insurance funds then reimburse providers on behalf of their members. All Germans are required to have insurance, and the funds cover family members, retirees and the unemployed.
Superficially, the German and UK systems look similar: instead of general taxation, Germans are, in effect, ‘taxed’ through social insurance. Unlike the UK, though, where private insurance is complementary (we cannot opt out of paying taxation), Germans who earn over €65,000 can choose substitutive private insurance and opt out of the public insurance system entirely. (There are controls on re-joining the public system to prevent adverse selection.)
However, the payor model is not the driver of Germany’s large private hospital sector per se. First, the proportion of the German population with private insurance
is not significantly greater than the UK. Around 12.5% have substitutive private insurance, compared with approximately 10% in the UK and c.25% in Spain covered by complementary private insurance, and this has been declining slowly as it becomes more expensive and relatively less attractive to Germany’s ageing population (see Figure Four). Secondly, private and social insurance payors are not limited to private or public hospitals exclusively.
Managed markets and dual financing
The critical difference between the UK and German models is that the latter enables individuals to be consumers of healthcare (‘demand-led’), whereas healthcare in the UK is viewed as a public good/service (‘supply-led’). To be clear, Germany’s social insurance system does not in itself create a large private sector (France has a similar model, but only 38% of beds are private). It simply creates the conditions for healthcare markets to develop.
Theoretically, markets are self-regulating, but governments usually intervene where consumers and/or producers cannot make economically rational choices. For example, governments don’t directly control the market for cars, but do set safety and environmental standards. Similarly, Germany manages the market for hospital services, providing a level-playing field where patients choose where they are treated. Patient and payor can be agnostic about whether that is a private or public hospital.
Dual financing is a key component of the managed market, with frameworks
Sector Insights | 19
GERMANY HAS A LARGE PRIVATE HOSPITAL SECTOR (NOT-FOR-PROFIT) COMPARED TO OTHER EU COUNTRIES %, AVAILABLE HOSPITAL BEDS1 BY SECTOR, EXCLUDING PSYCHIATRIC CARE, 2018
Public


Not-for-profit
GERMANY HAS A LOT OF BEDS, BOTH IN ABSOLUTE TERMS AND RELATIVE TO POPULATION 000s BEDS, 20211
NUMBER OF BEDS1, PER 100,000, 2021


20 | Sector Insights Healthcare Insights NOTE 1 INCLUDES CURATIVE CARE, LONG TERM CARE IN HOSPITAL SETTINGS, REHABILITATIVE CARE AND ‘OTHER’ 2 EXCLUDES IRELAND, HUNGARY, SLOVAKIA, SWEDEN & LUXEMBOURG 3 UK PRIVATE HOSPITAL BED DATA IS NOT INCLUDED IN THE EUROSTAT PUBLICATION. EXTRACTED FROM LAINGBUISSON REPORT AND MAY INCLUDE NOT-FOR-PROFIT BEDS SOURCE EUROSTAT HEALTHCARE RESOURCES STATISTICS - BEDS 2020; LAINGBUISSON PRIVATE ACUTE HEALTH CARE, SEVENTH EDITION (2021) 61% 41% 62% 68% 95% 18% 29% 14% 13% 22% 30% 24% 19% 5%3 2 3
NOTE 1 OECD DEFINITION OF ‘SOMATIC CARE’, INCLUDES CURATIVE, LONG TERM, REHABILITATION AND ‘OTHER SOURCE OECD HEALTHCARE RESOURCES – HOSPITAL BEDS BY FUNCTION; MANSFIELD/WMC HEALTHCARE ANALYSIS 536.7 329.1 123.3 140.1 645 486 260 208
HOSPITAL BEDS BY
FIGURE ONE
PROVIDER SECTOR
BED CAPACITY
FIGURE TWO
FIGURE THREE
SECTOR CONCENTRATION
HOSPITAL BEDS BY PROVIDER GROUP AND SECTOR, 2020
Bremen
Munich
Rheinland
for supporting capital investment and to cover operating costs (see Figure Five):
• Capital investment funds (3% of hospital funding) administered by German states for new buildings and other projects. Public and private hospitals can bid for funding. States also plan hospital capacity, although this does not necessarily translate to explicit targets for bed numbers, nor the relative share of private and public sectors
• Operating costs (97% of hospital funding) German hospitals are reimbursed for activity delivered. A federal agency, the Institute for the Hospital Remuneration System (InEK), defines services and sets prices using a Diagnosis-Related Group (DRG) system. DRG reimbursement covers around 80% of operating costs and is the product of a base rate and points per case, depending on complexity. It is used by all payors to reimburse all hospitals for inpatient services
There is a similar activity-based approach for reimbursing outpatient services, but different systems for social and private insurance. (Physicians receive 2.3 times more through private reimbursement.) Other services are generally billed on a fee-for-service basis.
In principle, the NHS in England is similar, and the architecture of hospital funding would be recognisable to German hospital operators. The National Tariff is comparable to the German DRG system, and private hospitals in England can contract to the NHS, receiving the appropriate tariff, just like their German counterparts. Capital funding for NHS hospitals is handled separately (although is not available to private operators). Yet, despite these similarities, we still do not have a large private hospital sector. What else is missing?
History, policy and culture
Different histories and cultures mean similar approaches to payment or organisation have different outcomes. When the NHS was founded in 1948, as an integrated, tax-funded service, there was still no reason why it had to own hospitals.
However, the existing patchwork of charity, church and municipal hospitals needed reorganisation, renewal, rationalisation and expansion, and centralised public ownership was seen as the best way to achieve that, as in other newly nationalised industries.
German charity, church and municipal hospitals have similar origins to the UK, but social insurance is much older than the NHS . Its decentralised separation of payor and provider meant public hospitals continued to be owned by municipalities and private hospitals remained independent not-for-profit institutions. However, with a demand-led system, Germans also became comfortable with choice. This is exemplified by supplementary private insurance which tops-up statutory cover for greater choice of consultant, private rooms, etc. Some 10% of Germans have supplementary private insurance and it has been growing. In the UK, there is resistance to anything which dilutes the idea of a universal ‘one-size-fits-all’ NHS.
It was the transition to dual financing which stimulated the growth of for-profit hospitals by forcing the privatisation of public and not-for-profit hospitals. The DRG system has been blamed for losses,
Sector Insights | 21
For-profit Not-for-profit Public 60.3% 39.7% To tal To p 4 14.5% 85.5% To tal To p 5 8.5% 91.5% To tal To p 5
SOURCE GERMAN FEDERAL STATISTICAL OFFICE; WMC HEALTHCARE ANALYSIS
Vivantes (Berlin)
Knappschaft (Ruhr)
Agaplesion
Barmherzige Bruder
Marienhaus
Franziskus Stiftung Helios
Alexianer Asklepios
Sana Kliniken
Ameos
97,000 158,000 233,000 58,000 23,000 20,000
THE
FOR-PROFIT SECTOR IS HIGHLY CONCENTRATED; NOT-FOR-PROFIT AND PUBLIC HOSPITALS ARE MUCH MORE FRAGMENTED %
FIGURE FOUR

FIGURE FIVE
ALL
% OF HOSPITAL FUNDING BY SOURCE,
22 | Sector Insights Healthcare Insights SOURCE GERMAN FEDERAL STATISTICAL OFFICE; PKV; WMC HEALTHCARE ANALYSIS 2016 2014 CAGR 2014 – 2020 2020 2018 Substitutive Supplementary 6.1 14.8 8.8 8.7 15.0 14.9 8.7 8.8 5.9 6.2 1.2% 14.7 6.3 -0.2% 0.4% Substitutive PHI premium development compared to consumer price index PHI penetration - supplementary vs. substitutive consumer price index substitutive insurance premiums 2015 2016 2017 2018 2019 2020 2021 130 120 110 100 90 SUBSTITUTIVE PRIVATE HEALTH INSURANCE IS SLOWLY DECLINING AS PRICES RISE, WHILE SUPPLEMENTARY (TOP-UP) INSURANCE GROWS INDEXED TO 100 NOTE 1 INCLUDES GRANTS THAT ARE ACCOUNTED FOR AS REVENUES, NEW EXAMINATION AND TREATMENT METHODS, AND OTHER OPERATING INCOME SOURCE GERMAN FEDERAL STATISTICAL OFFICE; GERMAN HOSPITAL ASSOCIATION; WMC HEALTHCARE ANALYSIS 97 % 2019 3 % Investment costs Operating costs Total = €104bn Source of funding: Statutory & private health insurances Type of funding: ! DRG System: hospitals receive lump-sum payments per patient day depending on case complexity ! Case rates for ambulatory care ! Fee-for-service for optional services ! Other: new examination and treatment methods 80 % 15 % 2 % Fees for optional services 3 % DRGs Other1 Funding split Case rates for ambulatory care Source of funding: Federal states Type of funding: ! Individual support (e g., for a new building) ! Lump-sum support based on individual federal state specific allocation process considering e.g hospital size, cases, guaranteed minimum payments 56 % 44 % Individual support for specific projects Lump-sum support for infrastructure Funding split Overall insufficient funding for investment costs by the federal states mean some capital investment needs to be covered by operational income
HOSPITALS,
OF SECTOR, BENEFIT
DUAL-FINANCING SYSTEM,
CAPITAL
REGARDLESS
FROM THE
ALTHOUGH
FUNDING IS INSUFFICIENT
2019
PRIVATE HEALTH INSURANCE IN
GERMANY
DUAL-FINANCING
with smaller hospitals particularly vulnerable, since they struggle to generate case mix points to be profitable. Meanwhile, capital investment funds have left hospitals underinvested and, without sufficient resources, municipalities and even federal states have opted for privatisation. For example, Giessen-Marburg was sold by the state of Hesse in 2006 to become the first privatised university hospital. The number and share of private hospitals, therefore, continues to grow (see Figure Six).
Overcapacity
There is another factor at work. As the government stimulates the development of outpatient, day patient and other ambulatory services to reduce reliance on inpatient services, the hospital system is consolidating. While there is no formal target for bed capacity, if Germany went as far as to converge on the EU27 average, there would be 173,000 fewer beds (almost as many beds as in the entire NHS across the UK). Hence, some hospitals will close.
Privatisation is seen as an alternative to closure. While the German public might be agnostic about who provides its healthcare, and is comfortable with choice and top-ups, they are perhaps still uncomfortable with the idea of making a profit out of ‘misfortune’. However, the private sector is also seen as a way to save hospitals which would otherwise be closed, and, for politicians, it is perhaps a way of shifting blame for those closures when they do happen.
Conclusions
Compared with the UK, Germany has a large private hospital sector because of a multitude of factors.
One is undoubtedly the fundamental difference between healthcare systems, creating the conditions in which hospitals of any sector could thrive within a managed market. However, the tools of managed markets, such as DRG reimbursement, also made it more difficult for public and not-for-profit hospitals to survive. In the UK – or at least in England – we have those same tools, but the
managed market still does not make large scale private general hospitals viable.
It is deliberate choice and culture which have played a much greater role. Culturally, Germans are accepting of their role as consumers of healthcare, and hence they are less concerned about whether the hospital is private, public, for-profit or not, as long as it meets their expectations on quality.
In terms of choice, the owners of loss-making hospitals have deliberately chosen to privatise as a way to sustain those hospitals that might struggle for investment or even close. The British are still a long way from seeing themselves as healthcare consumers, or accepting top-ups, and it would be a brave politician who decided to privatise a loss-making NHS trust. Mansfield Advisors and WMC Healthcare, together with Antares Consulting, form the Curis Alliance of specialist health and social care consultancies, with Europe-wide coverage.
FOR-PROFIT HOSPITALS HAVE BEEN GROWING AS NOT-FOR-PROFIT AND PUBLIC HOSPITALS ARE PRIVATISED AND THE MARKET CONSOLIDATES
Sector Insights | 23 NOTE INCLUDES PSYCHIATRIC BEDS SOURCE GERMAN FEDERAL STATISTICAL OFFICE; GERMAN HOSPITAL ASSOCIATION; WMC HEALTHCARE ANALYSIS XX % Hospitals by ownership Hospital beds by ownership 577 570 560 552 545 551 547 679 674 662 650 645 620 607 700 707 720 723 724 732 733 2017 1,942 2015 2020 2016 2018 2019 Private Non-profit Public 1,956 1,951 2021 1,925 1,914 1,903 1,887 97 499 163 168 239 93 167 2018 2015 241 93 Non-profit 96 2016 165 239 Public 164 2017 95 236 239 2019 97 488 159 232 2020 Private 91 499 497 498 494 2021 484 231 156 CAGR 2015 – 2021 -0.6% 0.8% -1.9% -0.9% -0.5% 1.0% -1.2% -0.7% CAGR 2015 – 2021
FIGURE SIX GROWTH IN FOR-PROFIT HOSPITALS
Deals in the surgical ophthalmic equipment and products market reached a record high of 31 deals in 2022, with PE backed transactions also attaining new highs. Johan Ottosson and Dr Victor Chua see significant opportunities for this sector of the market


Investors show strong interest in ophthalmic product space
Global surgical ophthalmic equipment and products deals grew with a CAGR of 19% 2018‒2022 to a record high of 31 deals last year. PE or PE backed deals grew faster than the market overall with a CAGR of 26.6%, reaching a record 13 deals in 2022, almost twice that of the previous year.
Recent notable PE deals include Eurazeo’s acquisition of Dutch Ophthalmic Research Center International (DORC, led by CEO Pierre Billardon) for an estimated
€300m in 2019,1 and CVC’s acquisition of Rayner Surgical Group (led by CEO Tim Clover) for an undisclosed amount in 2021.
The most active investor in recent years however has been TPG Capital. Since its 2016 acquisition of US-based Beaver-Visitec International’s (BVI, led by president and CEO Shervin Korangy) TPG Capital has proceeded to roll-up multiple, mainly European, ophthalmology assets. Through this, TPG Capital has built a leading global platform estimated to have seen a reve -
nue growth of around 19% CAGR between 2017 and 2021.
Investor interest in the space is driven by attractive market fundamentals such as an ageing population, increasing treatment of pathologies, better access to healthcare, as well as stable public or insurance funding. Ophthalmic procedures tend to be inexpensive because they are almost always day-cases, and impactful because good vision is so important to normal productive life.
We therefore expect ophthalmic pro-
24 | Sector Insights Healthcare Insights
cedure growth exceeding growth in other surgical specialities. There are significant roll-up opportunities for investors in this space, notably in the US and Western Europe.
A large and fast-growing market
We estimate the global ophthalmology equipment and surgical products market to be worth around £20bn in 2023. Around 84% of this market is made up of equipment and products for the operating room (see Figure One).
The market for inside the operating room can broadly be broken down into products for the front of the eye, or the anterior segment (covering cataract, glaucoma, and refractive surgery), and products for the back of the eye, or the posterior segment (covering vitreoretinal surgery).
The anterior segment is by far the largest of the two, with a market size of
c.10x that of the posterior segment. It is also forecast to grow at a faster rate, with an expected CAGR of 6.5% 2023‒2027 (see Figure Two).
In this article we focus on the cataract and vitrectomy (VR) segments as the largest ones in the anterior and posterior segments respectively.
Cataracts and vitrectomies
In the cataract space (the largest part of the anterior segment), intraocular lenses (IOLs) represent c.67% of the total market value. We forecast future market growth in this space to be largely driven by the multifocal (premium) IOL segment.2 Although multifocal IOLs are usually not covered by public pay healthcare systems, nor by statutory health insurance systems, we believe that growth in this sector will be driven an increasing global middle class willing to pay for these products in full (private pay), or in part (co-pay).3
Sector Insights | 25 INVESTOR INTEREST IN THE SPACE IS DRIVEN BY ATTRACTIVE MARKET FUNDAMENTALS SUCH AS AN AGEING POPULATION, INCREASING TREATMENT OF PATHOLOGIES [AND] BETTER ACCESS TO HEALTHCARE SOURCE MARKET SCOPE; MANSFIELD RESEARCH AND ANALYSIS Pre-op evaluation 0.6 Vitrectomy 1.2 0.5 Posterior segment Retinal 1.3 1.3 Glaucoma 0.4 OR Microscope Therapeutic Disposable 3.1 Surgical Products Cataract 6.7 Diagnostic Devices Glaucoma 1.0 Anterior segment General Exam 0.2 Vision implants 0.0 3.1 Intra-vitreal 0.1 0.2 Software 0.1 2.5 0.5 12.7 Refractive 3.4 Other anterior segment 1.7 Outside operating room Inside Operating room General Surgery specific Forecast CAGR <4% 4 - 5.9% 6 - 7.9% WE ESTIMATE THE GLOBAL OPHTHALMOLOGY SURGICAL PRODUCTS MARKET TO BE WORTH c.£20BN £BN, 2023F
FIGURE ONE
GLOBAL OPHTHALMIC PRODUCT MARKET, BY APPLICATION
FIGURE TWO
GLOBAL OPHTHALMIC PRODUCT MARKET, SURGERY SPECIFIC
FIGURE THREE
KEY PLAYERS IN THE CATARACT AND VR MARKETS


THE ANTERIOR SEGMENT IS c.10X LARGER THAN THE POSTERIOR SEGMENT, AND FORECAST TO GROW FASTER £BN, 2023F SOURCE


26 | Sector Insights Healthcare Insights Cataract only aract and VR VR only Group Group Part of Zeiss THERE ARE NUMEROUS BOTH GLOBAL AND REGIONAL PLAYERS IN THE MARKET SOURCE MARKET SCOPE; MANSFIELD RESEARCH AND ANALYSIS DF Machine 0.3 Monofocal IOL 2.8 Premium IOL 1.8 0.1 IOL 0.0 Machines 0.3 0.7 Packs 0.3 Disposable Intruments 0.1 Machine Services 0.2 Cataract Surgical Packs 0.5 FLACS Refractive Vitrectomy Glaucoma Other anterior Packs 0.4 Machines 0.2 Phaco 4.5 Vision Implant 1.0 Reusable Instruments 0.1 Accessories 0.3 Intra-vitreal injections Other VR Devices 0.4 0.9 0.6 3.4 1.7 1.2 0.0 Machines 0.2 Forecast CAGR <4% 4 - 5.9% 6 - 7.9% Anterior segment Posterior segment Inside Operating room Surgery specific
MARKET SCOPE; MANSFIELD RESEARCH AND ANALYSIS
WE
We expect the market for monofocal lenses to grow at around 3.7% globally until 2025. We expect almost all the increase to be driven exclusively by volume growth, since these products are largely commoditised and are experiencing strong downward price pressures.
In the VR space, we expect growth to be driven by surgical pack sales, as well as - to a lesser extent ‒ by disposable instruments (despite being a faster growing segment).
Fundamental drivers
Strong market growth in the sector is supported by solid fundamentals, including:
• An ageing population Age is one of the main drivers of both cataract and VR surgery and, according to data from World Population Prospects, 16% of the world’s population (or 1.55 billion people) will be over age 65 by 2050, up from 9% in 2019 (or 639 million people)4
• Increasing treatment of pathologies and increasing access to healthcare Cataract procedures in China, for instance, are estimated to have doubled in the period between 2014‒2019, from 1.5 million to 3 million procedures.5 Even so, this still means that only c.213 per 100,000 population procedures were carried out, compared to 1,310 in France, 1,049 in Germany,6 or 998 in England (FY22).7 We would expect a significant growth in the number of procedures over time in China and other similarly under-penetrated markets, notably in APAC
• Increasing prevalence of diabetes (mainly related to VR) Diabetes is a significant determinant of VR surgery, and the prevalence of diabetes around the world is expected to rise to 10.2% or 578 million people by 2030 (9.3% or 463 million people in 2019) and 10.9% or 700 million people by 2045. Prevalence rates are higher in urban areas and in high-income countries, meaning we expect to see growth even in currently highly penetrated markets8
• An expanding middle class willing to pay for premium IOLs (related to cataract surgery only) Market Scope forecasts the multifocal IOL market to grow with a CAGR of 11.7% until 2025 (compared to 3.7% for monofocal IOLs)9
In addition to these favourable factors, investments in this space will also benefit from stable revenue streams from public or statutory health insurance payors. We expect this market to remain attractive over the long term.
Dominant players
The cataract equipment space is dominated by large global players, whereas VR has some regional players.
The global market for surgical ophthalmic equipment and products is dominated by Alcon and Bausch + Lomb. These offer a full range of products, from equipment to instruments and consumables, covering both the cataract and VR segments.
Other global players have decided to focus primarily on the anterior segment (for instance Carl Zeiss Meditec and Johnson & Johnson). The larger players are followed by a tail of smaller more regional ones often focusing on IOLs (notably UK-based Rayner and Netherlands-based Ophtec) and consumables.
Players focusing on equipment for the posterior segment tend to be smaller and more regional, for instance DORC, in Western Europe and the USA, Oertli mainly in DACH, and Appasamy Associates in India.
Sector Insights | 27
NOTE DEALS ARE DEFINED AS WHERE THERE IS A TRANSFER IN OWNERSHIP OF AN ECONOMIC INTEREST IN AN ONGOING BUSINESS CONCERN. TRANSACTIONS WITH A DEAL VALUE GREATER THAN OR EQUAL TO US$5M ARE INCLUDED. PRIVATE EQUITY BACKED IS DEFINED AS DEALS WHERE EQUITY HAS BEEN PROVIDED BY A PRIVATE EQUITY FIRM. FUNDING ROUNDS ARE EXCLUDED. PE DEALS ARE DEFINED AS DEALS WHERE THE BIDDING COMPANY IS PE. PE BACKED DEALS IS DEFINED AS DEALS WHERE THE BIDDING COMPANY IS NOT PE, BUT WHERE THE COMPANY IS PE BACKED, AND WHERE PE IS PROVIDING EQUITY SOURCE MERGERMARKET, MANSFIELD RESEARCH AND ANALYSIS 8 8 8 9 8 15 8 6 18 4 2 5 8 4 6 8 4 7 13 2014 2015 2016 2017 2018 2019 2020 2021 2022 2023 YTD May 10 13 16 13 14 23 12 13 31 PE or PE backed Strategics 2018-2022 CAGR 26.6% 14.9% 19.0% Total OPHTHALMOLOGY PRODUCT DEALS GREW TO A RECORD HIGH OF 13 PE OR PE-BACKED DEALS IN 2022 NUMBER OF DEALS
EXPECT
GROWTH
NUMBER OF PROCEDURES
FIGURE FOUR GLOBAL OPHTHALMIC SURGICAL EQUIPMENT AND PRODUCTS DEALS
A SIGNIFICANT
IN THE
OVER TIME IN CHINA AND OTHER SIMILARLY UNDER PENETRATED MARKETS
FIGURE FIVE
CASE EXAMPLE ‒ TPG AND BVI SELECTED ACQUISITIONS
SINCE ACQUIRING BVI IN 2016, TPG CAPITAL HAS ROLLED UP MULTIPLE OPHTHALMOLOGY ASSETS


TPG Capital acquire Beaver-Visitec International, Inc. The company focuses on ophthalmic single-use devices in refractive, cataract and retina
BVI acquire Vitreq (Netherlandsbased ophthalmic company focused on minimally-invasive instruments for VR surgery)

BVI acquire Arcadophta (a France-based ophthalmic company specializing in silicon oils, gases and perfluorocarbons used in vitreoretinal surgery)
2020

BVI acquire Malosa Medical (a UK based manufacturer and supplier of single use surgical instruments with more than 400
BVI acquire PhysIOL s.a. (Belgium-based provider of intraocular lenses who in 2017 acquired a majority stake in Optikon (Italian provider of phaco systems, VR devices, and diagnostic equipment)


BVI acquire Benz Research & Development (a US-based manufacturer of contact lenses)
We believe this regionalisation is due to the smaller market size of the VR space compared to the cataract sector; the dominance of Alcon in the US (which until now has limited European player growth in that market); and the low priority historically placed on large Asian markets such as India (India instead is served by local, lower-cost players such as Appasamy).
Though a rough divide between players focusing on the anterior and posterior segments can be made for smaller players, several companies mainly focused on VR (such as BVI, DORC and Oertli) offer either dual-function machines, capable of performing both cataract and VR surgeries, or offer other products that span both segments. We have, therefore, included these in the Cataract and VR segment in Figure Three.
Consolidation
There is significant deal activity and the market for equipment, instruments, disposables and liquids is consolidating.
THERE IS SIGNIFICANT DEAL ACTIVITY AND THE MARKET FOR EQUIPMENT, INSTRUMENTS, DISPOSABLES AND LIQUIDS IS CONSOLIDATING
Deal numbers hit record levels in 2022 (see Figure Four).
There is an identifiable trend for consolidation of equipment providers with other providers of ophthalmic products, such as
consumables. Hence, under TA Associates ownership, Belgium-based IOL manufacturer PhysIOL in 2017 acquired Optikon, an Italian provider of phacoemulsification systems (used in cataract surgery), VR devices, and diagnostic equipment (PhysIOL/Optikon was acquired by BVI the year after).
Further, in 2019, Hoya (Public, TSE/ TYO) acquired Germany-based Fritz Ruck and US-based Mid Labs, providing the company with VR machines, probes, and surgical packs.
The most active investor in recent years has been TPG Capital, which since its 2016 acquisition of BVI, has proceeded to roll-up multiple regional, mainly European, ophthalmology assets into its platform. Targets have included Vitreq (Netherlands), PhysIOL/Optikon (Belgium/Italy), and Arcadophta (France) (see Figure Five).
Through these acquisitions, BVI has significantly expanded its portfolio from being a company primarily focused on single-use devices in refractive, cataract
28 | Sector Insights Healthcare Insights
2016 2017 2017 2018 2019
SOURCE MERGERMARKET; MANSFIELD RESEARCH AND ANALYSIS
IN VIRECTOMY, BVI’S ACQUISITIONS HAVE SIGNIFICANTLY EXPANDED ITS PRODUCT RANGE

Disposables
AMD IOL
Retinal Implant
and retina, to one now covering most of the areas covered by its global competitors (see Figure Six).
Because of this significant roll-up, BVI has almost doubled in size since the TPG Capital takeover, growing at an estimated CAGR of around 19% in the years 2017‒2021 to reach revenue of approximately €320m.
Opportunities in sight
The ophthalmology product space is ripe for investment.
Prospective investors will benefit from several attractive market fundamentalssuch as an ageing population, increasing treatment of pathologies and increasing access to healthcare, as well as stable public or insurance funding.
We also see significant roll-up opportunities for investors interested in building ophthalmology platforms focusing on either cataract, VR, or both.
We believe that any platform play should initially focus on the US and
Western Europe where there are more numerous attractive assets. Any play should attempt to leverage the assets’ varying geographical presence to accelerate international expansion.
Once a platform has been established, additional longer-term growth should be achievable through growing the instruments and consumables space, expanding to geographies outside of the US and Western Europe (notably China, India, and the rest of APAC), and encompassing the refractive and glaucoma segments (which we estimate to be worth £4.4bn globally combined in 2023).


NOTES
1 https://www.eurazeo.com/sites/default/ files/presse/190313-DORC-Exclu-EN-1.pdf
2 Multifocal lenses allow for vision at a range of
distances. This contrasts with monofocal lenses which provide focus at only one distance.
3 Co-pay is where the patient pays the difference between the cost of a standard cataract procedure with a monofocal lens, and a premium procedure with a multifocal lens. This is allowed in some countries, though not for instance in the UK.
4 https://www.un.org/en/global-issues/ageing#:~:text=Globally%2C%20the%20population%20aged%2065,11%20in%202019%20 (9%25).
5 Market Scope ‒ 2020 IOL Market Report
Mid-Year Update
6 Eurostat Surgical operations and procedures performed in hospitals: cataract surgery 2019.
7 NHS Digital
8 Saeedi, et. al. Global and regional diabetes prevalence estimates for 2019 and projections for 2030 and 2045: Results from the International Diabetes Federation Diabetes Atlas, 9th edition, Diabetes Research and Clinical Practice, Volume 157, 2019, 107843, ISSN 0168-8227
9 Market Scope ‒ 2020 IOL Market Report
Mid-Year Update
Sector Insights | 29
tikon
Vitreq
Home
ü ü ü ü
VR Machines ü ü ü ü
Packs ü ü
Laser ü ü ü ü ü ü ü Surgical Instruments ü ü ü ü Endo Illumination ü ü ü ü ü Ocular Gas ü ü ü ü ü Silicone Oil ü
Buckles ü ü
Dyes ü ü ü ü
ü ü ü ü ü
ü ü ü ü ü
SOURCE MARKET SCOPE; MANSFIELD RESEARCH AND ANALYSIS
PhysIOL/Op
Arcadophta
Malosa Medical Beaver Visitec Company US US Belgium France Netherlands UK US
Country
DF
Dedicated
Photocoagulation
Scleral
Ocular
Cryo Probes
Hemostatic Devices
ü ü ü Other
2023
2017 Add on acquisitions
Competitor benchmark
FIGURE SIX CASE EXAMPLE ‒ BVI EXPANSION IN VIRECTOMY
Spanish and British health services are remarkably similar, but where Spain and the UK differ is the scale and scope of private hospitals. Paul Fegan and Henry Elphick consider the two markets and ask, can we ever expect to see the development of large ‘full service’ private general hospitals in the UK?


Prospects for private investment in Spanish and British hospitals
In the simple characterisation of health care systems as either ‘Bismarck’ or ‘Beveridge’, the Spanish and British health services are both examples of the latter. Both are largely funded through general taxation; both use primary care gatekeepers to manage access, and both rely to a significant degree on public provision. Sadly, both systems also struggle with waiting lists and a sense of chronic underfunding, and both rely on contracts with private acute hospitals to meet demand. Spain sustains large private hospitals, offering emergency treatment and maternity, whereas the typical UK private hospital is small and focused entirely on elective care.
Private equity is an active investor in both the UK and Spanish hospital markets – for example, in the UK, BC Partners and Centerbridge have owned BMI Circle, and Cinven Spire Healthcare respectively, and in Spain, CVC, BC Partners and Cinven all owned assets that are now part of Quiron Salud. Macquarie Infrastructure and Real Assets currently own Viamed Salud. Each market, whilst similar, has important differences.
Who pays, who provides, what is provided and why?
Key differences between the private acute markets in Spain and the UK have implications for investment in the sector.
Capacity
Spain has over 32,700 private acute beds in 295 hospitals. The UK has just over 7,600 beds in 190 hospitals. At an average of just 40 beds, the UK private hospitals are therefore much smaller than the average 111 beds per hospital in Spain, and Spain has more than six times as many private acute beds per million
population as the UK. LaingBuisson estimates that the UK private acute market was worth £5.5bn in 2019 (the last year before the pandemic skews market activity), compared with £7.9bn in Spain.
Moreover, Spain’s private acute hospital sector includes some very significant institutions. For example, Hospital Teknon in Barcelona has 285 beds, 14 intensive care cubicles, 20 operating theatres for high and low complexity procedures, and a 24-hour emergency suite, with resuscitation facilities. In fact, it is ‘normal’ for Spanish private hospitals to have emergency rooms, whereas in the UK, it is unknown. Even in London, only a handful of private hospitals offer urgent care, and none provide an accident and emergency service.
Private payors insurance
Undoubtedly one of the drivers of this difference is the penetration of voluntary private medical insurance (PMI). In both the UK and Spain, the Beveridge system assures universal coverage (you can’t opt out of paying tax), so PMI is duplicative – that is, it provides an alternative to the national health system, but doesn’t exclude anyone from using it. In Spain, around 25% of the population is covered by PMI, compared with around 11% of the UK population. That translates to around 11.8 million Spaniards and 6.8 million Britons, some 1.7 times as many people covered in Spain than in the UK. At least part of this may be because PMI is cheaper in Spain, but since neither country has community rating or risk equalisation, both markets are structurally similar.
Essentially this implies that, unlike the UK, Spain can justify and sustain large profitable ‘full service’ private general hospitals because it has a critical mass of people with PMI. Yet interestingly, the market for PMI is as skewed as the UK.
Just over 20% of insureds, or 2.4 million, live in Madrid. Similarly, just over 20% of UK insureds, or about 1.6 million, live in London. As a result, both Madrid and London are generously provided with private hospitals. However, Madrid is underprovided relative to the national average. Similarly, Barcelona, with nearly 10% of insureds, is also underprovided, whereas the London market is well ahead of the national average and may be close to overcapacity.
Furthermore, PMI in Spain has a much broader scope, and usually includes maternity and emergency treatment. In the UK, private acute hospitals are stuck in a Catch-22 scenario: none offer emergency treatment because it is not reimbursed by insurers. Meanwhile, insurers do not cover emergency treatment, presumably because private hospitals do not offer it.
On this basis, unless there is a significant increase in PMI scope and penetration, UK private hospitals are destined to remain small, and focused on elective care. While NHS waiting lists might prompt more to take out PMI, this effect could end up being a temporary one should the NHS successfully tackles the backlog. And it still does not necessarily mean that any uptick in penetration would result in the scope of insurance being extended to sustain new ‘full service’ private hospitals in UK.
Private payors self-funding
In both Spain and the UK, corporate policies are a significant component of the market. Hence, penetration falls in retirees, just as PMI gets more expensive. With significant waiting lists in both countries, growth in self-funded treatment has been strong. The UK self-funded market grew by 7.5% CAGR 2014-19, compared with 2.7% for the market overall. Comparable figures aren’t available for Spain,
30 | Sector Insights Healthcare Insights
but out of pocket spending on inpatient and day care (which includes co-payments as well as self-funded care) grew by 8.0% CAGR 2015‒19, compared with 5.2% for the total private acute market.
However, self-funded treatment tends to be focused on specific elective procedures, particularly those that are discrete episodes of care rather than requiring ongoing (open-ended) treatment and cost. Hence, in the UK, self-funding is concentrated in ophthalmology, orthopaedics, and some general surgery and diagnostics, such as endoscopy. Self-funding is therefore unlikely to stimulate an expansion in the scope (or capacity) of British private hospitals on its own. While the scope of self-funding is likely to be similar in Spain, it augments existing activity in ‘full service’ general hospitals.
Public payors
Another significant difference between Spain and the UK is a clearer distinction between public and private provision. Both the Spanish and UK health services contract with private hospitals. Some 41% of the Spanish private acute market is accounted for by public funding, compared with 31% in the UK (almost entirely in England).
Many UK NHS hospitals earn private patient income, including through operation of private patient units (PPU). Hospital trusts in England earned £681.3m from private patients in 2019/20, but 63% of this was earned by the top 10 trusts, all in London. The most successful, the Royal Marsden, earned £136.6m alone. There is no equivalent in Spain – public hospitals only serve publicly funded patients.
In both Spain and the UK, the public health systems outsource activity to private acute hospitals. In the UK, that typically means private hospitals serve NHS patients in the same facilities, perhaps with some differences in the level of non-clinical service. In 2019, 2.9% of NHS funded activity was delivered by private hospitals. Spain has a similar system, so-called ‘partial conciertos’, where the public system commissions a volume of activity in private hospitals which otherwise serve private patients. This accounts for 10% of revenue.
However, Spain also has private hospitals which exclusively serve the public system. ‘Structural conciertos’ are private hospitals whose only source of income is public payors and account for 25% of private acute beds. They are fully integrated

into the public health system and serve publicly funded patients. Most are in Catalonia (28 hospitals) with another ten are spread across Spain, including one in Madrid.
Spain has also deployed Public Private Partnerships (PPP), with 8% of private sector beds in PPP hospitals in Valencia and Madrid. Partnerships usually have 25-year build and operate contracts where hospitals, as with structural conciertos, are fully integrated into the public health system. The main difference with PPPs is the public health system has the option of taking ownership at the end of the contract period.
Hence, some of Spain’s large ‘full service’ private hospitals exist because they have been developed together with and funded by the public health system. The UK currently lacks the architecture to deliver anything similar.
The Private Finance Initiative (PFI), comparable to Spain’s PPP, has been discontinued and continues to be criticised for burdening the NHS with significant costs. While Independent Sector Treatment Centres are, in principle, like structural conciertos – developed under contract and integrated into the NHS – they are, like most private hospitals, focused on straightforward elective care.
The other option might be private operation of an NHS hospital, but Circle’s management of Hinchingbrooke Hospital ended in failure.
Conclusion
Despite similar public health systems, Spain has developed a parallel private acute hospital market. Indeed, private hospitals in Spain have more in common with countries like Germany or France, where Bismarckian social insurance puts private and public hospitals on a level playing field in an integrated market.
It remains extremely unlikely that the UK would develop ‘full service’ private hospitals, with emergency rooms and capacity for complex care, without NHS support, and there is nothing to suggest the NHS is about to enable this to happen in any UK country.
Nevertheless, there is nothing inherently wrong with a private acute market focused on a limited range of elective procedures in a limited range of specialisms. Even if the clinical service is identical to the NHS, there will always be people who want to pay for better quality ‘hotel’ services, and, notwithstanding the debate about equity, pressure on the NHS can still be relieved as people opt to self-fund, use PMI or the NHS itself contracts with private hospitals.
There is a broader debate about how far the UK is willing to let this go, but given the ongoing capital constraints the private sector could play a significant role in augmenting elective capacity. First, though, it’s about winning hearts and minds. Private acute providers need to be seen as a solution to the problem and a partner to the NHS.

Sector Insights | 31
Hospital Teknon Barcelona
Operating theatre at Hospital Teknon Barcelona
Ministers have long acknowledged that increasing diagnostics capacity is key to driving down waiting times in the NHS. But despite claims of success and the promise of more community testing facilities, diagnostic imaging remains surprisingly constrained by the system. Tom Atherton and Adam Scott explore the current state of the market and the opportunities for independent providers and their investors


Scanning the opportunities

Insufficient diagnostic capacity has constrained performance in the UK health system for decades. In recent years, there had been clear improvements towards an apparently politically acceptable level. However, since the Covid-19 pandemic, waiting times have again increased and it feels like we are going sideways at best.
Imaging has seen fundamental growth in both testing and monitoring to help doctors make data-driven treatment decisions. The increase in waiting lists has resulted in a major initiative to build
community diagnostic centres (CDCs) which has provided a new opportunity for corporate providers and their investors.
The right diagnosis, early in the pathway, creates tremendous value for patients and for society, but it can be difficult to fully communicate the value to both NHS and private payors, and to capture more of the tremendous value created.
The sector has seen strong competition on private prices and NHS tariffs, which has now abated. But now price levels make substantial private capex
investment justifiable only for contractually guaranteed volumes. Volumes have been growing for many years, but this has been affected by the pandemic and its after-effects. Until it returns emphatically, lenders and investors want to see guaranteed contracts and little uncertainty as a quid pro quo, but the sector is dependent on NHS payors which have been strangely reluctant to commit longterm despite the apparent predictability of their needs.
NHS imaging equipment is running at high levels of utilisation and much of it
32 | Sector Insights Healthcare Insights
is old or outdated. MRI and CT scanning rates in 2019 (or nearest year) were substantially below other comparable countries, with the UK performing, per capita, around 50% of the MRI, CT and PET CT scans undertaken in the US, Germany, and France. The UK has far worse five-year cancer survival rates in key tumour types than these countries, and late diagnosis is seen as a contributing factor. Additionally, the increasing practice of defensive medicine is driving utilisation, together with a new generation of younger consultants who rely on scans for diagnosis. Finally, there is a post-Covid backlog as people who had received diagnostic scans and treatment plans require re-scanning because they’ve waited so long for an operation that the consultant needs to re-plan treatment. Diagnostics, therefore, has become a major priority.
Diagnostic imaging consists of image generation and reading
Generation is the images being taken by radiographers and reporting requires a radiologist to produce a diagnosis. Generation has seen less outsourcing than reporting but growing waiting lists mean both now present opportunities for the private sector. Reporting can be outsourced remotely, even internationally, via teleradiology while generation will always be a local service (see Figure One).
The most frequent image types and modalities differ in NHS facilities and private hospitals. CT and plain film have much higher utilisation in the NHS in unplanned care/A&E patients, and ultrasound in ante-natal care. MRI is used extensively in elective pathways and there is, therefore, much higher utilisation in private hospitals. MRI, echocardiography, and endoscopy is more often outsourced as part of planned services. However, plain film and CT both have significant elective volumes that could be conducted out of a hospital setting or outsourced; for instance, large PET CT contracts have been awarded to private provider Alliance Medical. In recent years, both MRI and CT/PET CT have seen greater growth in scan numbers than other imaging modalities with movement from x-ray to these imaging methods.
THE MARKET IS PREDOMINANTLY MADE UP OF NHS IMAGING VOLUMES
Image generation markets have seen an increase in M&A activity in recent years
There are a range of ways that the NHS has used the private sector for imaging services: mobile scanners, CCG community and GP direct access contracts, outsourced diagnostic centres, MRI and CT imaging contracts, and national contracts (see Table One).
Major players in the image generation market include Alliance Medical, InHealth, Healthshare, Medneo and Medical Imaging Partnership. Alliance Medical was previously owned by a consortium of 3i, Graphite Capital, Bridgepoint, Dubai International Capital and M&G before being sold to South African company Life Healthcare. Outside the UK and South Africa, Alliance Health is also present in Italy, Ireland, and northern Europe. Apposite Capital acquired a majority share of the Medical Imaging Partnership more than six years ago in 2016 and so is presumably looking to exit before too long. InHealth, chaired by Richard Bradford, remains resolutely private. Healthshare UK, has been backed by BGF in its muscular-skeletal health and diagnostics offerings for the NHS. Medneo, a German operator entered the market in 2018 and has been highly active in seeking out NHS
contracts.
Most of these providers have been actively acquiring. In 2017 alone, Medical Imaging Partnership acquired the Queen Anne St Imaging centre from Nuada Medical, InHealth acquired the Manchester CATS service from CareARE UK, and Alliance Medical acquired Direct Medical Imaging. In 2019, Healthshare acquired Global Diagnostics and InHealth acquired United Open MRI. In 2022, InHealth acquired C7 Health, which is the healthcare software platform that owns TAC Healthcare. More unusually, the owners of the diagnostics provider Lyca Healthcare acquired a full-service hospital, the Kent Institute of Medicine and Surgery (KIMS.) In its first UK acquisition, US imaging provider Radnet acquired radiologist-owned Heart and Lung Health which, as the name suggests, specialises in chest and cardiac.
What are community diagnostic centres?
CDCs are intended to be one-stopshops for checks, scans and tests provided away from hospitals in a community setting, such as shopping centres and high-streets. The 2019 NHS Long Term Plan emphasised the need for restructuring and more provision and CDCs are now being implemented. Professor Sir Mike
Sector Insights | 33
91% 86% 9% 14% Generation Private Reporting NHS 554 5,196 100% SOURCE LAINGBUISSON
FIGURE ONE IMAGING SERVICES MARKET SIZE, £M, 2021, UK
Richards’ October 2020 report outlined a plan for diagnostic waiting lists. Community diagnostic centres separate emergency/acute care from elective diagnostics. They also provide more accessible and convenient services for urgent cancer diagnoses, stroke, heart disease, and respiratory conditions.
The initiative gained traction and now has £2.3bn budgeted to open up to 160 centres. The aim is to achieve 3.8 million diagnostic tests by March 2023 and up to 10 million diagnostic tests by March 2025.
These aims are fairly general, as they have not projected tests by segment or described how much capacity is replacement or incremental (see Figure Three).
Are community diagnostics centres the solution to tackle waiting lists?
The aging population, with its higher prevalence of heart disease and cancer, is an obvious driver of demand. Medical need has more often converted into demand when GPs have been supported to make direct referrals for advanced diagnostic imaging, and accessibility has increased for screening and early detection.
Covid-19 has curtailed supply as enhanced cleaning has cut into the available hours even after all the facilities became fully operational again. The number of patients waiting more than six weeks


has exploded from 31,395 in November 2019 to 427,968 in November 2022. The waiting list for non-obstetric ultrasound has increased the most, from 388,056 in November 2020 to 554,816 two years later. This creates opportunity for providers such as Healthshare to provide these services. KP Doyle, its chair, is optimistic that patients’ entitlement to choose a provider right from the beginning of the pathway will soon be re-emphasised in national policy. He is clear that policy direction like this is key to making choice work for patients, and the direction of policy is indeed in this direction, as shown by a move away from block funding to hospital Trusts from April 2023 onwards.
CDCs are supposed to make diagnostic


34 | Sector Insights Healthcare Insights
Service provided by Private clinic Patient NHS Private (PMI) Private (self-pay) Teleradiologist NHS or private Service provided by Patient Imaging £55-85 Reporting £30-60 Total £115 £150-250 £150-250 £300-500 £200-375 £200-375 £400-750 c.£21 (routine) c.£76 (urgent) Interpretation SOURCE MANSFIELD MYSTERY SHOPPING AND INTERVIEWS SERVICES PROVIDED BY PATIENT PATIENT IMAGING REPORTING TOTAL INTERPRETATION SERVICES PROVIDED BY TABLE ONE MAJOR PROVIDERS Ownership Privately owned Life Healthcare Privately owned (BGF minority share) Charity Apposite Capital (majority stake) Medneo GmbH (Marcol PE investment) Sites1 800+2 (11 CDCs) 63 39 NHS clinics + 4 centres 2 9 1 Revenue, £m (2022) 218 (2021) 170 33 23 10 ‒Employees 2,489 947 417 131 102 ‒NOTES 1 SITES MENTIONED ON COMPANY WEBSITES AND NHS REGISTERED CLINICS. NOT INCLUDING MOBILE SCANNERS 2 INCLUDES HOSPITALS, COMMUNITY BASED MEDICAL CENTRES, GP SURGERIES AND HEALTH CLINICS SOURCE COMPANY WEBSITES; COMPANY ACCOUNTS; NHS ENGLAND FIGURE TWO REVENUE BY SCAN ‒ REVENUE FOR A SINGLE PART MRI SCAN VARIES CONSIDERABLY BY PAYOR TYPE
imaging more accessible, but more importantly will free up hospital capacity for urgent and acute patients. Hospitals need spare capacity for urgent care, but high throughput efficiency is difficult to achieve when plans are continuously disrupted. Non-hospital diagnoses are likely to result in the all-clear and are likely straightforward, not an interesting case or high-tech modality. Dull, repetitive work must be paid for directly at an arms-length basis if it is to be quickly and efficiently delivered.
Emergency trauma MRI is done as quickly as needed in any state hospital anywhere, but the non-urgent x-rays often pile up in the metaphorical corner. So the CDC is meant to take that work out, and patient
DULL, REPETITIVE WORK MUST BE PAID FOR DIRECTLY AT AN ARMSLENGTH BASIS IF T IS TO BE QUICKLY AND EFFICIENTLY DELIVERED
accessibility is a nice-to-have and excellent public rationale.
In October 2022, the Department of Health and Social Care stated that CDCs had delivered 2 million checks since July 2021. It is uncertain what proportion of these are additional tests vs. those displaced from other diagnostic sites. Waiting lists have recently started to fall but not nearly enough to combat the growth experienced due to Covid-19 and actual diagnostic scan numbers are still no higher than the years predating Covid (see Figure Four). English volumes have not increased since 2019 and so the CDCs do yet appear to have made a difference.
Sector Insights | 35
0 200,000 400,000 600,000 800,000 1,000,000 1,200,000 1,400,000 1,600,000 2018 2013 2014 2019 2017 2020 2015 2016 2021 2022 Oct-22 +6% CAGR +20% CAGR Covid-19 SOURCE NHS ENGLAND 0 300,000 600,000 900,000 1,200,000 1,500,000 1,800,000 2,100,000 2,400,000 2018 2013 2014 2019 2017 2020 2015 2016 2021 2022 Oct-22 Covid-19 Pre-Covid activity SOURCE NHS ENGLAND
FIGURE THREE
DIAGNOSTIC WAITING LIST ‒ NUMBER OF PEOPLE ON WAITING LIST, ENGLAND ONLY
DIAGNOSTIC ACTIVITY, MONTHLY, ENGLAND ONLY
FIGURE
FOUR
Dr Tim Ferris, the NHS national director of transformation quoted by the King’s Fund in 2022, said that the CDCs had only increased capacity by 2% and would add no more than 5% by 2027. This is a far lower estimate, from someone who would know, than the total number of CDCs vs the current sites would suggest. Even at only 2‒5%, activity should be increasing, including allowing for some double-counting and less incremental new capacity in reality. However, we don’t see that in the numbers.
There has been a decline in elective activity since Covid-19, though it is returning to normal now, and a similar decline in activity level per system has remained long after the pandemic, offsetting any capacity increase. New machines may not be alleviating the true constraint, as a staff shortage is apparent too (see Figure Four).
Opening 160 CDCs is challenging when there is a 10.5% vacancy rate across the NHS for radiographers. One interviewee described CDCs as ‘ghost towns’ because of the inability to find sufficient numbers of staff. The National Audit Office (NAO) says local NHS managers argue progress has been delayed due to ‘uncertainty accessing capital’.
There is also a large shortfall in radiologists, argued to be 29% in 2021 and forecast to grow to 39% in 2026. When surveyed, 97‒98% of clinical directors said they were concerned about workforce morale, stress, burnout, backlogs and delays for patients. Teleradiology has already created a more accessible supply of radiologist time and expertise. Enhancements in efficiency in improved
processes, systems and IT continues to steadily expand it. However, radiologists have long since been able to pick up as much extra work as they would like, and there is little utilised time left among UK registered radiologists.
We are struck by how busy our British teleradiology contributors are! There is a hard limit to how much more supply could be brought into the sector with just immediate short-term budget increases. This is in contrast to most surgical specialities, where even at current market rates surgeons and staff could do more sessions if budgets were found to pay them and the hospital.
Do community diagnostic centres provide an opportunity for private provider partnerships?
Waiting lists are unlikely to significantly decrease any time soon and outsourcing will be necessary to keep up with demand.
Professor Sir Mike Richards stated that ‘use of independent sector facilities where possible should be maximised during the recovery phase’.
His report also suggested that full implementation of his recommendations would result in a reduction in ‘outsourcing of image acquisition and generation’. However, we are unconvinced by this. We expect ever greater reliance on private and corporate provision.
Greater NHS use of the private sector has already been seen with Alliance Medical, InHealth and various smaller provid-
ers included in the £10bn NHS framework contract for increasing capacity. We have heard from another private provider that local NHS hospitals are hesitant to sign contracts, but volumes are steady and increasing in under-served areas of x-ray and ultrasound. There is a lot of demand from NHS hospitals, but currently they are reluctant to guarantee volumes.
The liquidation of Rutherford Health, announced in June 2022, was highly unfortunate. Rutherford Health formed one of the flagship CDC partnerships at the Somerset Foundation Trust but the company failed in its first year. Its focus was on oncology centres and so this does not reflect on the viability of CDCs (see Figure Five b).
The NHS capital guidance for 2022 to 2025 states that large new-build projects for CDCs will only be considered on ‘an exceptional basis’ and will only be supported if it can be demonstrated that a new-build is the only viable approach to increasing diagnostic capacity and addressing health inequalities.
NHS Estates may indeed have the space outside of hospitals, but there are few multi-clinic sites where imaging could be added as a new module. We reviewed a sample of CDCs and found that many of the centres are simply existing centres rebranded, including within some hospitals, supporting the cynics’ view that much promised new capacity does not look truly incremental.
This contradicts the 2021 Spending Review where the Chancellor announced the opening of 160 ‘new’ CDCs.
In August 2022, 47 of the 92 community diagnostic centres existed on hospital sites. There is obviously an opportunity here for corporate imaging specialists to build where a need has been identified for a CDC but not yet built outside hospital. InHealth has built 11 community diagnostic centres which they state are located ‘in a community setting and can be NHS-branded’.
Conclusion
Studying British healthcare opportunities, it’s enervating how often one has to read the word ‘underinvestment’ when what is meant is there no personal or public incentive to spend more on a diagnostic, preventative or screening service
36 | Sector Insights Healthcare Insights
10% 53% 58% 2018/19 19% 9% 15% 35.3m 19% 18% 2021/22 36.6m
Non-obstetric
CT MRI
Plain x-ray
Ultrasound
SOURCE NHS ENGLAND NIDC 2021/22
FIGURE FIVE a NHS IMAGING ACTIVITY, ENGLAND, Y/E MARCH 31 MARCH
even though on average it is probably worth far more than it costs to society, the individual or the state. But since diagnostic imaging is indeed unusually dependent on substantial capital expenditure, into both machines and human capital, the term investment is for once entirely valid – and used as an accountant rather than a politician would.
It’s incontrovertible that the UK has underinvested in imaging capacity, since it only has half the relative capacity in machines of other OECD countries.
Working the equipment and senior staff harder, along with removing any bias towards referral, does take away some of that difference. But it doesn’t immediately follow that private capital should rush to fill the gap. Demand is constrained by the division of spending into either a state bureaucracy or individual spending, but of that a tenth of the population at most would have the cost reimbursed by an insurer.
PRIVATE INVESTORS HAVE TO BRING REAL COMMERCIAL AND CLINICAL SKILLS AND A LOT MORE THAN JUST CAPITAL TO THE TABLE TO ADD AND CAPTURE VALUE SUSTAINABLY
There is no other private or public organisation in the middle, providing long-term group coverage, and incentivised towards early detection and effective diagnosis.
Any state, and the UK is no different, is
 SOURCE GOV.UK
motivated by embarrassing international comparisons in healthcare as in education, but this is a blunt instrument which works slowly and fitfully. It most often results in exhortations to greater performance, without any new control taken or system incentive created. Bouts of spending on machines or buildings occur because they can be seen rather than to create a predictable and profitable market, which is far more difficult to design, deliver and sustain.
We don’t have time or space here to hypothesis how a well-designed system would fix this or to discuss how close other countries get.
Back to the here and now, the answer is that British corporate providers can make an economic profit (after the cost of capital) in outsourcing but only when the local demand/supply and NHS environment is very well understood, and relationships can be maintained.
There is little sense in speculative ventures, because the private market outside London is too small to make that economically viable in most cases. The alternative of ‘insourcing’ contracts, for capex and/ or management and/or maintenance is perhaps a more certain bet, and we think this sector is larger than most outsiders appreciate.
This type of offering appears dominated by larger, more established players that are not following the headlines understand imaging services better than any generalist, state-owned hospital. Either way, private investors have to bring real commercial and clinical skills and a lot more than just capital to the table to add and capture value sustainably.
Sector Insights | 37
LOCATIONS ‒ OPERATIONAL
ENGLAND
FIGURE FIVE b CDC
AS AT SEPTEMBER 2022,
Waiting lists are likely to be a key factor in the next General Election and there is renewed government focus on reducing them – and fast. Adam Scott and Ali Bahram delve into the reasons for the NHS’s inability to reach pre-pandemic treatment levels, assess the accuracy of previous predictions and explore the possibility of bringing down waiting lists with the help of the independent sector


NHS waiting lists behind the headlines
The NHS waiting lists stood at 7.2 million people in the latest official figures from November 2022.
The good news was that waiting lists reduced slightly for the first time since the pandemic. It may be a false dawn, but worth noting.
Since waiting lists will be a major factor in the next election, Prime Minister Rishi Sunak has pledged to reduce them by the end of 2024, even while Secretary of State Steve Barclay is currently facing challenges from ongoing strikes and conflict with unions over the wage bill.
The NHS elective recovery plan, announced in February 2022, aims for FY25 elective activity to be 30% above FY20. This is a higher growth rate than the NHS has achieved in the past. As has been widely reported, the NHS system is still treating fewer patients post-pandemic despite having materially more staff and money, as shown in Figure One.
Most coverage, including well-known think-tanks, accepts that the major factor has been reduced bed capacity. Internationally and for UK private hospitals, Mansfield Advisors would normally look first at operating theatre capacity, and then perhaps high acuity ward (i.e. recovery) capacity, to truly understand the constraints on operational performance. Operating theatres require capex and time, so corporate hospitals normally understand their utilisation and therefore return on capital fairly well. Of course, bed capacity is a slightly more slippery concept than it first appears, since internationally actual capacity is practically based on staff numbers, often with patient ratios defined by regulation rather than physical beds. However, for
space-constrained British hospitals, with staff:patient ratios close to minimum levels already, bed capacity is actually pretty close to true capacity so we can use the data with an intellectually clear conscience.
An unusually high number of beds are indeed currently being taken up by delayed discharges and Covid-19 patients. The sickest Covid-19 patients will not necessarily be on ventilators and in the highest acuity intensive care beds, but they may well absorb the high acuity recovery beds since they need assistance with their breathing and nurse attention. Much elective surgery cannot start if there is not a guaranteed bed for the post-operative recovery. The NHS’s January 2023 announcement of £1bn for 5,000 extra beds (c.5% capacity increase) and 800 new ambulances by next winter reflects its acknowledgment of the impact.
Activity is still yet to reach 2019 levels
The NHS is treating substantially fewer patients in major care types, such as outpatient appointments and elective admissions, compared to 2019. This is even more surprising when you also consider relentless demographic pressure. However, there has been 6% more activity in the latter half of 2022, albeit partly because of more NHS-paid activity in private hospitals. There has also been recently a material increase in first cancer appointments, required within two weeks, but still lower than pre-pandemic levels. In primary care, GP appointments
increased 4% on the back of more teleconsultations, despite a shortage of GPs, but in November 2022 nearly 1.4 million patients still waited a full month for an appointment.
The NHS has more staff and money than in 2019
NHS England estimated that 2021 productivity was 16% lower owing to infection control measures and higher sickness. Staff absence rates have risen 4.2% to 6.1%, arguably since staff suffered both burnout and the subsequent resurgence of respiratory illnesses. There has been a larger increase in staff from 2019 than most people realise: 17% more junior doctors, 11% more hospital nurses, and 10% more consultants (see Figure One).
There is anecdotal evidence of less appetite for extra shifts from nurses and overtime for doctors, but not enough to offset full-time equivalent employment. There is also much argument that the treatment mix has changed, with patients more acute than three years ago, partly as a result of the delays in treatment. This is difficult to quantify, even in the data-rich NHS system, without dedicated research which is not yet available.
Nurses have been striking and the Royal College of Nursing (RCN) is demanding a 19% pay increase. Ambulance paramedics and physiotherapists have joined them. The British Medical Association (BMA) has opened a ballot for junior doctors, which runs until February 20th.
There are 1.9% fewer GPs compared to 2019, so the supply/demand mismatch
38 | Sector Insights Healthcare Insights
NHS HOSPITALS IMPLY THAT BED CAPACITY IS THE MAIN CONSTRAINT ON ACTIVITY, NHS ACTIVITY DRIVERS, 2019 VS. 2022
Referral to treatment
NOTES ACTIVITY IS JANUARY–NOVEMBER; NON ADMITTED PATHWAYS INCLUDES OUTPATIENT TREATMENT. BED CAPACITY IS APRIL–SEPTEMBER; -6% ACCORDING TO NHS FIGURES, BUT IN 2016 NAO STATED BED DELAYS WERE UNDERSTATED SO -11% IF ADJUSTED; FTE STAFF IS JULY FOR BOTH YEARS. FUNDING FY23 VS FY20.
SOURCE NHS DIGITAL: NHS WORKFORCE ST ATISTICS, NHS STATISTICS: CONSULTANT-LED REFERRAL TO TREATMENT WAITING TIMES AND BED AVAILABILITY AND OCCUPANCY DATA; KING’S FUND; INSTITUTE OF FISCAL STUDIES; NATIONAL AUDIT OFFICE; MANSFIELD ANALYSIS
has worsened in primary care. The government has committed to publishing ‘independently verified forecasts’ of the number of nurses and other staff the NHS needs as part of a long-term workforce plan, but the publication date has slipped already.
The Chancellor recently announced additional funding of £3.3bn for the NHS in FY24 and FY25, following multiple funding increases over the past several years.
According to pre-pandemic plans, FY23 spending was budgeted at 16% higher than FY19, but it will actually be 23% higher as pandemic spending has not fully subsided. Total spending for FY25 should be c.£165bn.
The sense of crisis has not dissipated
The additional staff may not be addressing the constraints in the system on surgical procedures, since critical care and high dependency beds require both specific training and experience, and additional plant and equipment. Simultaneously, the closer to capacity the rest of the hospital is, when most wards
are already run at low staffing levels, the less likely staff are to be redirected and the necessary capex found. We can see in bed utilisation data that hospitals are normally at 90% of capacity.
Too much of the work in a hospital is created by patients who – on clinical terms alone – could and probably should for their own benefit be somewhere else, further along in their care pathway. The pejorative term for these patients is ‘bed-blockers’ and it’s often found in newspaper headlines. Of course, not all such delays are feasible to avoid and the scale of actual inefficiency depends on who is doing the reporting and analysis.
All agree that the hospitals and other parts of NHS organisations themselves comprise the largest part of the sources for these inefficiencies. The National Audit Office (NAO) even suggested in 2016 –based on its own primary data – that the actual number of ‘bed-blockers’ was 2.7x that reported by the NHS hospitals themselves, with the understated implication that a clear majority owe their apparent delay to internal NHS factors. Notwithstanding that one finding, NHS hospitals’ own data would suggest that nearly half (46%) of available bed-days lost to delays
in 2019 were owing to social care factors (see Figure Two)
There are always such problems in moving patients onwards, arising from social care’s reliance on Local Authorities’ elderly care budgets and, indirectly, from patients’ families having to pay, arrange and accept long-term care arrangements. These social care issues rose steadily in the last decade after the 2011 Spending Review caused Local Authorities to restrain their elderly care budgets. The NHS hospitals’ reported bed-days lost to social care issues rose to a peak in 2017 (see Figure Three), and this growth was widely publicised and criticised.
The losses in available bed-capacity from social care issues did peak around 2017, with increased spending of £2bn budgeted directly towards social care spending by the government. The problem since then is not possible to show since the full dataset after Covid-19 has not yet been published. It is certainly true that there is chronic undersupply of intermediate or sub-acute care, including all three Rs of rehabilitation, reablement and recovery. Often there is simply a lack of care workers in some areas. Skills for Care reported the English adult social care
Sector Insights | 39
-5% -10% -3% -6% +10% +11% +17% +16% +23% -5%
total activity
-11%
Hospital nurses and health visitors NHS
Consultants Admitted pathways Nonadmitted pathways Junior doctors
Available beds Funding prepandemic plans Funding latest plans
FIGURE ONE


NOTES ACTIVITY IS JAN–NOV; NON ADMITTED PATHWAYS INCLUDES OUTPATIENT TREATMENT. BED CAPACITY IS APR–SEP; -6% ACCORDING TO NHS FIGURES, BUT IN 2016 NAO STATED BED DELAYS WERE UNDERSTATED SO -11% IF ADJUSTED; FTE STAFF IS JULY FOR BOTH YEARS. FUNDING FY23 VS. FY20.
SOURCE NHS DIGITAL: NHS WORKFORCE STATISTICS, NHS STATISTICS: CONSULTANT-LED REFERRAL TO TREATMENT WAITING TIMES AND BED AVAILABILITY AND OCCUPANCY DATA; KING’S FUND; INSTITUTE OF FISCAL STUDIES; NATIONAL AUDIT OFFICE; MANSFIELD ANALYSIS
FIGURE
HOW MUCH DO PRIVATE HOSPITALS REALLY WANT RELATIVELY LOW-PRICED NHS ACTIVITY WHEN PRIVATE DEMAND IS CURRENTLY STRONG?
NOTES 2019 VS. 2022 DELAYED DISCHARGES DATASETS ARE NOT FULLY COMPARABLE. 2019 DATA IS
40 | Sector Insights Healthcare Insights
0.3 0.2 0.2 0.3 0.3 2011 0.4 0.3 0.1 0.3 0.2 0.2 0.3 1.7 0.5 0.1 0.3 0.2 Awaiting completion of assessment Patient or family choice 0.2 1.4 0.3 0.3 0.3 0.4 2015 0.2 0.2 0.4 0.2 0.4 2017 2019 0.2 2013 1.7 0.3 0.3 Other 0.2 Awaiting care package in own home Awaiting care home placement 1.4 2.1 Awaiting futher non-acute NHS care Local Authority dependent 34% 33% 40% 46% 46% We estimate that the number of older patients in hospital who are no longer benefiting from acute care to be approximately 2 7 times the figure for reported delayed transfers of care - 2016 NHS dependent 37% 40% 36% 32% 30%
MILLIONS OF DELAYED NHS HOSPITAL BED DAYS 3,014 12,718 5,124 3,066 15,784 113,645 114 648 8,138 +7,646 2019 2022 2019 2022
General Hospitals “Delayed discharges”
Covid-19 Admitted patients with Covid-19 as primary reason “Delayed discharges” Adjusted for understateme nt of delays, according to NAO
report Occupancy has been C.90% in both periods
NHS
&
2016
DELAYED TRANSFERS OF CARE, AN ADJUSTMENT HAS BEEN FACTORED IN AS PER THE 2016 NAO REPORT ‘DISCHARGING OLDER PATIENTS FROM HOSPITAL’ STATING DELAYED DISCHARGES WERE BEING UNDERSTATED. 2022 DATA IS NUMBER OF PATIENTS WHO NO LONGER MEET THE CRITERIA TO RESIDE
NHS STATISTICS: BED AVAILABILITY AND OCCUPANCY DATA, DELAYED TRANSFERS OF CARE, DISCHARGE DELAYS (ACUTE); INSTITUTE OF FISCAL STUDIES; NATIONAL AUDIT OFFICE; MANSFIELD ANALYSIS AVAILABLE BEDS, APRIL‒SEPTEMBER 2019 VS. 2022
SOURCE
HAVE INDEED STRUGGLED INDIRECTLY FROM LOWER LOCAL AUTHORITY BUDGETS FOR ELDERLY CARE CAPACITY LOSS BY REPORTED CAUSE
FIGURE TWO HOSPITALS
THREE
AND MORE DELAYED DISCHARGES HAVE
LITTLE SPARE BED CAPACITY IN 2019
COVID-19
TAKEN THE
workforce even shrank in FY22, for the first time in nine years, so the situation may have deteriorated somewhat.
One thing that has certainly changed since FY19 is that 3,000 beds contain Covid-19 patients (see Figure Three), not even counting influenza and other respiratory conditions which are both seasonal and vary a lot from year-to-year. Patients arrive sick and then acquire something different, which may not be serious in itself but is material when patients are older and more vulnerable. We believe that much of the problem is owing to a lack of capital spending over many decades, with multi-bedded wards instead of single patient bedrooms a major reason for hospital-acquired illnesses. Compare that with infrastructural decisions in France, where single rooms became the norm a long time ago. Relative spending on healthcare in the UK is now comparable to its peers, but capital investment is still lower and there is presumably lower return to spending owing to high land and construction costs.
Bed capacity issues would also not explain post pandemic decrease in either outpatient appointments or non-admitted treatments.
Some of the waiting list projections have been accurate when misplaced assumptions cancelled; we see a possible peak mid-to-late 2023
In February 2022, the Institute for Fiscal Studies (IFS) projected NHS waiting lists with four scenarios (see Figure Four). The base scenario assumed that the NHS would achieve its goal of increasing elective activity by 30% by FY25 (compared to FY20), and that half of the patients who would have joined the waiting list during the pandemic would return to seek treatment. An alternative low scenario was also considered, where the same assumption was made about NHS activity levels, but it was assumed that only 30% of the ‘missing’ patients would return. The NAO also modelled two scenarios in late 2021, both assuming that 50% of the ‘missing’ referrals would return, but with different levels of NHS activity increase. The first scenario assumed a 3% increase per year (c.17% to FY25) in line with the NHS Long Term Plan, while the second scenario assumed
the NHS would meet its Covid recovery plan of increasing activity by 30% in FY25 – similar to both IFS models. To put this in context, before the pandemic it took the NHS five years (FY14‒FY19) to increase completed elective pathways by 18%.
There are early signs of some improvements in recent months, probably as
PRIVATE HOSPITALS WOULD HAVE TO DO ONLY ANOTHER 100,000 PROCEDURES IN TOTAL TO HELP STABILISE WAITING LISTS, AND ANOTHER 200,000 WOULD RETURN WAITING LISTS TO PRE-PANDEMIC LEVELS BY THE END OF 2024
more realistic central targets and financial incentives have stimulated some steady, if slow, activity increases in NHS hospitals. But they are still some way off these earlier targets. Yet the waiting list actuals are tracking the low projections, because a high proportion of the pandemic’s unmet need has subsequently failed to materialise. At first glance this is good for the hospitals (and politicians) but raises serious questions that require research. No one factor may predominate, but we note there has been a concerning rise in excess (higher than expected) deaths from multiple causes since the pandemic, which seems to be occurring in many comparable countries and may owe something to a lack of treatment through
that two year period. More prosaically, some issues will have resolved themselves without treatment, as many aches and pains do, without a consultation from a specialist. Other patients will have died no matter what, and other go to private hospitals and we can see the latter in public company results.
We don’t see any reason for another surge in the waiting list totals. Mansfield Advisors expects the waiting lists to continue to follow the low scenarios, peaking in mid-to-late 2023. Activity will be higher but will not achieve the stated targets.
Only 1.1 million of the 7.2 million on lists are awaiting a procedure, though this is 300,000 higher than pre-pandemic. 1.6 million await diagnostics, presumably imaging, and the remaining 4.5 million have a date for a consultation and/or decision. There are overlaps between these lists.
If we consider purely the political implications for the moment, which are likely to result in action, we think the number awaiting a procedure is more sensitive in the short term. We will consider the diagnostic waiting lists more in next month’s issue of Healthcare Markets, but spoiler alert – we simply don’t think there are enough staff and especially radiologists to make a substantial dent in waiting lists, even if there is more equipment and available spending on the teleradiology segment. Understanding those waiting for a consultation, the underlying factors and impact on patients would require a thorough analysis by speciality and/or disease condition and probably warrants an article in itself.
In principle, a national initiative using private hospitals could get waiting lists quickly down to pre-pandemic, if not eliminate them completely without complete system change
Back to those awaiting a procedure, and the heart of most of our readers’ interest in this article, is whether there will be more use of the private hospitals. The NHS has already a goal to increase ‘independent sector provision’ by 20% above pre-pandemic levels by March 2023, equivalent to 9% of elective pro-
Sector Insights | 41
FIGURE FOUR
UNEXPECTEDLY LOW NEED HAS KEPT WAITING LISTS AT THE LOW END OF PROJECTIONS DESPITE NO CATCH-UP ACTIVITY INCREASE; NOVEMBER 2022 WAS THE FIRST MONTH THE LIST DECLINED, COULD IT PEAK MID-TO-LATE 2023?
WAITING LIST FORECAST, MILLIONS OF PATIENT PATHWAYS


Of the 7 2m people waiting, 1 1m are waiting for a procedure and 1 6m for a diagnostic test
Waiting for decision Total waiting list
Waiting for procedure Waiting for diagnostics
NOTES THE 4.5M WAITING FOR A DECISION INCLUDES THOSE WAITING FOR A CONSULTATION/OUTPATIENT TREATMENT. WAITING LIST BREAKDOWN DOES NOT MATCH PERFECTLY E.G. A PATIENT CAN BE WAITING FOR A PROCEDURE AND DIAGNOSTIC TESTS. NAO – SEPTEMBER 2021; IFS – FEBRUARY 2022. FINANCIAL YEARS THROUGH MARCH
SOURCE NHS STATISTICS: CONSULTANT-LED REFERRAL TO TREATMENT WAITING TIMES; INSTITUTE OF FISCAL STUDIES; NATIONAL AUDIT OFFICE; MANSFIELD ANALYSIS
cedures. There has indeed been a 140% volume increase in ophthalmology and 5% in orthopaedics from 2022 vs 2019 (last three months to November only).
Yet other specialties - general surgery, gastroenterology and urology - decreased 11-30%! Integrated Care Systems (ICSs)/ Boards (ICBs) are less keen to spend on private hospitals than central policy would theoretically support. The NAO has even found examples where a referral to a private hospital would result in a standard elective tariff payable from the local ICS’s budget, but it would be a cost to them and not revenue neutral, since there is no central reimbursement without other, higher targets being met. This type of disincentive helps explain why local systems can sometimes obfuscate or delay patients’ free choice of first consultation provider.
Private hospitals and clinics would of course prefer to have predictable minimum volume contracts, which support planning and financing, but they can function effectively as long as there are consistent volumes. We are told that many local commissioners or hospitals have
been put off making such medium term arrangements because their own budget conditions are uncertain.
But another question is how much do private hospitals really want relatively lowpriced NHS activity when private demand is currently strong?
Spire Healthcare reported a c.2x increase in self-pay revenue in H1 2022 against H1 2019. However, a survey of executives in private hospitals found that many still see NHS-paid activity as key for growth. We understand that earlier tentative government discussions for a national elective surgery catch-up initiative floundered only when they were looking for a further discount on the national tariff, even after the local ‘market forces factor’ price supplement that NHS hospitals receive and private hospitals do not typically. But though private healthcare providers such as Spire Healthcare have specifically said they focus on private pay, we still wouldn’t expect most of their hospitals to turn away NHS referrals in reasonably cost-effective volumes and at standard NHS tariffs.
Waiting lists should be a major issue in the next General Election, which we expect by autumn 2024, unless they are unequivocally declining by that point. Our latest top-down analysis suggests that the private hospitals would have to do only another 100,000 procedures in total to help stabilise waiting lists, and another 200,000 would return waiting lists to pre-pandemic levels by the end of 2024. We wonder if the government is fully aware that the waiting list for procedures, if not diagnostics etc., is more tractable in this way. We have not arrived at these numbers only by what is needed politically, but also what we feel the private hospitals could reasonably do without substantially altering their operating model or long-term value proposition. If the government wished to achieve this, it would be surprisingly affordable, but would require a ‘National Treatment Fund’ of at least £800m to avoid the budgetary issues which subvert the full use of Patient Choice by individuals and their GPs (see Figure Five).
Our reasoning is that in 2019 private hospitals performed 1.1 million proce -
42 | Sector Insights Healthcare Insights
Jan-14 Jan-18 Jan-16 Jan-20 Jan-22 Jan-24 Jan-26 10.0 3.0 0.0 1.0 2.0 4.0 5.0 6.0 7.0 8.0 9.0 11.0 12.0 Waiting list General Election December ‘24 These projections include two ‘new’ variables (a) subsequent demand from unmet need from the pandemic (b) activity increases Much unmet need has not subsequently appeared which requires further research The assumption of both think-tanks is 30-50% will still occur & increase waiting lists The NAO low scenario assumes the NHS will perform at 30% higher levels by FY25 whereas the high scenario assumes the NHS Long Term Plan aspiration of 3 2% annually (17 1% to FY25) The IFS assumes the NHS will achieve its target of increasing activity by 30% by FY25 in both scenarios NAO high IFS base IFS low Midlate 2023 peak?
NAO low 7.2 1.1 4.5 1.6
dures and 40% were NHS-paid. Private operating theatres have traditionally low utilisation rates of 50‒55%, with spare capacity at odd times which are less convenient for surgeons. Another 150,000 annual NHS procedures over two years, on top of the additional growth in private would only increase utilisation towards 70%, allowing for some private growth at the same time. The most immediate challenge might be the availability of surgeons, who are contracted to local NHS hospitals. We admit this is a simple analysis and there are challenges, but broadly there is much that could be done. The private hospitals may indeed benefit disproportionately from less complex cases etc., but we would see these higher efficiencies as a feature and not a bug.
Of course, any such fund would have to be available equally to NHS hospitals, if they were able to expand the use of their facilities and staff beyond normal operating hours, possibly with the help of insourcing management companies.
In conclusion, we do acknowledge the
THE MOST IMMEDIATE
MIGHT BE THE
WHO ARE
a decade ago are still further away from being achieved.
The private hospitals would have to play a major role in regaining those, as they did under the Labour government of the noughties. It may be that by the time of the next Labour government, the modern public’s patience and comfort with the British phenomenon of millions of patients sitting on waiting lists will be finally exhausted and alternative approaches will be seriously considered.
progress the NHS has made in recent months with higher activity levels. However, there is a long way to go to achieve even pre-pandemic performance, and the ‘politically acceptable’ waiting times of
FOOTNOTE
Please note that there are public companies in the sector and that the author(s) or their colleagues may have shares in such companies, or smaller private clinics, personally or in their pensions.
Sector Insights | 43
Millions of patient on the waiting list with a decision to admit 0.1 End of 2022 waiting for a procedure 0.1 0.2 End of 2024 waiting for a procedure 1.1 0.8 To return to pre-Covid levels in two years (before the election), an additional c.300,000 procedures are required, on top of current levels Additional NHS procedures to stabilise the waiting list as growth is outpacing current activity levels Additional NHS procedures to reduce the waiting list to pre-Covid levels theoretically, we believe the private hospitals have just enough capacity to handle all procedures c.£800m Cost to NHS to outsource additional activity Millions of admitted patients by independent providers, split by payor 0.8 Private paid 1.5 2019 2021 2022 1.2 NHS paid 1.1 1.1 2023 2024 0.5 0.4 0.6 1.4 0.7 c.50% c.70% Theatre utilisation SOURCE NHS STATISTICS: CONSULTANT-LED REFERRAL TO TREATMENT WAITING TIMES; INSTITUTE OF FISCAL STUDIES; NATIONAL AUDIT OFFICE; MANSFIELD ANALYSIS
CONTRACTED
HOSPITALS ADDITIONAL PROCEDURES REQUIRED FIGURE FIVE TO RETURN TO PRE-PANDEMIC LEVELS OF PATIENTS WAITING FOR A PROCEDURE, THE NHS NEEDS TO DO AN ADDITIONAL c.300,000 ACTIVITY, WHICH WILL COST c.£800M IF OUTSOURCED TO PRIVATE HOSPITALS
CHALLENGE
AVAILABILITY OF SURGEONS,
TO LOCAL NHS


Is there wisdom in investing in European Dentistry?
United Kingdom
Buoyed by surging demand for private care, the UK dental market has continued to grow out of the Covid-19 pandemic with tailwinds abound:
• Severe and ongoing supply constraints in NHS-funded care push patients to self-pay, and cooped-up demand is likely to weather macroeconomic trends in the short-to-intermediate term
• The threat of regulatory shake-up is mitigating; NHS dental contract reform trials were abandoned this year with findings from the ten year program due by year-end
• The Covid-19 freeze in NHS co-pay increases is expected to lift in 2023, which will continue to shrink the price gap between state-sponsored and private care
On the deal front, private equity investors continue to trade dental platforms, and dental platforms continue to buy practices. Core Equity, owner of Portman
Dental Care, doubled down by acquiring Dentex Health, and CapVest bought Rodericks Dental with plans to takeover Dental Partners Group. Despite low levels of consolidation nation-wide, the Rodericks-Dental Partners deal faced scrutiny over market power in some locales but was recently allowed by regulators. Furthermore, the market for individual and group practices remains hot. For example, Scottish consolidator, Clyde Munro grew from 50 to 75 practices between 1H21 and 2H22 via single-practice and smallgroup acquisitions. With rising borrowing costs for investors and increased credit risk for lenders, we anticipate a focus on growth via smaller deals going forward.
Continental European dental markets
Within Western Europe, dental market dynamics and commercial opportunities, are dictated by payor mix, regulation, and labour supply.
The three main payor types include state-sponsored social medical insurance (SMI), private medical insurers (PMI),
and patients, and coverage models fall into three categories: limited, partial, and comprehensive based on the treatments covered (see Figure One). Because marginally free is the first port of call, within each country, the level and supply of services provided by the state dictate the rest of the payor landscape. In places with limited coverage, only basic treatments for vulnerable populations are provided by the government and the rest is funded personally. Under partial coverage models, patients bear 25‒80% of the cost for clinically necessary treatments through co-payment. While treatments such as orthodontics and implants can be clinically necessary and may confer statutory coverage, most of these procedures in adults are paid for privately. In addition to the services offered under partial coverage, comprehensive payors reimburse for preventative treatments and sometimes incentivise patients for regular attendance.
Regulation on dental practice ownership also varies by geography. Some countries preclude majority stake ownership by non-dentists, while others bar large dental groups from entering oversupplied areas.
44 | Sector Insights Healthcare Insights
Ty Lantz and Stephanie Yeung examine the state of dentistry across the UK and larger European countries and discuss some of the big trends affecting dentistry everywhere
Regulatory oversight not only affects investment opportunities, but also the day-to-day operations of a practice. Answering to multiple governmental regulatory bodies in rigid environments burdens clinicians and limits the proportion of time that they can provide care. Limitations on advertising also affect the strategies that dental business use to attract and retain patients.
Labour economics hinge on three factors: dental education, immigration, and workplace participation. The number of seats in dental schools is typically set by regulators but is influenced by third-party associations such as the General Dental Council and its counterparties abroad. These societies also influence laws recognising foreign training and accreditations, and the number of dentists abroad that speak the native language is a hot topic regarding disruption. This is more relevant in places like the UK where dentists from commonwealth countries speak English as a first language, like in India, than in places like Germany.
[IN THE UK] 63% OF CURRENT DENTAL STUDENTS ARE FEMALE AND WE HEAR OF SIMILAR TRENDS ABROAD
However, the possibility of a labour glut from lower-cost-of-living countries has largely been squashed by arduous and expensive cross-border accreditation programs thus far. Finally, the biggest factors affecting workforce participation today are the shifting demographic of dentists from older men to younger women and
the accompanying lifestyle preferences. In the UK, according to the British Dental Journal, 63% of current dental students are female and we hear of similar trends abroad.
Interestingly, when considering the impact of these elements on dental activity at a high level, no sweeping trends stand out. For instance, Italy and Germany have very different payor dynamics but comparable dental attendance, while The Netherlands and the UK have similar workforces and levels of insurance, but the Dutch go to the dentist 3x more than the British (see Figure Two). However, a deeper look at each market reveals the idiosyncratic effects of each dimension on care provision and the commercial landscape. Let’s take a quick look at the German, French, and Spanish dental markets to see these factors in action.
Germany
As one might expect, the German dental market is highly explicit in its regulation.
Sector Insights | 45
NOTE 1 OUT OF POCKET SPENDING IS A COMBINATION OF BOTH DIRECT PAYMENTS FOR UNCOVERED SERVICES AND COST-SHARING PAYMENTS FOR COVERED SERVICES SOURCE OECD; MANSFIELD ADVISORS RESEARCH AND ANALYSIS 68.9 7.1 24.0 1.8 1.2 Germany 16.7 16.6 12.5 66.7 80.7 France 28.4 48.3 51.6 Belgium 56.1 43.9 6.8 Sweden 38.3 9.4 52.3 UK 52.6 Spain 15.7 31.7 Netherlands 71.6 Norway Switzerland 97.1 Public (including compulsory social health insurance) Out-of-pocket1 Voluntary health insurance Level of statutory dental coverage Comprehensive Limited
ONE %, OUT OF POCKET, VOLUNTARY HEALTH INSURANCE AND PUBLIC SPENDING FOR DENTAL CARE AS % OF TOTAL DENTAL EXPENDITURE, 2020
FIGURE
In 2019, the Service and Supply Act (Terminservice und Versorgungsgesetz, TSVG) was introduced in Germany to restrict private investment in dental clinics and incentivise dental service expansion in underserved areas.
Regulators permit dental businesses to enter a locale based on the distribution of existing businesses and market shares.
For example, Medical Care Centres (Medizinisches Versorgungszentrum, MVZ), which offer a range of medical services including dental, are permitted to enter and service up to 20% of the market in underserved areas, while in more competitive areas, per-MVZ market share cannot exceed 5%.
Personal insurance is government-mandated and available as social insurance or PMI. Nearly nine in ten Germans are eligible for, and covered by, SHI plans, referred to as sickness funds while high earners must join PMI plans.
Co-payments are required for advanced treatments such as crowns and bridges, but a subsidy reduces out-of-pocket expense if a patient has record of annual appointments. Substantial public expenditure, revenue defensibility by regulation, and high utilisation make the German market an attractive infrastructure-like play for dental businesses, if one can break in.
France
In France, dental costs are shared across the government, PMI, and the patient nearly equally. Social health insurance only covers check-ups, fillings, and extractions so supplemental private insurance is popular. However, new laws such as ‘100% Santé’ have increased coverage of dental prostheses, capped prices of prostheses not typically covered, and reduced patient co-pays.
Plans to extend free annual checkups for people up to 24-years-old and increase government reimbursement for preventive and regular care, by up to 144% for some procedures, are also expected to increase the proportion of regular dental attendees and benefit dentists.
Regulation regarding practice ownership, advertising, and pricing has kept the market fragmented thus far, but some corporates, such as G Square’s Dentego, are wading in.
In France, law stipulates that practices must be majority owned by dentists. Corporate consolidators address this by distributing legal ownership across multiple dentists. Similar laws exist in the United States where investors have found a comfortable home in the Dental Services Organisation model, and time will tell if a complementary arrangement will take-off in France.
Spain
Spanish dentistry is characterised by free market economics, much like the US market. State coverage is limited to emergency dental care, such as extractions, and only for the poor. The market is fragmented but sits closer to the UK on consolidation than France or Germany. Outside of the typical corporate model, some pioneering dentists have had success building large multi-specialty practices.
Spain educates far more dentists per capita than the UK and has, on average, smaller practices. However, more dentists in more practices chasing fewer patients has not resulted in severe price competition. Per-capita spend sits between the UK and France (see Figure Three), despite lower per-capita GDP, likely due to cultural norms about cosmetic dentistry. The abundant supply of dentists, loose restrictions, and the high standard of care make Spain an attractive market for investment.
So dentistry provision is varied and different markets are attractive for different reasons, what else is going on?
Dental workforce
The labour mix in dentistry is changing. Baby-boomer dentists are retiring, and the traditional aspiration of practice ownership is being eroded by regulatory burden in some markets. Furthermore, younger associates are burdened with student debt with limited real-income gains over the past decades.
In the UK, fee income for a typical dental associate has fallen by 20% in real terms in the last ten years. Dental workforce surveys find that dentists increasingly prioritise flexibility and part-time opportunities when looking for work, partly due to the feminisation of the profession; more dental graduates are females who prefer part-time work when starting a family. Larger dental businesses are better suited to providing a flexible schedule, but dentists worry about loss of clinical freedom when working in corporates. We believe human resources can be a source of competitive advantage in labour-constrained markets, and flexibility is equally important in both clinical and lifestyle domains to attracting dentists.
There is growing focus on more effective use of skill mix in the dental team. Some businesses are leveraging hygienists and therapists to free up dentists to focus
46 | Sector Insights Healthcare Insights
ADVISORS RESEARCH AND ANALYSIS 40 2.5 1.5 60 65 80 70 75 90 45 0 50 0.5 1.0 85 55 UK ES BE CH IT Dentists per 100,000 population Consultations per person DE FR NL Comprehensive Partial Limited Insurance Coverage
NOTE
BE BELGIUM CH SWITZERLAND DE GERMANY ES SPAIN FR FRANCE IT ITALY NL NETHERLANDS UK UNITED KINGDOM SOURCE EUROSTAT; OECD; MANSFIELD
FIGURE TWO
NUMBER OF PRACTISING DENTISTS, PER 100,000 POPULATION, AND DENTAL VISITS PER PERSON ‒ PER YEAR, 2020 (OR LATEST YEAR)
on high-value procedures and maximize chair utilization. In some countries, the UK for instance, dental hygienists and dental therapists can carry out preventive treatments from gum cleaning to simple restorations including fillings.
For example, many dentists perform a scale and polish in c.30 minutes for £70 and a crown in c.60 minutes for £700, which is a 5x difference in per chair-hour revenue.
Scopes of practice for dental team members will vary by geography, but efforts in many countries to steer dentistry toward prevention necessitate expansion of the dental workforce to improve access to care.
Looking beyond clinical staff, use of non-clinical support staff such as treatment coordinators can further optimise use of dental chair time to help patients choose treatments.
Consumer demand
In November 2021 Mansfield Advisors wrote about increasing demand for cos -


metic dentistry and the confluence of aesthetic and standard-of-care treatments. In the face of rising living costs, there are secular trends that support long term demand, at least for general dental care.
Many countries are still playing catch-up from missed dental appointments during the pandemic. Over the past two years, postponed dental work resulted in worse dental disease and more significant restorations needed. For example, what was initially early decay that could have been addressed by a filling has escalated to now needing a root canal treatment and a crown. Spurred by pain and a significant expense, smart patients will schedule their preventative appointments for the coming years. Furthermore, longer life expectancy and better whole-life oral health results in people retaining more natural teeth for longer, and these teeth tend to need care later in life. As people age, and these teeth inevitably fail, and implants are the preferred choice. Implants last longer, look better, and are more comfortable than removable dentures; they are also more expensive.
Conclusion
Across Europe, markets are fragmented, and regulation is a key driver of investment theses. However, dentistry has been an enduringly profitable sector everywhere, and we believe the diversity of markets across the channel provides opportunities for varying risk appetites.
Investors seeking growth companies might look in less regulated countries such as Spain while those valuing revenue defensibility should look for comprehensive social health insurance programs, like in Germany. Others still may try a balanced approach via a multi-market platform like Nordic Capital has done with European Dental Group.
The trends we identify in payor mix, regulation, and labour economics reinforce the importance of country-specific expertise to operate efficiently and keep investors smiling.
Sector Insights | 47
OECD; MANSFIELD ADVISORS RESEARCH AND ANALYSIS 23.9 8.9 7.3 7.2 5.5 3.0 2.8 1.7 0 50 100 150 200 250 300 350 400 20 0 5 10 15 25 30 ES CH £, Per Capita Spend % Corporates DE FR NO Market Size £bn FIGURE THREE % OF CORPORATE CONSOLIDATION, PER CAPITA SPEND AND
MARKET
SOURCE
DENTAL
SIZE, £M


Female pharmaceuticals gaining prominence

Women’s health encompasses more than gynaecology and obstetrics, but includes specific treatments that support women to live full lives without discomfort, and special formulations for universal conditions that disproportionately or differently affect women. These latter conditions consist of less obvious diseases, particularly heart and autoimmune problems (see Table One). It is essential that there are pharmaceuticals designed and tested with women in mind.
Women represent just over 50% of the population in developed countries, and given the prevalence of conditions such as endometriosis at 10% and the 100% incidence of menopause, there is a high unmet need for pharmaceutical
treatments. Despite this, only about 1% of healthcare R&D spending targets this segment.
Depending on the definition, the global women’s drug segment amounts to between US$35bn and US$55bn in size, and is generally thought to be growing at around 5% per year. In addition to the US, the UK and Germany are also important markets for the rapid introduction of new drugs due to the extent of private spending.
Market activity
Both private equity and pharma companies have been busy investing in promising women’s health specialists, a few of which are shown in Table Two.
The largest transaction was the acquisition of Myovant Sciences by Sumivant Biopharma for €2.5bn in October 2022. Myovant focuses on uterine fibroids, endometriosis, prostate cancer, and infertility. Myovant developed MyFembree, a oncea-day therapy for the management of pain associated with endometriosis, which was approved by the FDA in August 2022. MyFembree, along with Orlissa by Abbvie, which gained FDA approval in 2018, is a major step forward in the treatment of a condition for which there are very few options.
Another notable transaction was the March 2022 acquisition of Theramex by the Carlyle Group and PAI Partners for approximately €1.4bn from CVC Capital Partners. Theramex is a pharmaceutical
48 | Sector Insights Pharma Insights
Penny Sherlock and Adam Scott examine the opportunities for pharmaceuticals in women’s health
AND THOSE THAT AFFECT WOMEN DIFFERENTLY LARGELY WOMEN SPECIFIC GENERAL HEALTH CONDITIONS
REPRODUCTIVE GYNAECOLOGICAL ONCOLOGICAL AFFECT DIFFERENTLY AFFECT DISPROPORTIONATELY
Fertility e.g. IVF Endometriosis Breast cancer Cardiovascular disease Autoimmune disease
Contraception e.g. oral pill, IUD Uterine fibroids Cervical cancer Strokes Migranes
Menopause PCOS Ovarian cancer Mental health Osteoporosis
SOURCE ROYAL COLLEGE OF NURSING; MANSFIELD ADVISORS ANALYSIS
business focusing exclusively on women’s health, including contraception, menopause, osteoporosis and fertility, specifically low luteinizing hormone levels.
Merck spun-out Organon in June 2021 and has since acquired platforms in adjacencies to pharmaceuticals within women’s health such as the Jada system, a medical device for control and treatment of abnormal postpartum uterine bleeding
TABLE TWO
or haemorrhage. In 2022 it registered revenues of US$6.2bn with an EBITDA of 33.5‒34.5%.
KaNDy Therapeutics was acquired for US$425m in 2020 by Germany’s Bayer. KaNDy has a drug in late-stage clinical trials. It is a first-in-class, once daily, dual mechanism neurokinin-1,3 receptor antagonist that would be a break-through treatment for common ‘hot flushes and
night sweats’, i.e. vasomotor symptoms. This non-hormonal approach is suitable for a much larger patient group. If approved, projections suggest US$1bn in potential annual sales.
The Japanese company, Astellas, is also reported as looking to build a portfolio in the segment.
Remaining independents include Viramal (2013), Fervent Pharma (2011),
RECENT TRANSACTIONS ‒ PRIVATE EQUITY HOUSES AND INDUSTRY PLAYERS HAVE RECENTLY MADE LARGE INVESTMENTS IN THE PHARM FOR WOMEN SPACE


Pharmaceutical company focused on helping people with uterine fibroids, endometriosis, prostate cancer, or infertility
Pharmaceutical company with therapeutic focus in family planning, reproductive health, and menopause management
Pharmaceutical business focusing on women’s health conditions including contraception, menopause, osteoporosis and fertility
A clinical-stage drug development company focused on novel treatments in women’s health. Pioneering the use of intracrinology to treat endometriosis
Medical device company focused on preventing maternal morbidity and mortality caused by postpartum haemorrhage (PPH)
A clinical stage biotech company focused on developing drugs for menopausal symptoms


Aug-2020 $425m
Sector Insights | 49
WOMEN'S HEALTH ‒ WOMAN’S HEALTH INCLUDES RECOGNISED
SPECIFIC CONDITIONS
TABLE ONE DEFINING
WOMEN
COMPANY DESCRIPTION ACQUIRER DATE DEAL SIZE
Oct-2022 $2,500m
Jun-2022 $177m
Mar-2022 $1,400m
Nov-2021
$950m
Jun-2021
$215m
SOURCE ROYAL COLLEGE OF NURSING; MANSFIELD ADVISORS ANALYSIS
CLINICAL TRIALS ‒ THE NUMBER OF CLINICAL TRIALS FOR WOMEN'S HEALTH CONDITIONS HAVE BEEN GROWING, PARTICULARLY TARGETING ENDOMETRIOSIS
Consilient Health (2005) and Daré Bioscience (2005). Viramal has an active drug pipeline of five drugs in Phase II or beyond, including one for vaginal health at market authorisation stage.
Fervent Pharma is entering Phase II with its lead compound P-101, a non-hormonal treatment that, in preliminary studies, has been shown to be effective in treating vasomotor symptoms. Consilient Health is a commercialisation partner for products targeting women’s health, with a portfolio of around 30 drugs.
Daré Bioscience has a pipeline of six drugs in phase I or beyond, with a drug targeting bacterial vaginosis developed in collaboration with Organon that has gained FDA approval.
Research activity
The number of clinical trials for major conditions in women’s health (of a subset that we analysed) has increased by around 7% from 2004, although trial numbers have suffered in recent years due to Covid-19, as demonstrated in Figure One.
Trials targeting endometriosis have grown the most, from 11 in 2004 to 63 2019, catching up on research efforts for
menopausal symptoms. As would be expected, menopausal symptoms have consistently been the most targeted condition as it targets the largest patient pool.
Women’s health pharmaceuticals: the history
The history of pharmaceutical R&D for women’s health has been affected by several major turning points. The earliest was the thalidomide catastrophe. Promoted as diminishing the nausea associated with morning sickness, it was later discovered to degrade an essential protein for foetal development. It caused surviving children to be born with missing limbs and other disabilities. Between 1957 and 1961, around 10,000 children were affected and 40% died before their first birthday.
The pharmaceutical industry reacted to the realisation that drugs could cross the placental barrier and endanger a baby by shifting to running clinical trials without women. The move was made to avoid the risk of undetected pregnancy and any effect from ‘fluctuating hormones’. As such, drugs were tested only on male
physiology. In 1977, the US Food and Drug Administration (FDA) issued formal guidance that women of childbearing age should not be included.
For a long time, drugs were approved without knowledge of any specific effect on women, and the development of drugs for women’s health was made more challenging.
In 1985, the UK’s ‘Public Health Service Task Force for Women’s Health’ argued strongly for women to be in enrolled in clinical trials, though it took time to become established practice. In 1993 the US Congress similarly led the way, mandating the National Institutes of Health to include women in trials.
The next controversy began in 2002 surrounding Hormone Replacement Therapy (HRT).
HRT was first introduced in the 1960s, promising to reduce the effects of menopause. HRT usage soared in the 1980s when the FDA approved its use for osteoporosis, not only ‘hot flashes’, and so changed its pattern of usage to chronic, requiring repeat prescriptions. By the 1990s, the HRT market had revenues of around US$2bn. It had become the most prescribed drug type in the US.
50 | Sector Insights Pharma Insights
MANSFIELD ADVISORS ANALYSIS 61 57 60 59 65 53 58 60 57 57 62 51 74 80 88 89 64 94 71 11 19 11 10 10 15 16 16 27 30 29 31 42 35 49 60 63 52 54 13 21 26 21 31 33 27 39 54 40 40 38 47 45 50 46 45 44 36 3 13 3 6 4 5 13 14 27 23 33 28 31 16 36 37 33 21 20 8 7 13 8 21 14 22 19 29 18 26 32 25 29 29 30 23 21 21 ’04 Endometriosis ’09 96 PCOS ’05 ’07 ’19 ’08 180 Uterine Fibroids ’10 ’11 ’12 ’13 ’14 ’15 ’16 ’17 ’18 ’20 ’21 ’22 Menopause PPH 190 113 ’06 117 104 148 131 120 136 194 168 228 219 205 252 262 232 202 +6 9% -8 3% CAGR Covid-19 impacted ’04-’10 18 4% ’11-’16 ’17-’22 5 6% -6 3% 27 7% 17 2% 4 6% 13 0% 3 8% -4 4% 6 4% 21 3% 9 1% -0 8% 4 3% -2 4%
SOURCE CLINICAL TRIALS.GOV;
FIGURE ONE
Yet a 2002 article by the Women’s Health Initiative reported an increased breast cancer and cardiovascular risk in some women taking HRT. Subsequently there was an 80% decline in global usage for menopausal symptoms.
Further studies quickly determined that the risks were overstated, but so were the purported benefits of HRT. New risk-minimising guidelines were developed, but sales have never since fully recovered. This discouraged investor interest in not just hormonal therapy, but any area where the effect of hormonal fluctuation was not well understood – that is, all of women’s pharma.
Market drivers
A massive factor now driving the market is the growth of patient support and activist groups.
Patient advocacy and involvement has highlighted the need for more research into conditions such as endometriosis, Polycystic ovary syndrome (PCOS) and debilitating menopause symptoms. Researchers and companies have taken note and begun investing in research for pharmaceuticals and diagnostics, which
will help with development of new therapeutics.
The increase in patient interest and the growing public conversation surrounding women’s health conditions (of a subset we investigated) can evidently be seen in the increase in Google searches, as shown in Figure Two. The condition that has seen the greatest increase in search activity is PCOS, with the number of searches jumping significantly in 2020.
Menopause has captured an audience beyond those that directly suffer from it as the wider impact on society and the economy has come to light, with estimates putting associated global productivity losses at €150bn.
This is being translated into a burgeoning occupational health market aimed at supporting women through the menopausal transition.
Looking ahead at women’s health
The market for women’s health therapeutics is expected to grow over coming years, with success for players such as Myovant and KaNDy potentially drawing
larger pharma companies into investing more in R&D for women’s health conditions. The market will be self-reinforcing with a cycle of more research leading to more drug candidates and commercialised products, creating more funding for more research, in turn leading to more drugs on the market.
The development of therapeutics will work alongside that of improving diagnostics, from improved services and technologies, with more people having access to a diagnosis.
Many therapeutic areas are at ‘tipping points’, such as endometriosis, for which two drugs targeting the associated pain were released in 2018 and 2022. Non-hormonal drugs for menopausal symptoms also have the potential to revolutionise treatment for millions of women, with KaNDy Therapeutics’ NT-814 leading the charge.
It is an exciting time for pharma companies, both broad and specialised, that are investing in the women’s health therapeutic area, as well as the investors backing them. But more importantly, it is an optimistic time for women who, for the first time, can look forward to their own specific needs being treated as a priority.
Sector Insights | 51
NOTE 1 INSUFFICIENT DATA BEFORE 2012 SOURCE GOOGLE TRENDS; MANSFIELD ADVISORS ANALYSIS 0 0 0 5 1 0 1 5 2 0 2 5 3 0 3 5 4 0 4 5 5 0 Endometriosis Menopause PCOS Uterine fibroids1 ’04 ’14 ’16 ’18 ’20 ’22 ’06 ’08 ’10 ’12 ’04-’10 ’11-’16 ’17-’22 -2 2% 5 2% 13 5% -3 9% 8 3% 13 6% -5 7% 6 7% 9 9% -3 1% 5 6% 7 9% CAGR
FIGURE TWO
ACCELERATING RATE GOOGLE SEARCHES INDEXED TO JANUARY
AVERAGE,
ONLY
SEARCH TRENDS ‒ SEARCHES FOR PREVALENT WOMEN’S HEALTH CONDITIONS HAVE BEEN INCREASING AT AN
2004, ROLLING SIX MONTH
UK
Immunoassays, a non-therapeutic application of antibodies, have been a mainstay of diagnosis and research since the 1950s. Victor Chua and Will Johnson discuss trends in the non-therapeutic antibodies market and identify how investors can create value


Investing in non-therapeutic antibodies
Antibodies are a critical component of immunoassays that may take the form of a CE-marked commercialised test used to diagnose medical conditions or infection, or as a laboratory test as part of fundamental research toward discovering the next generation of drugs. The lateral-flow test is an example of an immunoassay that we are now all very familiar with following the Covid-19 pandemic.
Given their technical and highly specific nature, antibody development and manufacture is still a relatively fragmented industry, but there has been increasing consolidation over the past five years from investor-backed life science platforms such as Medix Biochemica (DevCo), BBI Solutions (Novo Holdings), Absolute Biotech (Thompson Street Capital Partners), and Biosynth (KKR); as well as from large, listed firms such as ThermoFisher and Abcam.
Non-therapeutic antibodies are a highly attractive proposition for investors thanks to a combination of naturally global customer markets (research and IVD) with growth drivers, a fragmented manufacturing base ripe for consolidation, and the promise of exits to large strategic life science players.
Activity in the antibodies space has been increasing year-on-year since 2018, primarily in the form of bolt-on acquisitions to existing platforms but also as larger buyouts (see Table One). A noteworthy recent example is ThermoFisher’s acquisition of The Binding Site Group, a vertically integrated IVD, from Nordic Capital and Five Arrows in 2022 for c.US$2.3bn.
Non-therapeutic attraction
Investors have already played a significant role in this attractive sector in recent years, and the opportunities for future investment remain.
Differentiation based on specialisation
A SKILLED DEVELOPER CAN DIFFERENTIATE ITSELF FROM THE COMPETITION AND OCCUPY A NICHE IN THE MARKET BY POSITIONING ITSELF AS THE PROVIDER OF THE BEST ANTIBODIES FOR TESTING TARGET ‘X’ BIOMARKERS
Antibodies are the key reagents in a diagnostic or research immunoassay as the component responsible for specific detection of the target compound or biomarker being tested for. This means unique antibodies must be developed for any given test based on the investigated target (see Figure One).
Development and manufacture is technical and builds on biochemistry expertise, but the level of expertise required varies across three broad categories of antibody, each with slightly different practical traits but addressing the same customer groups.
Monoclonal antibodies are the purist and are generally the most desirable for customers looking for tests to be as accurate and repeatable as possible. They are, however, more technically difficult to develop and produce than polyclonal alternatives, which are typically more variable. There is also a smaller but growing cohort of recombinant monoclonal antibodies made entirely in vitro without any need for live animals in manufacturing – these are the most difficult and costly to develop but are considered the ‘gold standard’, providing the greatest predictability and control over both the manufacturing process and functionality of the antibody itself.
The main criteria for customers purchasing antibodies, either as part of a complete testing kit or as a reagent to use in kits they themselves manufacture, is usually quality. This is due to the antibody’s specificity for its target, and the
52 | Sector Insights Life Science Insights
NOTE


Capture


consistency by which it detects it, being one of the most important determinants of the final immunoassay’s accuracy.
A skilled developer can therefore strongly differentiate itself from the competition and occupy a niche in the market by positioning itself as the provider of the best antibodies for tests targeting ‘X’ biomarkers. Good developers have strong pricing power and can be highly profitable. Developers can further protect their commercial position further by developing ‘antibody pairs’ or complete testing kits to sell OEM, both of which can be protected by patents. Indeed it was IP protection that proved the attraction for investors in Hytest (previously Summa Equity) during its 2021 sales process.
The focus on quality also means that firms of any size can succeed in this market, and smaller players with a good product in a particular niche can compete with large-scale life science generalists like Meridian Bioscience and ThermoFisher – as long as they supply excellent unique products.
IVD and research markets naturally global
The market for non-therapeutic antibodies as reagents in IVD or research totals c.US$6bn depending on exact definitions. While this is orders of magnitude smaller than the market for pharmaceutical biologics/therapeutic antibodies, it is still large enough to support numerous global players. Companies with antibody expertise can also ascend value chains by expanding capabilities to develop and commercialise complete immunoassay testing kits and the instruments to read test results (see Figure One).
The market for complete diagnostic (IVD) immunoassays and instruments is much larger than the antibodies-as-reagents market at c.US$30bn.
For example, in the early-2000s The Binding Site Group developed a widely accepted polyclonal assay (Freelite), where much of the work validating Freelite as an assay was carried out by academia (notably the Mayo Clinic) rather than the company itself. It supplied assays to
studies at no cost.
Offering custom antibody development services for IVD and research customers adds an additional c.US$500m to the global market, providing an additional revenue option for skilled antibody developers.
Research antibodies is the fastest-growing non-therapeutic antibodies market and is expected to continue growing at over 5% per year for the next five years.
The other significant end-user market, diagnostic immunoassays, is expected to grow at a more modest 3‒4% per year. While relatively slow compared to newer diagnostic technologies such as genomics/molecular biology, it contains high-growth segments such as point-ofcare lateral flow tests (forecast at over 7% annual growth).
Sector Insights | 53
1 COMBINATION OF ANTIBODY TYPES DEPENDENT ON TYPE OF IMMUNOASSAY E.G. SANDWICH VS. DIRECT ELISA SOURCE MANSFIELD RESEARCH AND ANALYSIS Ascending Immunoassay Value Chain Primary detection antibodies
antibodies Secondary antibodies Antigens Used as reagents or controls ANTIBODIES1 Markers Attached to detection antibodies Enzyme substrate When using an enzymatic market Buffers Standard lab reagents acting as reaction medium Research Kit Bundled reagents sold directly to research customers Clinical labs Hospitals Healthcare professional Biotech research labs Academic labs Pharma OEM reagents kit Bundled reagents to be sold to IVD company Approved diagnostic test kit Certified diagnostic test commercialised by IVD company Test-specific critical reagents Assembled immunoassay test kits Test-agnostic standard reagents End users Diagnostic use Research use
OF
AND STANDARD REAGENTS –
THE QUALITY
As a whole, demand in the diagnostic market is being driven by the overarching trend towards more personalised medicine in healthcare – something that will become increasingly dependent on specific ‘companion’ diagnostic tests to check patient eligibility for increasingly FIGURE ONE IMMUNOASSAY VALUE CHAIN
IMMUNOASSAYS USED IN DIAGNOSTICS (IVD) AND RESEARCH CONTAIN A NUMBER
TEST-SPECIFIC
ANTIBODIES ARE SOME OF THE HIGHEST-VALUE COMPONENTS WHICH DETERMINE
OF THE FINAL IMMUNOASSAY
54 | Sector Insights Life Science Insights TABLE
NON-THERAPEUTIC ANTIBODY RELATED INVESTOR MARKET ACTIVITY Name HQ country Deal year Acquirer (and backing) Est. revenue at sale Cambridge Research Biochemicals UK 2023 Biosynth (KKR) US$5‒10m Ozyme France 2023 Dutscher (LBO France) US$5‒10m ProSci US 2023 Genesee Scientific (LLR Partners) US$10‒25m Fitzgerald Industries International US 2023 Biosynth (KKR) <US$5m Meridian Bioscience US 2023 SD Biosensor (Listed); SJL Partners US$300‒350m SAL Scientific UK 2022 Advanced Instruments (Patricia Industries) <US$5m The Binding Site Group UK 2022 Thermo Fisher Scientific (Listed) US$200‒250m Biotiz (& Steffens-Biotec) Germany 2022 BBI Solutions (Novo Holdings) US$5‒10m Adx NeuroSciences Belgium 2022 Fujirebio (HU Group, Listed) US$5‒10m Euprotein US 2022 Meridian Bioscience (Listed) <US$5m Aalto Bio Reagents Ireland 2022 Biosynth (KKR) US$5‒10m Vivitide US 2022 Biosynth (KKR) <US$5m Cambridge Bioscience UK 2022 Nordic Biosite (Adelis) <US$5m Arista Biologicals US 2021 Fortis Life Science (Summit Partners) US$5‒10m Evitria Switzerland 2021 Atlas Antibodies (Patricia Industries) US$10‒25m Diaclone France 2021 Medix Biochemica (DevCo) US$10‒25m BBI Solutions1 UK 2021 Novo Holdings US$75‒100m LINARIS Biological Products Germany 2021 CalibreScientific (StoneCalibre) US$10‒25m HyTest Finland 2021 Shenzhen Mindray Bio-Medical Electronics US$25‒50m BioVision US 2021 Abcam (Listed) US$25‒50m Bethyl Laboratories US 2021 Fortis Life Science (Summit Partners) US$10‒25m Nanocomposix US 2021 Fortis Life Science (Summit Partners) US$5‒10m Biosynth1 Switzerland 2021 KKR US$50‒75m Szabo Scandic Austria 2021 Nordic Biosite (Adelis) <US$5m Nordic BioSite1 Sweden 2021 Adelis US$5‒10m Absolute Antibody UK 2020 Absolute Biotech (Thompson Street) US$5‒10m The Native Antigen Company UK 2020 LGC (Cinven, Astorg, ADIA) US$5‒10m Biostride US 2020 Medix Biochemica (DevCo) US$5‒10m EastCoast Bio US 2020 Medix Biochemica (DevCo) US$10‒25m Scicons Hungary 2020 Absolute Biotech (Thompson Street) <US$5m Diarect Germany 2020 BBI Solutions (Exponent) US$10‒25m Expedeon (Proteomics business) Germany 2020 Abcam (Listed) US$10‒25m Calico Biolabs US 2020 Abcam (Listed) US$5‒10m Dianova Germany 2020 CalibreScientific (StoneCalibre) US$5‒10m Agrisera Sweden 2020 Olink (Listed) <US$5m Mabtech1 Sweden 2019 IK Partners, Merieux Equity Partners US$10‒25m
ONE
TABLE ONE
NON-THERAPEUTIC ANTIBODY RELATED INVESTOR MARKET ACTIVITY
specific treatments. A significant number of these will be immunoassays built using antibodies. Serology testing used in clinical trials for new vaccines, a high-growth segment in pharmaceuticals, also utilises immunoassays. Overall, both non-therapeutic antibody markets are attractive to investors with robust and dependable end-user market drivers.
Strategies
Antibody development competencies can underpin a positioning across many parts on the IVD and research industry verticals. The Binding Site and BBI Solutions are two examples of players in this field building out from antibody development expertise (see Figure Two).
The Binding Site Group
Built upon expertise developing anti-sera and polyclonal antibodies detecting myeloma biomarkers. It launched its own diagnostic tests under the Freelite brand in the 2000s, becoming an IVD company. At the same time it offered to sell its antibodies alongside custom development services for other IVD customers. Under Nordic Capital and Five Arrows its range of diagnostic testing kits expanded significantly, and its footprint grew globally. The group recently discontinued selling antibodies as reagents to competitors, locking-in its position as a true IVD. Keep-
ing its antibodies in-house also prevents competitors using them to develop diagnostic tests to rival its own. It was sold to ThermoFisher in 2022 at a valuation over US$2.5bn.
BBI Solutions
BBI has taken a different path. Originally experts in assay-agnostic reagents, the group gained antibody development capabilities by acquiring Maine Biotechnology Services in 2018 with financial backing from Exponent. The acquisition made BBI a one-stop-shop reagents provider for IVD customers, offering all immunoassay components from assay-agnostic markers to test-specific antibodies. Additional acquisitions of Diarect (2020), Biotiz and SBA (both 2022 under Novo Holdings ownership) in Germany expanded the group’s expertise further up the value chain to enable complete immunoassay kit development. It now offers a suite of immunoassay reagents, OEM test kits, and contract development services for both, to IVD customers. However, since BBI does not market any testing kits directly to end-users itself, this keeps it distinct from IVD companies like The Binding Site Group. The group has, instead, decided to focus efforts on bringing value to IVD customers, rather than attempt to commercialise assays, something that would require a completely new skillset.
Mabtech
A company at an earlier stage in its journey (based on revenue) is Mabtech (IK Investment Partners). As the original experts in commercialising ELISpot immunoassays, offering ready-to-use kits as products as well as custom assay development services, Mabtech has a strong in-house portfolio of antibodies as well as expertise in developing them. The question the company faces – as will their next investor – is where to go from here. Options include (1) pushing global sales of existing products to expand its already strong position in the research customer segment; (2) a strategic move into supplying reagents or custom immunoassay development services to IVD; or (3) expansion of its product range into adjacent biochemical technologies like genomics. The route taken will ultimately depend on management’s vision and the expertise of its next investor – be it technical, geographical, or operational (particularly important if an IVD play is considered). These examples illustrate investors adding value by helping companies to build into a specific niche, all based on the same core competency of antibody development expertise. In the case of The Binding Site Group, this value was clearly recognised by ThermoFisher being willing to pay c.25x EBITDA in the recent process.
Sector Insights | 55
Name HQ country Deal year Acquirer (and backing) Est. revenue at sale Everest Biotech UK 2019 Absolute Biotech (Thompson Street) <US$5m Smaltis France 2019 mAbexperts (Biotech Investissement Group) <US$5m Lee Biosolutions US 2019 Medix Biochemica (DevCo) US$10‒25m Nordic MUbio Netherlands 2019 Absolute Biotech (Thompson Street) US$5‒10m Umandiagnostics Sweden 2019 Quanterix (Listed) <US$5m Biorbyt UK 2018 Absolute Biotech (Thompson Street) <US$5m QVQ Netherlands 2018 mAbexperts (Biotech Investissement Group) <US$5m Maine Biotechnology Services US 2018 BBI Solutions (Exponent) US$5‒10m BioServ UK 2018 CalibreScientific (StoneCalibre) <US$5m Biozol Germany 2018 CalibreScientific (StoneCalibre) US$5‒10m LifeSpan Biosciences1 US 2018 Thompson Street US$5‒10m NOTE 1 DENOTES BUYOUT SOURCE COMPANY PRESS RELEASES, MANSFIELD ANALYSIS
PE-BACKED
INVESTORS HAVE ASSISTED COMPANIES WITH ANTIBODY COMPETENCIES BUILD INTO DIFFERENT POSITIONS ON THE INDUSTRY VALUE CHAIN

clinical labs and hospitals c $220m revenue c $2 6bn valuation

Test-agnostic immunoassay reagents for IVD customers (i e non-antibody reagents)


Acquired antibody development capability & built lateral-flow immunoassay development service
Expanded antibody and antigen portfolio via further acquisitions
Acquired ELISA (lab immunoassay) kit development capabilities
Exponent Novo Holdings
ELISpot immunoassays for research customers
Expanded immunoassay product range and launched IRIS instrument
Launched customer research antibody development service & ASTOR instrument
IK Investment Partners
Fragmented but consolidating
A key feature of both non-therapeutic antibody industries is the fragmentation of both manufacturing and development. This can partly be explained by customers’ focus on quality. A smaller lab can often make the best antibody for a given biomarker based on specific in-house knowledge, so customers seeking the best antibodies will pick the smaller lab’s product regardless of existing relationships or the stronger marketing efforts of bigger players.
Specific expertise for antibodies for certain biomarkers in a specific disease grants a lab the ‘right to exist’ regardless of scale. The consolidation process has begun to accelerate, and synergies are being realised by several investors with life science platforms.
Aside from eliminating duplicated backend operations and economies of scale in procurement, there are also significant cost savings to be made by combining R&D. Highly skilled staff may not be fully utilised at a single lab with a small range of products. The same can be said to lab equipment and bioreactors. A broader
Supplier of research immunoassay kits, instruments and test-specific reagents
Supplier of IVD reagents from testagnostic standard reagents to complete OEM test kits
Off-the-shelf reagents and contract custom assay development services for IVD & Pharma customers c $100m revenue c $510m valuation
Off-the-shelf test kits and instruments, plus contract custom assay development services for research c $35m revenue Sales process initiated
Future Direction TBD
product portfolio, larger customer base, larger order volumes, and more frequent custom development requests – all possible outcomes from a merger – can maximise utilisation of R&D departments. Benefits can also be realised by combining highly skilled teams with complementary expertise across different physiological areas.
Revenue uplift comes from the high potential for cross-selling, helping labs access a new customer list in their own market or a new geography. Having a broader product range also brings a competitive advantage with customers preferring to buy a variety of antibodies or assays from a single supplier (assuming quality still trumps the competition).
The first major player to start realising these synergies was Abcam. The firm was initially founded in 1998 with the aim to provide researchers a single contact point from which to source high quality antibodies, and help developers reach more customers.
Initially acting as a distributor only, Abcam has vertically integrated over the years through acquisitions of antibody developers and now offers an in-house product portfolio as well as custom antibody
development services. Its most recent substantial add-on was the US$300m acquisition of BioVision in 2021 (see Table One). BioVision was previously a partner for which it distributed products. While there has been a lively discussion around the company’s management and strategy, it remains one of the largest antibodies platforms with over US$450m revenue in 2022.
Several investor-backed roll-ups have been active over the last five years (see Figure Three). Some of these are pure antibodies or proteomics-focused platforms, while others are built from larger generalist life science companies.
Of the proteomics-focused players, Absolute Biotech (Thompson Street Capital Partners) has been one of the most active – a platform originally built from LifeSpan BioSciences in the US, most recently acquiring Absolute Antibody in the UK. Medix Biochemica is a larger player focused on supplying IVD reagents. Medix Biochemica originally pursued organic growth but has recently made several acquisitions around the world backed by DevCo. Similarly, BBI Solutions (Novo Holdings) has also expanded its antibody and services portfolio through the Diarect, Biotez and SBA acquisitions.
56 | Sector Insights Life Science Insights
SOURCE COMPANY WEBSITES; MANSFIELD RESEARCH AND ANALYSIS 2023 Position and offering IVD company marketing diagnostic tests focused on Myeloma and Immunological disorders Company Progression and investors Polyclonal antibodies for research and IVD customers Launched commercialised immunoassays under Hevylite’ & Freelite brands alongside instruments Expanded testing kit product range and global footprint Discontinued OEM supply of antibodies & contract development services Initial offering Nordic Capital & Five Arrows ThermoFisher Range of CE-marked diagnostic tests and reader instruments supplied to
FIGURE TWO
ANTIBODY BUSINESS STRATEGIES
Broader life science reagent companies actively acquiring small antibody developers include Biosynth (KKR) and LGC (Cinven; Astorg; ADIA). LGC initially operated in controls and standards, then expanded to genomics reagents, and moved into proteomics by acquiring The Native Antigen Company in 2020. Smaller life science generalists acquiring antibody developers include Fortis Life Sciences (Summit Partners), Calibre Scientific (StoneCalibre) and mAbexperts (Biotech Investissement Group). Nordic Biosite (Adelis) is a platform pursuing a different model, acquiring regional distributors rather than manufacturers to build a pan-European distributor.
One reason behind the recent wave of consolidation could be the preponderance of small-scale antibody developers founded in the 2000s or early 2010s – many with a single/limited range of products – and only now reaching the scale to interest lower/mid-market investors.
It may also be due to increased interest from private capital across the whole life sciences sector over the last five years, and a new appreciation of the importance of research and diagnostics given the role both industries played in response to the Covid crisis. Recent private equity-driven consolidation success in other healthcare sectors – creating value through revenue/
NON-THERAPEUTIC ANTIBODIES PRESENT AN ATTRACTIVE OPPORTUNITY FOR INVESTORS OVER THE NEXT FIVE-TOTEN YEARS
cost synergies and multiple-arbitrage –has also alerted investors to the potential gains to be realised in antibodies.
Regardless of the cause, the ‘wave of consolidation’ is progressing. The emergence of US$25‒100m revenue platforms, many of which are reaching a 4–6-year hold period with their original backers, should be of interest to mid-market investors. These platforms are not yet of scale to attract the interest of large trade buyers like ThermoFisher; they can be viewed as subsequent exit opportunities (see Figure Three).


Attractive with value-add opportunities
Non-therapeutic antibodies represent an attractive opportunity for investors over the next five-to-ten years. End-user markets are resilient and contain highgrowth segments, players can differentiate themselves using specific expertise to develop niche quality products, and there are consolidation synergies that have not yet been fully realised.
Investors have multiple options when acquiring a platform in this space. A roll-up play is possible, as recent activity demonstrates, based around the thesis of value creation by realising consolidation synergies and potential multiple arbitrages on exit. Building out capabilities from a base competency in antibody development to ascend industry value chains is another option, as demonstrated by BBI Solutions and The Binding Site Group. There is also scope to take a proteomics platform into adjacent technologies like genomics.
The evolving life sciences landscape will be an exciting area over the coming decade for investors seeking to make an impact on global research and diagnostics.


Sector Insights | 57
NOTE ANTIBODY COMPANY ACQUISITIONS ONLY SOURCE COMPANY WEBSITES; MANSFIELD RESEARCH AND ANALYSIS 2018 2018 2019 2019 2020 2021 $20-25m Proteomics-focussed IVD and research reagents platform. Supplies and contract develops antibodies and immunoassay kits 2018 2019 2020 2020 2021 Proteomics-focussed IVD reagents platform. Supplies and contract develops antibodies and complete immunoassays. Recently expanded into genomics $50-75m 2021 2022 2022 2023 Proteomics and broader life science IVD a research reagents platform Supplies and contract develops antibodies and peptides $75-100m Est revenue Platform HQ Investor THERE IS A GROWING NUMBER OF INVESTOR-BACKED LIFE SCIENCE PLATFORMS ACTIVELY ‘ROLLING-UP’ THE LARGE BASE OF SUBSCALE ANTIBODY MANUFACTURERS – RANGING FROM TENS OF MILLIONS TO NEAR HUNDRED-MILLIONS IN REVENUE
THREE INVESTOR-BACKED ANTIBODY ROLL-UPS
FIGURE
he global animal feed market is estimated at US$500bn, including additives at US$41bn, and both are growing faster than the population at 4%.1 The mix is changing towards more valuable livestock-based product. Arabella Zuckerman and Adam Scott consider the growing importance of animal feed


No chicken feed
How often do you think about money to be made from the food for your food? Perhaps not as often as you should. Grazing and animal feed production require three-quarters of all agricultural land and are the most important economic factor for meat and fish production (see Figure One).
Better feed is a large part of animal health. Not just an obvious essential; better food helps you ‒ the reader – be healthier and more productive, and so optimal feed and supplemental additives do the same for production animals. Simply put, farmers achieve greater feed conversion ratios for any given land, water and energy use.
Two segments, aquafeed and probiotics, are growing fastest and receiving the most investment (see Figure Two).
Growth opportunities
Volumes of farmed fish surpassed those of wild fish in 2013. Aquaculture has continued to expand while wild fish catches have flat-lined. Moreover, aquaculture is the fastest-growing food production sector,2 so the need for sustainable and efficient practices has become paramount.
As such, the aquafeed market, currently estimated at US$61.8bn, is expected to surge at a 7.3% CAGR during the forecast period 2023 to 2028.3
The other segment where we believe growth is imminent is in probiotics. Probiotics are live beneficial bacteria and/ or yeast that are a natural alternative to antibiotic-based growth promoters, recognised for their capacity to safeguard animal (and human) health, enhance growth, and boost immunity and produc-
tivity. The market value for probiotics used in animal feed was around US$4.6bn in 2019, a c.8% share of the additive market by product. This market is expected to grow 7.4% annually until 2025, reaching a total value of US$7bn.4
Investment in feed
Most investment activity to date has been by large corporates acquiring assets, but private equity (PE) has been entering the market including major groups such as KKR, which acquired Yuehai Feed Group in 2021, and IK Investment Partners, which acquired Innovad, a global supplier of animal health and nutrition solutions, in 2021.
Permira sold aquatic health group PHARMAQ to Zoetis for US$765m in 2015, and in 2018 re-entered the space,
58 | Sector Insights Veterinary Insights


acquiring 50% of the shares of Grobest, an Asian aquafeed producer.
Regarding the corporate activity, Archer-Daniels-Midland (ADM), DSM-Firmenich (DSM), Evonik Industries, Bluestar Adisseo Company, Cargill Incorporated, BioMar and BASF have been developing innovative feed additives and expanding their market presence (see Table One).
In terms of PE, specifically in aquaculture, firms are investing globally in all parts of the sector. They have thus far been focused on acquiring medium-sized companies and consolidating them, horizontally and vertically (see Figure Three and Table Two).
Brink of an upgrade
Analysis of deals in the last three years showed that the majority (22/41) were in the realm of fish farming (see Table Two). We believe this has created the demand for feed, the logical next step for investment, something that was illustrated when Changing Markets spoke to Skretting, a Nutreco company and the world’s largest producer of feeds for farmed fish. They wondered, ‘In order to produce 30 million tons of fish and shrimp we probably need 45 million tons of aqua feed- where are we going to get all this?’
A key barrier to growth in aquafeed is that fish feed traditionally contains a significant proportion of fishmeal and fish oil (FMFO) sourced from wild fish, stocks of which are currently exploited to their maximum. Consequently, Rabobank remarked that ‘fish meal prices have been high and are set to remain so’. The proportion of FMFO within fish feed has already decreased since the 1990s (see Figure Four), however, there is pressure to further reduce dependence on marine ingredients and explore sustainable alternatives.
The need for viable, cost effective and sustainable alternatives to FMFO was
brought up at the Global Shrimp Forum by Ronnie Tan, a regional aquaculture consultant within the US grains council, who said, ‘for industry the number one problem is that feed prices are very high – since early-2021 shrimp feed prices have risen 25%’ and ‘the emergence of El Niño (a climate pattern causing unusual warming of surface waters) is going to reduce the availability of fishmeal and fish oil from the eastern Pacific’.
Two alternative innovations to FMFO are insect protein and algal oil. The approval of insect protein usage for aquaculture purposes by the European Union in 2017 opened new avenues for sustainable feed production. Insect protein is seen as an efficient and sustainable alternative protein; it has a favourable environmental profile, and the ability to upcycle low-value waste into a high-value ingredient.


Sector Insights | 59
INSECT INDUSTRY
CHALLENGES
COLLABORATIONS BETWEEN FEED COMPANIES AND INSECT START-UPS SHOW PROMISING SIGNS INPUT PRODUCTION PROCESSING AND DISTRIBUTION MARKETING AND SELLING State of play Changing landscape Total protein consumption volume Aquafeed Probiotics Existing PE investments so far have largely focused on farming Potential for novel sources of feed Rising middle class Urbanisation, especially in China Population growth Legislation on antibiotics Awareness about animal health and welfare ✓ ✓ ✓ ✓ ✓ ✓ ✓ ✓ ✓ ✓ SOURCE MANSFIELD ANALYSIS DRIVERS
SOURCE MANSFIELD ANALYSIS THE
FACES
[BUT]
FOOD VALUE CHAIN
FIGURE ONE THE
TRENDS
FIGURE TWO
IN AQUAFEED ADDITIVES AND PROBIOTICS
TABLE ONE
COMPANY OVERVIEWS FOR MAJOR PLAYERS IN FEED (AND ADDITIVES)
Company Industry Ownership HQ CEO Aquaculture/probiotics news

Nutrition Public US Juan Luciano

Chemical manufacturing, in health and nutrition Public The Netherlands

Dimitri de Vreeze & Geraldine Matchett
In 2022, alongside Creadev, Temasek, and Cargil, ADM helped fund Innovafeed, a producer of insect ingredients for animal feed and pet food. The funding builds on ADM’s existing partnership with Innovafeedcollaborating on the construction and operation of the world’s largest insect protein production site in Decatur, Illinois.
DSM and Evonik established a new company, Veramaris V.O.F., for the production of omega-3 fatty acids EPA and DHA from natural marine algae for animal nutrition, which began commercial production in 2019.

Specialty chemicals Public Germany Christian Kullmann
Animal nutrition

Agribusinessanimal nutrition, biofuels, meat, poultry, food, and industrial products

China National BlueStar France Dr Hao Zhigang
Private, family-owned US Brian Sikes
Evonik has expanded its probiotics production in Spain, doubling its capacity for producing Ecobiol®, Fecinor® and GutCare® to 6,000 metric tons.
Calysta and Adisseo are developing a plan to create a major alternative protein facility in Saudi Arabia.

Aquafeed manufacture Schouw & Co Denmark Carlos Diaz
Chemical manufacturing, including agricultural solutions
Publicly listed; the company’s shares are mostly held by BlackRock and private shareholders in Germany
Germany Martin Brudermüller
In 2015 Cargill Inc. bought Norwegian fish feed producer EWOS for $1.49 billion from Altor and Bain Capital.
BioMar acquired AQ1 Systems, producer of sensor-based feeding technology for aquaculture. In 2021, BioMar acquired majority ownership of the Viet-Uc feed business. Biomar acquired market share by establishing a new aqua-feed plant in Australia for Euro 40 million in 2020.
Cargill and BASF combined technologies to produce Latitude, a plant-based alternative source of omega 3 fatty acids for aquafeed, which gained USDA approval in 2019.
60 | Sector Insights Veterinary Insights
SOURCE MANSFIELD RESEARCH; COMPANY WEBSITES
Although the insect industry faces challenges related to scale and cost, collaborations between feed companies and insect start-ups show promising signs of progress. In 2019, Skretting signed a deal with Protix that could see up to 5.5 million salmon servings per year brought to market with insect meal incorporated into the feed. The largest global land-based aquaculture company, Atlantic Sapphire partnered with Skretting to include Veramaris algal oil (a joint venture of DSM and Evonik) from Q4 2021, reducing the fish oil content in its salmon feed by approximately 25% and accelerating the process of eliminating the use of marine-derived feed ingredients by 2025.
Adisseo and the largest alternative protein producer, Calysta, signed an agreement to establish a joint venture, Calysseo, to develop FeedKind®, a feed composed of naturally occurring microorganisms. Calysseo constructed the world’s first commercial FeedKind® production facility in China, which opened in 2022 and could deliver 20,000 tonnes of protein per year, exclusively for Asian markets.
We believe there is scope for a similar venture in Europe, another significant market for aquafeed, especially in countries with strong aquaculture sectors such as Norway, Spain, and the UK.
Additionally, companies have been going after vertical consolidation: animal nutrition company Alltech and Finnish fish farming circular economy company Finnforel acquired an aquafeed production facility from Raisio, enabling them to develop ‘gigafactories’ specialised in sustainable aquaculture. They control the entire production chain.
Following these trends, a private equity firm could capitalise on aquafeed growth opportunities by implementing a strategy built on sustainable practices, strategic partnerships or incorporation of alternative protein facilities and a scale up of infrastructure enabling operational efficiency.
To highlight the potential for success in the sector, in 2013, Altor and Bain Capital acquired EWOS — a leading aquafeed business — from Cermaq for NOK6.5bn (c.€830m), citing the potential to grow by focusing on R&D, developing higher quality feed and global expansion, as well as the increasing demand of consumers for healthier forms of protein. By 2015, it was sold to Cargill for €1.35bn, with Altor and
Bain Capital commenting that they had achieved significant operational improvements across all facets of the business.
Finally, investment in this sector would help reach Sustainable Development Goals (zero hunger, climate action, life below water, responsible consumption and production). For instance, salmon is one of the largest consumers of fishmeal and fish oil6 and 80% of farmed salmonoid greenhouse gas emission arises from feed production.
Furthermore, it was found that in a single year, 179,000 tonnes of salmon produced in Scottish aquaculture farms consumed fish meal and fish oil produced from 460,000 tonnes of wild-caught fish, 76% of which was edible.
Probiotics opportunities
The UK and the EU banned the use of antibiotics for growth promotion or increased yield in their livestock on 1 January 2006. Furthermore in the EU, as of January 2022, the restrictions include antibiotics for prophylactic use, and the ban has been extended to animals and animal products imported into the EU. This legislation is driving the demand for probiotics in feed additives alongside recent advances in molecular biology, and an increase in farmers’/owners’ knowledge of the positive effects of probiotics on livestock performance.
Globally, antibiotics remain widely used, with around 160,000 tons of antibiotics fed to farm animals in 2020. In two key meat-producing emerging markets, China
Sector Insights | 61
DEALS BY YEAR 6 15 9 11 2019 2020 2021 2022 DEAL SEGMENTATION 25 3 10 1 1 1 Geography (PE) Europe Asia USA Africa Middle East Oceania 41 22 10 4 2 1 1 1 Main activity Farming Processing Fishing Transportation Technology Feed Waste 41
SOURCE GRAIN (HTTPS://GRAIN.ORG/EN/ARTICLE/6932-PRIVATE-EQUITY-SHARKS-TAKE-A-BITE-OUT-OF-THE-BLUE-ECONOMY); MANSFIELD ANALYSIS
FIGURE THREE PRIVATE EQUITY DEALS IN AQUACULTURE SINCE 2019
PE HAS BEEN HEAVILY INVESTING IN THE FISH FARMING INDUSTRY, BUT SO FAR WITH MORE EMPHASIS ON THE PRODUCTION THAN THE FEED
Altor Equity Partners Nova Austral Farming 2022
Alantra Private Equity Multiple Fishing 20192022
Antin Infrastructure Partners
DESS Aquaculture Shipping Transportation 2020
Aqua-Spark Lake Harvest Farming 2022
Nova Austral is a Chilean salmon farming company, acquired in 2014 by Ewos, a Norwegian salmon feed company owned by Altor and Bain Capital. In 2015, Ewos was sold to Cargill, but Altor and Bain retained Nova Austral, and in 2022, Altor purchased Bain’s stake.
Alantra has acquired multiple fishing companies - Unión Martín, Moroccan Fine Fishing (2018), Societe Mauritanienne pour la Peche Industrielle (2019), as well as the Spanish seafood processing firm Silomar (2022).
Antin acquired Norwegian aquaculture shipping company Solvtrans (2018) and a 50% stake in another major Norwegian shipping company, DESS Aquaculture Shipping.
Aqua-Spark made its first investment with Norfund, in backing a $7M funding round for the Zambian tilapia farming company, Lake Harvest.
CapVest Partners Greenland Seafoods Processing 2020
Creadev Kingfish Company Farming 2022
Creadev Noray Seafood Farming 2022
Acquired the UK seafood company Young’s Seafood in 2019 and merged it with its pork processing company Karro Food Group to form the Eight Fifty Food Group. Acquired Greenland Seafood, one of Europe’s largest producers of frozen seafood with manufacturing sites in France and Germany. In 2021, CapVest sold the Eight Fifty Food Group to Canada’s Sofina Foods.
Creadev and Rabobank provided debt finance to expand Kingfish Company’s land-based kingfish farm in the Netherlands, and to begin commercial sales to the EU and US.
Led a fundraising round for Noray Seafood to expand its landbased shrimp farming operations. Also invested in the French biotechnology company InnovaFeed, which produces aquaculture feed from insects for animal and plant nutrition.
Ocean 14
Capital
Tilabras Farming 2020
PAI Partners Angulas Aguinaga Processing 2020
Summa Equity Nofitech Technology 2020
Torqx Capital Ocean Nutrition Feed 2022
Acquired a significant stake in the Brazilian Tilapia farming company Tilabras for $9.7M. Also have a majority stake in the Singaporean shrimp genetics and nutrition company SyAqua and a minority stake in the European clam breeding company MITO.
PAI Partners bought the Spanish seafood processing company Angulas Aguinaga from PE firm Portobello Capital. Angulas then purchased Italian marinated seafood supplier Deligusti and Spanish seafood processor Copesco-Sefrisa.
Acquired a stake in land-based shrimp farm Nofitech and had previously in 2017 acquired the Norwegian company Milarex, which operates a large salmon processing plant in Poland.
Acquired a majority stake in Ocean Nutrition Europe and Marine Nutrition Thailand, collectively known as Ocean Nutrition, a fish feed company based in Belgium.
SOURCE GRAIN (HTTPS://GRAIN.ORG/EN/ARTICLE/6932-PRIVATE-EQUITY-SHARKS-TAKE-A-BITE-OUT-OF-THE-BLUE-ECONOMY); MANSFIELD ANALYSIS
62 | Sector Insights Veterinary Insights
TABLE TWO
Main activity Year Comment
PRIVATE EQUITY DEALS IN AQUACULTURE SINCE 2019 Key interesting European PE deals PE firm Acquisition
and Brazil, the governments implemented initiatives in 2020 to prevent the use of antibiotics as growth-promoters in feed, mirroring the EU’s 2006 legislation.
If these countries follow Europe’s example, future steps may include banning the use of antibiotics prophylactically, meaning the major fallback option to keep animals’ immune systems primed will be probiotics.
Revealing a growing demand for probiotics, it was announced that Evonik has expanded its probiotics production in Spain, doubling its capacity for producing Ecobiol®, Fecinor® and GutCare® to 6,000 metric tons. Additionally, the food safety company Kersia acquired BioArmor, which produces natural products for farms, including diet feeds made from probiotics, and has been witnessing growth at a rate of 25% per annum for the past five years. According to Kersia, the merger was based on a strong potential for synergies and complementarities in terms of product ranges in the livestock market (ruminants, pigs, poultry).
Another major deal in the sector is the US$12.3bn acquisition of Chr. Hansen by Novozymes, expected to close by the end of 2023. Both companies produce biosolutions including enzymes and microbial products, however Chr. Hansen dealt more in the food sector while Novozyme had more business in household and
AS DEMAND FOR SUSTAINABLE ANIMAL FEED SOLUTIONS SURGES DUE TO POPULATION GROWTH AND ENVIRONMENTAL CONCERNS, PROBIOTICS AND AQUAFEED STAND TO BENEFIT
industrial sectors.
Annual revenue synergies are estimated at €200m and cost synergies — achievable within three years after completion — at €80‒90m. Novozymes and Chr. Hansen may have paved the way for other
Alternative protein and starch
Fish/marine oil
Fishmeal/marine protein
mergers in which companies operating in parallel spaces can profit from synergies, e.g. making probiotics for human/pet/ livestock.
As demand for sustainable animal feed solutions surges due to population growth and environmental concerns, probiotics and aquafeed stand to benefit. Probiotics are gaining traction globally, driven by legislation and increased awareness of their benefits in livestock health. The aquafeed market is poised for substantial growth driven by the booming aquaculture industry and beginning to incorporate alternative proteins. Finally, M&A activity in both spaces has already been ramping up, clearly showing investors’ hunger for opportunities in animal feed.
NOTES
1 Data Bridge Market Research, Transparency Market Research
2 BNP Paribas
3 MarketsandMarkets
4 Ibid
5 GRAIN
6 Shepherd et al., 2017; IFFO estimates
Sector Insights | 63
65.5% 33.5% 24.8% 18.2% 14.5% 24.0% 31.1% 16.6% 11.2% 10.4% 9.5% 33.4% 12.5% 19.1% 20.2% 43.9% 47.8% 50.9% 1990 2.0% 2000 2.2% 2010 3.7% 2013 4.0% 2016
Plant oil
Microingredients 1.0% SOURCE HTTPS://WWW.AQUAFEED.COM/NEWSROOM/REPORTS/STUDY-UPDATES-FEED-INGREDIENT-UTILIZATION-DATA-FOR-NORWEGIAN-SALMONIDS-IN-2020/; HTTPS://PROJECTS.LUKE.FI/AQUAIMPACT/2019/12/20/THE-EVOLUTION-OF-FISH-FEED-INGREDIENTS-THE-TRANSITION-TO-PLANT-BASED-RAW-MATERIALS-IN-FISH-FEEDS/; MANSFIELD ANALYSIS
FIGURE FOUR COMPOSITION OF FISHFEED
In 1987, VCA Animal Hospitals acquired its first independently owned companion animal clinic. It sparked the beginning of a consolidation process for corporate-owned US veterinary practices. Freddie Evans and Adam Scott consider the prospects for further consolidation of the veterinary market in the US

US veterinary consolidation a land of opportunity

Corporate consolidation in the US veterinary sector has picked up pace since the VCA deal. By 2017, just over 10% of the approximately 30,000 practice market had consolidated, and the corporate share of the market now represents around 36% gauged by the number of practices. Corporates tend to take over larger practices, however, so the true private market share of activity is likely to be over 40%.
Specialist hospitals are a slight exception, where the approximately 1,500 specialist hospitals have received the most intense interest and competition from corporates. Consolidation here stands closer to 75% by volume.
The corporate share of market value is likely to be greater than the share of activity as they own practices and hospitals that will carry out higher value operations, including referrals.
There are now around 50 consolidators across the US. Compare that to the UK and we see a different picture in market structure, greater consolidation and fewer players.
Since non-veterinarian ownership of practices has been allowed in the UK, corporates have accelerated to dominate the market and are moving on to other European markets as well.
64 | Sector Insights Veterinary Insights
This
State of the market
There is no formal registration of all US vet practices, but Mansfield Advisors estimates it to be in the region of 32,000‒34,000 practices. Veterinarian numbers are, however, recorded. The American Veterinary Medical Association has around 124,000 registered vets, the majority of which (67%) work in companion animal practices, and it’s these practices, along with some mixed practices (4% of vets), that are the main target for consolidators.
Large practices and specialist hospitals are most in demand and represent the highest priority targets for corporates. A long tail of small one or two vet practices are of less interest to consolidators.
Terminology
Before we go any further, it may be helpful to clear up some terminology. Companion animal practices are the equivalent of small animal practices in the UK but can include equine. Standalone equine practices remain, as they do in the UK.
Large or farm animal vets are also known as food animal vets, and mixed practice remains the same.
Increasing pace
At the JP Morgan Healthcare Conference in January 2023, we saw Kristin Peck of Zoetis, the leading animal health company, present results of their market research to show the extent of the sustainability of the market during an economic downturn. Key findings revealed that 86% of owners would pay whatever it takes if their pet needed extensive veterinary care and that pet spend is not cut even when faced with a 20% decrease in total budget. As well as these spending habits, demand for veterinary services is rising through growth in pet numbers, and growth in the number of procedures available to the veterinary market as it follows human medicine advancements.
Covid led to a boom in pet ownership, fuelling more demand for vets in coming years. A 2021 American Veterinary Medical Association survey reported as much as a 16% increase in the number of dogs and 6% increase in the number of cats since 2016. As a result of this growth in demand ‒ and some price rises ‒ practices have reported revenue increases of as much as 20% in the last year.
This supports the idea that veterinary is a resilient sector to invest in, and
reinforces the recent trend of consolidation picking up pace as interest rises. The good news is that much of the increased demand for veterinary services will only be seen in practices from 2025 onwards as new pets taken on over the pandemic enter a stage of life where greater intervention is required.
Major consolidators
The largest corporate is VIP Petcare which is owned by publicly listed PetIQ, an animal wellness company. Mars follows closely through three brands; VCA, Banfield and BluePearl. Collectively these brands have over 2,200 practices. The largest groups attract substantial private equity interest through the likes of JAB Investors, which holds National Veterinary Associates (NVA). The group was particularly active in 2022 with bolt-ons of SAGE Veterinary Centers, Ethos Veterinary Health. Others include KKR (PetVet Care Centers), TSG Consumer Partners (Thrive Pet Healthcare, formerly Pathway Vet Alliance) and Shore Capital Partners (Mission Veterinary Partners).
Many of the smaller consolidators remain founder or vet owned, such as
Sector Insights | 65
General practices c.75% c.34% c.66% Specialist hospitals 30,500–32,500 c.25% 1,450–1,550 Consolidated Unconsolidated
SOURCE COMPANY WEBSITES; MANSFIELD ADVISORS ANALYSIS
segment continues to provide opportunity for consolidation, though there is a long tail of smaller practices
NUMBER OF PRACTICES
ESTIMATED
FIGURE
ONE MARKET COMPOSITION ‒ THE NON-SPECIALIST MARKET REMAINS FRAGMENTED OFFERING OPPORTUNITIES FOR CONSOLIDATION
(also in Canada,
47 states (also in Canada, Brazil and Japan)
Lakefield Veterinary Group and WellHaven Pet Health. These may be candidates for rolling up into the larger groups, though would likely come at a premium. Across the border in Canada we see a European player IVC Evidensia, which has acquired VetStrategy (owner of Groupe Vétérinaire Daubigny) with 270 practices. Nordic Capital entered the US veterinary market with the acquisition of United Veterinary Care, following its successful 2018 exit from Anicura to Mars in Europe. Some of the other European players are yet to break in over the pond.
Why is consolidation not higher?
We may question why, despite starting global veterinary consolidation in 1987, the US is less consolidated than other markets such as the UK, which is currently around 55‒60% consolidated. There are a number of contributing factors, starting with the sheer size of the US.
The US has around six times more vet practices than the UK, and the geographical distances in the US can have a slowing effect. Furthermore, the different state laws can take time to navigate. Growth rates have also contributed. During the 1990s and 2000s steady consolidation took place, but there was also steady growth in the total number of practices, doubling from roughly 16,000 practices in the 1990s. This watered down the consolidation effect so corporate share stayed
at around 5%. The boom in corporate acquisitions in the late-2010s has seen consolidators make substantial ground.
THE US HAS AROUND SIX TIMES MORE VET PRACTICES THAN THE UK, AND THE GEOGRAPHICAL DISTANCES IN THE US CAN HAVE A SLOWING EFFECT
It should be noted that there is legislation in many states restricting ‘corporate practice’ of medicine, however this does not hinder consolidators. Laws restrict ownership of veterinary practices to licensed veterinarians only, to prevent non-veterinarian influence on veterinary decisions. In some states without these restrictions, a licensed veterinarian must be on the premises.
To overcome this hurdle, corporates can gain effective ownership of practices
through management services organisations (MSO). The MSO provides services for a fee and owns some non-restricted veterinary practice assets, while the restricted elements of the practice remain owned by the licensed professional. A slight variation is establishing an administrative services structure, whereby a corporate takes over the administrative side of a practice without taking over any assets, while the veterinarian maintains control of service provision.
The legislation does not appear to be a barrier to consolidation. Corporate presence is high in states where non-veterinarian ownership is restricted as seen in Figure Three.
More recently there have been some efforts to resist or limit consolidation both from the market and regulators. The Independent Veterinary Practitioners Association (IVPA) was founded in 2018 and offers members corporate type servicessuch as marketing materials, discounts on services like teleradiology and insurances, and medicines discounts - to help them compete more effectively.
While helping small independents compete, this is unlikely to hinder consolidation. Those practice owners looking to sell will not be fazed by such organisations.
Antitrust issues
From a regulatory perspective, the Federal Trade Commission (FTC) has started to show increased scrutiny of veterinary consolidation. At the more specialist end
66 | Sector Insights Veterinary Insights
NOTE 1 US PRACTICES ONLY SOURCE COMPANY WEBSITES; MANSFIELD ADVISORS ANALYSIS APPROXIMATE SHARE OF PRACTICES 11% 4% 3% 12% Independents National Veterinary Associates VIP Petcare 3% VCA VetCor Banfield 2% Other onsolidators 64% Corporate Number of practices1 US coverage VIP Petcare c.3,700 Nationwide National Veterinary Associates c.1,400 Nationwide
Australia and New Zealand VCA c.1,000
Banfield c.1,000 Nationwide VetCor c.762 Nationwide
(also in Canada)
CONSOLIDATION
c.24% MARKET SHARE AND OFFER TRULY NATIONWIDE COVERAGE
FIGURE TWO
‒ THE LARGEST FIVE CONSOLIDATORS
HAVE
of the market, Mars and NVA have had acquisitions blocked.
In June 2022, NVA sold 11 of its 1,400 hospitals in an agreement with the FTC to allow the acquisitions of SAGE Veterinary Centers and Ethos Veterinary Health, and NVA must now notify and receive approval from the FTC prior to acquiring any speciality or emergency veterinary practice within 25 miles of an existing practice in certain states. It must also notify the FTC before any acquisitions within 25 miles of any existing sites throughout the remainder of the US.
Newcomers such as Rarebreed Veterinary Partners, United Veterinary Care, Veritas Veterinary Partners have been able to grow quickly due to these antitrust issues, snapping up assets others have been prevented from taking.
This type of intervention has also been seen in the UK, with the CMA stepping in during VetPartners acquisition of Goddard Veterinary Group’s 47 practices in 2022. VetPartners had to sell 11 practices, eight of which were bought by Linnaeus. Similarly CVS was blocked from acquiring Quality Pet Care (AKA The Vet), which
owns eight practices.
Antitrust may become more of an issue for larger players as it narrows growth and exit opportunities, but it is of little concern for smaller consolidators which are unlikely to be affected and may benefit from the inability of larger groups to acquire. It is possible that this suppression of big players may lower the red-hot valuations that have been seen over recent years,
but competition remains high amongst the smaller players.
High valuations
Before the pace of consolidation picked up in the late-2010s, valuations of single good practices were typically 7‒8x EBITDA and specialist hospitals at 10‒12x. More recently the going rate is 8‒12x for practices and 12‒15x for hospitals, with some reports of as much as 18‒20x.
Larger chain acquisitions have higher valuations. For example, NVA (backed by German PE fund JAB) reportedly paid around 25x for both SAGE Veterinary Centers and Ethos Veterinary Health. This is not dissimilar to the picture in the UK, where CVC’s 2021 majority stake in Medivet was reported to be on a £1bn-plus valuation, at a multiple thought to be in the mid-20s. In 2021, Silver Lake Capital acquired a €3.5bn stake in IVC Evidensia with a €12.3bn valuation, a multiple in the low 30s based on £373m EBITDA (FY21 y/e 30 September).
Sector Insights | 67
NOTE SAMPLE OF 40 CONSOLIDATORS WHICH PUBLISH PRACTICE LOCATIONS 1 STATES WHICH FOLLOW CORPORATE PRACTICE OF MEDICINE DOCTRINE, WITH VARYING DEGREES OF ADHERENCE, 2022 SOURCE FENTON LAW GROUP, COMPANY WEBSITES; MANSFIELD ADVISORS ANALYSIS NUMBER OF CORPORATES PRESENT Alaska Hawaii California Oregon Washington Montana Idaho Nevada Utah Arizona New Mexico Colorado Wyoming North Dakota South Dakota Nebraska Kansas Oklahoma Texas Louisiana Arkansas Missouri Iowa Minnesota Wisconsin Illinois Michigan Ohio Indiana Kentucky Tennessee Mississippi Alabama Florida Georgia South Carolina North Carolina Virginia Pennsylvania West Virginia Washington DC Maryland Delaware New Jersey Connecticut Rhode Island Massachusetts New Hampshire New York Vermont Maine 16 - 20 21+ 6 - 10 11 - 15 0 - 5 Follow CPOM1 ANTITRUST MAY BECOME MORE OF AN ISSUE FOR LARGER PLAYERS AS IT NARROWS GROWTH AND EXIT OPPORTUNITIES
CONSOLIDATION FOCUS ‒ CORPORATE PRESENCE GENERALLY MATCHES THE MORE DENSELY POPULATED STATES, AND APPEARS UNAFFECTED BY RESTRICTIONS ON NON-VETERINARIAN OWNERSHIP
FIGURE THREE
Outlook
The consolidation runway still has a way to go. We expect there to be a natural ceiling of around 50% of practices that are unattractive to corporates due to being sub-scale. However, this 50% of inaccessible practices likely account for only about 20% of the vets, so it is not a concerning limit. If consolidation continues at a similar rate of close to 1,000 practices a year, there is likely to be at least another five or more years of corporatisation of independent practices. There is also the opportunity for an investor to roll up some of the near 40 smaller consolidators to create a player that can compete with the likes of Mars and PetIQ.
Opportunities
We have identified a selection of assets that may come to be available for acquisition, the largest of which is Mission Veterinary Partners, which has been owned by Shore Capital Partners since 2017. A sale was explored in late-2021 but was never completed.
KKR has owned PetVet Care Centers since 2017 and may be looking to exit based on typical fund lifetimes. Similarly the likes of American Veterinary Group (Latticework Capital, 2015) and Encore Vet Group (North Castle Partners) have been held by their respective owners for a number of years.
These acquisitions present an attractive entry to the market through existing platforms, from which further consolida-
tion can be pursued.
In conclusion, competition in the sector for high quality businesses is substantial, as shown by the multiples they command. The fundamentals of the market are strong with growing pet number and vet demand.
The thesis for vet roll-up in the US is strong and reflect those that exist in the UK. The current position of the market provides a great opportunity for both consolidation of independents and rolling up small corporates.
There is no time to delay if you want to get in on the action before it’s too late.
68 | Sector Insights Veterinary Insights
TABLE ONE SELECTED RECENT TRANSACTIONS ‒ THE MARKET HAS BEEN HOT WITH M&A ACTIVITY Asset Acquirer PE involvement Date Valuation Practices at time of transaction People, Pets & Vets VetCor Cressey & Company and Harvest Partners Sep-22 ‒ 150 Vet's Best Friend Rarebreed Veterinary Partners Revelstoke Capital Partners Jun-22 ‒ 47 SAGE Veterinary Centers NVA JAB Consumer Partners Jun-22 $1.1bn 25x EBITDA 16 Ethos Veterinary Health NVA JAB Consumer Partners Jun-22 $1.65bn 23‒28x EBITDA 23 Nine NVA sites United Veterinary Care Nordic Capital Jun-22 ‒ 9 Alliance Animal Medical L Catterton L Catterton Dec-21 $750‒800m 19‒21x EBITDA 114 United Veterinary Care Nordic Capital Nordic Capital Apr-21 ‒ 60 Pathway Vet Alliance1 TSG Consumer Partners TSG Consumer Partners Apr-20 $2.65bn 455 NVA JAB Consumer Partners JAB Consumer Partners Jun-19 $5bn 670 Compassion First JAB Consumer Partners JAB Consumer Partners Mar-19 $1.22bn 41 VCA Mars ‒ Jan-17 $9.1bn c.800 NOTE 1 NOW REBRANDED AS THRIVE PET CARE SOURCE COMPANY PRESS RELEASES; MANSFIELD ADVISORS ANALYSIS
Where next for independent fostering agencies? Paul Fegan and Henry Elphick explain why there is room for optimism


Fostering a brave new world
Amid the tragic headlines about children who have slipped through the care system, the vision for children’s services has been remarkably clear and consistent: vulnerable children are best looked after in a home environment. If they cannot be looked after in their own home, then it should be a setting as close as possible to a home environment. This has favoured the growth of fostering as the preferred option for children who are looked after (CLA) and as local authorities (LAs) have struggled to supply sufficient capacity, the market for independent fostering agencies (IFA) has grown.
Many IFAs are private equity (PE) owned, including National Fostering Agency by Stirling Square Capital, Polaris by CapVest and Compass by Graphite Capital, but there have not been any significant transactions since the acquisition of BSN Social Care by MML Capital in 2021.
Nevertheless, interest in the sector will grow, with a number of assets, including both Polaris and Compass, expected to come to market during 2023.
The key question for investors is what will drive value in the future, especially as growth in fostering appears to be slowing, recruiting enough carers seems ever more challenging and the government is implementing a new children’s services strategy.
Trends
Focusing on England, the number of CLA has been growing by 2.1% (CAGR 2012-22). Despite this, growth in fostering – irrespective of provider type – has been lagging, with growth of just 1.4% (CAGR 2012-22) (see Figure One).
While IFAs1 have been taking share, up from 28.6% in 2012 to 31.5% in 2022, behind the scenes, both LAs and IFAs are struggling to recruit sufficient carers, with approved applications in 2021/22 down 18% on 2017/18. As carers leave the system, capacity has been declining, down 3,640 places overall, with IFAs managing a small increase offset by LA declines (see Figure Two).
Overall, then, it looks like fostering could well be supply-constrained, and any provider which can deliver a successful recruitment strategy should be able to outpace the market.
Although fostering is the preferred option, the proportion of CLA in fostering placements varies markedly, from 44% in Hillingdon to 86% in Merton (31 March 2022), so there are still some LAs that appear to have further to go (see Figure Three).
If lagging LAs matched the national average of 70% of CLA in fostering, that implies c.1,600 more children in foster placements, but all LAs achieving the maximum of 86% would imply more than 13,000 more. Nationally, 45% of the £1.9bn spent on fostering was with private providers but varies from 0% in 19 LAs to 96% in Surrey (see Figure Four).
There are 46 LAs where fostering is underpenetrated and growth has been slow (i.e. below average) (see Figure Five), and while we have not completed a deep dive into why, it seems plausible that, again, recruitment of carers may be challenging, but perhaps there is also a cultural aversion to using IFAs to stimulate local markets. Understanding which of these underpenetrated LAs – whether that’s low penetration of fostering or low penetration of IFAs – might present an opportunity is therefore valuable to providers seeking growth.
Government strategy
The government published its new strategy, Stable Homes Built on Love, in February 2023. It is billed as a ‘once in a generation’ opportunity for reform and has its origins in a series of reviews dating back to 2020 (see Figure Six). What is likely to stand out and even alarm investors is these reviews were critical of the role played by the independent sector in children’s services, especially PE-backed providers.
The Children’s Commissioner for England, Local Government Association, the Competition and Markets Authority (CMA) and independent review2 talked about dysfunctional markets, excessive profits and the risk of ‘disorderly departure’ by providers carrying excessive debt.
The independent review even recommended a windfall tax on large for-profit providers, although the government ultimately did not proceed, arguing it would deter investment and make a difficult situation worse. However, the government has proposed a financial oversight regime for the largest providers to increase transparency and reduce the risk of sudden market exit. This could actually favour large providers with robust financials, by signalling to commissioners they are stable long-term partners.
Along with another review by the Childrens Safeguarding Review Panel,3 the independent review also highlighted suboptimal organisation, complex regulation and care standards, and poor information sharing as additional reasons why children’s services are failing. Inadequate forward planning and market coordination was identified as another issue, and our own research found LA statutory plans are often out of date, making it difficult for providers to work out what is needed, even when there are
Sector Insights | 69 Social Care Insights
THE NUMBER OF CHILDREN IN FOSTERING PLACEMENTS HAS BEEN GROWING MORE SLOWLY THAN THE TOTAL NUMBER OF CLA
NUMBER OF CLA, 000s, 31 MARCH
acute shortages of appropriate places.
All these findings were acknowledged by the government and its strategy proposes reforms and pilots across six ‘pillars’:
1 Family help so that children can thrive with their families Improved family help services, investing in workforce and multi-disciplinary working to ensure early intervention and support to sustain family life
2 Decisive multi-agency child protection system Pilot new child protection lead practitioners and multi-agency response, plus new standards and guidance, and speeding up court decisions to enable earlier intervention
3 Unlocking the potential of family networks Test ‘family group decision making’ so more children could be placed with family and friends, plus training for ‘kinship carers’; improved payments for family carers
4 Putting love, relationships and a stable home at the heart of being a child in care Boost foster care, including
IT LOOKS LIKE FOSTERING COULD WELL BE SUPPLYCONSTRAINED, AND ANY PROVIDER WHICH CAN DELIVER A SUCCESSFUL RECRUITMENT STRATEGY SHOULD BE ABLE TO OUTPACE THE MARKET
investment in recruitment and retention, review of standards, pilot regional care cooperatives (RCC), financial oversight
5 A valued, supported and highly-skilled social worker for every child that needs one Focus on recruiting and retaining social workers, reduce agency use and consult on price caps, prioritise high quality career development
6 A system that continuously learns and improves, and makes better use of evidence and data Children’s social care framework and dashboard to share best practice and data, a new funding formula and inspections aligned with the framework
Much of the strategy therefore focuses on making markets work better, collaborative working and strengthening family and home as the most appropriate settings for CLA. None of this is necessarily bad for IFAs.
RCCs are the most radical proposal, envisaging C.20 LA collaboratives that would plan and commission children’s services. Their size should mean greater market
70 | Sector Insights Social Care Insights
50.3 53.4 54.7 55.8 57.0 57.0 57.5 16.8 18.8 20.7 22.4 23.0 23.8 24.6 2012 2017 2018 2019 2020 2021 2022 14.4 15.7 16.1 16.9 17.5 17.8 18.1 35.9 37.7 38.6 38.9 39.5 39.2 39.4 2019 2022 67.1 72.3 75.4 78.1 80.0 80.8 82.2 CAGR ‘12-’22 ‘17-’22 2.1% 2.6% 3.9% 5.5% 1.4% 1.5% 0.9% 0.9% 2.3% 2.9% Fostering Private provision All other settings Other providers Fostering (other providers + private provision) All other settings SOURCE
DEPARTMENT
FOR
EDUCATION
CHILDREN LOOKED AFTER IN ENGLAND 2012 TO 2022; MANSFIELD ANALYSIS
FIGURE ONE GROWTH IN CHILDREN LOOKED AFTER AND FOSTERING
FIGURE TWO
AND TOTAL
NUMBER OF APPLICATIONS APPROVED,
power, and could force down fees, but it is also likely to favour larger IFAs with the scale to meet an RCC’s needs. Hence, RCCs may be a stimulus for further M&A and squeeze out smaller IFAs.
Ultimately, expansion in supply should contain fees, but in the short term, ongoing shortages of places should underpin price. The consultation on RCCs, pilots, legislation and roll-out also mean nationwide implementation is unlikely for several years.
New directions for growth
Against this backdrop of reform and change, we have characterised growth opportunities in terms of adjacencies, using the education, health and care approach to planning support for children (see Figure Seven).
The core IFA offer is part of the ‘care’ domain and providers which want to stay focused could, of course, look for opportunities in underpenetrated LAs. However, while the practical ceiling to fostering is unknown, lifting all LAs to national average penetration (70%) means only 2.8% more in fostering, which is hardly transformative. Lifting all LAs to the penetration
OF APPROVED PLACES,
MUCH OF THE STRATEGY FOCUSES ON MAKING MARKETS WORK BETTER, COLLABORATIVE WORKING AND STRENGTHENING FAMILY AND HOME AS THE MOST APPROPRIATE SETTINGS FOR CLA
in Merton (86%) implies a more significant increase (c.23%), but requires change in almost every LA.
Therefore, ambitious IFAs need new ways to drive growth. The simplest approach is to move into other care services, but the most innovative IFAs could consider adjacencies in education and even health. Hence, a much bolder approach would bundle other services with fostering capabilities to meet a broader range of support needs:
• Care programmes to support kinship carers which draw on IFAs’ experience in training and supporting foster carers. Transitional care and 16-plus assisted living which could be integrated into fostering or kinship placements. ‘Traditional’ residential services
• Education standalone special education, home education, tutoring and digital/ed-tech services, and/ or focused on supporting fostered children. Training, consultancy and assessment services
• Health therapeutic fostering, or
Sector Insights | 71
2,645 2,720 2,490 2,815 1,955 2,275 2,390 2,135 2,545 2,075 2017-18 2018–19 2019-20 2020-21 2021-22 4,925 4,630 5,110 5,355 4,035 CAGR -2.3% IFA LA -7.3% -4.9% 33,540 34,775 35,400 34,905 34,090 44,760 44,220 43,425 42,010 40,570 2017-18 2018–19 2019-20 2020-21 2021-22 78,300 78,330 78,995 76,920 74,660 CAGR -2.4% IFA LA 0.4% -1.2% -18%
SOURCE OFSTED FOSTERING IN ENGLAND DATASET/UNDERLYING DATA
2017/18
TO 2021/22; MANSFIELD ANALYSIS
NUMBER
APPLICATIONS APPROVED
APPROVED APPLICATIONS ARE DOWN, WHILE IFAs HAVE BEEN GAINING SHARE OF APPROVED CAPACITY APPROVED
IN-YEAR
31 MARCH
PLACES
THERE IS MARKED VARIATION IN THE
IN FOSTERING PLACEMENTS, 31 MARCH 2022
FIGURE FOUR PENETRATION OF IFAs
THERE IS ALSO MARKED VARIATION IN PROPENSITY TO USE IFAs (PRIVATE PROVIDERS) PRIVATE PROVISION AS % OF TOTAL SPENDING ON FOSTERING, 2021/22
72 | Sector Insights Social Care Insights 0% 10 % 20 % 30 % 40 % 50 % 60 % 70 % 80 % 90 % 10 0% LOCAL AUTHORITIES HILLINGDON (44%) MERTON (86%) EQUIVALENT TO c.1,600 MORE CLA IN FOSTERING IF ALL LAs MATCHED THE NATIONAL AVERAGE OF 70% AVERAGE FOR ENGLAND: 70% % CLA in fostering % ‘gap’ for LAs below national average % in all other settings SOURCE DEPARTMENT FOR EDUCATION CHILDREN LOOKED AFTER IN ENGLAND 2022; MANSFIELD ANALYSIS
NUMBER OF CLA
%
CLA
0% 10 % 20 % 30 % 40 % 50 % 60 % 70 % 80 % 90 % 10 0% LOCAL AUTHORITIES SURREY (96%) EQUIVALENT TO £201.3m MORE SPENDING ON IFAs IF ALL LAs MATCHED THE NATIONAL AVERAGE AVERAGE FOR ENGLAND: 45% % of fostering spend on ‘private provision’ % ‘gap’ for LAs below national average % of fostering spend on public and voluntary sector provision SOURCE DEPARTMENT FOR EDUCATION CHILDREN LOOKED AFTER IN ENGLAND 2022; MANSFIELD ANALYSIS
IN FOSTERING PLACEMENTS RELATIVE TO TOTAL CLA
OF
FIGURE THREE PENETRATION OF FOSTERING
FIGURE FIVE
FOSTERING SHARE OF PLACEMENTS AND GROWTH
FOSTERING AS A SHARE OF ALL PLACEMENTS FOR CLA, AND GROWTH IN FOSTERING, BY LOCAL AUTHORITY1
31 MARCH
Fostering has a low share but high growth opportunity?
Fostering has a high share and high growth maturing?
Fostering has a low share and low growth potential?
Fostering has a high share and low growth mature?
FOSTERING PLACEMENTS AS % OF ALL CHILDREN LOOKED AFTER, 31 MAR 22
NOTE 1 149 LAs FOR WHICH RECONCILED 2017 AND 2022 DATA IS AVAILABLE SOURCE DEPARTMENT FOR EDUCATION CHILDREN LOOKED AFTER IN ENGLAND 2016 TO 2017/2020 TO 2021; MANSFIELD ANALYSIS
FIGURE SIX
RECENT HISTORY OF CHILDREN’S SERVICES REVIEWS
THE GOVERNMENT’S STRATEGY IS THE CULMINATION OF A SUCCESSION OF REVIEW

Dysfunctional markets
High prices
Excessive profits
Financial vulnerability
Suboptimal organisation
Complex regulation
Poor planning/coordination
Poor multi-disciplinary working
SOURCE VARIOUS REVIEWS; MANSFIELD ANALYSIS


Get markets working better to improve supply and contain price
Financial transparency
Early intervention and support for families, including kinship care
Support development of fostering
Collaborative commissioning, data sharing and professional support
Sector Insights | 73
- 15 % - 10 % - 5% 0% 5% 10 % 15 % 20 % 40 % 45 % 50 % 55 % 60 % 65 % 70 % 75 % 80 % 85 % 90 %
ENGLAND
ENGLAND
C A GR I N F O S T E RI N G P L A C E M E N T S O N 31 M A R, 201 72 2
AVERAGE 70%
AVERAGE 1.5%
FIGURE SEVEN OPTIONS FOR GROWTH ‒ CORE AND ADJACENCIES
IFAs COULD LOOK TO STRENGTHEN THEIR CORE FOSTERING BUSINESSES, BUT MOVING INTO ADJACENCIES IS THE MOST LIKELY SOURCE OF TRANSFORMATIONAL GROWTH
Care Health
In-fill fostering
Kinship care management
Transitional care
16+ assisted living
Step-down services
Transportation
CAMHS
Therapeutic fostering Therapy
Recruitment
Training Consultancy
Assessment centres
Crisis management
Case management
Private special education schools
Ed-Tech Tutoring Digital education
In-person education
Education
Health checks
Digital diagnostics and support
Mental health
Digital healthcare
Physical healthcare
SOURCE MANSFIELD ANALYSIS
standalone CAMHS and therapy services. Other health services, such as health checks
There are challenges to this bold approach:
• Packaging adjacencies with fostering is likely to be new to many LAs, presenting them with a blended service they may not have commissioned before
• LAs may resist paying for therapeutic services, and the NHS resists paying for social care, so it may be difficult to find payors for multi-disciplinary education, health and care packages
IFAs considering this kind of strategy
therefore need to understand commissioner sentiment and, even where favourable, they could face building a market from scratch. Yet ‘multi-disciplinary’ is very clearly the direction of travel in the government’s strategy and outcomes for CLA are already compromised by a lack of access to other services. Therefore, IFAs which approach LAs with joined-up solutions might find they are welcomed with open arms, particularly those which can point to evidence of improved outcomes and wider social benefits.
Conclusion
We are optimistic about the future for IFAs, and growth remaining in their core market, even if it is slower. There will be in-fill opportunities in underpenetrated LAs, in councils which can be encouraged
to use IFAs and in M&A as the largest IFAs are seen as more effective counterparties to RCCs.
However, this is also a sector that has barely started to explore its potential. Fostering on its own, and combined with education and health, can transform the lives of many more CLA.
So, what next for IFAs? It is likely to be a brave new world where investors in innovation and relationships really outperform.
NOTES
1 Defined as ‘private provision’
2 The Independent Review of Children’s Social Care, May 2022
3 Child Protection in England, May 2022
74 | Sector Insights Social Care Insights
We need to attract more people into social care and, importantly, retain them. Paul Fegan and Ty Lantz examine where we are and what can be done to possibly transform the profession
Breaking the cycle


When advising our clients about strategy and opportunities in social care, staffing has become the single most important issue, especially since the pandemic. While providers may be differentiated on price, profitability, or service quality, the availability of sufficient, high-quality carers is now a systemic problem that impacts everyone: investor, provider, payor and service user.
We are where we are because of history, and the lack of political will by all parties to recognise and appropriately reward care workers as a profession, acknowledge their critical role in an integrated health and social care system.
This article provides some context for the staffing ‘crisis’, reviews the approach taken in Germany and New Zealand, and proposes a solution that would start to transform the profession. Ultimately, we need to attract more people into social care and, importantly, retain them.
Context
Our focus is on paid care workers, such as those employed by domiciliary or residential care providers, although unpaid carers who look after loved ones at home also play a critical role. Perhaps the lack of professional recognition of paid care workers stems from a sense that if care can also be provided at home by family, then it must be unskilled work and it must be comparable to other low (minimum) wage occupations like hospitality and retail. Unfortunately, this means social care also competes with hospitality and retail for labour.
Pay
The government would argue that social care competes with other sectors, but providers, like supermarkets and restaurants, set wages in an open labour market (which hints at part of the solution to the current crisis).
The minimum wage sets the lower boundary, but providers could pay more to attract more. Yet King’s Fund research in 2022 showed 30% of care workers earned within 9p, and 50% within 30p of the hourly national living wage (NLW). Rather than being a minimum, the NLW has become the de facto reference price for care workers.
As a result, care workers are dependent on benefits and even charity to make ends meet. One-fifth (20%) have dependent children and 40% have other family responsibilities that limit the hours they can work. Unsurprisingly, 18.5% of residential carers live in a household in poverty, and 16.9% receive Universal Credit, according to the Health Foundation.
Financial hardship is more prevalent than the benefits system implies: the Care Workers’ Charity (CWC), gives emergency grants to care workers (£2.1m in 2020), and while 30% of applicants are
Sector Insights | 75
THE PROPORTION OF CARE WORKERS WHO ARE NOT SATISFIED WITH THEIR JOBS HAS INCREASED IN-LINE WITH SELF-REPORTED EXHAUSTION
NOT SATISFIED WITH OCCUPATION
ALWAYS OR OFTEN COME HOME EXHAUSTED
Social care
All jobs
Other low paid jobs
receiving Universal Credit, 70% do not. We cannot simply conflate care workers with dependent children and Universal Credit, but our own rough estimate is that up to £5bn of Universal Credit is effectively supporting the care sector. Put another way, the benefits system represents a hidden 15‒20% subsidy on top of the £27bn cost of adult social care.
Status
Status is typically recognised through absolute levels of pay, and differentials within and between professions, but job satisfaction is a more complex blend of financial and personal rewards. The Resolution Foundation found, historically, care workers were satisfied with their jobs, but this started to decline after 2006, particularly as reported levels of exhaustion grew (see Figure One).
Low pay fails to reflect the responsibility of the care worker’s role, and care work is far more physically and emotionally demanding than competing sectors. In fact, care worker pay now lags retail: in June 2022, nine in ten major supermarket chains paid entry level roles 40p per hour more than the NLW, and the differentials have been eroded over time. A retail assistant in 2012/13 earned 16p per hour less than a care worker. By 2020/21, retail assistants were paid 21p more per hour (see Figure Two).
In contrast to wages in most professions, social care salaries barely change with experience level, and differentials
within the profession have eroded. In 2021/22, a care worker with five years’ experience was paid just 6p per hour more than one with less than a year’s experience. Before 2017, this gap was 35p. Hence, highly experienced care workers, who create value not only by providing support but also by training and mentoring starters, earn little more than their trainees and often feel frustrated and dissatisfied.
HIGHLY EXPERIENCED CARE WORKERS WHO CREATE VALUE BY PROVIDING SUPPORT, TRAINING AND MENTORING EARN LITTLE MORE THAN THEIR TRAINEES
Vacancies
Skills for Care reported that vacancies increased 52% between 2020/21 and 2021/22: there are 165,000 vacancies out of a workforce of 1.62m care workers.1 Furthermore, we expect demand for geriatric care to grow at 1.7‒2.2% per year, compared with 0.3% growth in the labour force. Put simply, the care system needs to win workers from other sectors to fill vacancies now and into the future (see Figure Three).
Migrant workers
The government has responded by making it easier to hire care workers from overseas. Following a Migration Advisory Committee’s recommendation, all care workers were added to the health and care worker visa scheme. In the year to April, more than 60,000 have applied, and these new migrant care workers are being paid more than the average entry level wage at top providers.
The system
The reality is a care sector grappling with record vacancies and struggling to recruit. These challenges affect availability and quality of social care and have implications for the NHS and its congested hospitals.
While charities such as the CWC reduce reliance on pay advances or payday loans in times of need, that such help is needed is the consequence of low pay. The CWC
76 | Sector Insights Social Care Insights
1990 1995 2000 2005 2010 2015 2020 0% 50% 35% 45% 55% All jobs Social care Other low paid jobs 1995 2000 2005 2010 2015 2020 0% 50% 55% 60% 65% 70%
2006-17 2006-17
SOURCE 'WHO CARES?, RESOLUTION FOUNDATION; MANSFIELD RESEARCH AND ANALYSIS
FIGURE ONE
JOB DISSATISFACTION AND EXHAUSTION
Iceland Co-op, Waitrose M&S, Morrisons, Sainsbury’s
TO
has repeatedly closed its emergency grants fund due to demand exceeding the resources available. The system feels broken, and as more care workers leave, those remaining work ever harder, and even more burn out and leave.
What could we do?
Understanding the economic tradeoffs is critical to breaking the cycle and developing a better deal for care workers. Market mechanisms have so far failed to rebalance the workforce in favour of social care, but it also makes little sense to deprive wealth-creating sectors of workers. Migrant workers are only a short-term fix and paying them more than workers recruited domestically creates a whole new set of imbalances and frustrations.
We do, however, have record numbers of people who are economically inactive, including 2.6 million people who are long-term sick. The Department for Work and Pensions, by way of the Spectator, estimated that 20% of the population of working age is claiming out-of-work benefits.2
Attracting more people back into the workforce could make a significant difference to the labour market in social care and more broadly. Providing better pay, greater recognition, and improved career progression – including formal professionalisation – could attract more into social care and stimulate a rebalancing of the workforce. If social care is
made more attractive, it need not deprive other sectors of workers if the supply of workers overall is increasing.
Higher pay, in particular increments which reward experience, would also improve retention. There could even be a positive return on investment in pay if it reduces hiring and training costs via reduced churn and increases revenue in the case of limited admittances due to inadequate staffing; higher wages and more staff could stimulate growth.
Nevertheless, the examples of New
as childcare.
Germany, by contrast, implemented a more gradual increase in wages and has achieved better outcomes for the industry. The Care Wages Improvement Act 2018, updated in 2022, set wages for unqualified care assistants, and then additional wages for qualified assistants and assistants with three years of training. The minimum wage for a care worker is €2.18 (£1.87) higher than the national minimum wage and since Germany’s minimum wage itself is contingent on experience, there is a de facto salary scale for care workers, helping to build the idea of social care as a profession (See Figure Four).
What should we do?
Ultimately, we need to develop a strategy that includes elements of all the above: encourage more to re-enter the workforce and make social care more attractive.
Zealand and Germany show that any approach needs to be pragmatic. In New Zealand, all care workers received a significant increase in pay, but a meaningful number opted to work fewer hours, because they did not want more money. In fact, given the flexible nature of the work, some care workers already earn what they perceive they need and then focus on their other responsibilities, such
According to Skills for Care, experience levels are somewhat bimodal, there are many workers with less than three years’ experience and many with ten-plus years in social care. In visits to care homes, it becomes clear that the relative value creation of experienced workers vs. new joiners eclipses the minimal pay gap. Key to developing the new joiners into more productive carers is a recognition of skill development.
The Resolution Foundation and the Liberal Democrats are calling for a care
Sector Insights | 77
50% of care workers earn within 30p of NLW 30% of care workers earn within 9p of NLW £9 50 £9 50 £9 90 £10 00 £10 10 National Living Wage1
Minimum
£10 75
SALARIES
MIGRANT WORKERS ARE ONLY A SHORTTERM FIX SUPERMARKETS
Aldi, Lidl, Asda, Tesco
hourly salary for visa
ENTRY
FOR
MINIMUM WAGE FOR PEOPLE OVER THE AGE OF 23
NOTES AS AT JUNE 2022 1 EQUIVALENT
SOURCE KING'S FUND; GOV.UK
FIGURE TW0 UK HOURLY WAGES
THE MAJORITY OF CARE WORKERS WOULD GET AN IMMEDIATE PAY RISE IF THEY TOOK AN ENTRY LEVEL JOB IN RETAIL
BASIC PAY FOR CARE WORKERS IS c.€2 MORE THAN MINIMUM WAGE; PAY INCREASES IN THE CARE SECTOR WERE STAGGERED AND APPLIED TO ALL LEVELS OF EXPERIENCE
worker minimum wage that is £2 more than the national minimum wage. They estimate this will increase gross spend by 8%, and net spend by 4% once increased tax contributions and reduced benefits are considered.
While an across-the-board pay raise would make the role more attractive, it would fail to acknowledge the experience of seasoned employees and it would put a significant burden on employers. Labour costs already account for 60% or more of a care home’s turnover, and many homes run on relatively thin margins. Such a pay hike without additional value creation would be unfair to operators and much of the cost could eventually fall to taxpayers as nearly half of the sector is funded by local government. However, a progressive pay increase, one like that in Germany that scales with experience could be more than equitable.
In addition to increased pay, a more formal and centralised registration service for industry veterans, and titles that reflect relative experience would bring a level of status to the role. Registries for social care workers exist throughout the UK but they are country-specific and under-utilised, particularly by newcomers to the industry. Training and accreditation programmes provided by professional societies can both upskill the workforce and help individuals demonstrate their value-add to employers. Routes to special senior titles, perhaps with three-plus years of experience, could also help retain talent within the sector.
It is not for us to determine exactly which levels of experience merit a pay increase, that is a conversation for workers, representatives like the CWC, operators, and regulators. However, we do know there is both a human and economic argument for lifting the wages and status of care workers to reflect the service and compassion they provide our loved ones.
NOTES
1 https://www.skillsforcare.org.uk/Adult-SocialCare-Workforce-Data/Workforce-intelligence/ publications/national-information/The-state-ofthe-adult-social-care-sector-and-workforce-inEngland.aspx
2 https://www.spectator.co.uk/article/yes-fivemillion-are-on-out-of-work-benefits-heres-theproof/
78 | Sector Insights Social Care Insights 60,000 110,000 165,000 2012/13 2020/21 2021/22 +50% 4.0% 6.6% 10.2% %, vacancies as proportion of all posts SOURCE SKILLS FOR CARE; MANSFIELD RESEARCH AND ANALYSIS
COVID,
VACANCIES €9.82 €12.00 €12.50 €15.00 €14.15 €15.25 €18.25 Min. wage Unqualified assistant Qualified assistant >1 year training Qualified assistant >3 year training Current Future SOURCE NUFFIELD TRUST
SINCE
THERE HAS BEEN A 50% INCREASE IN THE NUMBER OF CARE
FIGURE THREE
UK CARE VACANCIES
FIGURE FOUR
GERMAN HOURLY WAGES
When it comes to care home construction in England, who is building what, where and for whom?
Johan Ottosson and Henry Elphick provide analysis of the development pipeline


Leading the way
Post-Covid and with a challenging environment of higher inflation, interest rates, build costs and longer times to completion and break-even, unsurprisingly the construction of care homes for older people has slowed down, although only modestly (Mansfield estimates c.8% fewer beds) and with larger developers such as LNT Group seeing an opportunity to build landbanks and pipelines.
Barbour ABI data shows 393 live planning applications with planned completion dates between 2023 and 2025 with 21,370 beds.1 Applying the historic ratio where c.60% of applications are built (based on a 2015‒2018 application to completion ratio) this implies c.239 homes with c.13,010 beds will be built between 2023 and 2025 (an average of 59 beds per home when adjusted for planning applications without beds), which is less than 2020‒2022 levels of
286 homes and 14,240 beds (an adjusted average 60 beds per home). The majority of new construction also continues the shift to private pay homes.
Some companies are active as both contractor and developer, developer and operator, and or even across all three activities.
For example, LNT Group is at the forefront of adding new-build bed capacity, both as a contractor, developer, and in some cases operator through its own operating brands and operators such as Ideal Care Homes where it is a minority shareholder. Developer Frontier Estates also has a strong pipeline and is now a clear number two developer in the market, while Barchester remains the leading operator of new bed capacity.
Looking at where operators are adding beds some, like Barchester and Hamberley, focus on where they already have homes in the South East. Care UK also
has a strong pipeline in the South East but is also strengthening its presence in the South West, while Avery is expanding in new geographies, which avoids the need to pay premium South East prices for land.
The construction value chain is fragmented
There are a multitude of independent contractors, developers and operators with the top ten representing less than a third of the market, and there are often strong commercial relationships between them. For example, Lawrence Baker (privately owned, and led by managing director Paul Dixon) build much of Care Concern’s new capacity (privately owned, and led by chief executive Manpreet Johal), and McGoff (privately owned, and managed by the McGoff family) have
Sector Insights | 79


Contractors and developers


Developers and operators


been close partners with Barchester (privately owned, and led by CEO Pete Calveley), and also New Care (part of the McGoff Group, and led by CEO Chris McGoff).
Contractors
Building care homes is not straightforward – well known contractors such as Castleoak have gone into administration (2021), and construction performance bonds get called upon more often than developers and operators would like. The inflationary environment has also meant maintaining margins on fixed price contracts when material costs are so variable is increasingly challenging.
The leading contractors in the sector tend to be focused on care homes. LNT Group (privately owned, and led by CEO Matthew Lowe) has been, and will con-
tinue to be, the leading contractor adding new-build beds with a standardised model and vertical integration to control costs and maximise operating efficiencies.
It is the most active contractor based on planning activity in the period 2020‒2022 having added 27% additional bed capacity than the second most active contractor and 120% more than the third. Second placed McGoff added 1,038 beds over the period 2020‒2022, and third placed Lawrence Baker rose by 600 beds.2
In forecasting 2023‒2025 new-build beds, we have adjusted planning permission volumes downwards based on the historic ratio where only c.60% of applications are built. However, we have not applied this adjustment to the established top ten developers which tend to have a near 100% application-to-build ratio, but rather to the tail of smaller more specula-
tive developers in ‘other’.
Based on the adjusted forecasts, LNT remains the market leader in the 2023‒2025 period with Lawrence Baker overtaking McGoff whose healthcare pipeline has fallen, possibly having decided to focus on other sectors such as build-torent where they are strong.
LNT represents 13.6% of new-build capacity over the period (up from 9.3% between 2020 and 2022), and the top ten contractors 28.9% (down from 34.8% between 2020 and 2022).3 This is evidence both of market fragmentation and LNT’s leading position within it.
80 | Sector Insights Social Care Insights
* A c ti v it y l e v e l Operator
Operator
The list of the top ten contractors is forecast to remain unchanged from the 2020‒2022 period to 2023‒2025, except for Seddon and Wynbrook replacing Savista and Stepnell. NOTE CASTLEOAK WENT INTO ADMINISTRATION IN 2021 SOURCE BARBOUR ABI; MANSFIELD RESEARCH AND ANALYSIS
via New Care
via sister company Hallmark Contractors, developers, and operators Contractors Developers Operators
PLAYERS IN THE CARE HOME CONSTRUCTION VALUE CHAIN OFTEN HAVE MULTIPLE ROLES. MOST ACTIVE PLAYERS BASED ON NEW-BUILD BEDS IN PLANNING APPLICATIONS, ENGLAND (2020‒2025)
FIGURE
ONE CARE HOME CONSTRUCTION VALUE CHAIN
FIGURE
TWO NEW-BUILD
LNT HAS BEEN, AND WILL CONTINUE TO BE, IN THE FOREFRONT OF ADDING NEW-BUILD CAPACITY. TOP TEN CONTRACTORS ADDING NEW-BUILD BEDS (BASED IN PLANNING APPLICATION DATA), ENGLAND
Top three players adding 2,667 beds (2,956, 2020‒2022) or
Sector Insights | 81 Cont/Dev/Op Contractor Contractor Contractor Contractor Cont/Dev Contractor Cont/Dev Cont/Dev Cont/Dev Added capacity 2020‒2022 Added capacity 2023‒2025 600 498 323 290 266 222 216 187 Walter Thompson LNT Total McGoff Lawrence Baker Acheson Savista Highwood Group J Tomlinson Stepnell 1,038 Clegg Other 1,318 9,282 14,240
ten players adding 3,755 beds (4,958, 2020‒2022 ) or c.28.9% 551 343 225 196 189 160 124 116 78 J Tomlinson Other (adjusted) Wynbrook Other McGoff Clegg Acheson Walter Thompson Highwood Group Seddon 1,773 13,010 Lawrence Baker Total 17,479 9,255 LNT 2020‒2022 rank 1 3 4 10 6 Role in value chain
Top
New New 7 8 2 NOTE BASED ON PLANNING APPLICATIONS IN BARBOUR ABI DATA PER MY 2022 WITH COMPLETION DATES BETWEEN 2020‒2022 AND 2023‒2025 SOURCE BARBOUR ABI; MANSFIELD RESEARCH AND ANALYSIS
c.20.5%
New 761 520 456 400 358 355 346 346 288 1,252 Signature Avery 14,240 Total LNT Barchester Oakland Care Hamberley Savista New Care Frontier Estates Crown Care Other 9,158 639 490 432 418 388 282 256 205 Hamberley Frontier Estates Country Court Total Barchester LNT Avery Signature Care Concern Yorkare Homes 13,010 Athena 15,798 Other (adjusted) Other 6,998 1,839 1,063 1 9 4 3 New New 6 2 New Cont/Dev/Op Developer Operator Dev/Op Dev/Op Dev/Op Dev/Op Dev/Op Operator Operator
ten players adding 6,012 beds (5,082, 2020‒2022) or c.46.2%
three
adding 3,541 beds (2,553, 2020‒2022) or c.27.2% Added capacity 2020‒2022 Added capacity 2023‒2025 2020‒2022 rank Role in value chain NOTE BASED ON PLANNING APPLICATIONS IN BARBOUR ABI DATA PER MY 2022 WITH COMPLETION DATES BETWEEN 2020‒2022 AND 2023‒2025 SOURCE BARBOUR ABI; MANSFIELD RESEARCH AND ANALYSIS
Top
Top
players
CARE HOME CAPACITY MAIN CONTRACTORS
CARE HOME CAPACITY
LNT IS THE MAIN DEVELOPER, THOUGH FRONTIER ESTATES IS NUMBER TWO WITH A STRONG PIPELINE. TOP TEN CLIENTS ADDING NEW-BUILD BEDS, ENGLAND CLIENTS
FIGURE THREE NEW-BUILD
MAIN
Barchester – 130 (3%)
Seddon – 116 (3%)
Hamberley – 82 (2%)
Avery – 79 (2%)
Frontier Estates – 76 (2%)
New Care – 70 (2%)
McGoff – 66 (2%)
Hadrian – 65 (2%)
Other – 949 (25%)
Developers and operators
Barbour ABI’s data is structured so that there is some overlap between developer and operator. For example a developer may build a site, and an operator may come in towards completion, register themselves as the developer for some minor amendments, and show up as the developer for that site. For historic data, some developers’ activity may therefore be underestimated.
LNT is again the leading developer of new-build bed capacity. However, Frontier Estates (privately owned, and led by Adam Eldred and Andrew Crowther) is now the clear number two developer in the market based on pipeline.
Some of the main operators are also forecast to add newly-built bed capacity from 2023‒2025, notably, Care Concern, Barchester, Avery (owned since February 2022 50/50 by the Reuben Brothers and Welltower, and led by executive chair and co-founder John Strowbridge), and Hamberley (backed by Patron Capital, and
led by CEO Paul Hill).
Smaller operators applying for newbuild planning permissions include Country Court Care (backed by Downing LLP and led by CEO Alykhan Kachra), Yorkare Homes (privately owned, and managed by the Garton family) and Athena (privately owned, and led by managing director Mala Agarwal).
Interestingly, and contrary to the trend we are seeing among contractors, the developer and operator market is becoming more consolidated, and the new-build bed market share added by the top ten developers and operators is forecast to grow from 18% to 27%.
Leading operators also tend to build more of the same – new home sizes remain in line with their existing estate where they have optimised their operating model. Barchester new-builds have an average of 61 beds (64 current average), Care UK (owned by Bridgepoint, and led by CEO Andrew Knight) 74 beds (70), Avery 72 beds (76), and Hamberley 64 beds (73).
Relationships are not monogamous
The main contractors for new-build bed capacity often build for numerous clients (developers and/or operators). For example, Lawrence Baker is the contractor for new-builds (with completion dates between 2023 and 2025) for Care Concern, Barchester, its own company Lawrence Land, and three more operators. Conversely, clients will also use multiple contractors, with Barchester working with both Lawrence Baker and Clegg.
Where people are building
The areas seeing the most added capacity include the South East (17.6% of beds and 17.1% of homes), Greater London (16% and 14.5%), the North West (11.1% and 12%), and the East of England (12.2% and 11.8%).
However, the leading operators have chosen different geographic strategies
82 | Sector Insights Social Care Insights
LNT – 1,773 (47%) Lawrence Baker – 551 (15%) Walter Thompson – 343 (9%) LNT – 1,773 (47%) Care Concern – 349 (9%)
Total = 3,755 1,773 201 60 290 65 278 70 79 76 70 126 70 66 53 78 82 124 116 78 1,773 201 70 78 60 70 116 82 79 76 70 66 65 290 278 126 53 124 78 Clegg – 225 (6%) Acheson – 196 (5%) McGoff – 189 (5%) J Tomlinson – 160 (4%) Highwood – 124 (3%) Seddon – 116 (3%) Wynbrook – 78 (2%) Client (dev and/or op) Contractor SOURCE BARBOUR ABI; MANSFIELD RESEARCH AND ANALYSIS CARE HOME CONTRACTORS WILL USUALLY BUILD FOR NUMEROUS CLIENTS. TOP TEN CONTRACTORS ADDING NEW-BUILD BEDS 2023‒2025 AND FOR WHOM THEY BUILD, ENGLAND FIGURE FOUR WHO BUILDS FOR WHO
NEW-BUILD PATTERNS FOLLOW EXISTING CAPACITY, WITH AN INCREASED FOCUS TO THE SOUTH EAST. ILLUSTRATION OF FOUR MAJOR DEVELOPERS AND OPERATORS EXISTING (PER OCTOBER 2022) AND NEW-BUILD BEDS, 2023‒2025


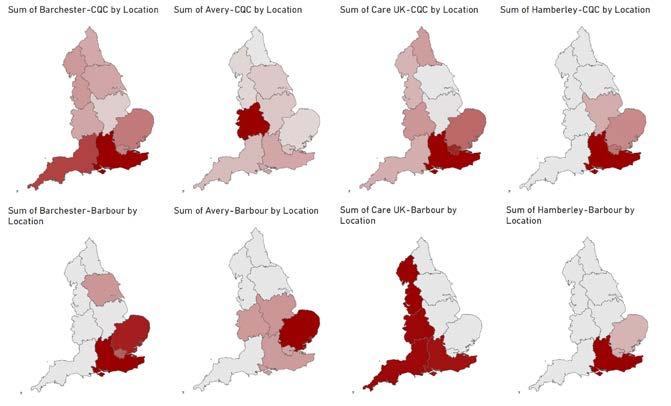
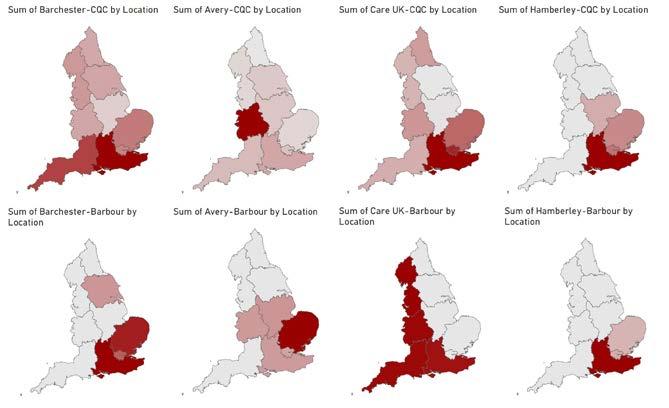


CONSTRUCTION DELAYS AND MATERIAL COST INCREASES HAVE DOUBLED TIME TO BREAK EVEN FROM PC ILLUSTRATION COSTS AND LEAD TIMES ‒ 60 BED CARE HOME
c.£6–9 4m (£100,000–157,000 per bed)
per bed)
c.£5–7m (£83,000–117,000 per bed)
c.£9–12m (£167,000–200,000 per bed)
c.£1–3m (£17,000–50,000 per bed)
c.£8–9m (£133,000–150,000 per bed)
Sector Insights | 83 Existing capacity (n=9,666) New-build capacity (n=147) Existing capacity (n=11,861) New-build capacity (n=490) Existing capacity (n=3,847) New-build capacity (n=432) Existing capacity (n=729) New-build capacity (n=388) NOTE BASED ON PLANNING APPLICATIONS IN BARBOUR ABI DATA PER MY 2022 WITH COMPLETION DATES BETWEEN 2020‒2022 AND 2023‒2025 SOURCE BARBOUR ABI; MANSFIELD RESEARCH AND ANALYSIS
Break even (post PC) Land value Build cost Total cost Total 2022 delays 2021 est timeline Home filling Home construction Year 1 Year 2 Year 3 Year 4 Year 5 c 24–36 months c 36 months c 6 months c 6 months Building (labour and material) Development (site and planning) c 12 months c 18–24 months CQC registration LA backing c 36 months c 10 weeks c 6 months c.12 months 2018–2022 2022–c.24 months c.£1–2 4m (£17,000–40,000
SOURCE BUYASSOCIATION; DEPARTMENT FOR BUSINESS, ENERGY AND INDUSTRIAL STRATEGY; KNIGHT FRANK UK HEALTHCARE PROPERTY 2017; SAVILLS ‘ELDERLY CARE SECTOR MARKET’; SAVILLS ‘HOW FAR CAN DEVELOPMENT LAND VALUE CONTINUE TO GROW?’; QUALITY COMPLIANCE SYSTEMS LTD; INTERNAL INFORMATION; MANSFIELD INTERVIEWS AND ANALYSIS
CURRENT
FIGURE FIVE
AND NEW-BUILD CAPACITY
BREAK
FIGURE
SIX TIME TO
EVEN LONGER DUE TO DELAYS AND INCREASED COST
– Barchester and Hamberley focus on where they already have homes in the South East. In contrast, Care UK has a strong pipeline in the South East but is also developing its presence in the South West, making it the only major operator to clearly focus on the west of England. Avery is expanding in new geographies that avoids the need to pay premium South East prices for land and has switched focus from the West coast to East coast.
‘Demand for land has increased in [the South East], hence prices have not levelled out there as the rest of the market,’ said Derek Breingan, head of health and social care sector for Clydesdale and Yorkshire Bank UK.
Impact of the economic climate
Despite the current inflationary pressure, there is still a lot of activity in private pay care homes. ‘We still see many [private pay] development opportunities coming across our desk, though the due diligence has been more intense on these before they have reached us in order to understand the market, availability of staff, and the sustainability of the product in that location over the long term. There is still more appetite for good
purpose-built assets,’ said Breingan.
However, to support these projects, fee assumptions in models need to reflect increased costs, with many going up to £1,250 per week, and some as high as £1,500‒2,000 per week. This also factors in construction delays of up to six months due to lack of labour or materials.
These increased costs could potentially double the time to reach break-even from practical completion (PC) and hence, higher fee assumptions are also likely to require well-funded backers with a longer-term horizon in order to raise debt funding.
In contrast, local authority-focused homes are much more impacted by the current economic climate. ‘[New-build] local authority-funded homes are not something we see much of. The financials just don’t work as the costs outweigh the fee income viability,’ said Breingan.
Though not all local authority focused operators will be equally squeezed, our interviews confirm that inflationary operating pressures, staffing challenges (and increased use of agency) coupled with higher interest rates impacting existing operators, especially if they need to refinance, will lead to an increasing exit of smaller and less profitable operators. These are unlikely to be replaced by newbuild capacity.
Conclusions and forward view
There remains a strong pipeline for new-build care homes, with LNT, Frontier Estates, and Barchester leading the way and focused on the private pay market.
While the leading operators have chosen different geographic strategies to either double down on where they currently have the most beds, (as is the case for Barchester and Hamberley, and to some degree Care UK), or to expand geographically (Care UK and Avery), they are still building capacity. This reflects the strong underlying demand fundamentals of the sector and the fact that there remains appetite to finance the right purpose built, future-proofed and operationally optimised stock.
NOTES
1 Chosen to forecast only three years due to the limited visibility of longer time periods.
2 2020‒2022 construction based on planning applications in Barbour ABI data per May 2022, and with completion dates between 2020‒2022, or 2023‒2025.
3 Likely to be even higher as LNT is the developer in the Barbour ABI data for which no contractor is mentioned.
Methodology
Barbour ABI applications have been identified as care homes for older people through a three-step process:
1. Matching planning applications to CQC registered care homes for older people (for completed homes only)
2. Matching planning applications from contractors, developers, and operators focusing solely on care homes for older people
3. Searching planning application schemes for keywords
The above methodology has allowed
us to categorise c.91% of planning applications captured in Barbour ABI’s data (c.97.3% of beds) as being either care homes for older people or not.
For a planning application to qualify for inclusion, it needs to meet four criteria:
1. Has been for a care home (in line with our above methodology)
2. Has been submitted, and be live, by May 2022 (rejected or withdrawn planning applications have been excluded)
3. Has been for a new home (extensions have been excluded)
4. Has a completion date between 2020‒2022 or 2023‒2025
Achieving 100% accuracy when analysing planning application datasets is difficult. Our sector expert team has worked to ensure this research is as accurate as possible, validating our methodology, and our results, with data from third-party sources, as well as with third-party sector experts.
84 | Sector Insights Social Care Insights
SOURCES Barbour ABI; CQC; Mansfield interviews and analysis
Acknowledgements
The Mansfield Insight articles reproduced in this report were originally published in LaingBuisson's specialist healthcare sector magazines. To find out more visit www.laingbuisson.com/laingbuisson-journals/
Insights
articlestakenfromthefollowingeditions


Care Insights
articlestakenfromthefollowingeditions


 Healthcare
Pharma Insights article taken from Life Science Insights article taken from
Veterinary Insights articles taken from
Social
Healthcare
Pharma Insights article taken from Life Science Insights article taken from
Veterinary Insights articles taken from
Social
Sector Insights | 85
To keep up to date with Mansfield Advisor's Insight features visit www.mansfieldadvisors.com/insights/

CONTACT US Dr Victor Chua Senior Partner +44 776 800 3821 victor.chua@mansfieldadvisors.com Adam Scott Senior Partner +44 790 037 5392 adam.scott@mansfieldadvisors.com Mansfield Advisors LLP London Office 11‒13 Cavendish Square London W1G 0AN United Kingdom +44 20 7307 2893
