Routledge Handbook of Transnational Organized Crime
Felia Allum, Stan Gilmore, Routledge, 2015, 711 Third Avenue, New York, NY, 10017, 550 pp., paperback, ISBN 9781138909441, $56.82
Reviewed by Candace Whitstine Department of Criminal Justice Louisiana State University - Alexandria Alexandria, LA 71302

candywhitstine@gmail.com
About the book author
Felia Allum serves as the politics section coordinator at the University of Bath, UK. Her research focuses on the relationship between organized crime and politics. She has published numerous books on the topic including ‘Camorristi’, ‘Politicians’, and ‘Businessmen: The Transformation of Organized Crime in Post-war Naples.’ Allum is also the co-founder of the European Consortium of Political Research Standing Group on Organized Crime. Co-author Stan Gilmore is a Detective Chief Inspector with Thames Valley Police, UK, and is a major crime Senior Investigating Officer. He acts as the force’s Lead Officer for kidnap and extortion investigations for the southeast of England. He is a scholar of criminology and criminal justice with interests in transnational organized crime, policing, and ethics. His published works include ‘Why We Trussed the Police: Police Governance and the Problem of Trust,’ ‘Zero Tolerance Policing,’ and ‘Understanding Organized Crime: A Local Perspective.’
Contributions of the Book
The Routledge Handbook of Transnational Organized Crime is a universal overview of transnational organized crime (TOC). The authors discuss the theories, laws, origins, evolution, impact, governance, and future of the TOC world. The handbook attempts to explain how TOC has always existed but has profoundly increased because of globalization. It also describes various categories of organized crime and the types of criminals that contribute to its pandemonium. The Handbook presents modern discussions on these subjects of TOC while also describing other recent and on-going features.
The first four chapters of the Routledge Handbook are dedicated to defining TOC and expanding its coordinating theories, concepts, and laws. Although the authors do an acceptable job of describing what constitutes TOC, they reveal that there is not yet an agreed upon definition, per say. The next six chapters reveal the origins and manifestations of TOC in Europe, America, Russia, Nigeria, and several countries along the Pacific Rim. The authors chose these locations because they appear to be the largest contributors to theTOCpandemic. Thehandbook’sfollowing seven chapters reveal the contribution of geography to the practice of TOC, the evolution of international crime, and the necessary response needed to effectively combat it. The ensuing six chapters discuss the meaning of global village; the power of media reporting; ethnicity, migration, and women involvement in relation to TOC, and TOC culture as an industry. Part five of the handbook consists of eight chapters concerning the governance of TOC. The final six chapters concentrate on the responses necessary to fight TOC now and in the future.
ISSN 2691-6495 (online) Vol. 1, January 2021 1
While the informational layout of the handbook is logical, the readability can be difficult at times. The reader should have an advanced vocabulary to successfully navigate this text. With that being said, the contributors have successfully produced an abundance of TOC information that affirms itslogic andvalidity.Thestructuralorganizationof thehandbookisfunctional;it starts at the origin of TOC and concludes with insights toward the future. Each topic builds on the previous one, and it flows in an organized and practical manner. The writing technique used is both inductive and deductive in nature. Topics range from general to specific and vice versa. Common topics are expounded upon and detailed information is explained with examples.
The Routledge Handbook of Transnational Organized Crime contributes to modern literature by shedding light on a relevant topic. Anyone who has been or will be affected by organized crime can benefit from the information in this book. It also provides academic advantages in the criminal justice field. All majors in this discipline will benefit from the acquisition and maintenance of the knowledge found within. This book provides detailed and revelatory intelligence, specifically of the organized crime world. The authors’ passion about their respective fields is palpable throughout the pages of the text. They reveal the importance of being aware of and knowing the tools necessary to combat TOC. The information is exhaustively thorough. At times, the specifics become tedious and the reader may lose focus on the importance of a topic. However, the organizational method of the written material is verification of the erudition and professionalism of its contributors.
Overall, the textual evidence found within the pages of the handbook is informative and enlightening. While some of the vocabulary may be unfamiliar, it affords the opportunity to educate the reader further in that capacity. TOC is a very real problem and, for that reason alone, this book is worthy of reading. The influences from multidisciplinary contributors make the Routledge Handbook of Transnational Organized Crime a mandatory addition to any criminal justice scholar’s library.
ISSN 2691-6495 (online) Vol. 1, January 2021 2
Abstract
Lord Northcliffe’s Newspapers in the Great War
Charlie Charrier Department of History and Political Sciences Louisiana State University - Alexandria Alexandria, LA 71302 charliecharrier@gmail.com

During the Great War, or World War I, news reports were being made on the battles against Germany from a western front, including the United Kingdom. The actions of press mogul Alfred Harmsworth played a small part in transforming the home front effort through the newspapers he acquired in his empire, and his confrontational methods. His newspapers reported on battlefield issues and confronted Parliament on said issues. Meanwhile, efforts from Parliament to create a propaganda machine would utilize Harmsworth’s credentials in initiating efforts to establish an American presence on the war effort. Through investigation of the growing empire he accumulated and the conflicts he endured, this manuscript will explore how Harmsworth has become an important figure in British press history.
Keywords: Britain, Europe, Great War, Alfred Harmsworth, Journalism
During the Great War of 1914 to 1918, journalism covered the affairs and philosophies that were being set on the battlefield. But how did that reporting affect what was being done back home? For the press of the United Kingdom, including that of Alfred Harmsworth, this meant reporting on the issues, even if the reporting caused some discussions and even tensions with the Parliament on its conduct towards the war effort. Some of these tensions were made possible through the reports made by various establishments of the news media, and of those who were leading them. The news media’s contributions also played a role in the development of the country’s propaganda machine, establishing a better understanding of their allies’ sacrifices in the war and providing the foundations for a sweeping victory. While journalism during the Great War may have not necessarily taken place in the battlefield, its position on the war’s overall history is worthy of consideration. Not only that, but these actions played a role in transforming how the United Kingdom responded to war conflicts and how the press reported on international affairs following the war. However, to evaluate the impact Harmsworth had on the British press would mean evaluating what had come before.
Throughout the eighteenth century, London’s Fleet Street had established a reputation as the center for the country’s press and a publishing powerhouse, with daily newspapers establishing their headquarters there. Providing a general idea of what was common at the time, critic Sydney Brooks appraised in 1915 on what was the typical format for a newspaper in Great Britain during the twentieth century:
“Up till [the twentieth century], a certain ponderosity had been the hall-mark of most British newspapers. They were extremely respectable, weighty and dull. They had, one might have said, a temperamental distrust of liveliness as something dangerous and ensnaring. Verbatim reports of everything reportable, long winded and eminently sententious editorials, and stodgy columns of Parliamentary debates, filled their pages.
ISSN 2691-6495 (online) Vol. 1, January 2021 3
Occasionally some journal of unusual enterprise would send a special correspondent out to Persia or Afghanistan, would dive deeply into the profundities of European politics, would open a subscription-list for some semi-public object, or produce a new scheme of army reform. It was a decent Press and a well-informed Press. It was wealthy, pontifical, respected and "literary." But it had an extraordinarily limited range. From the everyday interests of normal men and women, it stood serenely apart. It made no effort to reach the mass of the people who had grown to maturity since the setting up of a national system of education. It was curiously out of touch with the commercial life of the country.”1
Between 1860 and 1910, what has been considered Britain’s “golden age” in newspaper journalismdeveloped. Duringthe period,newpublicationsandownersbegan to establishpresence throughout the country. As this period continued on, one owner would become pivotal in not only the era of change but also in the conflict that was to come.
Alfred Harmsworth, also known as Lord Northcliffe, can be described as the British equivalent to American media tycoon, William Randolph Hearst. Like Hearst, Harmsworth habitually acquired failing newspapers to make a prosperous income. One such acquisition was his 1894 purchase of The Evening News, a paper that remained in the Harmsworth empire for the rest of its lifespan.2 Two papers in Edinburgh, Scotland, saw a merger under Harmsworth, creating the Edinburgh Daily Record that same year. In addition to these acquisitions, Harmsworth also established new publications to his news empire. Among them was The Daily Mail, with its first printing on May 4, 1896 representing, in the words of Brooks, “a revolution… not merely in the metropolis [of London] but of the whole kingdom.”3 For Harmsworth, The Daily Mail only represented part of a foundation for his empire, as another acquisition would prove pivotal.
In 1908, Harmsworth added The Times to his empire’s holdings. The newspaper was regarded by the country’s elite as an important source of political news and opinions and was a source of official information for leaders outside of Britain. Harmsworth’s acquisition of The Times, to the chagrin of his critics, meant his empire had “a key organ of the British establishment” in its possession.4 The combined empire may have been referred to by the public as “the Northcliffe press,”5 but how it spread around the country showed a compelling argument. Two years following The Times’ acquisition, an estimate of all newspapers in Britain showed a combined daily circulation of two million papers under Harmsworth’s ownership.6 Whether the public may have liked it or not, Harmsworth’s empire had a sizeable control over the country’s news efforts. As a further demonstration of Harmsworth’s control over the national press, his papers in 1914 had amassed forty percent of the country’s morning circulation, forty-five percent of the evening circulation, and fifteen percent of the Sunday circulation.7 In a time before
1 Brooks, Sydney. “Lord Northcliffe and the War.” The North American Review, Vol. 202, No. 717 (August 1915), 185.
2 Simms, Richard. “History of The Evening News.”
3 Brooks, 185.
4 J. Lee Thompson, “Fleet Street Colossus: The Rise and Fall of Northcliffe, 1896-1922.” Parliamentary History, Vol. 25, No. 1 (2006), 116.
5 Brooks, 190.
6 McEwen, John M. “The National Press during the First World War: Ownership and Circulation.”
Journal of Contemporary History, Vol. 17, No. 3 (July 1982), 466.
7 Thompson, 115.
ISSN 2691-6495 (online) Vol. 1, January 2021 4
television or even radio, these numbers proved noteworthy as nothing like it has been experienced since that time.8
Through his stakes in various publications, the national press was largely under Harmsworth’s ownership by the time of the Great War, and the support he attained would become beneficial in the conflicts he later endured. In a change of pace, however, Harmsworth sold off another of his home-grown newspapers, The Daily Mirror, to his brother Harold in 1914.9 Historian John McEwen believed that at the time, Harmsworth became more interested in “controlling the wave” of the support he had garnered over the years, believing that his support rivaled that of some government officials, including David Lloyd George.10 This support would be put to the test in the Great War that was embroiling that year throughout Europe.
In 1898, Frank Taylor wrote in a pamphlet that the press was becoming “a watch-dog for the State. Its mere existence is a guarantee against a recrudescence of abuses.”11 Taylor’s words became reality during the Great War, as one element in war planning transformed into a tense moment between the media and the government. In planning for their involvement in the Great War, the British military’s strategic plans favored the use of shrapnel weapons. What strategists did not realize was that decision gave artillery shells less of an advantage on the battlefield, with firing rates over long periods being underestimated. This crucial detail may have led to the shortage of artillery shells in early 1915, made public by Sir John French to The Times. On March 27, 1915, French, who was the British Commander-in-Chief Field Marshal, talked with the The Times. At one point, he made a call for more ammunition on the battlefield.12
French’s call to the government provided an opportunity for Harmsworth to attack personally those in charge, as his nephew was among those killed in action. Among those targets was Secretary of State for War, Herbert Kitchener, who Harmsworth believed was responsible for putting one of his family to the grave. In an article of The Times dated April 7, 1915, Harmsworth suggested that there had been an “extraordinary failure of the Government to take in hand in business-like fashion the provision of full and adequate supply of munitions” . 13
In a speech to Newcastle on April 20, 1915, Prime Minister H. H. Asquith downplayed the concerns poised by Harmsworth and his publications, assuring that the military had enough ammunition on the battlefield. However, Asquith’s statement later did not mean action was being done to alleviate the issue. Following the defeat in the Battle of Aubers Ridge on May 9, 1915, Colonel Charles Repington reported to The Times, where he was their war correspondent, that there was still a lack of artillery shells on the battlefield. Almost a week later, Repington’s account made the paper’s headline, "Need for shells: British attacks checked: Limited supply the cause: A Lesson from France."14 An article from The Daily Mail, dated May 21, 1915, further cemented Harmsworth’s opposition towards Secretary Kitchener, with the title: “The Shells Scandal: Lord
8 David Fromkin, A Peace to End All Peace (New York: Henry Holt and Company, 1989), 233.
9 McEwen, 467.
10 McEwen, J. M. “Northcliffe and Lloyd George at War, 1914-1918.” The Historical Journal, Vol. 24, No. 3 (September 1981), 653.
11 Hampton, Mark. “Liberalism, the Press, and the Construction of the Public Sphere: Theories of the Press in Britain, 1830-1914.” Victorian Periodicals Review, Vol. 37, No. 1 (Spring 2004), 80.
12 Richard Holmes, The Little Field Marshal: A Life of Sir John French (London: Weidenfeld & Nicholson, 2004), 287.
13 Ian F. W. Beckett, “The Man and the Hour: Lloyd George’s Appointment as Minister of Munitions, 26 May 1915,” in The Making of the First War (New Haven: Yale University Press, 2006), 68
14 Holmes, 287-289.
ISSN 2691-6495 (online) Vol. 1, January 2021 5
Kitchener’s Tragic Blunder. Our Terrible Casualty Lists.” By informing the public about the loss of soldiers’ lives due to the artillery shell shortage, Harmsworth was advocating for change to happen.15
However, the change Harmsworth tried to enforce did not rule in his favor, as Secretary Kitchener’s position stood firm. Kitchener’s inflexibility meant a more fervent response from the Secretary, and in turn, protests against Harmsworth’s papers. One protest saw copies of The Daily Mail being burned in front of the Stock Exchange, while another saw subscriptions of Harmsworth’s papers being canceled by the minute. These protests showcased the public’s empathy for Secretary Kitchener and a reversal of opinion towards Harmsworth. David Lloyd George informed Harmsworth of these developments, in a way of telling the paper mogul the error in his expectations.16 While Harmsworth’s attacks on Kitchener had turned against the press mogul,therewas some attention brought onto theshellcrisis, attentionthatwould result in changes for the Asquith administration.
In the time between Colonel Repington’s account and Harmsworth’s article, changes were happening within the British government. On May 15, 1915, John Fisher resigned from his post as First Sea Lord due to differences with First Lord Winston Churchill over another war campaign For the Asquith administration, the timing of Fisher’s resignation proved devastating as a meeting with opposition leaders two days later would result in Asquith forcefully requesting that his ministers resign from their posts. As a result, Asquith essentially created a new coalition government.17 Among Asquith’s new appointees was David Lloyd George as the Minister of Munitions, who would become vital in the months ahead.
OnJuly2,1915, theMunitionsof WarsActof 1915 waspassed,providing thenewAsquith administration’s response to the munition’s crisis. Through the act, the British forces Asquith was responsible for would begin to receive a constant supply of munitions. The constant supply was made possible by increasing the output of munitions and incorporating private companies into the war effort under Lloyd George’s Ministry of Munitions. In his book, Modern England, 18851945: A History of My Own Times, Parliament Conservative member J. A. R. Marriott goes into detail about the act:
“No private interest was to be permitted to obstruct the service, or imperil the safety, of the State. Trade Union regulations must be suspended; employers'profits must be limited, skilled men must fight, if not in the trenches, in the factories; manpower must be economized by the dilution of labour and the employment of women; Private factories must pass under the control of the State, and new national factories be set up. Results justified the new policy: the output was prodigious; the goods were at last delivered.”18
Throughout the Great War, Germany utilized a propaganda machine that spread their explanations for going to battle to an international audience. For Great Britain, this represented a critical hurdle to tackle. In response, the country initiated a concert of organizations and efforts that formed their own propaganda machine.
In the end of August 1914, David Lloyd George urged Parliament to consider “an organization to inform and influence public opinion abroad and to confute German mis-statements
15 Beckett, 68.
16 Holmes, 288-289.
17 Ibid., 288.
18 J. A. R. Marriott, Modern England, 1885-1945: A History of My Own Times (London: Methuen and Co. Ltd., 1960), 376.
ISSN 2691-6495 (online) Vol. 1, January 2021 6
and [fallacy].”
19 Cabinet member C.F.G. Masterman responded to Lloyd George’s call by proposing an in-house propaganda machine, believing that Germany’s showcased “an admirable object lesson in how not to do it” and that Britain’s own efforts could dismantle their shortcomings.20 Shortly after its establishment in September 1914, Masterman’s Wellington House represented the centerpiece for Britain’s propaganda machine, located within a set of flats at Buckingham Gate. What was happening within these flats were shrouded in secrecy, guarded from the public and even Parliament. Wellington House utilized a country-based structure, separating content between individual “national sections” for countries like Scandinavia and Portugal. The United States, on the other hand, was placed in the position of “a most important special branch.”21
Though originally independent from the Foreign Office, Wellington House would soon be reorganized to be included in Spring 1916.22 By this time, operations were separated into three sections: one located around Fleet Street and the Foreign Office, one at the Foreign Office, and one at Buckingham Gate. The first location specialized in both cable and wireless transmissions, filmed propaganda, as well as handling press articles. The Foreign Office location acted as the new headquarters, focusing on the former national sections as well as a section dealing with enemy propaganda. And the Buckingham Gate location oversaw written and visual propaganda, particularly pictorial propaganda, and visually created propaganda art. These new changes were approved by the War Cabinet in February 1917, under the roof of the Ministry of Blockade and to be named as the Department of Information.23
Despite the large-scale effort from the Foreign Office, it was not the only propaganda endeavor made by the country. On May 30, 1917, Alfred Harmsworth, in what was described by historian J. Lee Thompson as a “hastily called evening meeting,” contradicted his principles by accepting an offer from Prime Minister David Lloyd George and the War Cabinet. The offer required Harmsworth to act as the chairman of the British War Mission, wherein he would travel to the United States for the sake of strengthening British publicity and to better understand their new ally in the international conflict.24 Through twenty previous trips to the States since 1894, Harmsworth had attained an understanding of American culture that rivaled few in his native land.25
Through Harmsworth’s actions during the munition’s crisis of 1915, Parliament was well aware of any potential issues the press mogul could make in the States. There was also concern that keeping secrets from the Americans now seemed impossible, as they were now joining the war effort. There was consideration about whether Harmsworth would be able to “run amok” in the United States, American diplomat Edward House and British intelligence officer William
19 M.L. Sanders, "Wellington House and British Propaganda during the First World War." The Historical Journal 18, No. 1 (1975), 119.
20 Mark Wollaeger, “Impressionism and Propaganda: Ford’s Wellington House Books and the Good Soldier,” in Modernism, Media, and Propaganda: British Narrative from 1900 to 1945 (Princeton: Princeton University Press, 2006), 130.
21 Sanders, 120.
22 Ibid., 122.
23 Ibid., 124.
24 J. Lee Thompson, “’To Tell the People of America the Truth’: Lord Northcliffe in the USA, Unofficial British Propaganda, June-November 1917.” Journal of Contemporary History, Vol. 34, No. 2 (April 1999): 243.
25 Ibid., 245.
ISSN 2691-6495 (online) Vol. 1, January 2021 7
Wiseman concluded that people who would keep the chairman on the straight and narrow would accompany him on his travels.26
BetweenJuneand November 1917,HarmsworthwouldtravelacrossthecontinentalUnited States, speaking at every stop that he would visit, whether it was in private gatherings or public venues. One such stop at the Washington Press Club in early July had him discussing censorship and espionage, although the exact comments he made on those subjects were not reproduced for the press, for the sake of preventing any misconceptions about what was said. On July 21, 1917, Harmsworth spoke to fourteen thousand people at Madison Square Garden, where he received a favorable reception, including a notice from The New York Times’ Alexander Humphries. In his notice, Humphries stated that he wished that someone like Harmsworth was present in the United States’ affairs.27
During Harmsworth’s endeavors in the United States, some of the Americans he spoke with encouraged him to focus on the Midwest region. Harmsworth would go on to address this to Walter Hines Page, Britain’s American ambassador, in July by stating that “the Middle West and the West feel neglected by England, and they are neglected.”28 In the Midwest, the population had a significant German-American population. For the British, to ignore the Midwest region entirely would mean ignoring an aggressive population that held regard for the German cause, and therefore help strengthen that sympathy. Efforts in arranging Lloyd George, or some other British official, in accompanying Harmsworth to the Midwest were met with no success. Finding no other option available, Harmsworth ultimately decided to go to the Midwest on his own.
Harmsworth’s first address to the Midwest audience was conducted on October 22, 1917 at the Cleveland Armory. There, he advocated for the continued support of Liberty Bonds, bonds that were being sold in the States during the conflict. In mentioning the strengthening power of the German forces, Harmsworth also advocated for strengthened shipbuilding in the United States. By referring to the city’s recent win at the World Series, Harmsworth used the win as a demonstration of the city’s continued strength. Two days later, Harmsworth would repeat these points during an address at the Chicago Association of Commerce meeting, where he was the guest of honor. The next day, the Chicago Herald provided praise for Harmsworth’s contribution to the war discussion in the United States:
“[Harmsworth] knows. For over two years in England he led the fight against the murderous inertia of red tape and the suicidal policy of 'wait and see'... He has seen with his own eyes the red reckoning of the war... Probably no other man in this country today knows so well the necessities of his nation ... necessities to be supplied by America or not at all. We can accept his statements ... as facts and his conclusions as sound.”29
Praises like the one from the Chicago Herald were not uncommon during Harmsworth’s visit to the Midwest. Newspapers in Kansas City praised Harmsworth’s frankness in stating that the threat from Germany was a serious one, tearing away any doubts from the public. The acclaim would not go unnoticed by Harmsworth, mentioning it during an address to the St. Louis Chamber of Commerce meeting on October 26, 1917. During an appearance in Dayton, Ohio, before November 3, 1917, Harmsworth presented Orville Wright with a medal recognizing the latter’s aviation accomplishments.30 While he thought that his efforts were not enough, Harmsworth
26 Thompson, “’To Tell the People of America the Truth’”, 247.
27 Ibid., 254.
28 Ibid., 256.
29 Ibid., 259.
30 Ibid., 260.
ISSN 2691-6495 (online) Vol. 1, January 2021 8
would continue to receive praise for his addresses. Edward Hurley, the chairman of the United States Shipping Board, wrote to Harmsworth that the American population did not fully realize the gravity of the conflict until he presented it to them. Writer Mary Roberts Rinehart believed thatHarmsworth’sspirit andvalue inhis presenceduringtheAmerican tourswere “[enormous].”31
Upon his return to the United Kingdom on November 12, 1917, Harmsworth’s position as chairmanof theBritish War Missionwouldnotlastmuchlonger. In February1918, hispostwould be taken over by Rufus Issacs, also known as the Marquess of Reading, who would continue to lead the movements established by Harmsworth in the United States. Through Harmsworth’s efforts, the American government received a better understanding of the conflict they entered, including what knowledge the British had gathered of the conflict thus far. And for the first time, the traditionally inflexible Harmsworth had a sense of accountability – Thompson noted that for thepressmogul,thefive-monthtaskwas“themost importanttaskofhislife.”32 Throughtheefforts of Wellington House, the Foreign Office, and Alfred Harmsworth, the British had developed a viable propaganda machine that endured through the remainder of the war. Wellington House was able to gather a better understanding of the public about why their country’s involvement on the battlefield mattered. And through Harmsworth, the British were able to communicate their message to the Americans, illustrating them on the gravity of the conflict. With the Great War, journalism in the United Kingdom had elevated to the point of making direct change possible in the country’s government. Alfred Harmsworth used his empire to influence the public’s opinion on war matters – sometimes to his benefit, and other times not so much. In a demonstration of his the press’ ability to influence change on the battlefield over governmental affairs, personal attacks also brought attention to munition shortages. The government’s efforts in creating a propaganda machine allowed for a countermeasure against the enemy’s own, thanks to the work of Wellington House and the Foreign Office. And Harmsworth’s efforts in the United States allowed for an American audience to realize the magnitude of the situation they were intervening in. While the press in the United Kingdom would reach heights that were never attained again, these actions shaped the future of international journalism.
Acknowledgments
Many thanks to the entire History and Political Sciences Department at LSUA for their continued support to their students. This article would have not been possible without the encouragement of the Department of History and Political Sciences
Earlier versions of this work were presented during the Nineteenth Century Europe course at LSUA in the Fall of 2019, and the 2020 Undergraduate Humanities Conference at LSUA in the Spring of 2020.
An earlier version of this article was published following the Undergraduate Humanities Conference, as seen here:
https://www.lsua.edu/docs/default-source/academics/hips/2020-lsua-undergraduate-humanitiesconference-papers/charlie-charrier-the-british-press-during-the-greatwar.pdf?sfvrsn=53f96b8b_2
31 Thompson, “’To Tell the People of America the Truth’”, 261.
32 Ibid., 262.
ISSN 2691-6495 (online) Vol. 1, January 2021 9
Compliance with Ethical Standards
Conflict of Interest
Charlie Charrier declares no conflict of interest in this article.
Human and Animal Rights and Informed Consent
No human or animal tests were conducted for this article.
References
Beckett, Ian F. “The Man and the Hour: Lloyd George’s Appointment as Minister of Munitions, 26 May 1915.” In The Making of the First World War, 68–86. Yale University Press, 2012. Brooks, Sydney. “Lord Northcliffe and the War.” The North American Review 202, no. 717 (August 1915): 13.
Fromkin, David. A Peace to End All Peace. New York: Henry Holt and Company, 1989.
Hampton, Mark. “Liberalism, the Press, and the Construction of the Public Sphere: Theories of the Press in Britain, 1830-1914.” Victorian Periodicals Review 37, no. 1 (Spring 2004): 22.
Holmes, Richard. The Little Field Marshal: A Life of Sir John French. London: Weidenfield & Nicholson, 2004.
Marriott, J. A. R. Modern England, 1885-1945: A History of My Own Times London: Methuen and Co. Ltd., 1960
McEwen, J. M. “Northcliffe and Lloyd George at War, 1914–1918.” The Historical Journal 24, no. 3 (September 1981): 651–72. https://doi.org/10.1017/S0018246X0002255X.
. “The National Press during the First World War: Ownership and Circulation.” Journal of Contemporary History 17, no. 3 (July 1982): 459–86.
https://doi.org/10.1177/002200948201700304.
Sanders, M L. “Wellington House and British Propaganda during the First World War,” n.d., 29. Simms, Richard. “History of The Evening News,” February 7, 2008.
https://web.archive.org/web/20080207133412/http://www.geocities.com/eveningnewsshorts toryindex/history.htm
Thompson, J. Lee. “Fleet Street Colossus: The Rise and Fall of Northcliffe, 1896-1922.” Parliamentary History 25, no. 1 (2006): 115–38. https://doi.org/10.1353/pah.2006.0011.
. “‘To Tell the People of America the Truth’: Lord Northcliffe in the USA, Unofficial British Propaganda, June–November 1917.” Journal of Contemporary History 34, no. 2 (April 1999): 243–62. https://doi.org/10.1177/002200949903400205.
Wollaeger, Mark. “Impressionism and Propaganda: Ford’s Wellington House Books and The Good Soldier.” In Modernism, Media, and Propaganda: British Narrative from 1900 to 1945, 37. Princeton University Press, 2006.
ISSN 2691-6495 (online) Vol. 1, January 2021 10
Perception of Mental Illness Stigma in Millennials Compared to Baby Boomers
Kaelyn Rachall Department of Psychology Louisiana State University at Alexandria Alexandria, LA 71302 krachall001@lsua.edu
Abstract
The National Institute of Mental Health estimates 19% of all adults in the United States suffer from mental illness. An individual’s knowledge about mental illness is one factor that influences the perception of stigma. This study examined the difference in internal stigma perceived by Baby Boomers and Millennials. For this study, the Self-Stigma of Seeking Psychology Help (SSOSH) scale was used to assess the level of internal stigma felt by participants. Social media was used to direct participants to the survey. A total of 60 participants were included in the study. The data was analyzed using a one-tailed t-test to determine if there is a significant difference in internal stigma perceived between the two generations. The results showed that Millennials felt a significantly higher level of self-stigma related to seeking mental health services than Baby Boomers. Additional analysis determined that males felt a higher level of self-stigma than females related to seeking mental health services.
Keywords: stigma, self-stigma, seeking psychological help
Perception of Mental Illness Stigma in Millennials Versus Baby Boomers
Mental illness in the United States affects a large part of the population. The National Institute of Mental Health estimates 46.4 million adults suffered from a mental illness in 2017 (The National Institute of Mental Health [NIMH], 2019). That number represents almost 19% of all adults in the United States. (NIMH, 2019). An estimated 25.8% of adults aged 18-25, 22.2% of adults aged 2619, and 13.8% of adults aged 50 and up have a mental illness (NIMH, 2019). It is important to look at the differences in the rates of diagnosis in the different age groups and investigate what factors contribute to the different rates.
Stigma is defined as “a mark, a stain or a blemish” (Mental Health Stigma, 2019, What is Mental Health Stigma?, para. 1). There has been a stigma associated with mental illness in the general public as far back as the Middle Ages. Overton and Medina (2008) stated that in the Middle Ages mental illness was considered an example of the weakness of humankind (Overton, Medina, 2008). Overton and Medina further stated that those “people with mental illnesses were jailed as criminals.” (Overton, Medina, 2008) The stigma of mental illness still exists. People refer to others as “bipolar” or “psychotic” in casual conversations with derogatory meaning. People with mental health diagnoses are referred to as “dangerous” or “crazy” Lack of education or understanding about mental illness leads people to use these terms in a non-clinical setting in reference to negative behaviors. Individuals with mental illness often internalize the stigma associated with their diagnosis. According to Overton and Medina, "Negative connotations and false assumptions connected with mental illness may be as harmful as the disease itself" (Overton, Medina, 2008). Stigma may cause patients to shy away from seeking help or following treatment
ISSN 2691-6495 (online) Vol. 1, January 2021 11
plans. According to Avera, 87% of patients in a study on the stigma of mental illness reported experiencing discrimination based on their mental disorder, and 92% reported anticipating discrimination due to the perceived stigma associated with mental illness (Avera, 2017). The perception that they would be discriminated against has been shown to lead to lower self-esteem, failure to seek treatment, withdrawal from social situations, alcohol and drug abuse and even suicide (“How Does Stigma”, 2019).
Thestigmaof mentalillnesscan leadto discrimination. Everyday activities thattheaverage person takes for granted become difficult for the individual with mental illness simply due to the stigma associated with that diagnosis. A few examples of discrimination experienced by individuals with mental illness are “lack of employment opportunities; limitations on finding adequate shelter; barriers to obtaining treatment services” (Overton, Medina, 2008).
People’s perceptions are affected by their life experiences. Baby boomers and Millennials' life experiences are very different. According to Michael Dimock of Pew Research Center, Baby Boomers are those born between 1946 and 1964 and Millennials are those born between 1981 and 1996 (Dimock, 2019). Baby boomers grew up with the Cold War, the Civil Rights Movement, and the Vietnam War. Millennials grew up with the 9/11 terrorist attacks, a virtual explosion of technological advancements, and the explosion of social media. All of these life experiences impact the way an individual views life. This paper will examine the difference in how baby boomers and millennials view mental illness.
Purpose of the Study
Research Question (RQ): Is there a significant difference in the internal stigma perceived by Baby Boomers versus Millennials?
Hypothesis
H1: Baby Boomers have a higher level of internal stigma about seeking mental health services than Millennials.
H0: Baby Boomers do not have a higher level of internal stigma about seeking mental health services than Millennials
Definition of Terms
Stigma - The negative reaction the general population has to people with mental illness.
Self-Stigma - Negative feelings individuals with mental illness feel against self.
Millennials - Individuals born from 1981 to 1996
Baby Boomers - Individuals born from 1946 to 1964
Literature Review
The following literature reviews perceptions of mental illness across different generations. These studies suggest differences in how individuals view mental illness and the likelihood of seeking treatment. The following articles were selected based on relevance.
Avera (2017) studied the ability of Baby Boomers, Generation X and Millennials to identify mental illness. She included information about the individual’s educational experience with mental illness and personal contact with mental illness. Two hundred fifty individuals between the ages of 18 and 74 participated in the on-line survey addressing nine different mental
ISSN 2691-6495 (online) Vol. 1, January 2021 12
illnesses. She found Baby Boomers’ knowledge of mental illness was significantly less than other generations, but she did not find a relationship between accurate knowledge and education of mental illness.
Simmons, Jones and Bradley (2017) studied the relationship between knowledge of mental health and attitude change. They studied 39 university students (18 male and 21 female) from a university in the West Midlands. They assessed participant’s knowledge and stigma using The Mental Health Knowledge Schedule (MAKS), Community Attitudes toward the Mentally Ill (CAMI) and the Opinion about Mental Illness (OMI) scales. Participants were tested before and after being provided information about mental illness. The test scores were then combined to give an overall score. The levels of stigma found in the post-test were significantly less than those found in the pre-test indicating that knowledge and education about mental health can reduce the stigma.
Conner, et al (2010) studied how mental health stigma affected treatment-seeking behavior in different races differently. They looked at two different aspects of stigma public stigma and internalized stigma. There were 248 participants over the age of 60. Participants (African American and White) were surveyed by telephone. They found older adults were not likely to seek treatment due to a perception of public stigma. On the Internalized Stigma of Mental Illness Scale (ISMI) Whites had a mean score of 2.10 and African Americans had a mean score of 2.18 (Connor, et. al., 2010). This slightly higher mean score indicates that African Americans have a higher internalized stigma, which implies that they had a negative attitude toward their own mental health needs. This led to older African Americans being slightly less likely than their White counterparts to seek treatment.
St-Onge and Lemyre (2017) analyzed the scales used to assess teacher’s attitudes about mental health. The existing scale utilized the Mental Illness Awareness Survey. It consists of 3 separate scales: The Confidence scale, The Fear and Social Distance scale, and the Mental Health Disorders (MHD) Familiarity scale. Three new scales were also used: The Teacher’s Perception of Measures Offered by Adapted and Psychosocial Services scale, The Measures Offered by Teachers to Help Students with MHDs scale and the teachers’ Needs scale. They also looked at the correlation between teachers’ negative attitudes and services offered to students by the teachers. Two hundred thirty-two teachers in Canada responded to the questionnaire that included six different scales. Four variables were found to have a positive impact on the teacher’s attitude toward students with mental illness Confidence in one’s ability to convince a student to seek help improved attitude. The second and third variables dealt with a teacher’s familiarity with mental health disease and their knowledge and understanding of mental health disease. The final significant variable looked at the teacher’s perception of the accommodations offered to students. Positive findings in these areas all led to positive attitudes toward students with mental health needs.
The engagement in mental health treatment of patients with serious mental illness was analyzed by Hack, Brown, Drapalski and Lucksted (2019). Hack et al studied the patient’s experiences with mental health stigma, discrimination and the patients’ own internalized stigma. One hundred sixty-seven adults with serious mental illness were included in the study. Engagement was assessed by their primary healthcare providers using the Service Engagement Scale. They found no correlation between treatment engagement and stigma or discrimination experiences. When looking at the experience of stigma, those with a higher level of education were found to have greater treatment engagement. Internalized stigma was associated with poor treatment engagement.
Forbes, Crome, Sunderland and Wuthrich (2016) examined patients’ perceived need for
ISSN 2691-6495 (online) Vol. 1, January 2021 13
treatment in order to understand if seeking treatment is different across age groups due to the perceived need for treatment, belief that treatment needs will be met, and/or perceived barriers to treatment. They used a National Mental Health survey in Australia and included all participants who could potentially benefit from mental health services. A total of 5733 participants were included in the study. Older adults were found to be the least likely to feel a need for mental health services. Those older adults who perceived a need for services felt their needs weremetmoreoftenthanyounger participants.There wasnot a differencefoundacrossagegroups in relation to barriers.
These studies suggest a definite perception of stigma associated with mental illness. The stigma is found across age groups. The degree of education about mental illness was found to affect the degree of stigma perceived. The correlation between education about mental illness and the degree of stigma perceived supports the need for more research in this area.
Methods
Participants
All individuals included in this study participated voluntarily. Participants were recruited through Facebook and e-mail to participate in the on-line questionnaire. Individuals not identified as Baby Boomers or Millennials were excluded from the study. No other exclusion criterion was used.
Materials
Informed Consent
A basic overview and purpose of the study was provided on the consent. The risks and benefits of the study were also included in the informed consent (Appendix A). Participants were asked to check the box to indicate informed consent to participate in the study.
Demographics Participants were asked to provide gender, race and age (Appendix B).
The Self-Stigma of Seeking Psychology Help (SSOSH). scale was used for this study to determine the self-stigma felt by participants (Appendix C). A 5-point Likert scale was used to rate ten questions about the individual’s feelings about seeking psychological help. The participant ranks their feelings from strongly disagree (1) to strongly agree (5). Questions two, four, five, seven, and nine are reverse scored due to the wording of the questions. The scale was developed by the Iowa StateUniversityDepartmentofPsychology forresearchpurposes (Vogel,Wade andHaake, 2006).
Design and Procedure
A link to the questionnaire was posted on Facebook with a request for users to share the link. Once thelink wasopened,theuserreadthe informed consentandthenindicatedtheirconsentbyclicking yes. Once the consent was completed, the participant provided their demographic information. Finally, the participant answered the survey questions of the SSOSH scale. Once completed, the survey was submitted to the researcher for examination. Participants did not have access to their individual results.
ISSN 2691-6495 (online) Vol. 1, January 2021 14
Results


This current study examined the following research question. RQ: Is there a difference in the internal stigma perceived by Baby Boomers versus Millennials? H1: Baby Boomers have a higher level of internal stigma about seeking mental health services than Millennials. H0: Baby Boomers do not have a higher level of internal stigma about seeking mental health services than Millennials.
Descriptive Statistics
A total of 106 individuals responded to the survey. Of the 106 participants, 46 were removed because they were not in the Baby Boomer or Millennial age group. This left a total of 60 participants in the study. Millennials made up 52% of the participants (n=31), Baby Boomers made ups 48% of the participants (n=29) (Figure 1). Females made up 85% of the participants (n=51) while males made up 15% of the participants (n=9). All participants in the study were identified as Caucasians.
The Millennials mean score was M = 23.4, SD = 9.1 on the SSOSH questionnaire. The Baby Boomers’ mean score was M = 19.6, SD = 6.8 (Figure 2). The females’ mean SSOSH score was M = 20.8, SD = 8.4. The males’ mean score was M = 26.4, SD = 6.2 using the same scale (Figure 3).
ISSN 2691-6495 (online) Vol. 1, January 2021 15
Figure 1. Participants by generation used in the study.
31 29 28 28.5 29 29.5 30 30.5 31 31.5
Millenials
BabyBoomers
Analysis of the Research Question


A one-tailed t-test was run to determine if the difference in the mean scores of Millennials and Baby Boomers was statistically significant. The t-test was run assuming equal variance at p < 0.05
ISSN 2691-6495 (online) Vol. 1, January 2021 16
Figure 2. SSOSH mean score by generation
Figure 3. SSOSH mean score by gender.
17 18 19 20 21 22 23 24 Millennials Baby Boomers 26.4 20.8 0 5 10 15 20 25 30 Male Female
This test determined there was a statistically significant difference between the generations’ scores, t(58)= 1.9, p =.03. The difference was significantly different, but the hypothesis was rejected because the Millennials had a higher SSOSH score than the Baby Boomers. The null hypothesis was not rejected.
Additional Analysis
A one-tailed t-test was also run comparing the scores of males and females using the SSOSH test The test was run assuming equal variance at p < 0.05. The test determined that there was a statistically significant difference between the scores of males and females, t(58)= -1.9, p = 0.03
Discussion
This study compared the self-stigma felt by Millennials and Baby Boomers in relation to seeking mental health services. After analyzing the data, Millennials were found to feel more self-stigma than Baby Boomers. This was opposite of the original hypothesis. This supported the study of Forbes, Crome, Sunderland and Wuthrich (2016) who found that while older adults felt less need for mental health services, the older adults who felt the need for services did not have issues with seeking mental health services.
While the study did not support the original hypothesis, several factors could affect the stigma felt by Millennials. Millennials often feel as though society views them as weak. Seeking mental health services may be seen as proving that societal view to be correct. Millennials are also in a time in their life where they are building careers. They may fear that seeking help will be seen as a weakness in the business world. On the other hand, Baby Boomers have many more life experiences that may lead to a more open view of seeking help.
Limitations
This study is limited by having only white participants. This allows deduction to be made about white individuals, but deductions about the population in general cannot be made. The study is also limited by the small number of participants. While statistically significant results were found, a larger number of participants would be preferred. Participants had to be gathered using social media platforms because of the COVID-19 pandemic This limited the number of participants, races of participants, and cultural backgrounds. In addition, participants’ experience with seeking mental health services were not assessed which may have a significant impact on stigma.
Future Research
The SSOSH Scale (Vogel et al, 2006) could be used in other studies in this field. It would be interesting to compare the results of different races or compare the genders within specific ethnic groups. Also, as indicated, this study was limited by the small number of participants. A repeat of this same study with a larger, wider range of participants would be helpful. Another interesting area of study in this field would be including the level of education or knowledge of mental illness of the participants in the demographics. Self-stigma about seeking mental health services may be affected by the individuals’ knowledge and familiarity with mental health disorders. Generation Z was not allowed to be included because the majority of this generation is under the age of 18. It
ISSN 2691-6495 (online) Vol. 1, January 2021 17
would be very interesting to see where that generation falls on this scale as compared to Baby Boomers and Millennials.
Conclusions
While the study did not support the original hypothesis, several factors could affect the stigma felt by Millennials. Millennials often may feel as though society views them as weak. Seeking mental health services may be seen as proving that societal view to be correct. If Millennials feel more internalized stigma, they may be less likely to seek out mental health treatment. Millennials are also in a time in their life where they are building careers. They may fear that seeking help will be seen as a weakness in the business world. On the other hand, Baby Boomers have many more life experiences that may lead to a more open view of seeking help
List of abbreviations
SSOSH, Self-Stigma of Seeking Psychology Help
NIMH, National Institute of Mental Health
MAKS, Mental Health Knowledge Schedule
CAMI, Community Attitudes towards the Mentally Ill
OMI, Opinion about Mental Illness
ISMI, Internalized Stigma of Mental Illness Scale
ISSN 2691-6495 (online) Vol. 1, January 2021 18
References
Avera, A. M. (2017). Differences in mental health education across baby boomers, generation X, and millennials. Retrieved from https://digitalcommons.georgiasouthern.edu/honorstheses/294/
Conner, K. O., Copeland, V. C., Grote, N. K., Koeske, G., Rosen, D., Reynolds, C. F., & Brown, C. (2010). Mental health treatment seeking among older adults with depression: The impact of stigma and race. The American Journal of Geriatric Psychiatry, 18(6), 531
543. doi: 10.1097/jgp.0b013e3181cc0366
Dimock, M. (2019, January 17). Defining generations: Where Millennials end and Generation Z begins. Retrieved from https://www.pewresearch.org/fact-tank/2019/01/17/wheremillennials-end-and-generation-z-begins/
Forbes, M., Crome, E., Sunderland, M., & Wuthrich, V. (2016). Perceived needs for mental health care and barriers to treatment across age groups. Aging & Mental Health, 21(10), 1072
1078. doi: 10.1080/13607863.2016.1193121.
Hack, S. M., Muralidharan, A., Brown, C. H., Drapalski, A. L., & Lucksted, A. A. (2019). Stigma and discrimination as correlates of mental health treatment engagement among adults with serious mental illness. Psychiatric Rehabilitation Journal. doi: 10.1037/prj0000385
Mental health stigma. (2019). Retrieved from http://www.healthdirect.gov.au/mental-healthstigma
National Institute of Mental Health (2019). Mental Illness. Retrieved from http://www.nimh.nih.gov/
Overton, S. L., & Medina, S. L. (2008). The Stigma of mental illness. Retrieved from https://onlinelibrary.wiley.com/doi/abs/10.1002/j.1556-6678.2008.tb00491.x
Simmons, L., Jones, T., & Bradley, E. (2017). Reducing mental health stigma: The relationship between knowledge and attitude change. European Journal of Mental Health, 12(1), 25–40. doi: 10.5708/ejmh.12.2017.1.2
St-Onge, M., & Lemyre, A. (2017). Assessing teachers’ attitudes towards students with mental health disorders in 16 post-secondary institutions in Quebec. International Journal of Disability, Development and Education, 65(4), 459–474. doi:
10.1080/1034912x.2017.1406068
Vogel, D., Wade, N. and Haake, S. (2006). Measuring the self-stigma associated with seeking psychological help. Journal of Counseling Psychology, 53(3), 325-337. doi:
10.1037/0022-0167.53.3.325.
ISSN 2691-6495 (online) Vol. 1, January 2021 19
–
–
Appendix A
Informed Consent
The purpose of this study is to examine the stigma associated with seeking mental health services. The study is conducted by Kaelyn Rachall under the supervision of Dr. Sandra Gilliland. This study is a course requirement for Psychology 3017/4017 at Louisiana State University at Alexandria. The survey will take approximately five minutes to complete. There is little to no risk associated with participation in this study, however, some individuals may experience mild psychological discomfort. When at any point you wish to discontinue the survey, you may do so with no associated penalty. All information collected in this study will remain confidential. If you wish to continue with the survey, please check the box below. If you do not wish to participate, discontinue the survey at this time.
I have read the informed consent and agree to participate in the study.
ISSN 2691-6495 (online) Vol. 1, January 2021 20
Race/Ethnicity
___ White
___ Hispanic
___ African American
___ Native American
___ Asian/Pacific Islander
___ Other
Age
___ (Under 23)
___ (23-38)
___ (39-54)
___ (55-73)
___ (Over 73)
Gender
___ Male
___ Female
___ Prefer not to identify
Appendix B
Demographic Information
Appendix C
INSTRUCTIONS: People at times find that they face problems that they consider seeking help for. This can bring up reactions about what seeking help would mean. Please use the 5-point scale to rate the degree to which each item describes how you might react in this situation.
1 = Strongly Disagree 2 = Disagree 3 = Agree & Disagree Equally 4 = Agree 5 = Strongly Agree
1. I would feel inadequate if I went to a therapist for psychological help.
2. My self-confidence would NOT be threatened if I sought professional help.
3. Seeking psychological help would make me feel less intelligent.
4. My self-esteem would increase if I talked to a therapist.
5. My view of myself would not change just because I made the choice to see a therapist.
6. It would make me feel inferior to ask a therapist for help.
7. I would feel okay about myself if I made the choice to seek professional help.
8. If I went to a therapist, I would be less satisfied with myself.
9. My self-confidence would remain the same if I sought professional help for a problem I could not solve.
10. I would feel worse about myself if I could not solve my own problems.
2691-6495 (online) Vol. 1, January 2021 21
ISSN
Challenges and Opportunities for the Analysis of Terpenes in Cannabis
Terry Rodney, Jr.1,2, Patrisha Pham-Bugayong3, Bryan John J. Subong4, Lakshmi C. Kasi Viswanath5 , Ghalib A. Bello6 , and Gerard G. Dumancas2,*
1Department of Chemistry, Louisiana State University, Baton Rouge, LA, USA 70803
2Department of Mathematics and Physical Sciences, Louisiana State University – Alexandria, Alexandria, LA, USA 71302
3Department of Chemistry and Biochemistry, Benedictine College, Atchison, KS, USA 66002
4Department of Chemistry, The University of Tokyo, Tokyo, Japan 113-0033
5Department of Chemistry, Oklahoma Baptist University, Shawnee, OK, USA 74804
6Department of Environmental Medicine and Public Health, Icahn School of Medicine at Mount Sinai, Box 1057, New York 10029, NY.
*Corresponding author: 2Department of Mathematics and Physical Sciences, Louisiana State University – Alexandria, Alexandria, LA, USA 71302, Telephone: (318) 427-4436, Email: gdumancas@lsua.edu
Abstract Cannabis is a complex plant with over 400 chemical entities of which more than 60 of them are cannabinoids. While cannabinoids are the primary psychoactive and medicinal components of cannabis, volatile terpenes contribute to the many significant fragrance attributes that ultimately influence consumer preference for cannabis. There are over 120 different terpene compounds that have been identified in the Cannabis sativa plant alone. Analysis of terpenes in cannabis is extremely important because they contribute to its potency and sensory perceptions. Current methods of quantifying terpenes in cannabis involve the use of chromatographic techniques. However, such techniques require sample preparation, are time-consuming, and the instrument involved can be expensive and requires a skilled operator. The use of Fourier Transform Infrared spectroscopy and chemometrics offer a fast, non-destructive, and affordable means of analyzing terpenes in cannabis This manuscript will discuss challenges in cannabis terpene analysis using the aforementioned methods including method fragmentation and method multiplicity as well as issues related to its legal use. In general, the cannabis testing industry is poised for a breakthrough in the field of analytical science given the recent laws legalizing its medicinal use as well as advances in the field of spectroscopic miniaturization.
Keywords: Terpene, cannabis testing, Fourier Transform Infrared spectroscopy, chemometrics, chromatography
ISSN 2691-6495 (online) Vol. 1, January 2021 22
1.Introduction
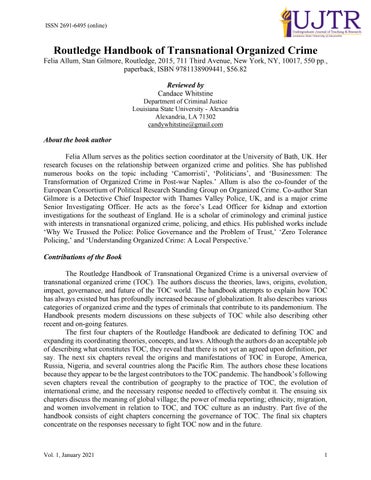
Cannabis is a genus of flowering plants belonging to the Cannabaceae family. It is most widely known for its psychoactive and medicinal properties. The genus includes a group of three plants namely Cannabis sativa, Cannabis indica, and Cannabis ruderalis, although all three may be treated as subspecies of the single species, Cannabis sativa (Figure 1).

1.1 Components of cannabis
There are approximately 500 natural components isolated and identified in cannabis (Table 1) [1] Cannabaceae plants, Cannabis sativa L. and Humulus lupulus L. are rich in terpenes, amounting to 3-5% of the dry mass of the female inflorescence. These terpenes, known to be monoand sesquiterpenes are derived from two or three isoprene units, respectively [2] There are over 120 different terpenes identified in Cannabis sativa plant alone, and every strain is known to have a different composition and of unique type of terpenes [3]. Terpenes in cannabis contribute to fragrance attributes of the cannabis products [4]. Further, studies have shown that terpenes exhibit medicinal properties as supported by in vitro, animal and clinical trials such as anti-cancer, anti-tumor, analgesic, anticonvulsive, antidepressant, ant-inflammatory, anti-oxidant, antibiotic, neuroprotective, antidiabetic, and anti-mutagenic properties among others [2] Some of the most important terpenes and their structures are shown in Figure 2. Besides terpenes, cannabis is also known to contain flavonoids, which also serve as phytochemicals similar to that of terpenes [5]
ISSN 2691-6495 (online) Vol. 1, January 2021 23
Figure 1. Cannabis plants
Figure 2. Important terpenes in cannabis
Flavonoids possess anti-fungal, anti-oxidant, and anti-inflammatory properties among others [6]. In addition to other compounds such as terpenes and flavonoids, cannabis is also known to produce terpenophenolic compounds which are in general referred to as the cannabinoids [7] While there are more than 120 cannabinoids that exists in nature, -9 tetrahydrocannabinol (THC) and cannabidiol (CBD) are identified as the most important ones (Figure 3)
Terpene chemoprofiles are important to distinguish among different strains of cannabis with otherwise identical cannabinoid content. As stated earlier, the cannabis plant is considered to be complex and researchers are still trying to understand it completely [8]. Classifying different cannabis types according to their terpene content was found to be more useful than using their cannabinoid content. This is because terpenes are considered to be one of the major compounds found in cultivars that determine the nuanced effects of how a particular consumer feels [8]. In a recent study, the process involves using the expression levels of the different terpenes that are translated well based on the 1,400 single nucleotide polymorphisms that were used as markers [9].
1.2 Molecular interactions of cannabis-related compounds
According to the United Nations Office on Drugs and Crime, cannabis is the most widely cultivated, trafficked, and consumed drug worldwide. Cannabis varieties that are cultivated for non-drug use are often referred by the term ‘hemp’ or ‘industrial hemp’ and contain less than 0.3% of THC. While both THC and CBD share the same exact chemical formula, C21H30O2, there is one distinct difference in their structure, the THC contains a

ISSN 2691-6495 (online) Vol. 1, January 2021 24
Chemical class Number of known chemical entities Amino acids 18 Cannabinoids 66 Elements 9 Fatty acids 22 Flavonoids 21 Hydrocarbons 50 Nitrogenous compounds 27 Non-cannabinoid phenols 25 Pigments 2 Proteins, glycoproteins, enzymes 11 Simple acids 21 Simple alcohols 7 Simple aldehydes 12 Simple esters and lactones 13 Simple ketones 13 Steroids 11 Sugars and related compounds 34 Terpenes 120 Vitamins 1 TOTAL 483
Figure 3. Structure of the important cannabinoids, -9 tetrahydrocannabinol (THC) and cannabidiol (CBD)
Cannabidiol
Table 1. Components found in cannabis [1].
(CBD)
cyclic ring while the CBD has a hydroxyl group in its place (Figure 3). This difference provides each their unique pharmacological properties [10]. THC and CBD are known to interact with the cannabinoid receptor type 1 (CB1) and cannabinoid receptor type 2 (CB2) located in the endocannabinoid system of all mammals. CB1, a G protein-coupled cannabinoid receptor essential for a healthy functioning brain is primarily located in the central and peripheral nervous system with high abundance in the brain. CB2 receptors, on the other hand, are found in the cells of the immune system and are known to reduce inflammation and provide moderate immune response to pathogens [11]. Most cannabinoids including endocannobinoids such as anandamide, 2-arachidonoylglycerol, and THC possess the ability to bind to the aforementioned receptors. THC, a potent partial agonist of CB1 stimulates the receptors and overwhelms the endocannabinoid system and disrupts their function. On the other hand, CBD as a negative allosteric modulator modifies the receptor’s ability to bind to cannabinoids while also changing its shape. It is for this same reason that CBD does not produce the same psychotropic effects as that of THC [1].
2. Cannabis distribution and usage
2.1 Abundance and origin
Considered to be one of the oldest cultivated plants, cannabis is grown primarily for grain and fiber and also for some recreational, medicinal, and religious purposes in East Asia. Wild cannabis contains very low amount of cannabinol (a mildly psychoactive cannabinoid found in trace amounts in cannabis) and grows across the mountain foothills from Caucasus to Western China and some parts of central Asia. While there is not much information on the prehistoric use of cannabis outside Eastern China where it was cultivated as an oil seed crop, photographed macro remains of cannabis have been recovered from burials in the Turpan Basin (ca. 800 to 400 BCE) in Northwest China [12,13].
2.2 Uses of cannabis
Cannabis has been used for medicinal and therapeutic applications for many years. Although by federal law, the possession of cannabis is illegal in the US, many states have legalized cannabis for medicinal use. While the U.S. Food and Drug administration has not approved cannabis for treatment of cancer or other medical conditions, some commercially available cannabinoids such as dronabinol and nabilone were proven to be effective in treating cancer related side effects. A recent meta-analysis conducted involving more than 3000 patents revealed that the use of cannabis and cannabinoids exhibited significant positive effects on spasticity as well as pain and bladder dysfunction in the population [14].
As a potential antiviral agent, three preclinical studies on CBD’s role were examined. The first study showed a direct antiviral effect of CBD against Hepatitis C, the second study demonstrated an indirect viral action on Kaposi's sarcoma-associated herpesvirus, and the final study elucidated that CBD alleviated effects of neuroinflammation triggered by Theiler's murine encephalomyelitis virus. All these results suggest that CBD could be a good candidate for preclinical studies of coronavirus disease-19 [15-17].
ISSN 2691-6495 (online) Vol. 1, January 2021 25
2.3 Cannabis market analysis
Due to the wide range of legitimate medicinal and therapeutic applications, legalization of cannabis is gaining momentum worldwide. This has directly triggered a dramatic increase in demand in recent years unlocking several opportunities for companies operating in this sector. It has been estimated that cannabis market size could grow close to $97.35 billion USD by 2026. This acceleration in the cannabis market growth is sustained by the high investments in the research and development of cannabis infused drugs for therapeutic applications. Also, the present-day availability of cannabis products in various forms such as concentrates, infused products and topicals no longer require consumers to stick to the traditional joints and pipes [18].
By type
Cannabis flower or bud which contains about 15% to 30% THC, is the most popular consumable product in the global market. Owing to the general belief that vaporizing or ingesting cannabis concentrates is a healthier version than smoking cannabis buds, the concentrates are getting an overall consumer’s acceptance and, hence, leads the global market. Further, the cannabis concentrates may contain more than 80% THC, which creates the euphoric “high” and comes in diverse flavors and textures [19].
By application
The expansion in the list of countries legalizing cannabis for medicinal uses accounts for the major share of the cannabis market. In the United States, where cannabis legalization is more popular, it comprises a bigger percentage of adult population in the age 50 years and older. This demographic profile is expected to increase owing to the increased risk in chronic diseases after 50 years of age. This is because cannabis-based drugs such as Sativex, Marinol, and Cesamet are gaining increased demand owing to their effectiveness in the treatment of chronic pian, multiple sclerosis, anxiety, epilepsy and cancer where conventional medicine has failed [20].
Regional analysis
The North American cannabis market is a dominating region in the world owing to the government-supported medical marijuana laws imposed in the US. In 2012, Colorado and Washington became the first two states to legalize recreational marijuana while in the year 2019, another eleven states were added to the list. With robust demands from the US, Canada, and European countries, the South American cannabis production is expected to increase in the coming years. Canada also plays a vital role in the cannabis market as it recently became the flag-bearer for recreational cannabis legalization [21].
3. Chemical analysis of cannabis
3.1 Chromatographic analysis of terpenes in cannabis
Sample preparation for cannabis starts with crushing the plant cells followed by extracting the crushed sample using an appropriate solvent (or through distillation). The desired terpene(s) is
ISSN 2691-6495 (online) Vol. 1, January 2021 26
then separated from the other unknown contents of the extracts, and analyzed and quantified using an appropriate method of analysis (e.g., thin layer chromatography (TLC), gas chromatography (GC), or liquid chromatography (LC)) [22]. Terpenes are most responsive to GC, due to their characteristic volatility. Since residual solvents used for extraction of terpenes are extremely volatile, they are not ideally analyzed by high performance liquid chromatography (HPLC) [23].
Many different methods have been refined to provide an improved and direct analysis of terpenes in cannabis. The conventional approach for terpene analysis in cannabis involves solvent extraction followed by GC with flame ionization detector (GC-FID) analysis. The FID is a good detector for GC quantification, but it does not provide any information, other than the retention time. Retention indices, which are based on retention/elution times from a particular GC stationary phase, are primarily the viable route for differentiating terpene species. The use of the FID as the primarydetectorofchoicehasseveraladvantages includinglowcost,accuracy,anduncomplicated interface, which make it a potent tool for quality control. Despite this, there is still valid concern with the type of GC detector to use best for terpene analysis [24].
A research group at PhenomenexTM developed a GC-FID method with excellent resolution and peak-shape for 33 primary and secondary terpenes found in cannabis. The selectivity and high temperature limits of their Zebron™ ZB-5PLUS column allows for great resolution of the key terpenes and high bake out for the removal of low volatile matrix contaminants that may be present [25] This allows simplicity in sample preparation prior to terpene analysis. Further, a GC-FID method for 20 terpenes from cannabis using their Zebron ZB-624 PLUS GC column was also developed. The Zebron ZB-624 PLUS GC column upper temperature limit is 300°C/320°C, which gives the flexibility to elute out high boiling terpene analytes [26]. In addition, Cardenia et al. developed a fast GC-FID routine method for the determination of main terpenes and total CBD present in hemp. Their study resulted in a fast detection of 29 different terpenes and CBD (with total analysis time of <16 min) without derivatization and with a satisfactory sensitivity (LOD=0.03 – 0.27 µg/mL, LOQ=0.10 – 0.89 µg/mL) and repeatability (interday RSD was <7.82 %, whereas the intraday RSD was <3.59 %) [27]. Overall, this GC-FID method is a primary choice for fast, robust and high-sensitive determination of main terpenes and total CBD present in hemp.
Another dependable way to quantify residual solvents in a cannabis sample is through headspace gas chromatography–flame ionization detection (HS-GC-FID). This serves as another technique that can be used for sample preparation of terpenes. Headspace sampling is based on heating the solid or liquid sample inside a sealed vial (thereby, driving the volatile compounds into a gas phase), equilibrating the system and then analyzing the air above it. The process is relatively interference-free because it allows only volatile analytes to be extracted from the solid/liquid sample into the gas phase [28]. An aliquot is then withdrawn from the headspace of the vial and analyzed by GC-FID in order to determine the volatile components of the sample. One approach for HS-GC-FID that is particularly useful for analyzing terpenes in cannabis concentrates is the full evaporation technique (FET). FET sample preparation involves the use of a miniscule sample amount (e.g., 20–50 mg), which effectively creates a single-phase gas system in the headspace vial at equilibrium [29]. FET is prime for problematic matrices like cannabis concentrates because it effectively eliminates matrix interferences that contribute to inaccurate quantification. Additionally, it has little to no manual sample handling and a very small sample size and high sensitivity can be achieved through the creation of a single-phase system in the headspace vial
ISSN 2691-6495 (online) Vol. 1, January 2021 27
[30]. In one study, an FET headspace GC-FID method was used to analyze a comprehensive suite of terpenes in hops that are also found in cannabis samples. Good chromatographic separation allowed quantification of critical compounds including α-pinene, β-myrcene, α-humulene, βcaryophyllene, and caryophyllene oxide. Their method utilized straightforward FET sample preparation. In addition, because it prevents nonvolatile material from entering the GC system, the method was found to contribute to column lifetime and also reduced inlet maintenance. The techniqueeliminated theneed foradditionalcapital investmentfordifferent instrumentationand/or columns [31].
Headspace (HS), Solid Phase Micro-extraction of Headspace (HS-SPME) or Split/Splitless Injection (SSI), on the other hand, are viable techniques and have advantages and disadvantages for terpene analysis. SPME uses a fiber coated with a liquid (polymer), a solid (sorbent), or a combination of both. The fiber coating extracts the compounds from the sample by absorption in the case of liquid coatings or absorption in the case of solid coatings. The SPME fiber is then inserted directly into the chromatograph for desorption and analysis. SPME can be performed by either direct immersion with the sample or headspace sampling. HS-SPME is considered an effective technique since this approach eliminates the complex oily matrix. Conventional HS as previously discussed also targets volatiles that include the terpenes, leaving the high molecular weight oils and cannabinoids behind [23]. In addition, the method does not require organic solvents, and with the use of an auto-sampler, is highly reproducible and requires little “hands-on” sample preparation time. Due to the technique’s high sensitivity, very little sample is required. Moreover, coupling this with HS produces very clean chromatographic analysis with little to no background from the extracted matrix, which in turn will maintain the cleanliness of the GC system. Based on this, an HS-SPME method was developed that allowed an easy and accurate determination of terpene content in cannabis. The method was shown to be useful in the analysis of the three important terpenes found in cannabis: -pinene, (R)-(+)-limonene, and linalool, but could also be used for other terpenes as well [32]
Besides the aforementioned techniques for the analysis of terpenes in cannabis, the use of GC-MS, another widely used technique, offers the added benefit of spectral peak authentication to warrant that identification is accurate with no co-eluting interferences [33]. The primary choice for a research setting is the mass spectrometer (MS) detector. It is more expensive and complicated than FID but it provides both good quantitative capabilities. It also provides the mass spectra for each species that elutes from the chromatograph. However, for terpene analysis, it may still not be the best detector of choice. Since terpene class molecules share many structural and functional similarities, even their fragmentation and sub-sequential identification by MS may lead to unpredictable results and should be backed by other chromatographic identification methods. Despite the possible complicated interpretation, MS is still a better qualitative analysis tool than the FID, especially for distinguishing non-isobaric terpenes [24] Moreover, GC-MS provides a different level of sensitivity.
Coupling GC-MS with HS has been demonstrated in some studies. This combined with the Agilent Residual Solvent Analyzer, an Agilent VF-35 GC column and appropriate restrictors allowed total chromatographic separation of 22 targeted terpenes that were naturally occurring in Cannabis sativa plant material and wax samples that give the plant its distinctive aroma and character. The analysis used both FID detection for quantification and extended linear range, and mass selective
ISSN 2691-6495 (online) Vol. 1, January 2021 28
detection (MSD) for elaborate terpene identification. Using integrated Capillary Flow Technology to split the column effluent in a controllable and precise manner to the two detectors, this ultrafast methodology almost quadrupled laboratory productivity compared to traditional terpene analysis and brought analysis time down from approximately 30 minutes per sample to just 6 minutes [34]. In another study, coupling of the GC-MS with a simple HS method was used in the analysis of the terpene/terpenoid profiles of both hops and cannabis. The method was able to detect the characteristic terpenes and terpenoids of both, and distinguished between different hops varieties [35].
Another GC‐MS method was developed and validated for the quantification of terpenes in cannabis plant material, which included α- pinene, β-pinene, β-myrcene, limonene, terpinolene, linalool, α-terpineol, β-caryophyllene, α-humulene, and caryophyllene oxide. The concentrationresponse relationship for all analyzed terpenes using the developed method was linear with r2 values > 0.99. The average recoveries for all terpenes in spiked indoor cultivated samples were between 95.0–105.7 %, with the exception of terpinolene (67–70 %). The measured repeatability and intermediate precisions (% relative standard deviation) in all varieties ranged from 0.32 to 8.47%. The limit of detection and limit of quantitation for all targeted terpenes were determined to be 0.25 and 0.75 μg/mL, respectively. The proposed method was found to be highly selective, reliable, and accurate, and was applied for the simultaneous determination of the aforementioned major terpenes in the Cannabis sativa biomass [36].
Other elaborate coupled GC systems such as the development of a novel Static Headspace Gas Chromatography Mass Spectrometry (SHS)-GC-MS-MS method for the simultaneous analysis and quantification of 93 terpenoids was also studied. This method was found to be especially valuable for the analysis of cannabis in inflorescences and extracts, as they possess a very rich repertoire of terpenoids, but could also be potentially extended to other plants [37]. The Pegasus BT 4D facilitated fast and confident terpene profiles of cannabis strains through enhanced twodimensional chromatographic resolution and high-performance time of flight mass spectrometry (TOF-MS). Robust compound characterization was achieved through spectral similarity searches of large, well-established databases, and mass D values increased confidence in these determinations [38]. Recently, new technology based on vacuum ultraviolet spectroscopy (VUV) was developed as a new GC detector. The VUV detector probed in the 125-240 nm wavelength and since virtually all chemical compounds absorbed light in this range, the VUV enabled analysis of virtually all molecules; making it an essentially universal detector [15]. The VUV detector filled a need, which was complementary to MS detection in terms of the qualitative information it provided. Using the VUV, each compound presented a particular absorbance spectrum. Different species of terpene mixtures that can be difficult to be differentiated by their electron ionization mass spectra, can be well discriminated based on their VUV spectra [39]. Thus, it is no longer necessary for a baseline chromatographic separation of components in a mixture since analytes exhibit different spectra. Therefore, co-eluting peaks can be separated post-run through the use of library spectra and built-in instrument software. This process of “deconvolution” assumes that two co-elutingterpeneswill giveapeakwith anabsorbancespectrum equalto thesumof thetwosingle absorbance spectra [28]. It is possible to fully separate the two peaks after the run due to their different absorbance spectra [39] With the ability to deconvolute unresolved peaks, a lengthy temperatureprogram toseparate all terpenes(isomeric)isnolongernecessary,thus, allowingrapid analysis times. In addition, the presence of co-eluting components in complex matrices, that elude
ISSN 2691-6495 (online) Vol. 1, January 2021 29
GC detectors, can be identified easily based on comparison of the measured spectra with pure reference spectra contained in the VUV spectral library. In a recent study demonstrating this, the vacuum ultraviolet absorption spectra of 41 different standard terpenes were investigated and compared. The spectra were found to be highly featured and easily differentiated. The technique was demonstrated to be a powerful tool for reliable and accurate qualitative and quantitative analysis of terpenes from complex natural mixtures [39].
The other issue in terpenes analysis is the extraction process itself. Terpenes can be extracted with the use of solvents (e.g. alcohols, n-alkanes among others), however the procedure is usually expensive and tedious. The plant needs to be manually crushed and then solvent is used to extract components from the plant, ideally at least 3 times and combined to achieve decent results. The problem is that some terpenes may be extracted better with a certain solvent, making their extraction easier and more optimized than others [40]. The choice of solvent can cause selectivity against some terpenes, which hinders the extent of analysis. HPLC is generally not recommended; since terpenes have very low ultraviolet (UV) or MS sensitivity [23]. In addition, co-elutions of the cannabinoids and terpenes are very likely when analyzing real cannabis samples by HPLC-UV methods. While HPLC may be tempting to use for terpenes analysis, a GC-FID or GC-MS is really the most straightforward and recommended way of analyzing terpenes in cannabis as mentioned earlier. Terpenes, being relatively volatile and neutral, and are better analyzed using GC in general. However, looking onward, laboratories performing routine testing of cannabis will need to test efficiency and, once regulations are established, test also for other things in the matrix as well (i.e. pesticides). LC-MS-MS (liquid chromatography tandem mass spectrometry) represents an ideal analytical platform to address all of these testing needs. As demonstrated recently showing the utility of the Triple Quad™ 3500 LC-MS-MS system for the analysis of terpenes in cannabis products, instrument performance was excellent, with precision within < ± 8% (n = 3) and signal-to-noise > 10 at 1 ppb for all target compounds. Spike recoveries of 80120% showed the quantitative accuracy of the method in a variety of cannabis matrices [41]. On the other hand, a liquid chromatography-ultraviolet (LC-UV) analysis of terpenes in cannabis is not recommended and will likely cause more issues than it will provide solutions. A good solution to the co-elutions by LC-UV is to choose a good GC-HS method. Interferences from the complex sample matrix, as well as the much fewer volatile cannabinoids can be eliminated then. Table 2 summarizes various chromatographic techniques used in analyzing terpenes in the recent years.
ISSN 2691-6495 (online) Vol. 1, January 2021 30
Table 2. Chromatographic methods of analyzing terpenes in cannabis in the recent years. References Method/ Instrumentation Objectives Terpenes analyzed Results
[25] GC-FID To develop a GCFID method with excellent resolution and peak-shape for 33 primary and secondary terpenes found in cannabis
[26] GC-FID To develop a GCFID method for 20 terpenes from cannabis
Examples include αPinene, Camphene, Myrcene, αPhellandren, 3-Carene, α-Terpinene, pCymene,Limonene, Ocimene-, Linalool Fenchol, Isoborneol
Examples include αPinene, Camphene, βMyrcene, (-)-β-Pinene, d-3-Carene, αTerpinene, d-Limonene
[27] GC-FID To validate a method for simultaneous determination of both terpenes and cannabidiol in hemp
[31] Full Evaporation Technique (FET)HS-GC-FID
To demonstrate the viability of FET headspace injection and GC-FID analysis of residual solvents in cannabis concentrate method
Twenty-nine (29) different terpenes
Great resolution of key terpenes and high bake out for the removal of low volatile matrix contaminants present.
Examples include αpinene, β-myrcene, αhumulene, βcaryophyllene, and caryophyllene oxide
The ZB-624PLUS was shown to have an upper temperature limit of 300/320 °C, which gives the flexibility to elute out high boiling terpenes analytes.
The study resulted in a fast detection of 29 different terpenes and CBD (total analysis time <16 min) without derivatization and with satisfactory sensitivity and repeatability.
The study showed quantification without the use of matrixmatched standards by creating a single non-partitioning phase system in the headspace vial. Good chromatographic separation allowed quantification of critical
Vol. 1, January 2021 31
ISSN 2691-6495 (online)
[39] GC-VUV To investigate and compare the vacuum ultraviolet absorption spectra of 41 different standard terpenes
Forty-one (41) different standard terpenes and four turpentine samples
compounds across the volatility range.
The spectra were found to be highly featured and easily differentiated. The technique was demonstrated to be a powerful tool for reliable and accurate qualitative and quantitative analysis of terpenes from complex natural mixtures.
[42] GC-MS To conduct terpene analyses using a Shimadzu GCMSQP2010SE single quadrupole mass spectrometer with the HS-20 headspace autosampler for sample introduction
[38] GC-MS To develop an analytical approach for the effective characterization of terpenes in different cannabis strains
Forty-one (41) different terpenes
It was demonstrated that different storage conditions can change terpene results over time and this should be taken into consideration when analyzing cannabis samples as the results show less than expected results.
Forty (40) terpene standards
The BT 4D facilitated fast and confident cannabis product “fingerprinting” through enhanced two-dimensional chromatographic resolution and high performance TOFMS. Robust compound characterization was achieved through spectral similarity searches of large, wellestablished databases. Mass values increased confidence in these determinations.
ISSN 2691-6495 (online) Vol. 1, January 2021 32
[36] GC-MS To develop and validate terpenes in cannabis plant material
Examples include αpinene, β-pinene, βmyrcene, limonene, terpinolene, linalool, αterpineol, βcaryophyllene, αhumulene, and caryophyllene oxide
The measured repeatability and intermediate precisions (% relative standard deviation) in all varieties ranged from 0.32 to 8.47%. The limit of detection and limit of quantitation for all targeted terpenes were determined to be 0.25 and 0.75 μg/ mL, respectively. The proposed method was found to be highly selective, reliable, and accurate and was applied for the simultaneous determination of these major terpenes in the C. sativa biomass.
[34] HS-GC-MS To provide full chromatographic separation of 22 targeted terpenes that naturally occur in C. sativa plant material and wax samples
Twenty-two (22) terpenes
The analysis can be completed in less than 6 minutes and uses both FID detection for quantification and extended linear range, and mass selective detection (MSD) for terpene speciation. This ultra-fast methodology almost quadrupled laboratory productivity compared to traditional terpene analysis, which takes approximately 30 minutes per sample.
[37] (S)HS-GC-MSMS To develop a novel Static Headspace (SHS)-GC-MS-MS method for the
Ninety-three (93) terpenes
This method is especially valuable for the analysis of Cannabis inflorescences and extracts, as they possess a very
ISSN 2691-6495 (online) Vol. 1, January 2021 33
simultaneous analysis and quantification of 93 terpenoids
[43] HS-SPME To develop a simple headspace SPMEGC/MS method for the analysis of terpene/terpenoid profiles of both hops and cannabis
Examples include βmyrcene, caryophyllene, and humulene
rich repertoire of terpenoids, but could potentially be applied to other plants.
A simple headspace SPMEGC/MS method was used in the analysis of the terpene/terpenoid profiles of both hops and cannabis. The method was able to detect the characteristic terpenes and terpenoids of both, and to distinguish between different hop varieties.
[32] HS-SPME To develop an HSSPME method which allows for an easy and accurate determination of terpene content in cannabis
Examples include Pinene, (R)-(+)
Limonene and Linalool and other terpenes as well
The quantitative analysis of selected terpenes was achieved using HS-SPME with a 100-µm PDMS fiber. Accuracies were >90% with precision of <3% RSD for spiked replicates. The method provided results comparable to a conventional solvent extraction procedure.
[41] LC To develop an LCMS/MS method that uses atmospheric pressure chemical ionization (APCI) and the budgetfriendly SCIEX
Triple QuadTM 3500 LC- MS/MS system for the analysis of
Seven (7) terpenes found in cannabis
These results demonstrated the utility of the Triple Quad™ 3500 system for the analysis of terpenes in cannabis products. Instrument performance was excellent, with precision within < ± 8% (n = 3) and signal-tonoise > 10 at 1 ppb for all target compounds. Spike recoveries of 80-120% showed the quantitative accuracy of the
ISSN 2691-6495 (online) Vol. 1, January 2021 34
terpenes in cannabis products
method in a variety of cannabis matrices.
ISSN 2691-6495 (online) Vol. 1, January 2021 35
3.2 Spectroscopy and cannabis terpene testing and research
Spectroscopic techniques have becoming more popular than the chromatographic methods in analyzing terpenes in cannabis. Spectroscopy is the science which deals with the interaction between matter and electromagnetic radiation as a function of the wavelength or frequency of the radiation [43] In this regard, spectroscopy can be classified according to the nature of interaction between the energy and the material. These types include: absorption spectroscopy, emission spectroscopy, elastic scattering and reflection spectroscopy, impedance spectroscopy, inelastic spectroscopy, coherent or resonance spectroscopy and nuclear spectroscopy [44,45].
GC with FID is currently the foremost method for quantitating terpene mixtures as mentioned earlier. This process involves sending a sample through an effusion tube and separating the sample into differing density components. The components are then exposed to a flame in order to ionize them. Finally, a sensor detects the composition of the sample and sends the results to be processed into a data set. A previous study used GC-FID to extract the terpene trilactones from ginkgo leaves in order to provide a quick, effective, one step determination of the compound [46]. Despite the study being successful, there are still limitations to this technique such as cost, time, and certification. Moreover, recent literatures in Cannabis research have utilized nuclear, inelastic scattering (Raman) and absorption spectroscopy (e.g., FTIR).
Nuclear spectroscopy is a specific field of spectroscopy which deals with the properties of a nucleus in probing properties of materials [47] Usually, the emission or absorption of radiation by the nucleus creates a signature by which an identity of a molecule can be recorded and identified. One equipment used in nuclear spectroscopy is the nuclear magnetic resonance (NMR) spectrometer. The NMR spectrometer records the electromagnetic signal with a frequency characteristic to a given nuclei when the nuclei is perturbed by a weak oscillating magnetic field [48,49] In this aspect, the one-dimension proton (1H) NMR is one of the most common NMR techniques. The proton is known to be the most sensitive nucleus that gives sharp signals in an electromagnetic field [50] Cannabis secondary metabolites can be identified and quantified using their respective chemical shifts (i.e., signals) and their relative height against a known standard. Using NMR, it was found out that the substitution of the carboxylic acid on the cannabinoid nucleus has great effect on the chemical shifts of the said compound. This shows that changes in functional groups can yield specific chemical shifts which can be used for identification of various metabolites such as terpenes [51]. Moreover, variouscultivars of cannabis have been differentiated based on the secondary metabolites they produced. NMR has allowed a non-destructive and noninvasive way to analyze these compounds without too much complicated prefractionation steps [52].
Another noninvasive and nondestructive technique to determine terpenes and secondary metabolites in cannabis is Raman spectroscopy [53]. Raman is a light scattering technique where a high intensity light source is bombarded onto a sample. The molecules in the sample would then scatter the incident light. Mostly scattered light, called Rayleigh scatter, is of the wavelength as the laser source. This in effect does not give useful information. On the other hand, Raman scatter which is a small amount of light are scattered at different wavelengths and are dependent on chemical structure of a given molecule. This signature scatter gives useful information on the
ISSN 2691-6495 (online) Vol. 1, January 2021 36
identity and nature of the analyte [54]. Raman spectroscopy was found to identify different cannabis species based on the secondary metabolites present [53] Moreover, it was found to be useful to quantify terpenes and other secondary metabolites in a nondestructive method [55].
FTIR with attenuated total reflectance accessory (FTIR-ATR), on the other hand is a universally useful instrument, with information rich spectra. It is also considered as relatively fast and easy while also being inexpensive and is very sensitive when measuring samples. FTIR produces much higher quality spectra than could previously be obtained [56]. Despite FTIR-ATR not being able to detect some molecules, it still has a very wide range of samples that can be measured quickly, efficiently, and with much accuracy [57]. FTIR can provide a wide range of data points when compared to other spectroscopic methods, for example GC-FID. The cost alone for use of these machines pushes for one to purchase a machine of this sort. Using a novel approach, such as FTIR, to measure samples will save time and expense. Recent studies using gas chromatography
Fourier transform infrared spectroscopy (GC/FTIR) was conducted to analyze various terpenes, one of which included p-cymene [58]. Another study was performed using GC/FTIR; however, it also involved using a wall-coated open tubular Carbowax capillary column in order to increase sensitivity and efficiency [59]. Both studies provide an in-depth view of the advantages that FTIR can offer when analyzing terpene mixtures. Table 3. summarizes various spectroscopic methods used in analyzing terpenes in the recent years.
ISSN 2691-6495 (online) Vol. 1, January 2021 37
–
Table
References Method/ Instrumentation Objectives Terpenes analyzed Results
[60] Coherent antiStokes Raman Scattering (CARS) microspectroscopy
To spatially map secondary metabolites
[53] Raman spectroscopy
To differentiate cannabis from hemp using a noninvasive and nondestructive method
Essential oils in trichomes, fluorophores, cannabinoids, monoterpens, fatty acids
Cannabigerol, cannabigerolic acid (CBGA), THC, delta-9tetrahydrocannabinolic acid (THCA), CBD, and cannabidiolic acid (CBDA)
Mapped secondary metabolites through a label-free and nondestructive method and distinguish between cell and chemo-types.
Developed a method which can accurately differentiate hemp, CBD-rich hemp and cannabis (THCA-rich hemp)
[61] Raman spectroscopy
To characterize essential oils and differentiate fractions containing terpenes and terpenoids
[55] Near-infrared spectroscopy and FT-NIR spectrometer
To develop a more accurate quantitative technique for cannabinoid analyses
Terpenes and terpenoids which include limonene, estragole, ocimene, carene, etc.
Cannabinoids CBDV, Δ9-THCV, CBC, CBD, Δ8-THC, Δ9-THC, CBG and CBN
Characterized the hemp essential oil and its five fractions using a noninvasive technique.
Quantitatively determined cannabinoids in dried and ground hemp samples using tandem-NIR spectroscopy and FT-NIR. A predictive model was also proposed.
2691-6495 (online) Vol. 1, January 2021 38
ISSN
3. Spectroscopic methods of analyzing terpenes in cannabis in the recent years
[62] FTIR Spectroscopy To determine quantitatively cannabinoid levels in samples
THC, THCA, CBD Potency levels of THC, THCA and total THC in distillate and concentrate samples were determined with high accuracy.
[52] NMR spectroscopy To discriminate Cannabis cultivars based on their secondary metabolite
[63] FTIR
To optimize Cannabis grows through secondary metabolite production
Δ9tetrahydrocannabinolic acid (THCA) and cannabidiolic acid (CBDA)
Cannabinoids, cannabidiolic acid and cannabidiol
Demonstrated differentiation of various cultivars without any prepurification steps.
Quantitatively mapped the effect of different light intensities on the secondary metabolite production of Cannabis.
[64] Functional Near Infrared Spectroscopy
To determine the effects of Δ9tetrahydrocannabin ol on human prefrontal activity
[55] Near infrared Spectroscopy
Δ9tetrahydrocannabinol
Cannabis intoxication was associated with an increase on hemodynamic blood flow at the prefrontal cortex of the human brain (in vivo study).
To estimate the content of cannabinoids, terpenes and secondary metabolites
Cannabinoids and terpenes
NIRS and FT-IR predicted the contents of secondary metabolites in Cannabis using a nondestructive and cheaper method compared to GC.
ISSN 2691-6495 (online) Vol. 1, January 2021 39
[65] NMR spectroscopy To quantify CBD in industrial products
CBD
1H NMR was utilized to quantify CBD in products derived from Cannabis seeds. Cannabinoid was suggested as a potential molecular marker for food processing quality.
ISSN 2691-6495 (online) Vol. 1, January 2021 40
3.3 Chemometrics in cannabis terpene testing
Chemometrics is an interdisciplinary method of analytical chemistry in which trends are extracted from data sets. Trends are often extrapolated and applied based on statistical and mathematical methods combined with fields such as mathematical logic and chemistry. Chemometrics has also been proposed to be used in the area of forensic science as well as in the biotech industry [66]. The study of chemometrics has given rise to two commonly used predictive modeling methods: partial least squares (PLS) and principal components regression (PCR) [67,68]. PLS, is a technique primarily suited for situations in which constructs are measured by a very large number of indicators and where maximum likelihood covariance-based structural equation modelling and spectroscopic tools are utilized [69] PCR, on the other hand, is a regression analysis technique for analyzing multiple regression data that suffer from multicollinearity [70]. In the comparison between PLS and PCR, no significant differences were reported in the prediction errors of either. PLS virtually always required fewer latent variables than PCR, however this did not appear to influence predictive ability [71].
Thefutureof thechemometricsfieldiscurrentlyprojectedin thedirectionofmodeling,calibration, and pattern recognition sequences [72]. Other areas that are focused upon include multivariate process modelling and monitoring [73]. Chemometrics is projected to become a critical tool in the future for qualitative analysis, especially when considering the approaching development of highdimensional data [74] The long-term hope of chemometrics will mature as a trustworthy science and change the way analytical methods are developed and subsequently applied [75].
Studies involving chemometrics as applied to cannabis terpene quantification typically require the use of GC-FID since terpenes are considered volatile compounds, especially compared to the cannabinoids. Most applications on the use of FTIR and chemometrics as applied to terpenes are in the analysis of cannabinoids. THC, a cannabinoid considered to be the main target for potency analysis has a boiling point of around 315°F whereas most volatile terpenes will start to evaporate at around 70°F. Thus, for terpenes, the type of analysis to be performed would typically be using the GC. The Cary 630 FTIR spectrometer offers a great tool to test strain samples of cannabis. This would allow growers to see the composition of cannabinoids and terpenes in its gas and solid forms. Many cannabinoids and terpenes have varying decarboxylation points, which implies that some methods of consumption can be better than others for different strains [76] FTIR-ATR with PLS in particular, was shown to accurately quantify THCA and CBDA in dried cannabis flowers, providing a quick, convenient, and portable potency test for recreational and medicinal cannabis cultivars [63]. Whereas GC-MS and NMR require sample preparation, and a specialist analytical lab, which could consequently lead to delays, an FTIR analysis coupled with chemometrics can be performed in a rapid and accurate manner. Further, FTIR can be considered an inexpensive and an accurate method [77]. In another study, a novel mid-infrared spectrometer coupled with PLS was developed for general quantitative chemical analyses for cannabinoid and terpene profiling of cannabis oils [78].
ISSN 2691-6495 (online) Vol. 1, January 2021 41
4.Challenges, future directions, and recommendations and the maturity of the cannabis industry
4.1 Challenges and future outlook for analytical laboratory
The future of cannabis lab testing estimates is challenging to find. The primary numbers being floated around originate from a June 2015 market report published by GreenWave Advisors titled Marijuana lab testing: An in depth analysis of investing in one of the industry’s most attractive plays. GreenWave suggested that if the U.S. were to quickly legalize cannabis at the federal level, lab testing revenues alone would be $553 million by 2020, $866 million including related activities such as data analysis and consulting [79-82] Another forward-looking statement by Research and Markets in March 2017 suggested the cannabis testing market across the globe could be valued at $1.4 billion by 2021, affected positively by legalization of medical cannabis, laboratory growth, and information technology adoption, negatively by analytical instruments' high costs and a "dearth of skilled professionals" [82]. A more conservative number was offered by Coherent Market Insights in July 2018, suggesting a global market at $1.5 billion USD by 2026 [82,83]
The cannabis industry and cannabis testing are in their infancies. As the need for better quality control continues and standardization is introduced, it is likely that lower limits for the various cannabis contaminants will be established and regulations will be introduced. Mass spectrometry will likely play a greater role in quantitation as detection levels are lowered and confirmatory tests are required. The health benefits of terpenes present in cannabis will also provide a fertile area of scientific research. CBD, CBGand other compounds appear to have a synergistic relationship with each other as well as with various THC forms and terpenes. This field needs much more investigation to determine mechanisms of action, bioavailability and health benefits” [82,84,85]
Besides the aforementioned issues and challenges, it was demonstrated that different storage conditions can change terpene results over time, and this should be taken into consideration when analyzing cannabis samples as result underestimation can occur. Varying storage conditions and degradation experiments should be the next study in the ever-changing world of regulatory cannabis testing [42].
4.2. Challenges and future directions in analytical methods
Achieving the correct analytical result for terpene analysis is a challenging task that includes considering various critical factors such as equipment selection, instrument method parameters, and method extraction optimization whenever necessary. In order to achieve a clear path to establish a scientifically justified validation method for terpene analysis, it is recommended to have guidance from the US FDA-regulated Pharmaceutical Industry’s cGMP framework. This itself will stand up to legal scrutiny [86].
Although it is believed that liquid chromatography (LC) and mass spectrometry (MS) will likely become power horses for cannabis testing, there are still opportunities for innovation especially as with regards to instrumentation since this directly affect how sample preparation is carried out [87]. For example, Big Sur Analytics in California has introduced a BSS 2000 instrument that
ISSN 2691-6495 (online) Vol. 1, January 2021 42
provides an easy-to-use and portable device for the analysis of terpene and cannabinoid profiles in just 2 minutes within the mid-IR region [87]
In the upcoming years, cannabis terpene testing will be more convenient with the use of FTIR techniques. For example, Agilent has recently released a Cary 630 for quick and real-time potency analysis of cannabinoids in cannabis. Although not terpenes, the application can be utilized in such compounds [62]
Despite that mass spectrometry techniques have been employed to some extent in cannabis research, it was suggested by Nie, et al. (2019) to use the technique widely by utilizing superior combination of selectivity and sensitivity to study diversity of cannabis and its products which include terpenes. Good Laboratory Practices (GLP) and strict adherence by testing labs with established regulations by well-established organizations such as the Association of Official Agricultural Chemists should be implemented. This would allow safe chemical monitoring and integrity of cannabis materials and products [88].
Moreover, the use of noninvasive and nondestructive techniques such as NMR, Raman and FT-IR are new alternative methods to the established techniques such as LC and GC-MS. These nondestructive techniques allow fewer processing steps and sample preparation, cheaper price, and high accuracy without sacrificing high-throughput analyses [89]. Moreover, these techniques allow samples to be recovered after analyses; hence, samples can be analyzed in real-time.
4.3 Challenges related to method fragmentation and method multiplicity
Method fragmentation is one of the key issues in analyzing terpenes and other analytes in cannabis. This happens when results differ due to variations in sample preparation techniques used. For example, different labs may use different quantities of plant materials, grind these differently, dissolve these in different solvents at varying concentrations, and store at different temperatures. This variability makes a huge difference in the analysis of the same cannabis samples. The presence of inexperienced people analyzing these cannabis samples can also contribute to the variability of the results. Thus, it is necessary to have at least one experienced analytical chemist in charge of the lab [87].
Cannabismay notonlybeanalyzedfor thepresenceof terpenesbut alsootherparametersincluding moisture content, microbial enumeration, pesticides, cannabinoids, and heavy metals among others. Sample preparation techniques for these methods differ widely. For example, for water/moisture content analysis, a hand grinder is used; for bacteria testing, the sample is put in media solution, then plate and incubate for 24-48 hours. Extraction must be taken but taken into consideration not to miss any analyte that maybe needed for other analysis. Because cannabis is such a complex matrix, extracting mycotoxins and mycotoxins maybe a challenge [87].
In general, the cannabis testing industry is poised for a breakthrough in the field of analytical science given the recent laws legalizing its medicinal use. Since laws vary from state to state, the list of analytes and methods to be used are also changing [90] However, in general, advances in research in cannabis continues to be not making great strides due to legal restrictions around the world including its uses and effects on humans [91] The resins of cannabis are known to contain
ISSN 2691-6495 (online) Vol. 1, January 2021 43
hundreds of different terpene and cannabinoid metabolites. Many of these metabolites remain largely unexplored. Rigorous studies are needed in order to ensure reproducibility of terpene profiles in cannabis. This can be done using diverse cannabis genotypes grown under controlled environmental conditions and then consequently analyze such terpene profiles quantitatively and qualitatively over the course of the plant growth and development [91].
5. Conclusion
Chromatographic analysis of terpenes from cannabis employs gas chromatography as the main technique choice of analysis. Variability in this technique comes from sample introduction, using HS, SPME or the more novel FET. All these can be coupled with various detectors and detection modes. These include but are not limited to FID, MS, or VUV. Although LC is not really a popular choice for the analysis of terpenes from cannabis, it is slowly gaining attention. The combination of LC with MS is currently the more attractive option, although complex matrices still pose a great challenge in this mode of analysis.
Despite being a multi-billion-dollar global industry, advances in scientific research still continues to be lagging behind due to its legal restrictions associated with its use and adverse effects on humans. Besides the use of infrared spectroscopy for terpene analysis in cannabis, the role of genomic, molecular and biomolecular properties that define terpenes will be anticipated to grow in large numbers as the landscape restrictions for cannabis ease around the world.
Chemometrics is quickly becoming an important counterpart in definitively and qualitatively analyzing a variety of different compounds and species of substances. This field has also made appearances in various topics branched from disciplines including analytical chemistry, biology, forensics, computer science, etc. The groups of interest in chemometrics, particularly PLS and PCR, are anticipated to become instrumental methods of analysis within a wide range of subjects.
List of abbreviations
CARS: Coherent anti-Stokes Raman scattering
CBC: cannabichromene
CB1: cannaboid receptor type 1
CB2: cannaboid receptor type 2
CBD: cannabidiol
CBDA: cannabidiolic acid
CBDV: cannabidivarin
CBG: Cannabigerol
CBN: cannabinol
FET: full evaporation technique
FID: flame ionization detector
FTIR: Fourier transform infrared spectroscopy
FTIR-ATR: fourier transform infrared spectroscopy with attenuated total reflectance
GC: gas chromatography
GC-FID: gas chromatography–flame ionization detection
GLP: good laboratory practices
ISSN 2691-6495 (online) Vol. 1, January 2021 44
HPLC: high performance liquid chromatography
HS: Headspace
HS-GC-FID: headspace gas chromatography–flame ionization detection
HS-SPME: Solid Phase Micro-extraction of Headspace
LC: liquid chromatography
LC-MS-MS: liquid mass tandem-mass spectrometry
LC-UV: liquid chromatography-ultraviolet
MS: mass spectrometry
MSD: mass selective detection
NIR: near infrared spectrometry
NMR: Nuclear Magnetic Resonance
PCR: Principal Component Regression
PLS: Partial least squares
SHS-GC-MS-MS: Static Headspace Gas Chromatography Mass Spectrometry
SPME: Solid phase microextraction
SSI: Split/Splitless Injection
THC: tetrahydrocannabidiol
THCA: Tetrahydrocannabinolic acid
THCV: tetrahydrocannabivarin
TLC: thin layer chromatography
TOF-MS: Time of Flight Mass Spectrometry
UV: ultraviolet
VUV: vacuum ultraviolet spectroscopy
Compliance with Ethical Standards
Conflict of Interest
The authors have no conflict of interest.
Human and Animal Rights and Informed Consent
This study does not involve any human or animal subjects.
References
[1] Grotenhermen F, Russo E. Cannabis and Cannabinoids: Pharmacology, Toxicology, and Therapeutic Potential. Psychology Press, 2002.
[2] Nuutinen T. Medicinal properties of terpenes found in Cannabis sativa and Humulus lupulus. European Journal of Medicinal Chemistry 2018; 157: 198–228.
[3] Identifying Terpenes in Cannabis | List of Cannabis Terpenes, https://www.encorelabs.com/terpene-identification (accessed 23 December 2020).
[4] Booth JK, Bohlmann J. Terpenes in Cannabis sativa – From plant genome to humans. Plant Science 2019; 284: 67–72.
ISSN 2691-6495 (online) Vol. 1, January 2021 45
[5] Baron EP. Medicinal Properties of Cannabinoids, Terpenes, and Flavonoids in Cannabis, and Benefits in Migraine, Headache, and Pain: An Update on Current Evidence and Cannabis Science. Headache: The Journal of Head and Face Pain 2018; 58: 1139–1186.
[6] What are cannabis flavonoids and what do they do? Leafly, https://www.leafly.com/news/cannabis-101/what-are-marijuana-flavonoids (2018, accessed 23 December 2020).
[7] Adams IB, Martin BR. Cannabis: pharmacology and toxicology in animals and humans. Addiction 1996; 91: 1585–1614.
[8] Lab Cannabis Testing is Steering the Future of the Industry. Digipath Inc. - When Science Matters, https://digipath.com/news/cannabis-testing-is-steering-the-future-of-the-industry/ (2019, accessed 23 December 2020).
[9] Classifying Cannabis Types By Terpenes Rather Than Cannabinoids. Digipath Labs, https://digipathlabs.com/news/classifying-cannabis-types-by-terpenes-rather-thancannabinoids/ (2019, accessed 23 December 2020).
[10] Page Robert L., Allen Larry A., Kloner Robert A., et al. Medical Marijuana, Recreational Cannabis, and Cardiovascular Health: A Scientific Statement From the American Heart Association. Circulation 2020; 142: e131–e152.
[11] Rahn EJ, Hohmann AG. Cannabinoids as pharmacotherapies for neuropathic pain: from the bench to the bedside. Neurotherapeutics 2009; 6: 713–737.
[12] Ren M, Tang Z, Wu X, et al. The origins of cannabis smoking: Chemical residue evidence from the first millennium BCE in the Pamirs. Science Advances 2019; 5: eaaw1391.
[13] Cannabinol CBN - A New Potential Therapeutic for Unmet Medical Needs. InMed Pharmaceuticals, https://www.inmedpharma.com/learn/what-is-cannabinol/ (accessed 24 December 2020).
[14] Torres-Moreno MC, Papaseit E, Torrens M, et al. Assessment of Efficacy and Tolerability of Medicinal Cannabinoids in Patients With Multiple Sclerosis: A Systematic Review and Meta-analysis. JAMA Netw Open 2018; 1: e183485.
[15] Lowe HIC, Toyang NJ, McLaughlin W. Potential of Cannabidiol for the Treatment of Viral Hepatitis. Pharmacognosy Res 2017; 9: 116–118.
[16] Maor Y, Yu J, Kuzontkoski PM, et al. Cannabidiol inhibits growth and induces programmed cell death in kaposi sarcoma-associated herpesvirus-infected endothelium. Genes Cancer 2012; 3: 512–520.
[17] Mecha M, Feliú A, Iñigo PM, et al. Cannabidiol provides long-lasting protection against the deleterious effects of inflammation in a viral model of multiple sclerosis: a role for A2A receptors. Neurobiol Dis 2013; 59: 141–150.
[18] Spindle TR, Bonn-Miller MO, Vandrey R. Changing landscape of cannabis: novel products, formulations, and methods of administration. Current Opinion in Psychology 2019; 30: 98–102.
[19] Atakan Z. Cannabis, a complex plant: different compounds and different effects on individuals. Ther Adv Psychopharmacol 2012; 2: 241–254.
[20] Notcutt WG. Clinical Use of Cannabinoids for Symptom Control in Multiple Sclerosis. Neurotherapeutics 2015; 12: 769–777.
[21] Queirolo R. The effects of recreational cannabis legalization might depend upon the policy model. World Psychiatry 2020; 19: 195–196
[22] Jiang Z, Kempinski C, Chappell J. Extraction and Analysis of Terpenes/Terpenoids. Curr Protoc Plant Biol 2016; 1: 345–358.
ISSN 2691-6495 (online) Vol. 1, January 2021 46
[23] Herring T. Instrumentation Used for Terpene Analysis. Cannabis Industry Journal, https://cannabisindustryjournal.com/column/instrumentation-used-for-terpene-analysis/ (2017, accessed 23 December 2020).
[24] Leghissa A, Hildenbrand ZL, Schug KA. A review of methods for the chemical characterization of cannabis natural products. J Sep Sci 2018; 41: 398–415.
[25] Trass M, Anderson T, Krepich S. Analysis of 33 Primary and Secondary Terpenes Found in Cannabis by GC-FID. 2.
[26] Misa A, Dhandapani R. Analysis of 20 Terpenes in Cannabis by GC-FID using ZebronTM ZB-624PLUSTM GC Column. 2.
[27] Cardenia V, Bakro F, Wielgusz K, et al. Development and Validation of a Fast GC/FID Method for the Simultaneous Determination of Terpenes and CBD in Hemp (Cannabis sativa L.). 1.
[28] Hildenbr DZ, Leghissa A, Schug DKA. The Other Side of Cannabis: Terpenes. Cannabis Industry Journal, https://cannabisindustryjournal.com/column/the-other-side-of-cannabisterpenes/ (2018, accessed 23 December 2020).
[29] Brault A, Agasse V, Cardinael P, et al. The full evaporation technique: a promising alternative for residual solvents analysis in solid samples. J Sep Sci 2005; 28: 380–386.
[30] restek. A Fast, Simple FET Headspace GC-FID Technique for Determining Residual Solvents in Cannabis Concentrates. Restek GmbH - Chromatografie Produkte, https://www.restekgmbh.de/aktuelles/fast-simple-fet-headspace-gc-fid-techniquedetermining-residual-solvents-cannabis (2014, accessed 23 December 2020).
[31] Rigdon A, Hilliard C, Cochran J. A Preliminary FET Headspace GC-FID Method for Comprehensive Terpene Profiling in Cannabis. 8.
[32] Stenerson KK, Halpenny MR. Analysis of terpenes in cannabis using headspace solid-phase microextraction and GC-MS. LCGC North Am 2017; 35: 28.
[33] Halpenny M, Stenerson KK. Quantitative Determination of Terpenes in Cannabis Using Headspace Solid Phase Microextraction and GC-MS. Gersten Application Note, 2017.
[34] Honnold R, Kubas R, Macherone A. Analysis of Terpenes in Cannabis Using the Agilent 7697A/7890B/5977B Headspace GC-MSD System: Faster Analysis Time = Greater Productivity. Agilent Application Notes; 10.
[35] Headspace SPME-GC/MS Analysis of Terpenes in Hops and Cannabis. Sigma-Aldrich, https://www.sigmaaldrich.com/technical-documents/articles/analytix-reporter/analysisterpenes-hops-cannabis.html (accessed 23 December 2020).
[36] Ibrahim E, Wang M, Radwan M, et al. Analysis of Terpenes in Cannabis sativa L. Using GC/MS: Method Development, Validation, and Application. Planta Medica 2019; 85: 431–438.
[37] Shapira A, Berman P, Futoran K, et al. Tandem mass spectrometric quantification of 93 terpenoids in Cannabis using static headspace injections. Analytical chemistry 2019; 91: 11425
11432.
[38] LECO Corporation, Saint Joseph, Michigan USA. Determining Terpene Profiles of Cannabis Strains Using GC and GCxGC with High Performance TOFMS, https://knowledge.leco.com/component/edocman/application-note-cannabis-terpeneprofiles-peg-bt-4d-558/viewdocument?Itemid=1749 (2019).
[39] Qiu C, Smuts J, Schug K. Analysis of Terpenes and Turpentines using Gas Chromatography with Vacuum Ultraviolet Detection. Journal of separation science; 40. Epub ahead of print 16 December 2016. DOI: 10.1002/jssc.201601019.
ISSN 2691-6495 (online) Vol. 1, January 2021 47
–
[40] Krill C, Rochfort S, Spangenberg G. A High-Throughput Method for the Comprehensive Analysis of Terpenes and Terpenoids in Medicinal Cannabis Biomass. Metabolites; 10. Epub ahead of print 6 July 2020. DOI: 10.3390/metabo10070276.
[41] Hyland KC, Borton C, Winkler P, et al. Quantitation of Terpenes in Cannabis Products Using APCI LC-MS/MS. Planta Medica 2016; 82: PA34.
[42] Shimadzu. Simplified Cannabis Terpene Profiling by GCMS, https://www.shimadzu.fr/sites/shimadzu.seg/files/gcms-1604-terpeneprofilingcannabis.pdf (2016).
[43] Stenerson K. Headspace SPME-GC/MS Analysis of Terpenes in Hops and Cannabis. Sigma-Aldrich, https://www.sigmaaldrich.com/technical-documents/articles/analytixreporter/analysis-terpenes-hops-cannabis.html (accessed 23 December 2020).
[44] Skoog DA, Crouch SR, Holler FJ. Principles of instrumental analysis. Belmont, CA: Thomson Brooks/Cole, 2007.
[45] Mariani Z, Strong K, Wolff M, et al. Infrared measurements in the Arctic using two Atmospheric Emitted Radiance Interferometers. Atmospheric Measurement Techniques 2012; 5: 329–344.
[46] Lang Q, Kwang Yak H, Wai CM. Selective dissolution and one step separation of terpene trilactones in ginkgo leaf extracts for GC-FID determination. Talanta 2001; 54: 673
[47] Garrett PE, Rodríguez TR, Varela AD, et al. Multiple Shape Coexistence in $^{110,112}\mathrm{Cd}$. Phys Rev Lett 2019; 123: 142502.
680.
[48] Hoult DI, Bhakar B. NMR signal reception: Virtual photons and coherent spontaneous emission. Concepts in Magnetic Resonance 1997; 9: 277
297.
[49] Rabi II, Zacharias JR, Millman S, et al. A New Method of Measuring Nuclear Magnetic Moment. Phys Rev 1938; 53: 318–318.
[50] Govindaraju V, Young K, Maudsley AA. Proton NMR chemical shifts and coupling constants for brain metabolites. NMR in Biomedicine 2000; 13: 129–153.
[51] Choi YH, Hazekamp A, Peltenburg‐Looman AMG, et al. NMR assignments of the major cannabinoids and cannabiflavonoids isolated from flowers of Cannabis sativa. Phytochemical Analysis 2004; 15: 345–354.
[52] Choi YH, Kim HK, Hazekamp A, et al. Metabolomic Differentiation of Cannabis s ativa Cultivars Using 1H NMR Spectroscopy and Principal Component Analysis. Journal of natural products 2004; 67: 953–957.
[53] Sanchez L, Baltensperger D, Kurouski D. Raman-Based Differentiation of Hemp, Cannabidiol-Rich Hemp, and Cannabis. Anal Chem 2020; 92: 7733–7737.
[54] Tu AT. Raman Spectroscopy in Biology: Principles and Applications. Wiley, 1982.
[55] Sánchez-Carnerero Callado C, Núñez-Sánchez N, Casano S, et al. The potential of near infrared spectroscopy to estimate the content of cannabinoids in Cannabis sativa L.: A comparative study. Talanta 2018; 190: 147–157.
[56] Starsinic M, Taylor RL, Walker PL, et al. FTIR studies of Saran chars. Carbon 1983; 21: 69–74.
[57] Smith BC. Fundamentals of Fourier Transform Infrared Spectroscopy. CRC Press, 2011.
[58] Kalasinsky VF, McDonald JT Jr. GC/FTIR Spectra of Terpenes*. Journal of Chromatographic Science 1983; 21: 193–200.
[59] Kalasinsky VF, Pechsiri S, Kalasinsky KS. Analysis of Terpenes by Capillary Gas Chromatography/Fourier Transform Infrared Spectroscopy (GC/FTIR). Journal of Chromatographic Science 1986; 24: 543–548.
ISSN 2691-6495 (online) Vol. 1, January 2021 48
–
–
[60] Ebersbach P, Stehle F, Kayser O, et al. Chemical fingerprinting of single glandular trichomes of Cannabis sativa by Coherent anti-Stokes Raman scattering (CARS) microscopy. BMC Plant Biology 2018; 18: 275.
[61] Hanif MA, Nawaz H, Naz S, et al. Raman spectroscopy for the characterization of different fractions of hemp essential oil extracted at 130°C using steam distillation method. Spectrochimica Acta Part A: Molecular and Biomolecular Spectroscopy 2017; 182: 168
174.
[62] Mainali D, Clara S. Quick and Real-Time Potency Determination of Cannabinoids Using FTIR Spectroscopy. Agilent Application Notes; 4.
[63] Smith BC, Lewis MA, Mendez J. Optimization of cannabis grows using Fourier transform mid-infrared spectroscopy. Application Note, Perkin Elmer Inc, San Jose/CA
[64] Keles HO, Radoman M, Pachas GN, et al. Using Functional Near-Infrared Spectroscopy to Measure Effects of Delta 9-Tetrahydrocannabinol on Prefrontal Activity and Working Memory in Cannabis Users. Front Hum Neurosci; 11. Epub ahead of print 2017. DOI: 10.3389/fnhum.2017.00488.
[65] Siciliano C, Bartella L, Mazzotti F, et al. 1H NMR quantification of cannabidiol (CBD) in industrial products derived from Cannabis sativa L.(hemp) seeds. In: IOP Conference Series: Materials Science and Engineering. IOP Publishing, 2019, p. 012010.
[66] Kumar R, Sharma V. Chemometrics in forensic science. TrAC Trends in Analytical Chemistry 2018; 105: 191–201.
[67] Frank lldiko E, Friedman JH. A Statistical View of Some Chemometrics Regression Tools. Technometrics 1993; 35: 109–135.
[68] Rathore AS, Bhushan N, Hadpe S. Chemometrics applications in biotech processes: A review. Biotechnology Progress 2011; 27: 307–315.
[69] Haenlein M, Kaplan AM. A Beginner’s Guide to Partial Least Squares Analysis. Understanding Statistics 2004; 3: 283–297.
[70] Principal Components Regression. In: NCSS Statistical Software.
[71] Wentzell PD, Vega Montoto L. Comparison of principal components regression and partial least squares regression through generic simulations of complex mixtures. Chemometrics and Intelligent Laboratory Systems 2003; 65: 257–279.
[72] Brown SD, Blank TB, Sum ST, et al. Chemometrics. Anal Chem 1994; 66: 315–359.
[73] Wold S, Sjöström M. Chemometrics, present and future success. Chemometrics and Intelligent Laboratory Systems 1998; 44: 3–14.
[74] Szymańska E, Gerretzen J, Engel J, et al. Chemometrics and qualitative analysis have a vibrant relationship. TrAC Trends in Analytical Chemistry 2015; 69: 34–51.
[75] Frank IE, Kowalski BR. Chemometrics. Anal Chem 1982; 54: 232
243.
[76] Cannabis Testing for Potency and Terpenes, https://www.cannabistech.com/articles/gasliquid-chromotography-ftir-spectroscopy-testing-terpenes/ (accessed 23 December 2020).
[77] On-Site Analysis of Cannabis Strength Using FT-IR Spectrosocopy. AZoM.com, https://www.azom.com/article.aspx?ArticleID=13308 (2016, accessed 23 December 2020).
[78] Smith BC. Determination of Cannabinoid and Terpene Profiles in Cannabis Oils by MidInfrared Spectroscopy: 1. Cannabinoids. 6.
[79] DigiPath-Investor-Presentation-11.3.pdf, https://digipath.com/wpcontent/uploads/2016/11/DigiPath-Investor-Presentation-11.3.pdf (accessed 23 December 2020).
ISSN 2691-6495 (online) Vol. 1, January 2021 49
–
–
[80] Signal Bay Makes Strategic Acquisition in the $850M Cannabis Testing Market. CannabisFN, https://www.cannabisfn.com/signal-bay-makes-strategic-acquisition-in-the850m-cannabis-testing-market/ (2015, accessed 23 December 2020).
[81] Why Are Cannabis Labs Important and What Makes Them a Great Investment?,
http://finance.yahoo.com/news/why-cannabis-labs-important-makes-133100676.html (accessed 23 December 2020).
[82] Markets R and. Cannabis Testing Market to Reach $1.4 Billion by 2021 - Driven by Growing Number of Cannabis Testing Laboratories - Research and Markets,
https://www.prnewswire.com/news-releases/cannabis-testing-market-to-reach-14-billionby-2021 driven-by-growing-number-of-cannabis-testing-laboratories research-andmarkets-300432416.html (accessed 23 December 2020).
[83] https://www.coherentmarketinsights.com CMI. Cannabis Testing Market Estimated to be Worth US$ 1.5 Billion by 2026, https://www.coherentmarketinsights.com/pressrelease/cannabis-testing-market-estimated-to-be-worth-us-15-billion-by-2026-64 (accessed 23 December 2020).
[84] Kuzdzal S, Clifford R, Winkler P, et al. Cannabis testing. Cannabis: A Clinician’s Guide 2018; 133.
[85] Shimadzu_Whitepaper_Emerging_Cannabis_Industry.pdf,
https://www.ssi.shimadzu.com/sites/ssi.shimadzu.com/files/Industry/Literature/Shimadzu_ Whitepaper_Emerging_Cannabis_Industry.pdf (accessed 23 December 2020).
[86] admin. Agricor Laboratories Advanced Terpene Analysis for Cannabis Products. Agricor Laboratories, https://agricorlabs.com/terpene-analysis/ (accessed 23 December 2020).
[87] Overcoming Challenges of Cannabis Sample Prep. Lab Manager, https://www.labmanager.com/product-focus/overcoming-challenges-of-cannabis-sampleprep-1127 (accessed 23 December 2020).
[88] Nie B, Henion J, Ryona I. The Role of Mass Spectrometry in the Cannabis Industry. J Am Soc Mass Spectrom 2019; 30: 719–730.
[89] Hazekamp A, Choi Y, Verpoorte R. Quantitative Analysis of Cannabinoids from Cannabis sativa Using 1H-NMR. Chemical & pharmaceutical bulletin 2004; 52: 718–21.
[90] Cannabis Testing Opens Up a Whole New Market - ProQuest, https://search.proquest.com/openview/00c2ecbf0b692a0d8d55754409a406f7/1?pqorigsite=gscholar&cbl=2032040 (accessed 23 December 2020).
[91] Booth JK, Bohlmann J. Terpenes in Cannabis sativa – From plant genome to humans. Plant Science 2019; 284: 67–72.
ISSN 2691-6495 (online) Vol. 1, January 2021 50
Comparative Study of the Extraction Methods for the Instrumental Analysis of Bee Propolis
Lyric O. Wyan1 , Jozlyn M. Charland1 and Elmer-Rico E. Mojica1*
1Department of Chemistry and Physical Sciences, Pace University, New York, NY 10038
*Corresponding author: 1 Department of Chemistry and Physical Sciences, Pace University, New York, NY 10038, Telephone: 2123461344, Email: emojica@pace.edu
Abstract
As a natural resinous substance collected by honeybees from buds and exudates of trees, propolis is used by bees as a glue, general-purpose sealer, and draught extruder for beehives. In this paper, different extraction methods were employed to compare their efficiency in the extraction of bee propolis samples. The methods employed using ethanol as a solvent were the following:soaking method, ultrasonicationmethod,andmicrowave method. Gas chromatographymassspectrometry(GC-MS)andspectroscopic methodssuchasabsorbanceandfluorescence were utilized to determine the amount of phenolic compounds extracted and compare each extraction's efficiencymethod.Resultsshowedsamplesobtained fromultrasonicationand microwavemethods gave the highest yields. Both methods can be performed within a short time in comparison to the soaking method.
Keywords: propolis, extraction, ultrasonication, microwave
ISSN 2691-6495 (online) Vol. 1, January 2021 51
Introduction
Propolis is a product of the beehive along with honey, pollen, and wax. It is a natural and resinous substance collected by bees from exudates of buds, leaves, branches, and barks of trees. It has also been known as bee glues since propolis is used by the honey bees to seal cracks and block holes in the hive. It has been used since ancient times and recently gained popularity in health foods and cosmetic products because of its well-known biological activities. Several studies have reported its antioxidant, antifungal, anti-inflammatory, and antibacterial activities (Camuri, Costa, Siuiti Ito, & Moreira Pazin, 2018). Although its natural properties are due to the phenolics and flavonoids, the main composition of propolis are the following: balsamic substances (50%), waxes (30%), essential and aromatic oils (10%), pollen (5%), and others (5%). Its chemical composition is also dependent on some factors such as bee species, geographical locations, and time of collection (Silici & Kutluca, 2005).
Since raw propolis cannot be used as crude material, it must be purified by solvent extraction. The main purpose of solvent extraction is to recover materials that possess the biological activities mentioned above. There are different solvent extraction methods used to remove the active components in propolis. Among these are traditional methods such as maceration and Soxhlet extractions. Maceration is the traditional soaking method where a suitable solvent is used to dissolve the propolis component without producing heat, thereby making this suitable for heat-stable substances (Khacha-ananda, Tragoolpua, Chantawannakul, & Tragoolpua, 2013).However,thismethodistime-consuming,requiring1to 10days.Ontheotherhand,Soxhlet extraction made use of specialized glassware and involved heating to evaporate the solvent to extract the sample and then collect the condensed extract. It made use of the solvent reflux and siphon principle. Although it is efficient in solvent use and extraction, it is not useful for temperature-sensitive chemicals.
Recently, modern extraction methods, such as ultrasonic extraction (sonication), microwave-assisted extraction, and supercritical fluid extraction, have been used.Sonication made use of sound energy to break the cell membranes, disrupt the cell wall structure, and accelerate the diffusionof asolvent throughmembranes.Microwave-assistedextraction,on theotherhand,made use of microwaves that can easily penetrate the sample pores, causing the solvent trapped in the pores to heat evenly and rapidly. Supercritical extraction employs CO2 at its supercritical condition (Idrusetal., 2018).Thesenewermethodshavehigher extractionyieldsand shorterextraction times in comparison to the traditional method. In the case of microwave-assisted extraction and supercritical fluid, less solvent is utilized (Trusheva, Trunkova, & Bankova, 2007).
In this study, phenolic compounds were extracted from propolis sample utilizing different extraction methods reported in the literature. The main objective of this study is to compare different extraction methods such as ultrasonication and microwave-assisted extraction with the traditional soaking (maceration) method. The effectiveness of each extraction was made by analyzing the extracts using GC-MS and absorbance and fluorescence spectroscopy.
ISSN 2691-6495 (online) Vol. 1, January 2021 52
Materials and Methods
Propolis sample was obtained from a bee farm in Sorsogon, Philippines. This was transported to the United States and then frozen until analysis. The propolis sample was then pulverized using mortar and pestle, and 1.0 g of sample was mixed with 10.0 mL ethanol and extracted using different methods such as soaking, ultrasonication, and use of microwave (Figure 1) Each extraction method was done three times.
Extraction Using Different Methods
For the soaking method, the propolis sample was soaked in ethanol in a 20 mL vial at room temperature (25 C). Two different extraction times were used: 24 h and 48 h, and the mixtures were stored in the dark For the ultrasonication method, the propolis samples in a 20 mL vial were extracted using an 80 W ultrasonic bath (Fisher Scientific FS20H) Two different extraction times were also used: 30 min and 60 min. For the microwave-assisted extraction (MAE) protocol, the propolis-solvent mixture was placed in a 50 mL beaker and microwaved for a total of 10 s (2 x 5 s power on and 10 s off in between) using a standard 700W household microwave (Samsung). The resulting mixtures from the different extraction methods were then filtered using Whatman UNIFLO syringe filter with 0.45 m pore size. The collected extracts placed in a 4 mL dram vial and stored below 0C in the dark were analyzed using gas chromatography-mass spectrometry and spectroscopic methods: absorbance and fluorescence.
Furthermore, 1.0 mL of extract from each extraction method was used to determine the percentage of materials extracted. These were evaporated to dryness at room temperature until a constant weight was recorded. The percentage of the dry extracts was determined from the means of three replicates.
Absorbance-Fluorescence Spectroscopy
The propolis sample was first removed from frozen storage and allow to reach room temperature before analysis. For the spectroscopic methods, the collected and filtered extract (5.0 L) was diluted with ethanol in a 5-mL volumetric flask, and the resulting mixture was analyzed for absorbance and fluorescence.
Each extract was placed in a quartz cuvette (3 mL) and was used for all spectroscopic analysis. A JASCO v-570 spectrophotometer (Easton, MD) was used to obtain the absorbance of the different extracts. For the emission measurements, a FluoroMax-4 Spectrofluorometer (Horiba Jobin Yvon, Edison, NJ) using 1 nm slits was used. The emission intensity was obtained at two different excitation wavelengths for each sample: 290 nm and 330 nm. Pure ethanol was used as a blank, and its absorbance and emission spectra were also obtained All spectroscopic measurements were performed in triplicate, and all readings from each extraction method were averaged for comparison purposes.
Gas Chromatography-Mass Spectrometry (GC-MS)
A 5 µL pure extract was used in each scan. A Hewlett-Packard gas chromatograph 6890 series linked to a Hewlett-Packard 5973 mass selective detector with 30 µm x 250 µm x 0.28 µm HP5-MS column was used for GC-MS analysis. The total analysis run is 36 minutes long. With
ISSN 2691-6495 (online) Vol. 1, January 2021 53
an injector temperature of 110 °C, a temperature program of 110 °C held for two min and then ramped to 280 °C at a rate of 10 °C/min, and a 15-min hold at 280 °C was applied. With helium as the carrier gas, a flow rate of 1.5 mL/min was used. Upon completion, peaks were identified through their MS spectra using the database of the system (NIST Mass Spectral Library).
Statistical Analysis
Experimental data (absorbance and emission signals in certain wavelengths and percent yield) were evaluated using student’s t-test (p < 0.05) to compare the difference between spectra
Results and Discussion
The extraction of materials, especially bioactive compounds from propolis, is the first step in its use in the nutraceutical industry. In this process, the solvent plays a very important role. For this study, pure ethanol was utilized as solvent since it is non-toxic and has the advantage of being a highly efficient solvent of polyphenols from propolis. This solvent is usually used at a varying concentration to extract propolis. However, since one of the instruments used is GC-MS, pure ethanol was used as a solvent. Also, a 1:10 (mass: volume) ratio of sample to solvent was used in

ISSN 2691-6495 (online) Vol. 1, January 2021 54
B
A
Figure 1. Bee propolis at different stages of sample preparation. A) raw sample B) ground sample and extracts obtained using different methods.
all extraction methods. Thiswastheoptimum amountreported inone study (Trushevaet al., 2007), where ratios larger than were necessarily leading only to solvent and energy losses.
The efficiency of different methods (soaking, ultrasonication, and microwave) to extract materials from propolis was compared in this study. This was done by analyzing the extracts using instrumental methods. Among these are electronic absorbance and emission-steady state fluorescence. Both techniques are useful for quantitative purposes. Absorption spectroscopy is based on the absorption of energy by molecules at a specific wavelength. This technique can be utilized to characterize the absorption and transmission of materials in propolis samples This has also been used for bee products like propolis because of its non-destructive nature (Maldonado et al., 2020)
Figure 2 shows the absorbance spectra of extracts obtained from different methods. It is not surprising that all extracts have the same profile as they all came from the same batch of samples. This also suggests that all extracts have a homogenous chemical composition. At least fourmajor peaks(at220, 230,295, and330nm)and aminorpeak at380 nmregionswere observed in all samples. Phenolic compounds such as flavonoids can be found from 290-400 nm regions, and based on the absorbance, the extracting solvent used was able to recover these phenolic compounds (Tomazzoli et al., 2015). It has also been reported that the visible spectra of the propolis can be related to typical polyphenol spectra that have a broad band centered between 280330 nm (Catalin Mot et al , 2011) that is similar to the obtained absorbance profile
Extract from the microwave method has the highest absorbance based on the peak at 290 nm, and at 330 nm region followed both by sonication for 60 min and soaking for two days. Soaking propolis samples for one day has the lowest absorbance at the two peak regions, followed by sonication for 30 min. Statistical analysis showed that the absorbance obtained from the microwave extract is significantly different from the other extracts. It was also determined that there are no significant differences in absorbance for extracts from both sonication and soaking. Absorbance results confirmed that the longer the extraction time, the more materials that can be extracted. Both soaking and sonication yield higher absorbance at a longer period, significantly different from those obtained at a shorter period.
On the other hand, fluorescence spectroscopy is used for fluorescent materials. Although some phenolic compounds fluoresce, this technique is seldom used in propolis samples. It is used to analyze the Brazilian green propolis containing Artepillin C, a cinnamic acid derivative that presents two prenylated groups (Barbosa da Silva Cunha et al., 2006; Camuri et al., 2018). This method was also used as a detection method in HPLC to analyze coumarin derivatives in propolis (Hrobonova, Lehotay, Cizmarik, & Sadecka, 2013). Lately, fluorescence microscopy was used to characterize propolis from Brunei (Abdullah et al., 2019).
The results from absorbance, however, did not translate to the same trend in fluorescence. Using an excitation wavelength of 290 nm (Figure 3), the extract from the microwave showed the lowest emission intensity. Soaking for two days exhibited the highest intensity, followed by sonication for60 min.Statisticalanalysisshoweda significantdifferenceamongall extractsexcept for the ones obtained from sonication and soaking at a shorter period. On the other hand, for excitation at 330 nm, the microwave extraction yield extracts with the highest intensity followed
ISSN 2691-6495 (online) Vol. 1, January 2021 55
bysoakingandsonicationboth ofshorter times.Allspectra fromdifferentextractsaresignificantly different from one another.
Results acquired using GC-MS showed total ion chromatograms (Figure 4) of the same profile for all extracts obtained using different extraction methods, with the highest peak observed around 25.19 min. The microwave extraction method exhibited the highest relative abundance, with the chromatograms showing a relative abundance of approximately 5.2 x 10⁶. Ultrasonic extraction showed the highest peak with a relative abundance of 4.9 x 10⁶ for 60 minutes and 4.0 x 10⁶ at 30 minutes. The soaking method exhibited a relative abundance of around 4.7 x 10⁶ for two days and 4.5 x 10⁶ for one day. Analyzing the propolis component, the highest peak was found to be amyrin, a pentacyclic triterpene commonly found in propolis (Yam-Puc et al., 2019). Unfortunately, the other peaks present were not identified as MS spectra analysis showed match resultslower than 50percent. This can only mean thatthepresentlibraryinstalledin theinstrument does not have the chemicals commonly present in propolis samples.
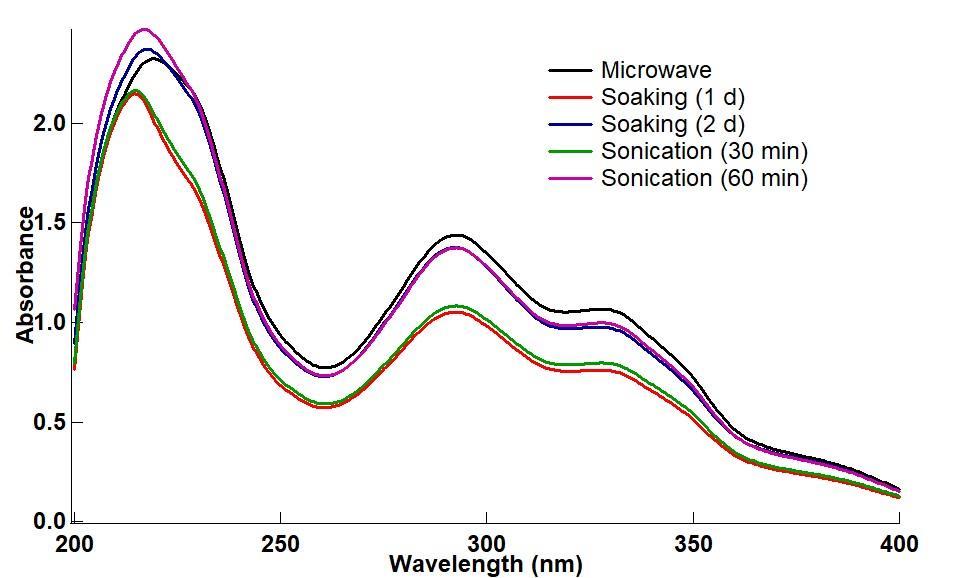
Lastly, in terms of extract yield, microwave extraction gives around 15.5 + 0.5% yield, which is significantly higher than that obtained using ultrasonication (8.5 + 0.9%) and soaking (7.7 + 0.4 %) at a longer period, which is not significantly different. Also, there is no significant difference in terms of exposure time as ultrasonication has 7.9 + 0.5% yield while soaking has 7.3 + 0.5%. This yield is consistent with the trends observed in a study by Trusheva et al. (2007) in terms of the extraction methods. However, the percent yield obtained is lower than earlier studies (Trusheva et al. 2007, Khacha-ananda et al., 2013) that utilized the same extraction methods.
ISSN 2691-6495 (online) Vol. 1, January 2021 56
Figure 2. Absorbance of extracts obtained using different methods.
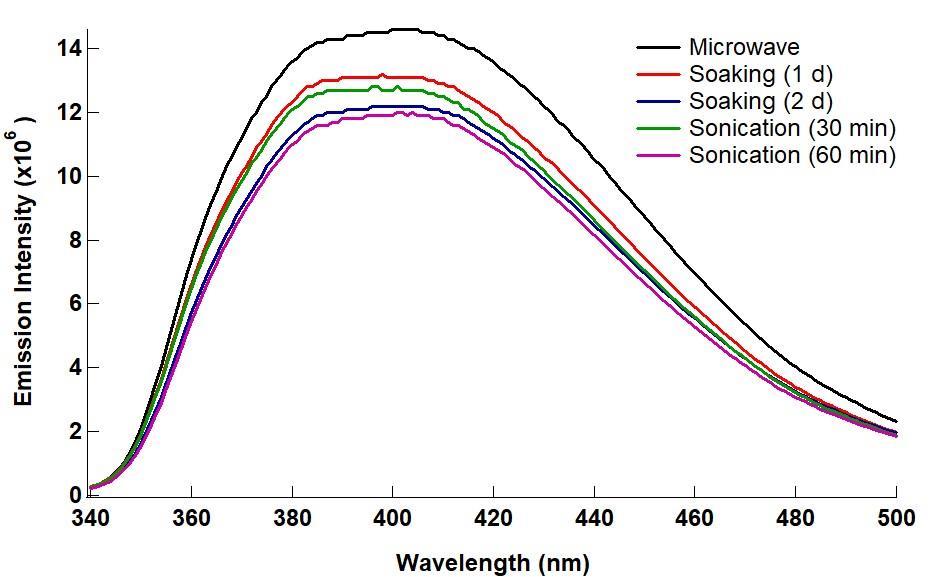

ISSN 2691-6495 (online) Vol. 1, January 2021 57
Figure 3. Emission spectra excited at 290 nm (top) and at 330 nm (below) of extracts obtained using different methods.
Results from the instrumental methods used to analyze extracts showed that microwave extraction has the highest signal, except for the emission spectra excited at 290 nm. This was followed by ultrasonication and, lastly, soaking. It is also shown that the longer the time for sonication and soaking, the more materials that can be extracted. This study is very similar to the one conducted by Trusheva et al. (2007) where different extraction methods (maceration, ultrasonication, and microwave) and 70% ethanol as a solvent were used. However, the efficiency of extraction was based on biological compounds in terms of the amount of extract, total flavone and flavonol, amount of flavanones and dihydroxyflavonols, and total phenolics content. Another study (Oroian, Dranca, & Ursachi, 2020), which used these three extracting methods, was also reported and performed the same analysis reported by Trusheva et al. (2007). Both studies reported that ultrasonication is better than microwave extraction and maceration in terms of higher extraction yield and selectivity (Oroian et al., 2020; Trusheva et al., 2007).
Since the extracts were not assayed, similar to those reported in the literature, the GC-MS is the only one that can be used to look for any differences among the extracts. Although major peaks can be found in all extracts (Figure 4), it can be noticed that peaks coming out before 24.00 mins are not as pronounced as that observed in ultrasonication and soaking methods. The peaks are also different in terms of peak height ratio among the three extraction methods. It has also been reported that microwave extraction results in the extraction of a large amount of unwanted waxes hence lower selectivity in terms of extracting bioactive compounds (Trusheva et al., 2007). The extract obtained from microwave extraction that showed the lowest emission signal excited at 290 nm might be due to a smaller amount of fluorescent compounds than the other extracts. It is also possible that the high temperature associated with the high power applied in microwave extraction leads to thermal degradation of fluorescent materials (Hamzah & Leo, 2015) that can be excited at 290 nm
Therehavebeennumerousstudieson theadvantages ofoneextraction methodoveranother extraction method. Microwave-assisted extraction set at 106C, with 80% ethanol as a solvent and an extraction time of 15 min was found to be better than other techniques, such as maceration, heat reflux extraction (HRE), and ultrasound-assisted extraction in terms of shorter extraction time and lower volume of solvent needed (Pellati, Prencipe, Bertelli, & Benvenuti, 2013). Another study showed a higher percentage yield after extraction using maceration (18.1%) compared to sonication (15.7%); however, significantly greater antioxidant activity and flavonoid compounds were found for extract obtained by ultrasonication than those obtained by maceration (Khachaananda et al., 2013). Lastly, a combination of extraction methods results in better performance of the propolis extract. Antimicrobial activity against selected bacterial and fungal species showed propolis extract obtained after 1-day and 7-day shaking extraction followed by 20 min of ultrasonication are better than those obtained by just shaking extraction or ultrasonication alone (Pobiega, Krasniewska, Derewiaka, & Gniewosz, 2019)
ISSN 2691-6495 (online) Vol. 1, January 2021 58
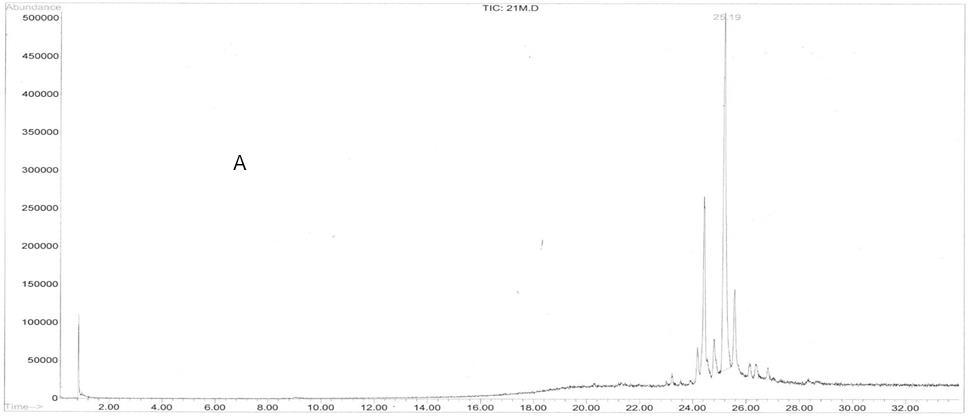
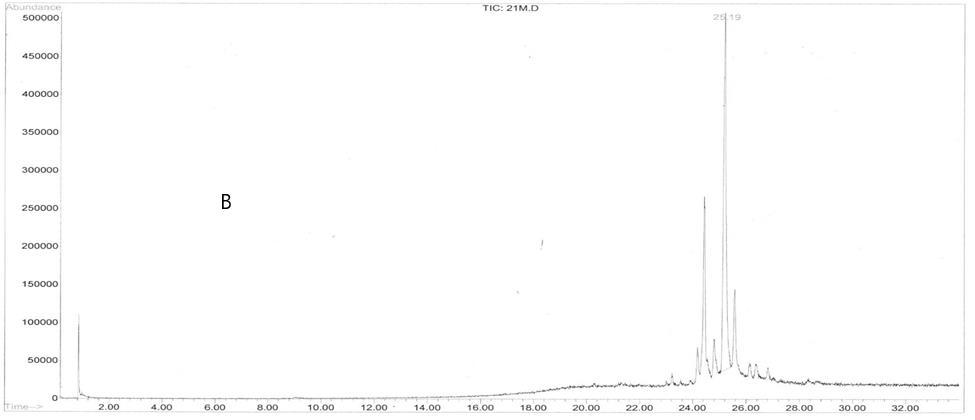
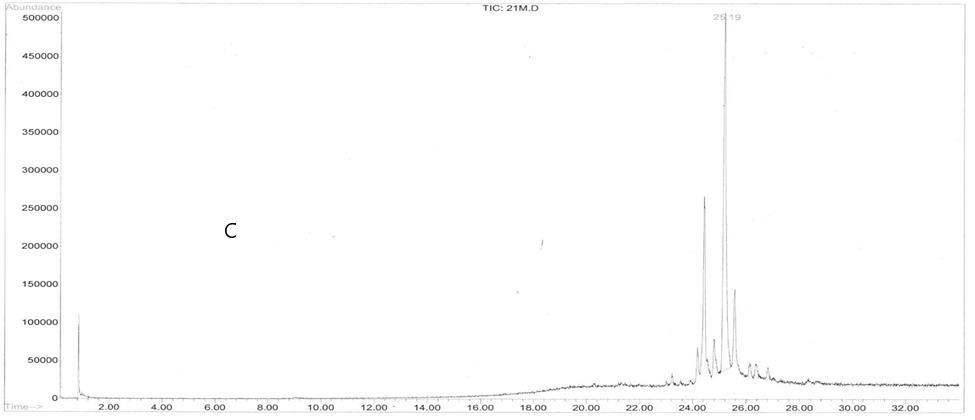
ISSN 2691-6495 (online) Vol. 1, January 2021 59
Figure 4. Total ion chromatogram of propolis extracts obtained using A) microwave extraction, B) ultrasonication at 60 mins, and C) soaking for two days.
Although both microwave and ultrasonication may pose potential degradation of materials, both methods showed rapid and better extraction over maceration. Microwave can be a good extraction method as long as the temperature was below 125C, has a shorter time (15 min), and less solvent (sample to solvent ratio of 1:5 (w/v)) (Hamzah & Leo, 2015) Ultrasonication, on the other hand, has been hailed as the best alternative method to the traditional maceration and soaking method because it has a higher recovery yield, good selectivity of the target compound, less time consuming, and energy-saving method. It can also consider a green process.
Although both microwave and ultrasonication may pose potential degradation of materials, both methods showed rapid and better extraction over maceration. Microwave can be a good extraction method as long as the temperature was below 125C, has a shorter time (15 min), and less solvent (sample to solvent ratio of 1:5 (w/v)) (Hamzah & Leo, 2015). Ultrasonication, on the other hand, has been hailed as the best alternative method to the traditional maceration and soaking method because it has a higher recovery yield, good selectivity of the target compound, less time consuming, and energy-saving method. It is also considered a green process.
Conclusions
Different extraction methods were used in the sample preparation of bee propolis. The collected extracts were analyzed using different instrumental methods (GC-MS, absorbance, and fluorescence) to determine the performance of each extraction method. Extracts from microwave and ultrasonication methods were found to have higher signals than those obtained from the soaking method. This further confirmed the applicability of two methods as a rapid and improved extraction method over the traditional and time-consuming soaking method.
Acknowledgments
This material is based upon work supported by the National Science Foundation under grant no. 1828320. Lyric O. Wyan would like to thank the Pforzheimer Honors College for the grant used in this study. We also like to thank Remil Aguda for providing us with the propolis samples and Prof. Ruel Desamero of CUNY York College for the use of spectroscopic instruments.
List of abbreviations
GC-MS: gas chromatography-mass spectrometry
Compliance with Ethical Standards
Conflict of Interest
The authors have no conflict of interest.
ISSN 2691-6495 (online) Vol. 1, January 2021 60
Human and Animal Rights and Informed Consent
This study does not involve any human or animal subjects.
References
Abdullah, N. A., Ja'afar, F., Yasin, H. M., Taha, H., Petalcorin, M. I. R., Mamit, M. H., . . . Usman, A. (2019). Physicochemical analyses, antioxidant, antibacterial, and toxicity of propolis particles produced by stingless bee Heterotrigona itama found in Brunei Darussalam. Heliyon, 5, e02476.
Barbosa da Silva Cunha, I., Lucia Tiveron Rodrigues, M., Cesar Meurer, E., Bankova, V. S., Cristina Marcucci, M., Nogueira Eberlin, M., & Helena Frankland Sawaya, A. C. (2006). Effect of the maceration time on chemical composition of extracts of Brazilian propolis. Journal of Apicultural Research, 45(3), 137-144.
Camuri, I. J., Costa, A. B., Siuiti Ito, A., & Moreira Pazin, W. (2018). Optical absorption and fluorescence spectroscopy studies of Artepillin C, the major component of green propolis. Spectrochimica Acta Part A: Molecular and Biomolecular Spectroscopy, 198, 71-77.
Hamzah, N., & Leo, C. P. (2015). Microwave-assisted extraction of Trigona propolis: The effects of processing parameters. International Journal of Food Engineering, 11(6), 861870. doi:10.1515/ijfe-2015-0106
Hrobonova, K., Lehotay, J., Cizmarik, J., & Sadecka, J. (2013). Comparison HPLC and fluorescence spectrometry methods for determination of coumarin derivatives in propolis. Journal of Liquid Chromatography & Related Technologies, 36, 486-503.
Idrus, N. F. M., Yian, L. N., Idham, Z., Aris, N. A., Putra, N. R., Aziz, A. H. A., & Yunus, M. A. C. (2018). Mini review: Application of supercritical carbon dioxide in extraction of propolis extract. Malaysian Journal of Fundamental and Applied Sciences, 14(4), 387396.
Khacha-ananda, S., Tragoolpua, K., Chantawannakul, P., & Tragoolpua, Y. (2013). Antioxidant and anti-cancer cell proliferation activity of propolis extracts from two extraction methods. Asian Pacific Journal of Cancer Prevention, 14(11), 6991-6995. doi:10.7314/apjcp.2013.14.11.6991
Maldonado, L., Marcinkevicius, K., Borelli, R., Gennari, G., Salomon, V., Isla, M. I., Vera, N. & Borelli, V. (2020). Differentiation of Argentine propolis from different species of bees and geographical origins by UV spectroscopy and chemometric analysis. Journal of the Saudi Society of Agricultural Sciences, 19(2), 185-191
Oroian, M., Dranca, F., & Ursachi, F. (2020). Comparative evaluation of maceration, microwave and ultrasonic-assisted extraction of phenolic compounds from propolis. Journal of Food Science and Technology, 57(1), 70-78. doi:10.1007/s13197-019-04031-x
Pellati, F., Prencipe, F. P., Bertelli, D., & Benvenuti, S. (2013). An efficient chemical analysis of phenolic acids and flavonoids in raw propolis by microwave-assisted extraction combined with high-performance liquid chromatography using the fused-core technology. Journal of Pharmaceutical and Biomedical Analysis, 81-82, 126-132. doi:10.1016/j.jpba.2013.04.003
ISSN 2691-6495 (online) Vol. 1, January 2021 61
Pobiega, K., Krasniewska, K., Derewiaka, D., & Gniewosz, M. (2019). Comparison of the antimicrobbial activity of propolis extracts obtained by means of various extraction methods. Journal of Food Science and Technology, 56(12).
Silici, S., & Kutluca, S. (2005). Chemical composition and antibacterial activity of propolis collected by three different races of honeybees in the same region. Journal of Ethnopharmacology, 99, 69-73.
Tomazzoli, M. M., Pai Neto, R. D., Moresco, R., Westphal, L., Zeggio, A. R. S., Specht, L., Costa, C., Rocha, M. & Maraschin, M. (2015). Discrimination of Brazilian propolis according to the seasoning using chemometrics and machine learning based on UV-Vis scanning data. Journal of Integrative Bioinformatics, 12(4), 279.
Trusheva, B., Trunkova, D., & Bankova, V. (2007). Different extraction methods of biologically active components from propolis: a preliminary study. Chemistry Central Journal, 1. doi:10.1186/1752-153x-1-13
Yam-Puc, A., Santana-Hernandez, A.A., Yah-Nahuat, P. N., Ramon-Sierra, J. M., CaceresFarfan, M. R., Borges-Argaez, R. L., & Ortiz-Vazquez, E. (2019). Pentacyclic triterpenes and other constituents in propolis extractfrom Melipona beecheii collected in Yucatan, México. Revista Brasileira de Farmacognosia 29 (2019) 358
363, 29, 358-363.
ISSN 2691-6495 (online) Vol. 1, January 2021 62
–