CENLA ECONOMIC DASHBOARD
January 13, 2021.
Dr.RandallDupont Dean,CollegeofBusinessLouisianaStateUniversityofAlexandria
rdupont@lsua.edu


January 13, 2021.
Dr.RandallDupont Dean,CollegeofBusinessLouisianaStateUniversityofAlexandria
rdupont@lsua.edu
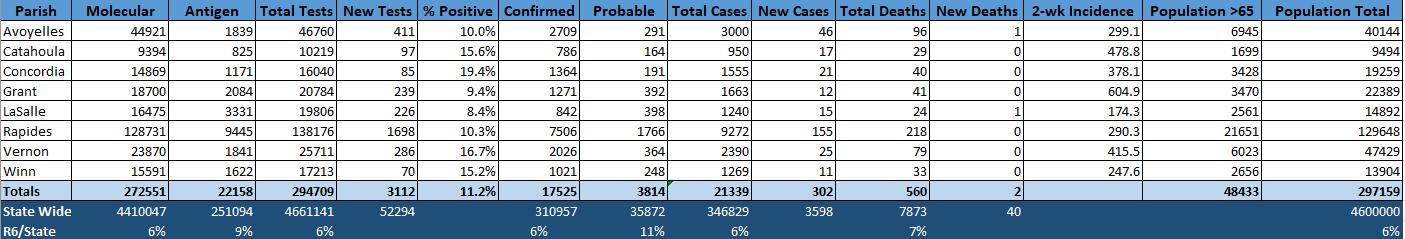
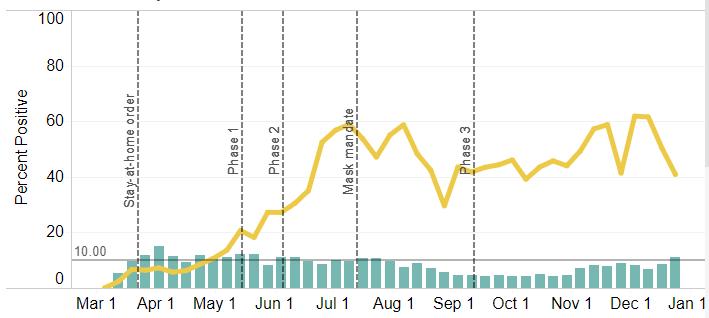
• The positivity rate for COVID-19 in Region 6 (Cenla) stood at 11.2% in January compared to 8% in December.
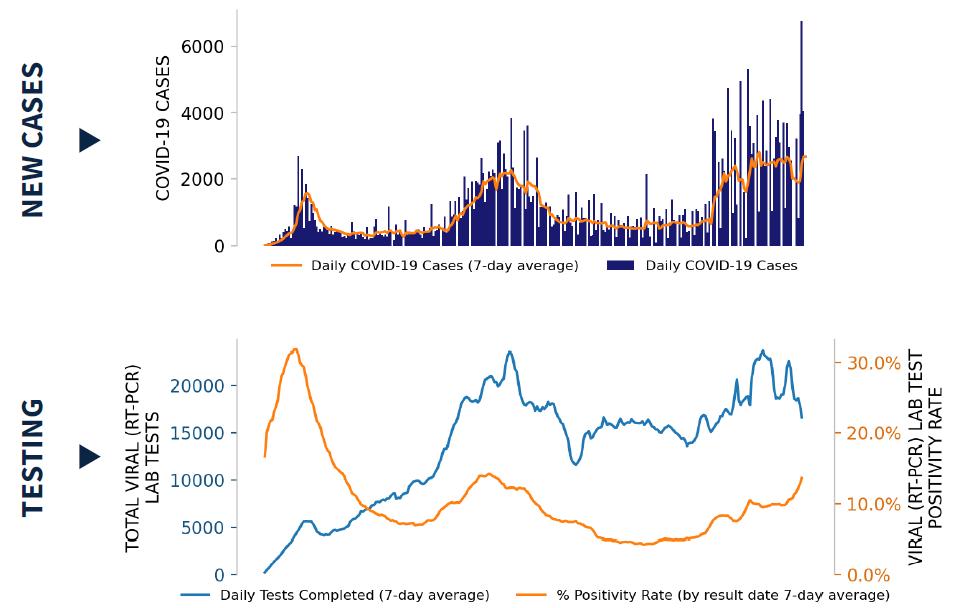
• Covid-19 cases, hospitalizations, and patients on ventilators reach an all-time daily high in early January. Cases have been increasing in in all age groups since early September.
• Contact tracing in Region 6 reached 60% individuals testing positive for COVID. 53% denied having any close contact in the two weeks prior to their positive results, down from 61% in December.
• Statewide, average weekly initial unemployment claims filed in December fell to 8,671 from 10,500 in November, a 17% decrease. Average weekly continued unemployment claims in December fell to 66,909 from 87,209 in November, a 23% decrease.
• In CENLA, the average weekly initial unemployment claims in central Louisiana fell to 486 from 588 in November, a 17% decline. Average weekly continued unemployment claims in central Louisiana fell to 4,773 from 6,031 in December, a 21% decline.
• The nine-parish Cenla region had an unemployment rate of 6.9% in November compared to 8.1% statewide.
• At 5.9%, the Alexandria MSA had the lowest unemployment rate among the state’s major metro areas in November for the seventh straight month, well below the state’s 8.1% rate.
• Louisiana’s unemployment rate fell 1.2% in November to 8.1% from 9.3% in October.
• Alexandria metro area continued to have the tightest labor market in the state in November with only 0.82 unemployed person per job opening compared to 2.11 statewide.

• Sales taxes revenue for Ball, Boyce, Cheneyville, Glenmore, Lecompte, and Woodworth increased by double-digits in December, which reflects increased sales activity in November. All towns reported a year-to-date increase except Cheneyville.
• Six of the nine jurisdictions in central Louisiana reported higher tax revenues in December, reflecting increased consumer spending in November. Avoyelles, Evangeline, and St. Landry reported decreases of 10-14%.
• All reporting jurisdictions have increased tax revenues yearto-date except Concordia and LaSalle. Pineville and St. Landry have the largest percentage YTD increase.
• November vehicle sales activity was negative, while year-todate sales were positive with Rapides posting the largest gain to date.
• Rapides Parish permit valuations year-to-date in December were $81 million, up 13% over 2019 which totaled $72 million.
• Residential construction permits in CENLAin December were up 11% over the same month a year ago.
• InAlexandria, commercial permit valuations were down 40% year-to-date in December while residential permits were down 41%.
• Indicators point to a seasonal slowing but still strong housing market in theAlexandria metro area. Compared to December of last year, active listings are down 48%, pending listings down 10%, and median days on the market are down 9%.
• The median listing price is up 20% over the past year, while the average price is up 21%.
• Louisiana’s non-current mortgage delinquency rate dropped 1.1% from its pandemic high of 11.8% in May. Mortgage delinquencies nationwide improved for the sixth consecutive month in November 2020, falling to 6.33% from 6.44% in October.
• Hotel occupancy in Rapides decreased 40% in November compared to a month earlier while Avoyelles had a 55% decrease. Year-to-date Rapides andAvoyelles hotel occupancy as measured by hotel tax revenue remained 5% and 9% below last year’s level.
• Total passenger traffic at Alexandria International airport (AEX) averaged 68% of last December’s level compared to only 38% nationwide. AEX had the highest percentage passenger throughput rate in the state when compared with 2019 traffic, nearly doubling the throughput rate of New Orleans.
• Nationwide air passenger traffic in December was 38% of last year’s level, compared to 37% in November.
• Passenger traffic hit a new pandemic high at 61% of 2019 levels on Dec. 23rd, before falling to 24% on Christmas day.
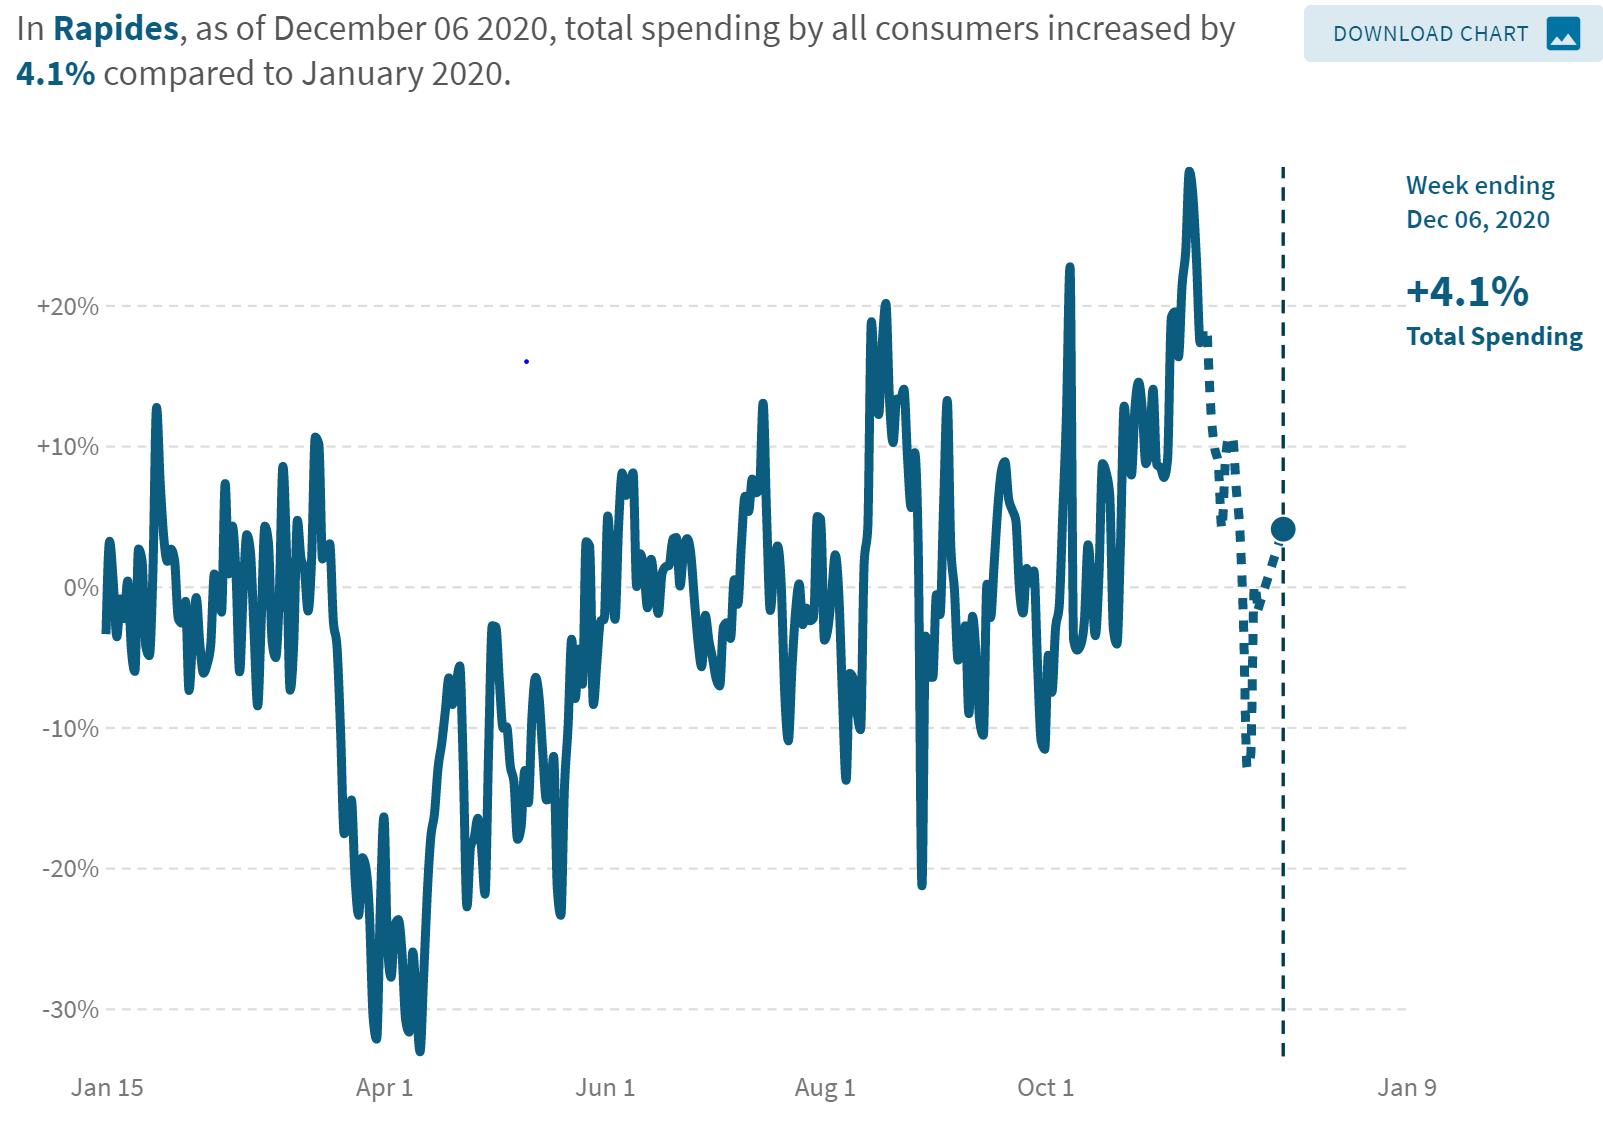
• Using data from financial transactions, Opportunity Insights reports consumer spending in Rapides the first week of December was up 4.1% compared to January 2020 while statewide spending was up 11%.
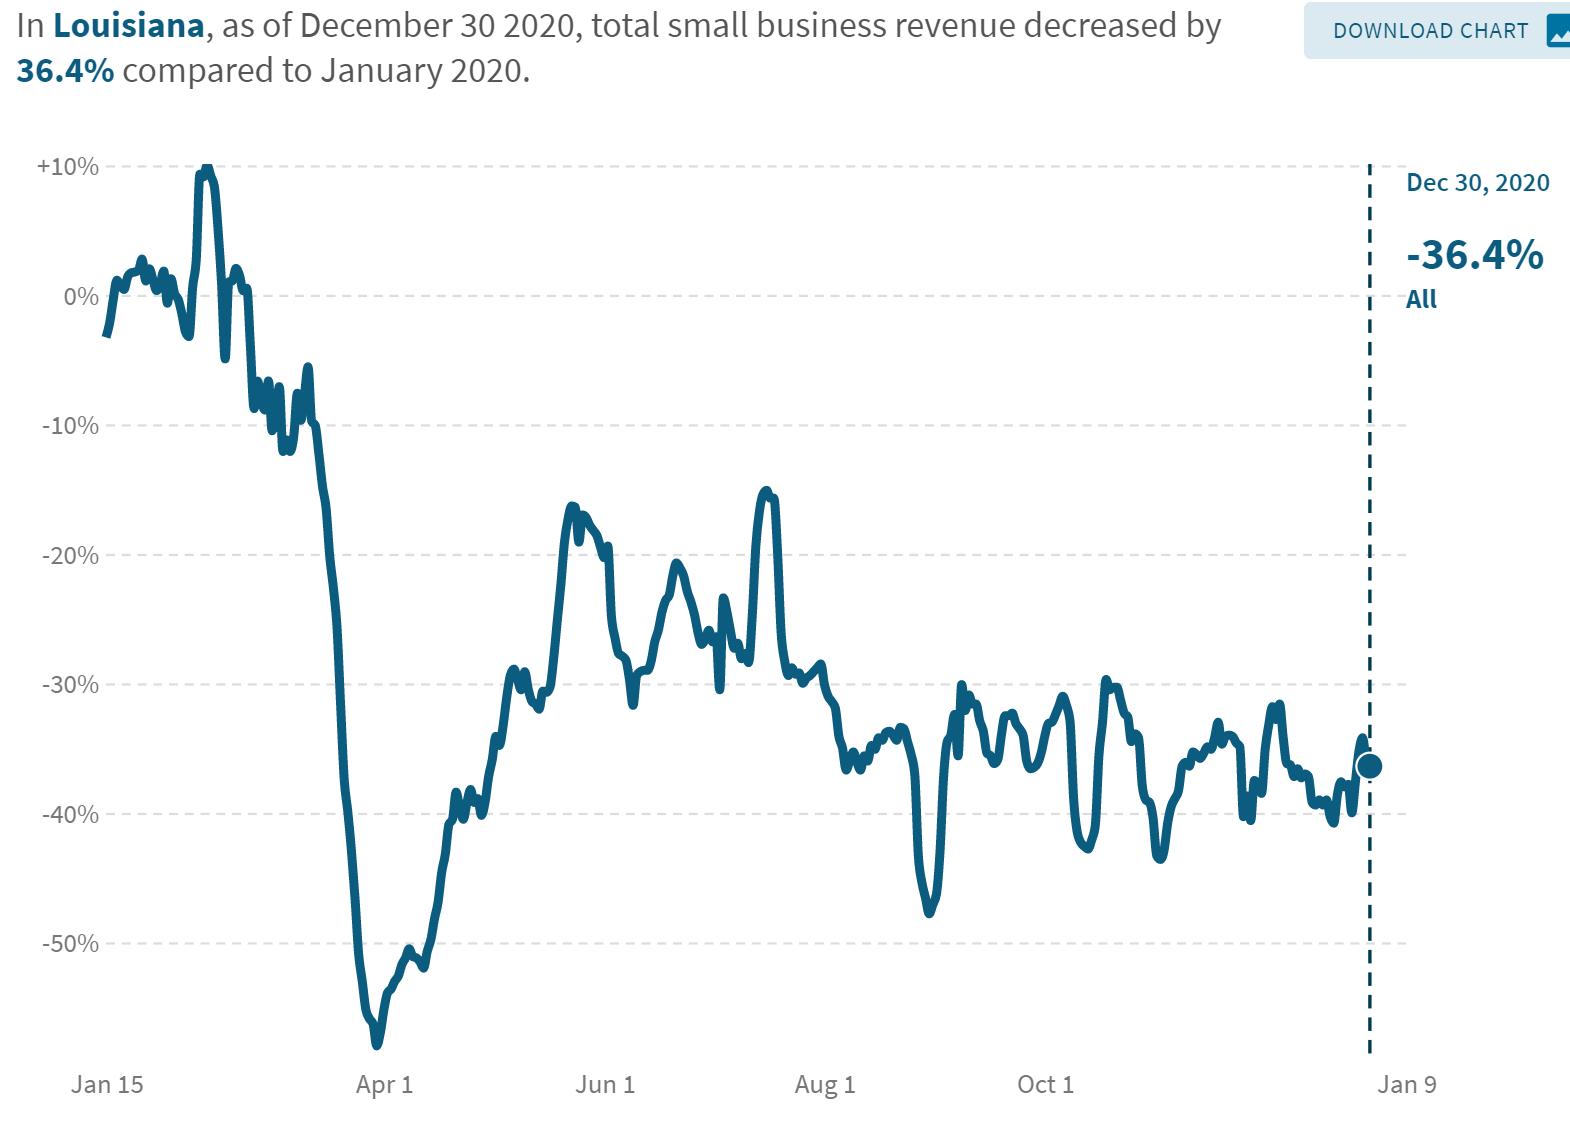
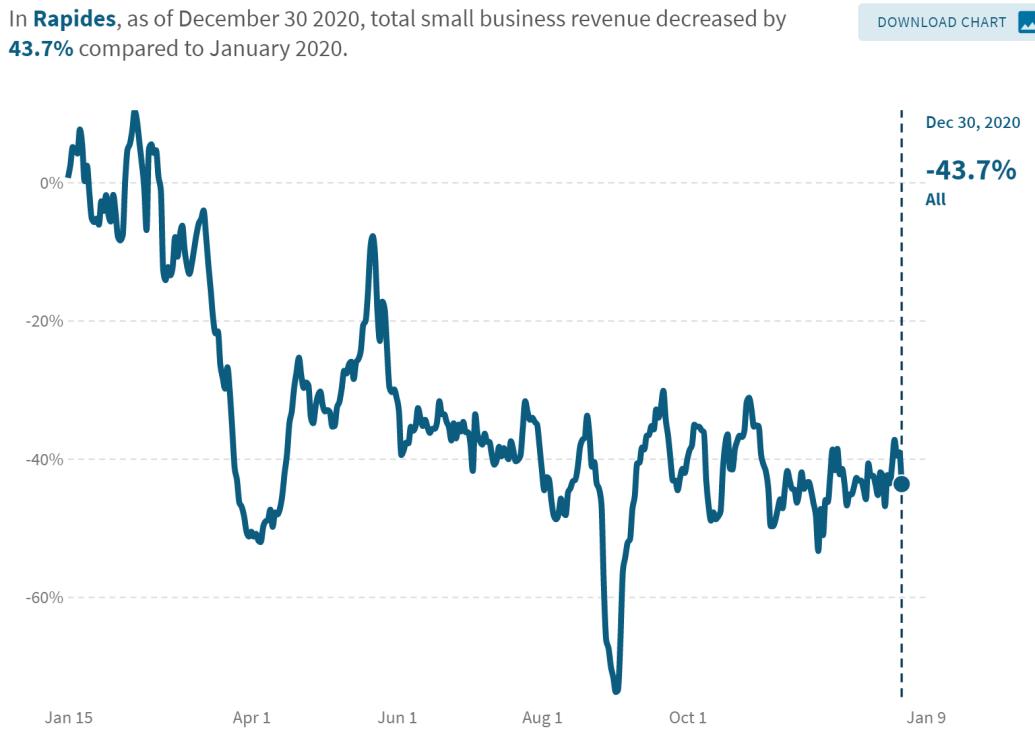
• Small business revenue in Louisiana was down 36% in late December compared to January 2020 with leisure and hospitality small business revenue down 68%.
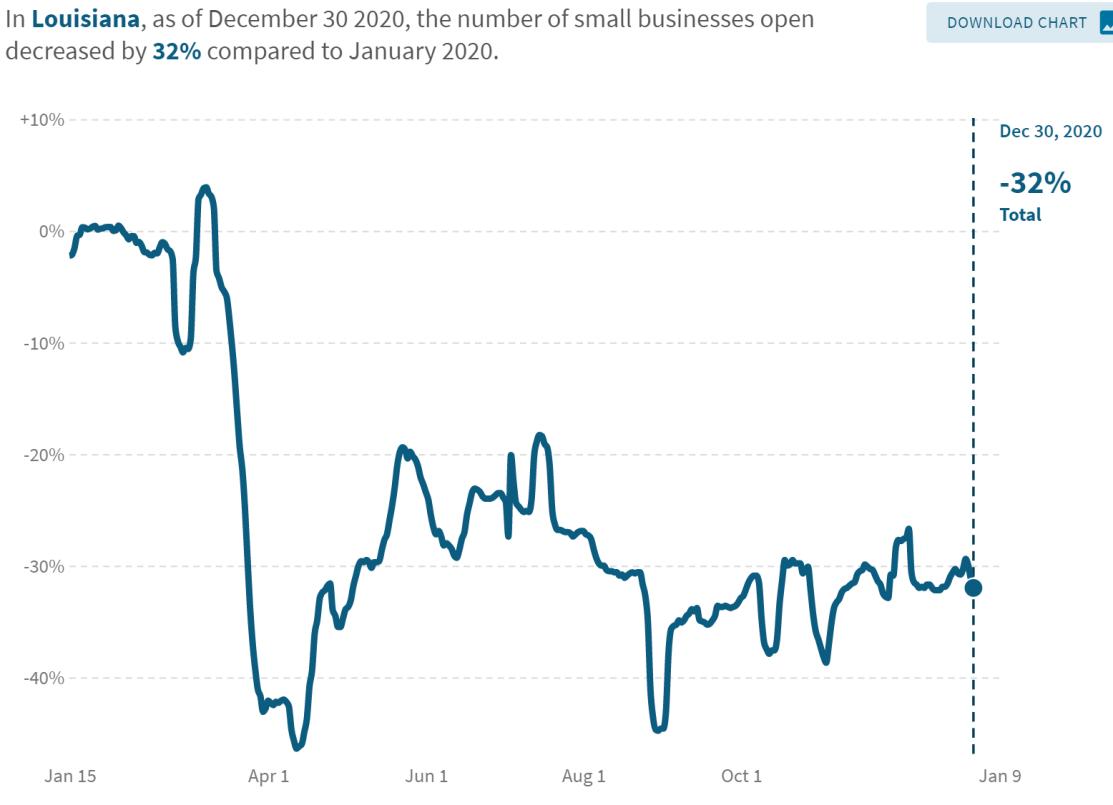
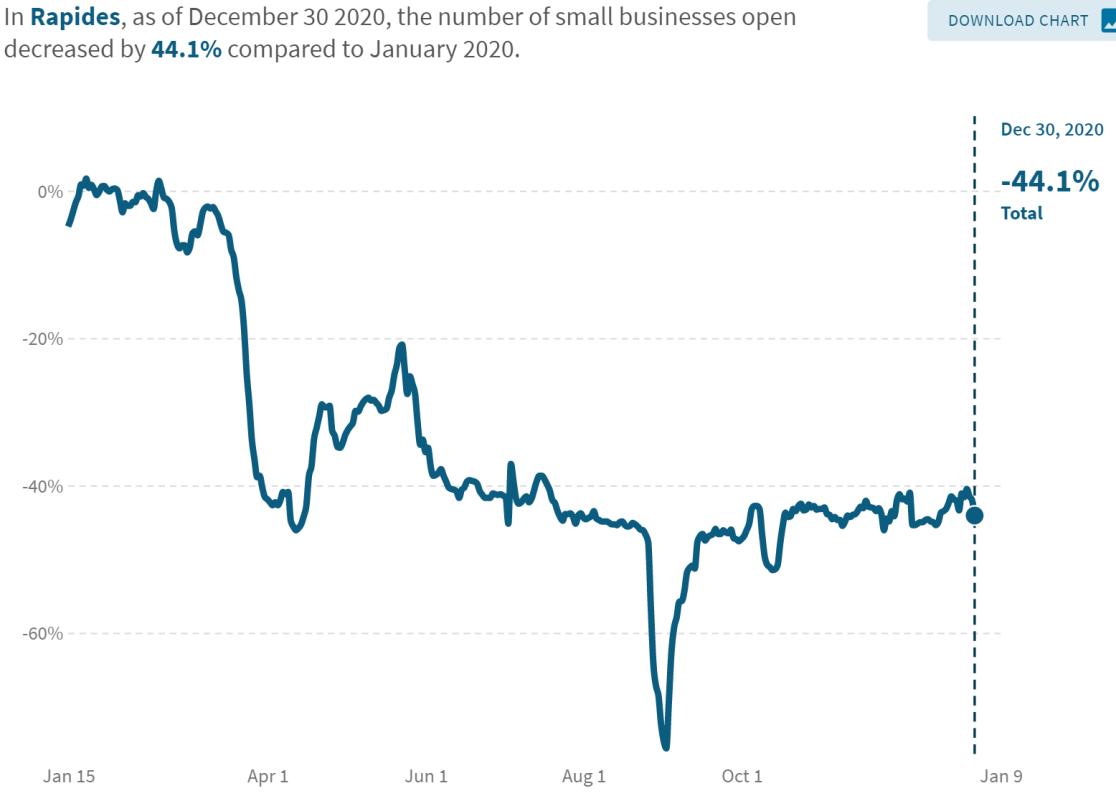
• 32% of small businesses in Louisiana closed in 2020, compared to 44% in Rapides.
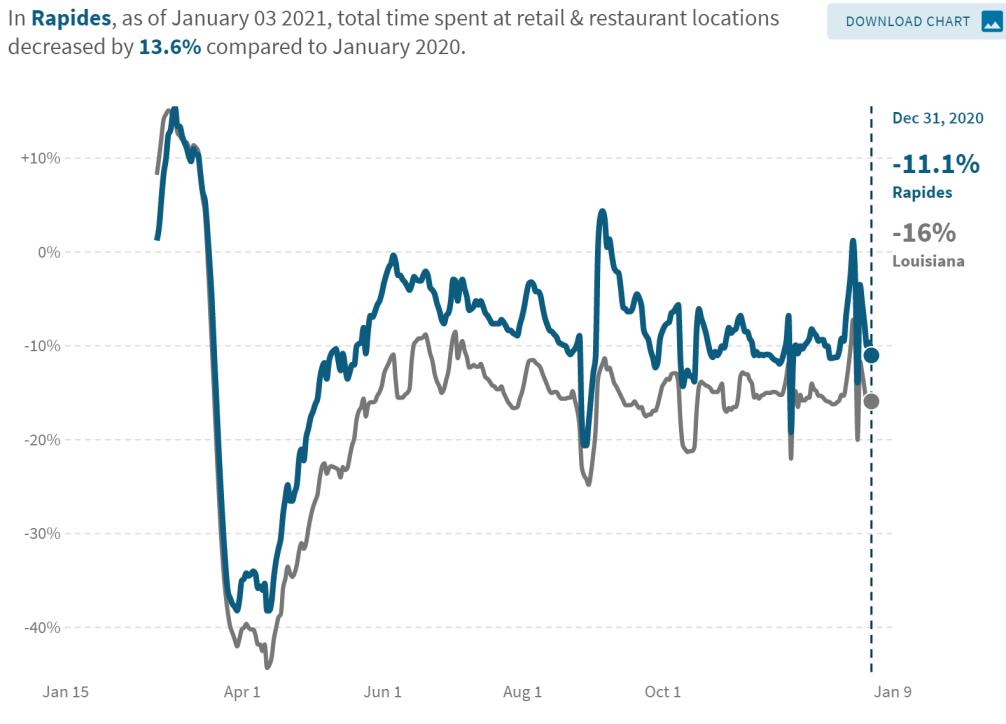
• Consumers in Rapides are spending more time shopping and dining out than the state average.
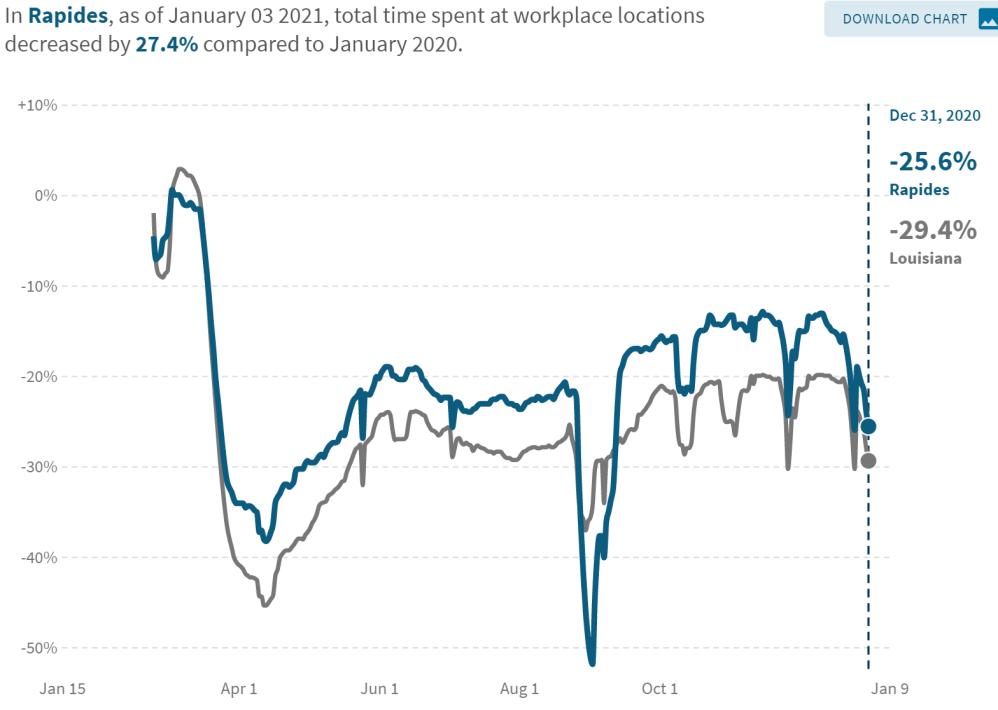
• Employees in Rapides spent slightly more time at work than the state average.
• Year-to-date through December 26, 2020, 82,800 business applications have been filed in Louisiana, compared to 53,940 for the same period in 2019, representing a 54% increase.
• The Coincident Economic Activity Index which tracks gross state product edge up 1.2% in November indicating continued growth in the Louisiana economy.
• The Baker Hughes exploration rig count in Louisiana increased 8% in December. Likewise, the rig count nationwide increased 9% from a year ago.
• Gaming revenue in Louisiana decreased 1% in November and was down 20% compared to last year.
• Sales of new residential homes fell 11% for the month of November, while new residential construction was up 1.2%.
Vaccines the week of January 11th are available for individuals in the following categories.
• Persons ages 70 years or older
• Outpatient clinic providers and clinic staff
• Urgent care clinic providers and staff
• Community care clinic providers and staff
• Behavioral health clinic providers and staff
• Dialysis providers, staff and clients
• Home health service providers, direct support workers and recipients
• Dental providers and staff
• Students, residents, faculty and staff of allied health schools
209 vaccine providers in all 64 parishes will receive COVID vaccine this week compared to 102 providers, 13 parishes last week
• The vaccine providers this week across the state will receive very limited doses of COVID vaccine.
• These 209 providers – include 87 chain pharmacies, 93 independent pharmacies, 20 federally qualified health centers (FQHCs), and an additional 9 healthcare sites.
• All nine public health regions and 64 parishes of the state have a vaccine provider.
Source: Louisiana Office of Public Health, Region 6 (Central Louisiana), Regional Administrator/Medical Director, David J. Holcombe, MD, MSA, Jan. 11, 2021
COVID-19 statewide testing statistics as of January 3, 2021.
Source: Louisiana Office of Public Health, Region 6 (Central Louisiana), Regional Administrator/Medical Director, David J. Holcombe, MD, MSA, Jan 10, 2021.
COVID-19 parish testing statistics for Region 6 as of January 10, 2021. Source: Louisiana Office of Public Health, Region 6 (Central Louisiana), Regional Administrator/Medical Director, David J. Holcombe, MD, MSA, January 10, 2021.
Covid-19 contact tracing effectiveness as of January 4, 2021.
60.2% of attempted contacts were reached.
53.4% denied any close contact in the two weeks prior to their positive results.
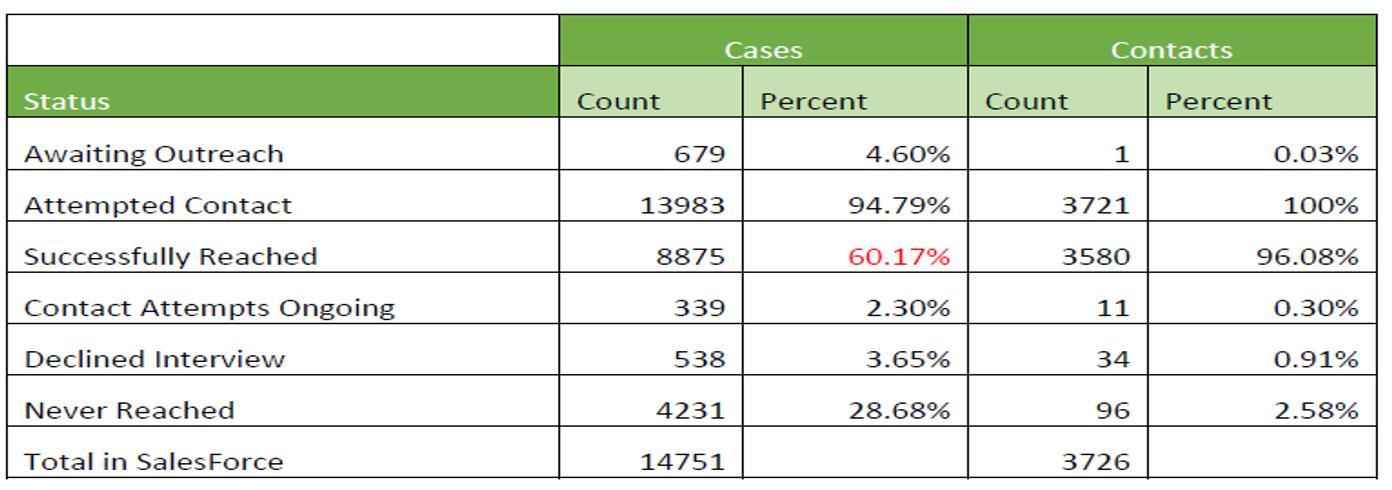
Source: Louisiana Office of Public Health, Region 6 (Central Louisiana), Regional Administrator/Medical Director, David J. Holcombe, MD, MSA, Jan. 4, 2021.
Covid-19 cases reported by K-12 schools in Region 6 as of January 3, 2021.
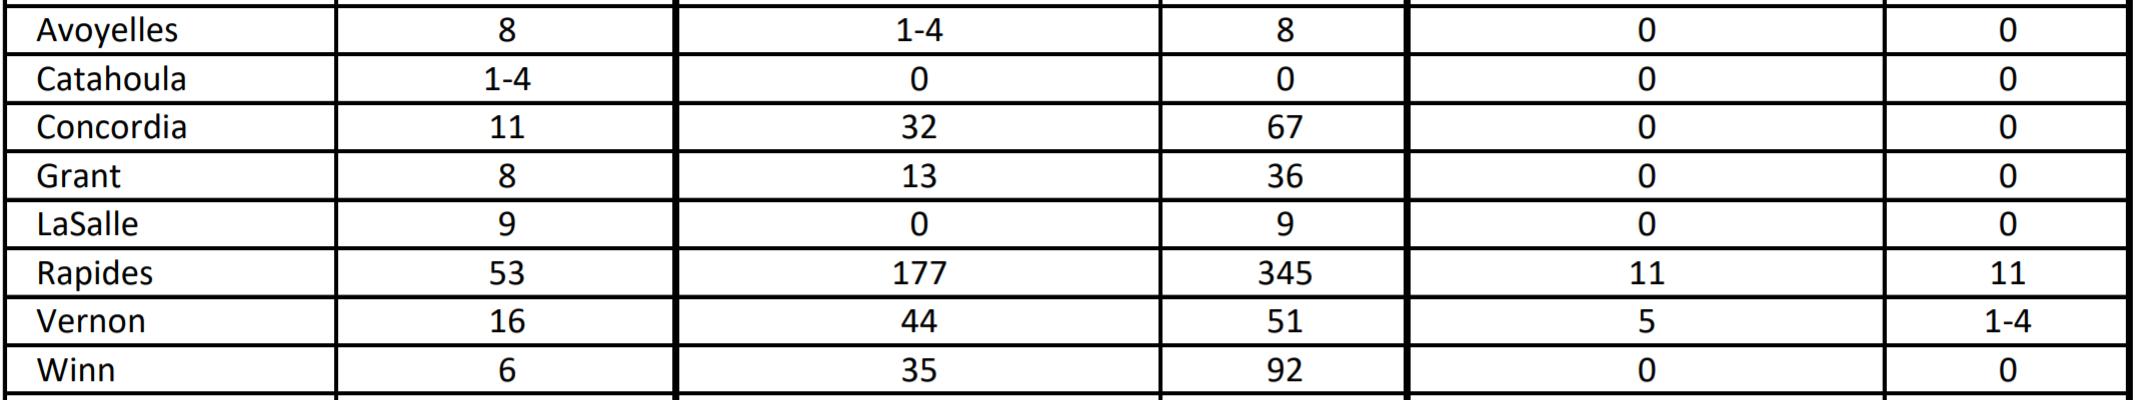
Source: Louisiana Office of Public Health, Region 6 (Central Louisiana), Regional Administrator/Medical Director, David J. Holcombe, MD, MSA, January 3, 2021.
COVID-19 cases by collection date as of January 7, 2021 in Region 6 with a 7day moving average.
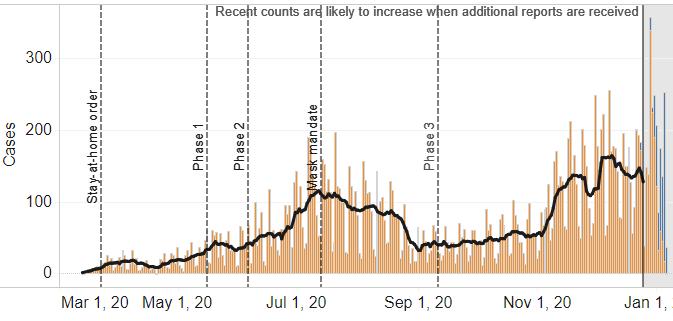
Source: Louisiana Office of Public Health, Region 6 (Central Louisiana), Regional Administrator/Medical Director, David J. Holcombe, MD, MSA, January 7, 2021.
Cases over time by age group in Region 6 through January 7, 2021.
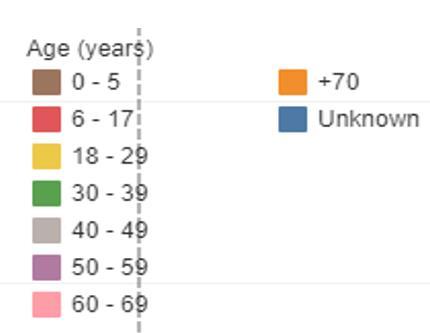
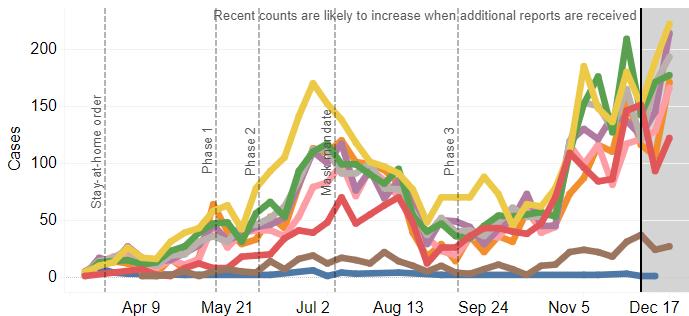
Source: Louisiana Office of Public Health, Region 6 (Central Louisiana), Regional Administrator/Medical Director, David J. Holcombe, MD, MSA, January 7, 2021.
COVID-19 percent positive and test volume in Region 6 as of January 7, 2021.
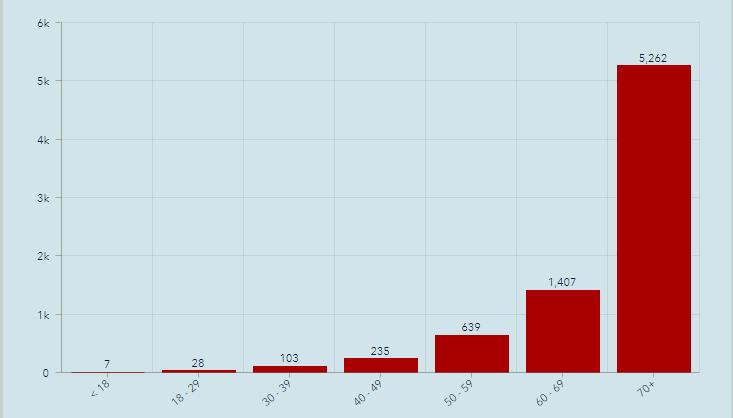
COVID-19 cases statewide by age group as of January 7, 2021.
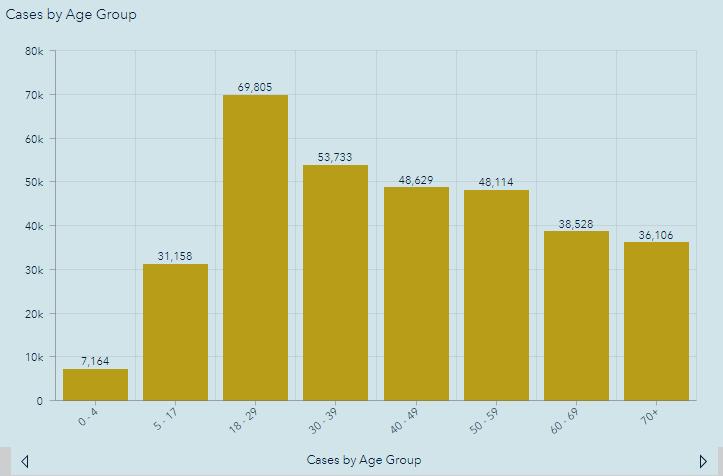
Source: Louisiana Office of Public Health, Region 6 (Central Louisiana), Regional Administrator/Medical Director, David J. Holcombe, MD, MSA, January 7, 2021.
Number of cases hospitalized (green line) and ventilated (yellow line) in Region 6 as of January 7, 2021.
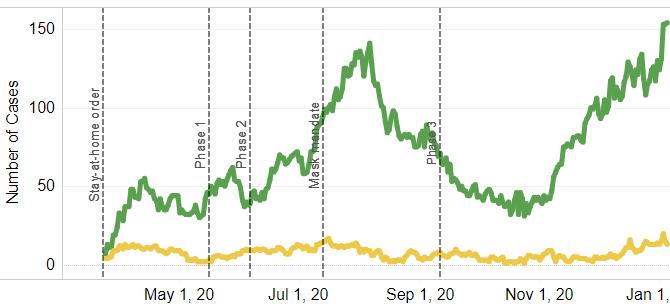
Source: Louisiana Office of Public Health, Region 6 (Central Louisiana), Regional Administrator/Medical Director, David J. Holcombe, MD, MSA, January 7, 2021.

COVID-19 deaths by date of death statewide as of January 7, 2021.
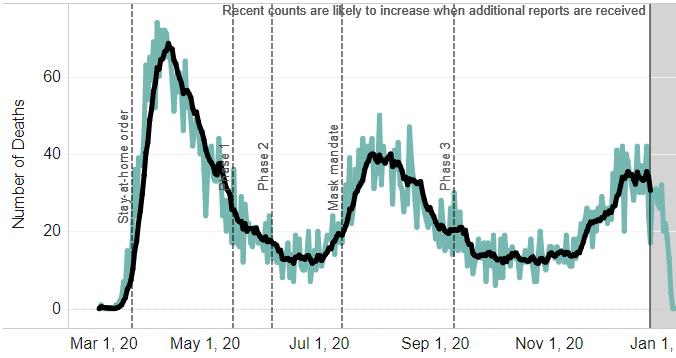
COVID-19 deaths statewide by age group as of January 7, 2021.
Source: Louisiana Office of Public Health, Region 6 (Central Louisiana), Regional Administrator/Medical Director, David J. Holcombe, MD, MSA, January 7, 2021.
Initial and continued unemployment claims in Louisiana from March 14, 2020 through January 2, 2021.


Average weekly initial unemployment claims filed in December fell to 8,671 from 10,500 in November, a 17% decrease.
Average weekly continued unemployment claims in December fell to 66,909 from 87,209 in November, a 23% decrease.
Source: Louisiana Workforce Commission, January 11, 2021
Initial and continued unemployment claims in central Louisiana from March 14, 2020 through January 2, 2021.

Average weekly initial unemployment claims in central Louisiana fell to 486 from 588 in November, a 17% decline.
Average weekly continued unemployment claims in central Louisiana fell to 4,773 from 6,031 in December, a 21% decline.
Source: Louisiana Workforce Commission, January 10, 2021
The table below shows November 2020 preliminary unemployment rate, labor force, and employment data for central Louisiana parishes.
In November, parishes in central Louisiana had an average unemployment rate of 6.9% compared to 8.1% statewide.
Data Source: Louisiana Workforce Commission, January 10, 2021.
The table below shows November 2020 preliminary unemployment rate, labor force, and employment data for Metropolitan Statistical Areas in Louisiana.
At 5.9%, the Alexandria MSA had the lowest unemployment rate among the state’s major metro areas for the seventh straight month, well below the state’s 8.1% rate.
Louisiana’s unemployment rate fell 1.2% in November to 8.1% from 9.3% in October.
Data Source: Louisiana Workforce Commission, January 10, 2021.
The table below shows the number of unemployed, number of advertised jobs online, and the ratio of unemployed to advertised job openings online for Metropolitan Statistical Areas in Louisiana in November 2020.
Alexandria metro area continues to have the tightest labor market in the state with only 0.82 unemployed person per job opening compared to 2.11 statewide.
Source: Louisiana Workforce Commission, January 11, 2021
The tables below shows the industries with the highest job openings advertised online in the Alexandria MSA and statewide on January 10, 2021.
An overview of sales, vehicle sales, and hotel occupancy taxes collected in the December 2020 reflecting sales activity in November 2020.
Note: December tax revenue reflects sales activity in November. N/a = Not available
Data Source noted in detailed reports.


An overview of sales tax revenue in Rapides Parish other towns and cities in December 2020 (excluding Alexandria and Pineville).
Note: Current tax revenue reflects sales activity in prior month.
(TR) Alexandria sales tax revenue for December with previous month, year, and YTD comparisons.
(BR) Alexandria monthly sales tax revenue from 2019 to present.
Note: Current sales tax revenue reflects sales activity in the prior month.
Data Source: Rapides Parish Police Jury Treasurer’s Reports.
Avoyelles Parish total sales tax revenue for December with previous month, year, and year-to-date comparisons. Vehicle and hotel tax revenues are excluded.
Note: December sales tax revenue reflects sales activity in November.
Avoyelles Parish vehicle sales tax revenue for December with previous month, year, and year-to-date comparisons.
Note: December sales tax revenue reflects sales activity in November.
Data Source: Avoyelles Parish School Board. January 8, 2021
Catahoula Parish total sales tax revenue for December with previous month, year, and year-todate comparisons.
Note: December sales tax revenue reflects sales activity in November.
Data Source: Catahoula Parish Tax Administrator January 2021
Concordia Parish total sales tax revenue for December with previous month, year, and year-todate comparisons.
Note: December sales tax revenue reflects sales activity in November.
Data Source: Concordia Parish Tax Administrator. January 2021
Evangeline Parish total sales tax revenue for December with previous month, year and YTD comparisons.
Note: December sales tax revenue reflects sales activity in November.
Data Source: Evangeline Parish Sales Tax Commissioner. January 2021
Evangeline Parish vehicle sales tax revenue for December with previous month, year and YTD comparisons.
Note: December sales tax revenue reflects sales activity in November.
Data Source: Evangeline Parish Sales Tax Commissioner. January 2021
La Salle Parish total sales tax revenue for December with previous month, year, and year-todate comparisons.
Note: December sales tax revenue reflects sales activity in November.
Data Source: La Salle Parish Tax Administrator January 2021

(TR) Pineville sales tax revenue for December with previous month, year, and YTD comparisons.
(BR) Pineville monthly sales tax revenue from 2019 to present.
Note: Current sales tax revenue reflects sales activity in the prior month.
Rapides Parish occupational license revenue YTD (January – December) with previous YTD comparisons.
Note: December YTD occupational license revenue reflects licenses issued YTD in November.
Data Source: Rapides Parish Police Jury Treasurer’s Reports.
(TR) Rapides Parish total sales tax revenue for December with previous month, year, and YTD comparisons.
(BR) Rapides Parish total monthly sales tax revenue from 2019 to present.
Note: December sales tax revenue reflects sales activity in November.
Data Source: Rapides Parish Police Jury Treasurer’s Reports.
Rapides Parish vehicle sales tax revenue for December with previous month, year, and YTD comparisons.
Note: December sales tax revenue reflects sales activity in
Data Source: Tax revenue data from Rapides Parish Police Jury Treasurer’s Reports.
St. Landry Parish sales tax revenue for December with previous month, year, and YTD comparisons.
Note: December sales tax revenue reflects sales activity in November.
Data Source: Tax revenue data from St. Landry Parish School Board. January 2021
St. Landry Parish vehicle sales tax revenue for December with previous month, year, and YTD comparisons.
Note: December sales tax revenue reflects sales activity in November.
Data Source: Tax revenue data from St. Landry Parish School Board. January 2021
This chart shows the valuation of permits issued by Rapides Area Planning Commission in Allen Parish in December between 2017-2020 with monthto-month, year-to-year, and year-to-date comparisons.
Data Source: RapidesArea Planning Commission, January 11, 2021
This chart shows the valuation of permits issued by Rapides Area Planning Commission in Avoyelles Parish in December between 2019-2020 with month-tomonth, year-to-year, and year-to-date comparisons.
Data Source: RapidesArea Planning Commission, January 2021.
This chart shows the valuation of permits issued by Rapides Area Planning Commission in Evangeline Parish in December between 2017-2020 with month-tomonth, year-to-year, and year-to-date comparisons.
Data Source: RapidesArea Planning Commission, January 2021.
This chart shows the valuation of permits issued by Rapides Area Planning Commission in the City of Pineville in December between 2017-2020 with month-to-month, year-to-year, and year-to-date comparisons.
Data Source: RapidesArea Planning Commission, January 2021.
This charts shows the valuation of permits issued by Rapides Area Planning Commission in Rapides Parish (excluding Alexandria) in December between 2017-2020 with month-to-month, year-to-year, and year-to-date comparisons.
Data Source: RapidesArea Planning Commission, January 2021.
New residential construction permit valuation (estimated development cost) issued by Rapides Area Planning Commission by jurisdiction in December 2020 compared to December 2019.
Valuation of New Residential Construction
December 2019 vs December 2020
Note: City ofAlexandria permits are accounted for separately.
Data Source: RapidesArea Planning Commission, January 2021.
The valuation (estimated development cost) of new commercial construction permits issued by the City of Alexandria in December 2020 with previous month, year, and YTD comparisons.
The valuation (estimated development cost) of new residential construction permits issued by the City of Alexandria in December 2020 with previous month, year, and YTD comparisons.

The count of active single-family and condo/townhome listings for Alexandria MSA (excludes pending listings) for December 2017-2020 with month-to-month and year-over-year comparisons.
Active listings decreased 48% since December 2019.

The count of pending single-family and condo/townhome listings for Alexandria MSA for December 2017-2020 with month-tomonth and year-over-year comparisons.
Pending Listing Count in Alexandria July 2016 - December 2020
Pending listings increased 73% since December 2019, from 100 to 173.

The median number of days property listings spend on the market in Alexandria MSA for December 2017-2020 with month-to-month and year-over-year comparisons.
Median days on the market decreased 4% since December 2019, but is up 9% for the month.

The median listing price of houses in Alexandria MSA for December 2017-2020 with month-to-month and year-over-year comparisons.
The median listing price increased 20% since December 2019 from $179,950 to $215,250, but fell 3% since last month.

The average listing price of houses in Alexandria MSA for December 2017-2020 with month-to-month and year-over-year comparisons.
The average listing price increased 21% since December 2019 from $221,831 to $267,747, but fell 1% since last month.
This chart represents non-current mortgages (delinquencies) in Louisiana and the U.S. during 2020.
U.S. 6.33% LA 10.74%


Louisiana’s non-current mortgage delinquency rate dropped 1.1% from its pandemic high of 11.8% in May.
7.2% 7.2% 7.5% 10.9% 11.8% 11.7% 10.8% 11.3% 11.2% 11.0% 10.7% 3.2% 3.3% 3.4% 6.5% 7.8% 7.6% 6.9% 6.9% 6.7% 6.4% 6.3% 0% 2% 4% 6% 8% 10% 12% 14% January-20 March-20 May-20 July-20 September-20 November-20 Non-Current Mortgages in Louisiana 2020 Louisiana U.S.
Avoyelles Parish hotel occupancy tax revenue for December with previous month, year, and year-to-date comparisons.
Note: December tax revenue reflects hotel occupancy activity in November.
Data Source: Avoyelles Parish School Board. December 2020.
Rapides Parish hotel occupancy tax revenue for December 2020 with previous month, year, and YTD comparisons.
Note: December tax revenue reflects hotel occupancy activity in November.
Data Source: Rapides Parish Police Jury Treasurer’s Reports, December 2020.
This chart shows total passenger throughput at Louisiana airports and nationwide in December 2020 as a percent of traffic a year ago.
Passenger Throughput as a Percent a Year Ago

AEX vs Nationwide (December 2020)
In December, AEX (black line) ranked first in the state in percentage of 2019 passenger traffic at 68% of last year’s level.
Data Source: Alexandria International Airport, January 2021

Nationwide daily percentage of passengers passing through TSA checkpoints in 2020 expressed as a percentage of 2019 traffic.
TSA Airport Total Traveler Throughput in 2020 as a Percent 2019 Traffic
Nationwide air passenger traffic in December was 37.6% of last year’s level, compared to 37.0% in November.
Passenger traffic hit a new pandemic high at 61% of 2019 levels on Dec. 23rd, before falling to 24% on Christmas day.
Data Source: DHS, Transportation Security Administration, https://www.tsa.gov/coronavirus/passenger-throughput, January 9, 2021
The table and chart represents the percent change in average consumer credit and debit card spending in Cenla as of December 6, 2020 with January 2020 as the baseline, while the chart represents Rapides.
The chart below represents the percent change in small business revenue in Louisiana and the U.S. as of December 30, 2020 with January 2020 as the baseline. The table shows the percentage change for small business revenue by industry.
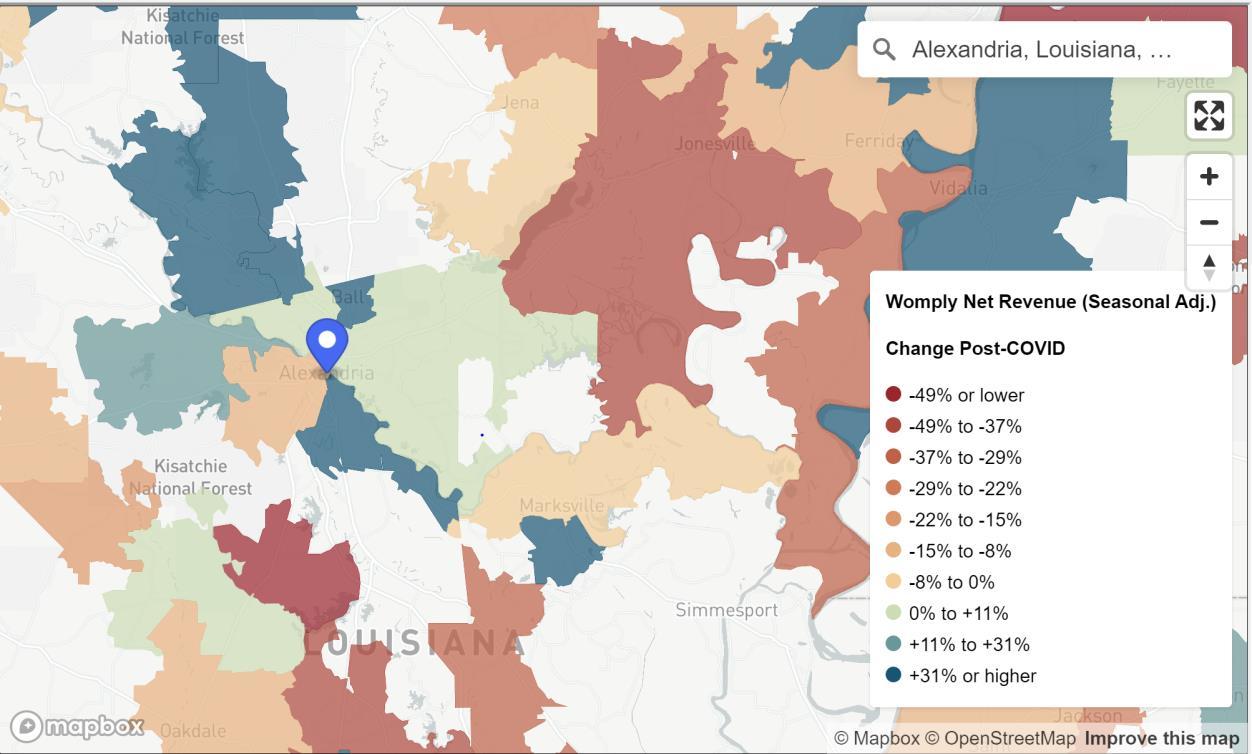
The chart on the left represents the percent change in small business revenue in Rapides as of December 30, 2020 with January 2020 as the baseline. The graphic on the right shows the percentage change for small business revenue by zip code. Source: Opportunity Insights Economic Tracker, https://www.tracktherecovery.org/ Date Source: Womply. Retrieved January 9, 2021.
The chart below represents the percent change in the number of small businesses open in Louisiana and Rapides as of December 30, 2020 with January 2020 as the baseline.
The charts represent the percent of time spent at retail / restaurant and grocery locations in Rapides Parish compared with the state as of December 31, 2020 with January 2020 as the baseline.
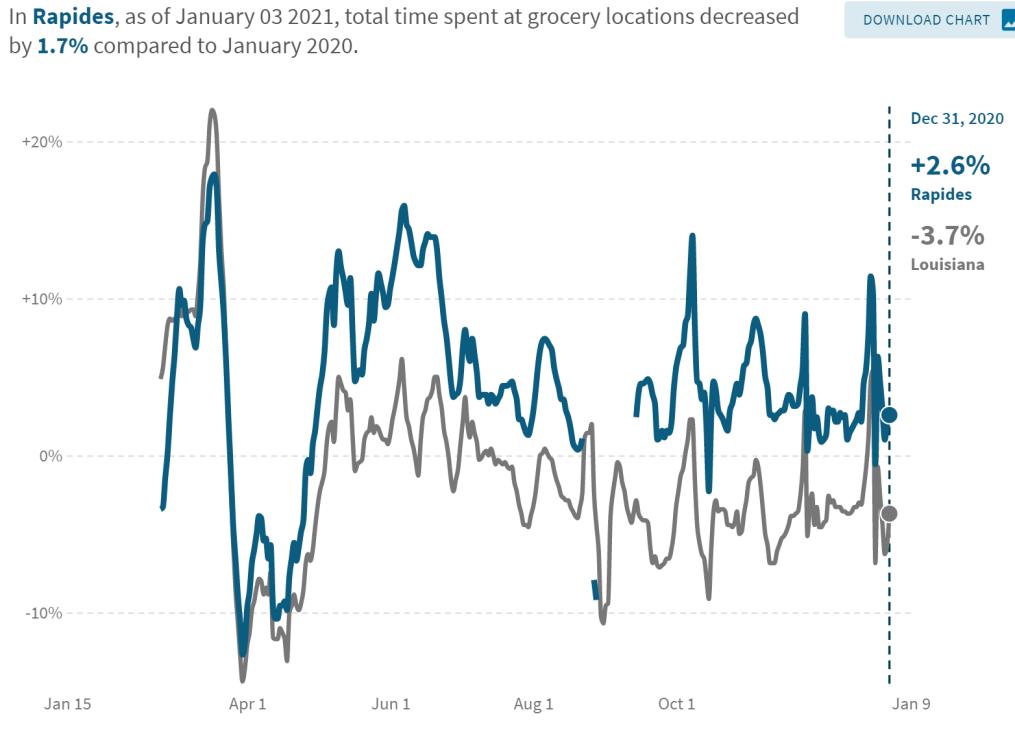
Rapides consumers spent more time retail shopping and dining than the statewide average, -11% compared to -16% statewide. Likewise, consumers in Rapides outpaced the state in total time in grocery stores, +2.6% compared to -3.7%.
The charts represent the percent of time spent at work and away from home in Rapides Parish as compared with the state as of January 3, 2021 with January 2020 as the baseline.
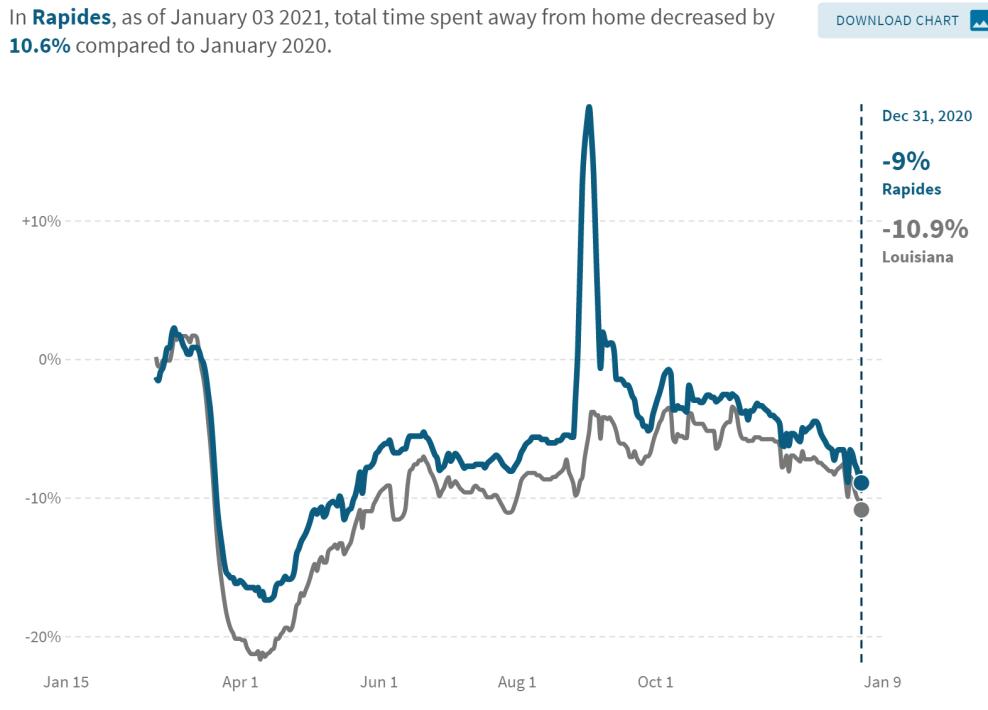
Employees in Rapides spent more time at work than the state average, although down -25.6% from January 2020 compared to -29.4% statewide. On the other hand, individuals in Rapides spent approximately the same amount of time away from home as the state average.
Weekly business applications in Louisiana in 2019 and 2020 through December 26.

Business Applications in Louisiana 2019 vs 2020
Year-to-date through December 26, 2020, 82,800 business applications have been filed in Louisiana, compared to 53,940 for the same period in 2019, representing a 54% increase.
The Coincident Economic Activity Index for Louisiana includes four indicators: nonfarm payroll employment, the unemployment rate, average hours worked in manufacturing and wages and salaries. The index is set to match the trend for gross state product.
Coincident Economic Activity Index for Louisiana

November 2019 - November 2020
• The chart shows the impact of COVID-19 on the Louisiana’s gross state product since November 2019.
Index for November increased 1.2% over October, indicating continued strength in the economy.
Data Source: FRED Economic Data, Federal Reserve Bank of St. Louis, January 9, 2021. https://fred.stlouisfed.org/series/LAPHCI
Total gasoline sales in Louisiana since 2019.
Gasoline Sales in Louisiana
2019 2020


Thousands of Gallons / Day
Year-to-date gasoline sales are down 5.7% in 2020 compared to 2019. 6,000
In October 2020, Louisiana gasoline sales increased 3.7% from September and was 0.9% above October 2019. 5,000
8,000 January February March April May June July August September October November December
7,000


Source: Baker Hughes, https://rigcount.bakerhughes.com/na-rig-count, January 9, 2021
Gaming revenue in Louisiana for November 2020 with previous month and year comparisons.
Data Source: Louisiana Gaming Control Board, January 9, 2021. http://lgcb.dps.louisiana.gov/revenue_reports.html
U.S. economic indicators for November 2020.
Data Source: U.S. Census, https://www.census.gov/economic-indicators/, Jan. 11, 2021.
The data presented throughout the CENLA Economic Dashboard reflects contributions from the following local organizations.
• Rapides Parish Policy Jury Treasurer
• Avoyelles Parish School Board
• Alexandria InternationalAirport
• RapidesArea Planning Commission
• City ofAlexandria Planning Division
• Evangeline Parish Sales Tax Commissioner
• Concordia, Catahoula, & La Salle TaxAdministrator
• Louisiana Office of Public Health, Region 6
• St. Landry Parish School Board
Also, special thanks to the following partners for distributing the dashboard.
Next Issue: Week of Feb. 14th
• LSUAFoundation
• Central Louisiana Regional Chamber of Commerce
• Marksville Chamber of Commerce
• Bunkie Chamber of Commerce
• Evangeline Chamber of Commerce
• St. Landry Chamber of Commerce
Current and past issues of the CENLAEconomic Dashboard can be found at http://www.lsua.edu/coronavirus/cenla-economic-dashboard/