CENLA ECONOMIC DASHBOARD
June 16, 2020.
Dr.RandallDupont Dean,CollegeofBusiness
LouisianaStateUniversityofAlexandria
rdupont@lsua.edu
CONTENTS
June 16, 2020
• COVID-19Apple Mobility Trends
• COVID-19 Cases in CENLA
• COVID-19 Cases in Rapides Parish
• COVID-19 in Phase One
• COVID-19 Stats in Cenla
• Unemployment rate in CENLA
• Total Unemployment Claims in Louisiana
• Unemployment Claims in CENLA
• Initial Unemployment Claims by Parish
• Employment Changes by Sector in LA
• Top Employers
• Candidates per Job inAlexandria
• Avoyelles Sales Tax
• Avoyelles Vehicle Sales Tax
• Avoyelles Hotel Occupancy Tax
• Catahoula Sales Tax
• Concordia Sales Tax
• Evangeline Sales Tax
• Evangeline Vehicle Sales Tax
• La Salle Sales Tax
• St. Landry Sales Tax
• St. Landry Vehicle Sales Tax
• Rapides Sales Tax
• Rapides Vehicle Sales Tax
• Rapides Hotel Occupancy Tax
• Alexandria Housing Market
• Air Traffic in Louisiana
• AEXAir Traffic va USA
• Louisiana Business Formation
• Louisiana Small Business Pulse Survey
• Baker Hughes Rig Count
• Advance Monthly Retail Indicators
• National Economic Indicators
KEYTAKEAWAYS
June 16, 2020 CENLA Economic Dashboard
• Mobility in Cenla is 66%-91% above the Jan. 13 baseline, according to Apple’s Mobility Trend Report.
• From June 1-14, COVID-19 cases in Rapides increased 43% from 800 to 1145.
• Rapides Parish in Phase 1 averaged 21 cases per day, while Phase 2 is averaging 30 cases per day.
• InApril, central Louisiana had an average unemployment rate of 11.4% compared to 14.5% statewide.
• Statewide initial unemployment claims rose 13% the week ending June 6 from the previous week, the first increase in six weeks.
• Initial unemployment claims in Cenla rose 14.5% with 8 of the 10 Cenla parishes reporting increases.
• Sales tax revenues inApril were down in all Cenla parishes reporting tax data in the Dashboard with decreases ranging from -30% in La Salle to -8% in Concordia. YTD revenues remained relatively strong.
• Vehicle sales tax revenue dropped significantly inApril from March across Cenla ranging from a -18% in Evangeline Parish to -48% in Rapides, while YTD sales were still up 9% in Rapides.
• Active listings of single family homes inAlexandria in May reached a five-year low, according to Realtor.com.
• As a percent of passenger traffic,AEX ranked 2nd in the state in first week of June compared to last year.
• New business formations reached an all-time weekly high in Louisiana the week ending June 6th with 1,590 business applications filed. YTD 27,450 businesses were formed in Louisiana through the first week of June compared to 27,350 in 2019.
COVID-19
COVID-19APPLEMOBILITYTRENDS
Apple’s Mobility Trends Report tracks aggregate changes in driving from the January 13 baseline to June 13, 2020.
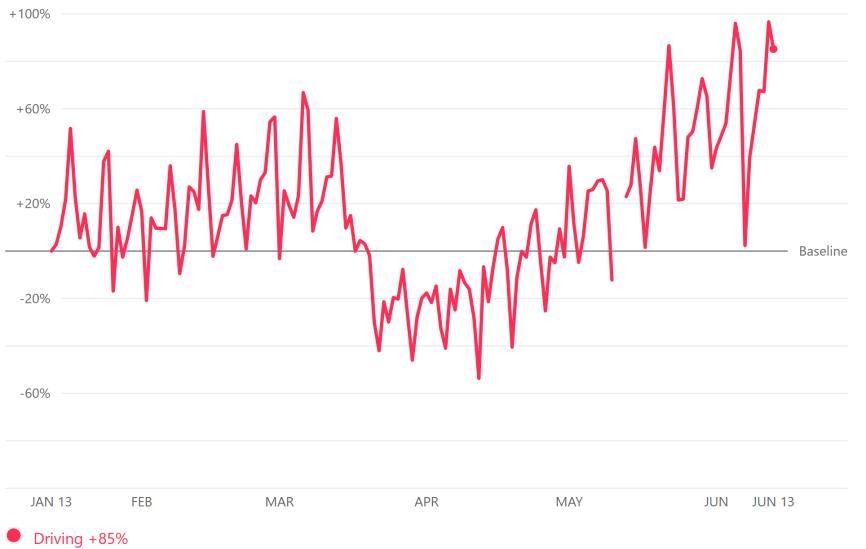
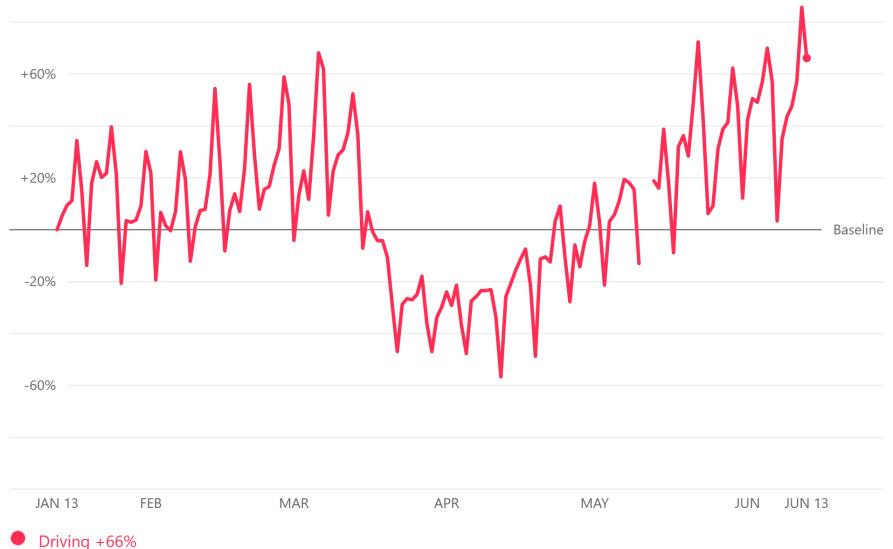
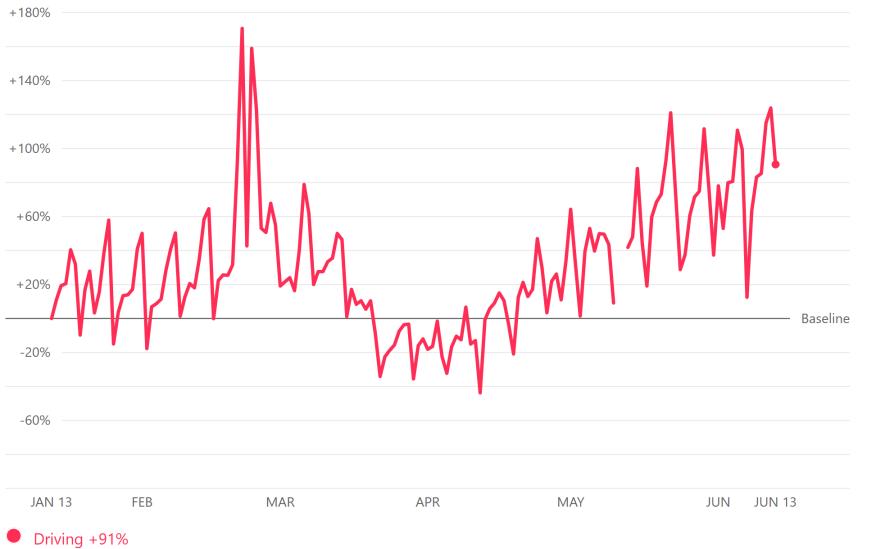
Rapides mobility up 66% over Jan 13
Avoyelles mobility up 85% over Jan 13
Evangeline mobility up 91% over Jan 13
Rapides
Evangeline Avoyelles
Source: Apple Mobility Trends Report, https://www.apple.com/covid19/mobility, June 15, 2020
COVID-19CASESINCENLA
(L) Cases per 1,000 population as of June 14, 2020
(R) Cumulative cases by parish Source:
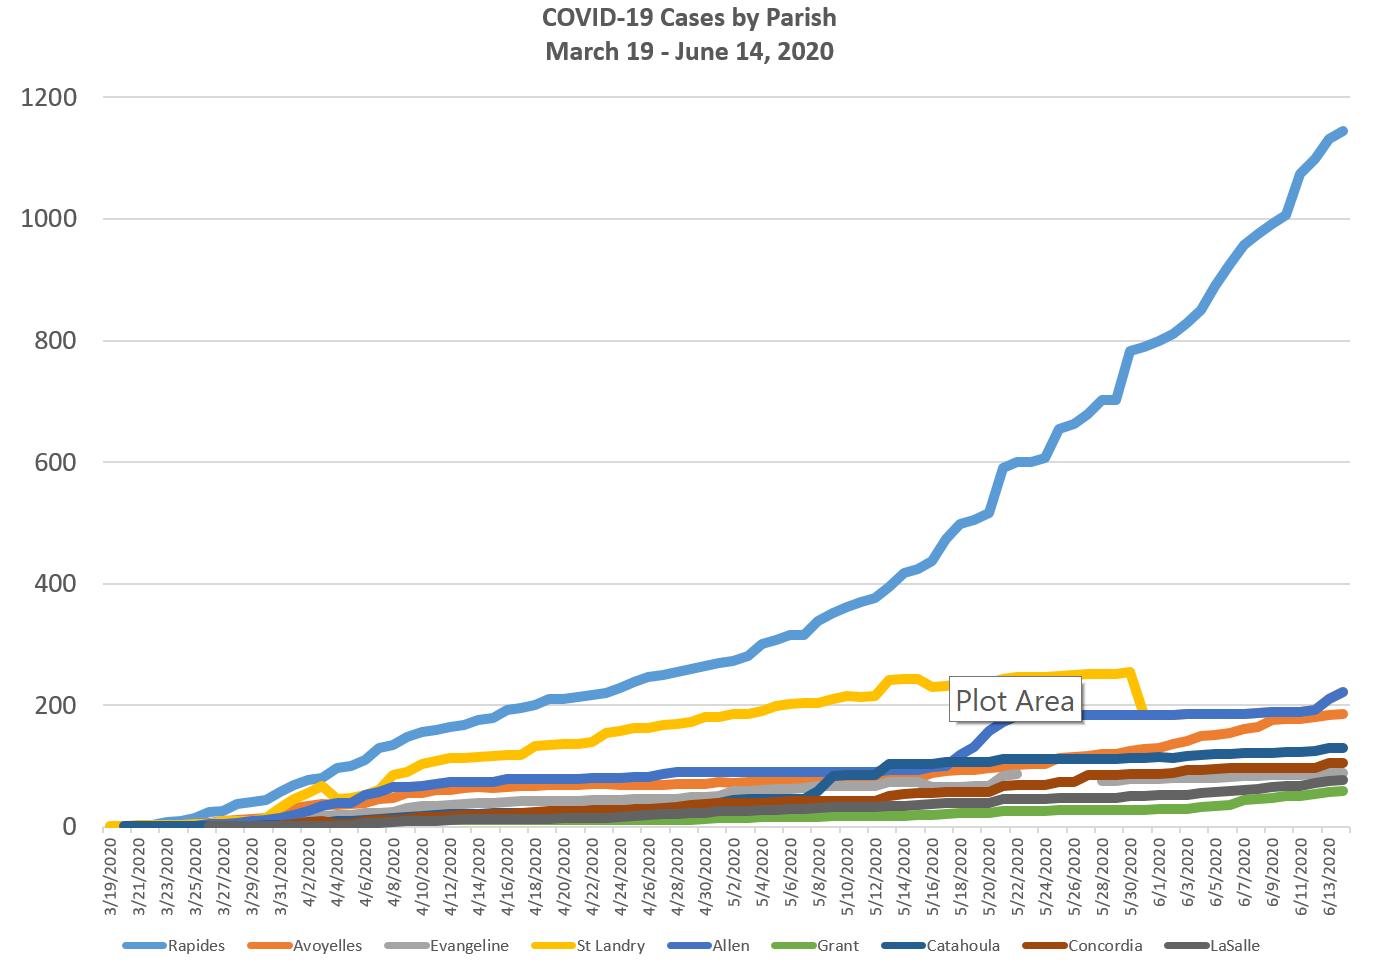
Rapides
Data from New York Times Github and US Census 2019 Population Estimate, June 14,
Parish Cases / 1000 Allen 8.66 Avoyelles 4.61 Catahoula 13.69 Concordia 5.45 Evangeline 2.67 Grant 2.64 LaSalle 5.04 Rapides 8.83 St Landry 4.35
2020
COVID-19CASESINRAPIDESPARISH
(L)
Daily new cases in Rapides Parish.
Daily new cases per week in Rapides Parish. Source: Data from New York Times Github database, June 15, 2020 Mar 16 Mar 23 Mar 30 Apr 6 Apr 13 Apr 20 Apr 27 May 4 May 11 May 18 May 25 June 1 June 7 Cases 3 38 59 65 45 37 34 81 112 132 184 167 188 0 40 80 120 160 200 New Cases per Week in Rapides March 16 - June 14, 2020 0 10 20 30 40 50 60 70 80 90 Daily New Cases in Rapides Parish March 20 - June 14, 2020
(R)
COVID-19CASESINPHASEONE
Daily new cases in Rapides Parish. Red columns represent an increasing number of cases, green decreasing, and gray stable. Blue line is a 7 day moving average. Source: Data from New
In Phase 1, Rapides Parish averaged 21 cases per day, while Phase 2 it has averaged 30 cases per day from June 5 - 14.
0 10 20 30 40 50 60 70 80 90 100
Daily New Cases in Rapides Parish March 20 - June 14, 2020
Phase 1 Opening
York Times Github database, June 14, 2020
COVID-19STATSINCENLA
Comparative statistics of Covid-19 tests, cases, and deaths in Cenla.
Source: Data from La. Department of Health, June 12, 2020
% Testing Positive Tests / 1,000 Deaths / 1,000 Deaths Cases / 1,000 Cases Avoyelles 6.3% 71 0.22 9 4.47 181 Catahoula 15.9% 81 0.31 3 12.91 124 Concordia 8.2% 60 0.26 5 4.96 97 Evangeline 4.7% 56 0.03 1 2.6 87 Grant 4.4% 54 0.04 1 2.4 54 LaSalle 10.4% 46 0 0 4.83 72 Rapides 9.8% 86 0.31 41 8.41 1098 St. Landry 5.2% 76 0.66 55 3.94 326 Vernon 1.9% 45 0.06 3 0.88 43
EMPLOYMENT
UNEMPLOYMENTRATEINCENLA
The table below shows April 2020 preliminary unemployment rate, labor force, and employment data for central Louisiana parishes.
InApril, parishes in central Louisiana had an average unemployment rate of 11.4% compared to 14.5% statewide.
Data Source: Louisiana Workforce Commission, June 10, 2020
Area Labor Force Employed Unemployed Unemployment Rate April 2020 Unemployment Rate March 2020 Allen Parish 8,212 6,935 1,277 15.6% 7.7% Avoyelles Parish 14,100 12,069 2,031 14.4% 7.7% Catahoula Parish 3,029 2,729 300 9.9% 7.7% Concordia Parish 6,296 5,589 707 11.2% 8.7% Evangeline Parish 10,431 9,234 1,197 11.5% 7.5% Grant Parish 7,382 6,665 717 9.7% 7.7% La Salle Parish 5,922 5,493 429 7.2% 5.6% Rapides Parish 50,298 45,316 4,982 9.9% 6.4% St. Landry Parish 28,858 25,044 3,814 13.2% 8.2% Vernon Parish 13,993 12,448 1,545 11.0% 9.4%
TOTALUNEMPLOYMENTCLAIMSINLOUISIANA
Initial and continued unemployment claims in Louisiana.
Initial unemployment claims rose 13% the week of June 6 from the previous week, the first increase in six weeks.
Continued claims rose 1% from the previous week.
Source: Louisiana Workforce Commission, June 10, 2020
2,262 72,474 97,472 102,267 79,760 92,026 66,227 51,037 40,194 28,620 24,027 19,386 21,926 14,041 14,208 58,088 120,810 217,640 264,430 300,791 310,152 325,283 326,646 328,607 301,750 305,239 3/14 3/21 3/28 4/4 4/11 4/18 4/25 5/2 5/9 5/16 5/23 5/30 6/6 Initial Continued
UNEMPLOYMENTCLAIMSINCENLA
(L) Initial unemployment claims in Cenla March 21 – June 6
(R) Continued unemployment claims in Cenla March 21 –June 6
Continued unemployment claims fell in Cenla by 1% the week of June 6, while rising 1% statewide. Initial unemployment claims rose 14.5% in Cenla, compared 13% statewide.
Source: Louisiana Workforce Commission, June 10, 2020
1,030 2,874 6,435 11,497 13,294 16,886 17,811 18,400 18,831 18,987 17,374 17,189 Cenla
Unemployment
Mar 21 - June 6 3240 5571 5843 4657 5747 4117 3312 2697 2,035 1,721 1528 1750 Cenla Initial Unemployment Claims Mar 21 - June 6
Continued
Claims
INITIALUNEMPLOYMENTCLAIMSBYPARISH
Snapshot of weekly initial claims in select parishes filed April 11 through June 6, 2020.
Source: Louisiana Workforce Commission, June 14, 2020200 400 600 800 1,000 1,200 1,400 1,600 Avoyelles Evangeline Rapides Initial Unemployment Claims in Rapides, Avoyelles, & Evangeline April 11 - June 6, 2020 11-Apr 18-Apr 25-Apr 2-May 9-May 16-May 23-May2 30-May 6-Jun Initial
in 8 of the
Cenla parishes.
unemployment claims rose slightly
10
EMPLOYMENTCHANGESBYSECTORINLA
The change in employment level in Louisiana by industry sector from March to April 2020.
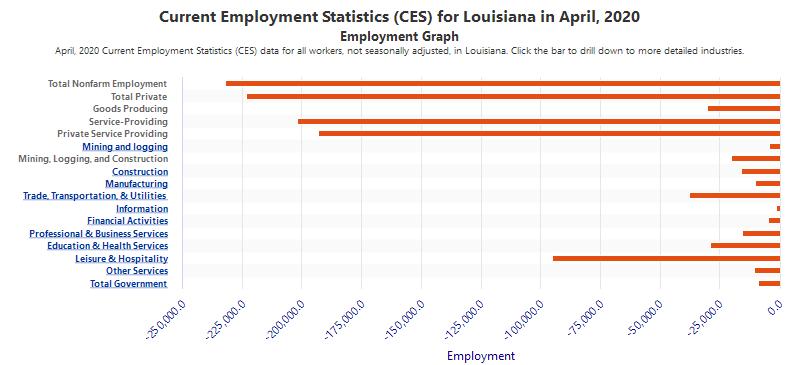
Data Source: Louisiana Workforce Commission, June 14, 2020
TOPEMPLOYERS
The tables below shows employers with the highest number of job openings advertised online on June 10, 2020.
AlexandriaMSA Louisiana Employer Name Job Openings Ochsner Clinic Foundation 1,264 CHRISTUS Health 1,008 Dart Transit Company 952 Pizza Hut, Inc. 906 Ochsner Health System 683 Dollar Tree, Inc. 599 SONIC Corp. 589 Lafayette General Health 585 Army National Guard 566 Lowe's Companies, Inc 545 Employer Job Openings CHRISTUS Health 306 Rapides Parish School District 115 Dart Transit Company 62 DoorDash, Inc. 40 Army National Guard 39 Pizza Hut, Inc. 33 HCA Healthcare, Inc. 30 Lowe's Companies, Inc 28 Jiffy Lube International, Inc. 24 Encompass Health Corporation 23 Source: Louisiana Workforce Commission, June 10, 2020
CANDIDATESPERJOBINALEXANDRIA
The tables below shows the occupations with the highest job openings advertised online in Alexandria on June 14, 2020, the number of job openings number of potential candidates, and potential candidates per job opening.
Source: Louisiana Workforce Commission, June 14, 2020 Rank Occupation Median Wage Job Openings Potential Candidates Potential Candidates Per Job Opening 1 Registered Nurses $58,234 285 181 0.64 2 Driver/Sales Workers $19,695 82 234 2.85 3 Physicians and Surgeons N/A 54 19 0.35 4 Truck Drivers $32,899 50 659 13.18 5 Supervisors of Food Workers $29,082 47 138 2.94 6 Retail Salespersons $20,300 44 503 11.43 7 Customer Service Reps $23,698 43 1,296 30.14 8 Food Preparation and Serving Workers $18,146 42 336 8 9 Farmworkers and Laborers $22,195 34 48 1.41 10 General and Operations Managers $77,100 30 323 10.77
TAXREVENUE
AVOYELLESSALESTAX
Avoyelles Parish total sales tax revenue for May with previous month, year, and year-to-date comparisons. Vehicle and hotel tax revenues are excluded.
Note: May sales tax revenue reflects sales activity in April.
Data Source: Avoyelles Parish School Board.
May -13.5% May YoY 2.8% May YTD -3.6% May 2016 2017 2018 2019 2020 May 1,303,592 1,373,385 1,287,588 1,330,457 1,367,712 April 1,235,504 1,588,086 1,610,221 1,695,869 1,580,351 % Chg over Prev Month -13.5% -20.0% -21.5% -13.5% % Chg over Prev Year 5.4% -6.2% 3.3% 2.8% YTD (Jan - May) 6,603,531 7,140,792 6,974,991 7,393,763 7,126,095 % Chg over Prev YTD 8.1% -2.3% 6.0% -3.6%
AVOYELLESVEHICLESALESTAX
Avoyelles Parish vehicle sales tax revenue for May with previous month, year, and year-to-date comparisons.
Note: May sales tax revenue reflects sales activity in April.
Data Source: Avoyelles Parish School Board.
May -31.8% May YoY -34.0% May YTD -3.4% May 2016 2017 2018 2019 2020 May 303,170 293,337 299,070 305,928 201,863 April 280,701 362,274 320,682 308,022 296,018 % Chg over Prev Month -19.0% -6.7% -0.7% -31.8% % Chg over Prev Year -3.2% 2.0% 2.3% -34.0% YTD (Jan - May) 1,355,671 1,427,928 1,311,437 1,330,381 1,284,836 % Chg over Prev YTD 5.3% -8.2% 1.4% -3.4%
AVOYELLESHOTELOCCUPANCYTAX
Avoyelles Parish hotel occupancy tax revenue for May with previous month, year, and year-to-date comparisons.
Note: May sales tax revenue reflects sales activity in April.
Data Source: Avoyelles Parish School Board.
May -38.7% May YoY -41.7% May YTD -16.1% May 2016 2017 2018 2019 2020 May 10,121 13,161 11,041 13,544 7,901 April 9,669 11,290 11,448 12,256 12,880 % Chg over Prev Month 16.6% -3.6% 10.5% -38.7% % Chg over Prev Year 30.0% -16.1% 22.7% -41.7% YTD (Jan - May) 46,084 55,345 46,633 48,915 41,043 % Chg over Prev YTD 20.1% -15.7% 4.9% -16.1%
CATAHOULASALESTAX
Catahoula Parish total sales tax revenue for May with previous month, year, and year-to-date comparisons.
Note: May sales tax revenue reflects sales activity in April.
Data Source: Catahoula Parish Tax Administrator
May -13.2% May YoY 8.7% May YTD 0.0% May 2019 2020 May $ 429,099 $ 466,424 April $ 573,185 $ 537,327 % Chg over Prev Month -25.1% -13.2% % Chg over Prev Year 8.7% YTD (Jan - May) $ 2,360,711 $ 2,359,907 % Chg over Prev YTD 0.0%
CONCORDIASALESTAX
Concordia Parish total sales tax revenue for May with previous month, year, and year-to-date comparisons.
Note: May sales tax revenue reflects sales activity in April.
Data Source: Concordia Parish Tax Administrator
May -7.7% May YoY 3.2% May YTD -6.9% May 2019 2020 May $ 1,013,315 $ 1,045,294 April $ 1,268,972 $ 1,133,096 % Chg over Prev Month -20.1% -7.7% % Chg over Prev Year 3.2% YTD (Jan - May) $ 5,468,802 $ 5,090,083 % Chg over Prev YTD -6.9%
EVANGELINESALESTAX
Evangeline Parish total sales tax revenue for May with previous month, year and YTD comparisons.
Note: May sales tax revenue reflects sales activity in April.
Data Source: Evangeline Parish Sales Tax Commissioner.
2016 2017 2018 2019 2020 May $1,313,760 $ 1,464,100 $1,362,082 $1,595,997 $1,489,051 April $1,910,432 $ 1,950,371 $1,724,796 $1,790,920 $1,760,760 % Chg over Prev Month -24.9% -21.0% -10.9% -15.4% % Chg over Prev Year 11.4% -7.0% 17.2% -6.7% YTD (Jan - May) $7,502,599 $ 7,865,194 $7,412,988 $7,865,133 $7,706,084 % Chg over Prev YTD 4.8% -5.7% 6.1% -2.0% May -15.4% May YoY -6.7% May YTD -2.0% May
EVANGELINEVEHICLESALESTAX
Evangeline Parish vehicle sales tax revenue for May with previous month, year and YTD comparisons.
Note: May sales tax revenue reflects sales activity in April.
Data Source: Evangeline Parish Sales Tax Commissioner.
2016 2017 2018 2019 2020 May $ 266,901 $ 301,569 $ 286,111 $ 351,269 $ 247,941 April $ 318,894 $ 390,369 $ 303,078 $ 310,254 $ 303,815 % Chg over Prev Month -22.7% -5.6% 13.2% -18.4% % Chg over Prev Year 13.0% -5.1% 22.8% -29.4% YTD (Jan - May) $1,385,554 $ 1,530,295 $1,376,115 $1,561,361 $1,420,956 % Chg over Prev YTD 10.4% -10.1% 13.5% -9.0% May -18.4% May YoY -29.4% May YTD -9.0% May
LASALLESALESTAX
La Salle Parish total sales tax revenue for May with previous month, year, and year-to-date comparisons.
Note: May sales tax revenue reflects sales activity in April.
Data Source: La Salle Parish Tax Administrator
May -30.5% May YoY 16.9% May YTD -1.7% May 2019 2020 May $ 708,649 $ 828,127 April $ 1,096,556 $ 1,192,240 % Chg over Prev Month -35.4% -30.5% % Chg over Prev Year 16.9% YTD (Jan - May) $ 4,572,210 $ 4,493,275 % Chg over Prev YTD -1.7%
ST.LANDRYSALESTAX
St. Landry Parish sales tax revenue for May with previous month, year, and YTD comparisons.
Note: May tax revenue reflects sales activity inApril.
Data Source: Tax revenue data from St. Landry Parish School Board.
May -13.7% May YoY -0.6% May YTD 4.9% May 2016 2017 2018 2019 2020 May $ 4,917,288 $ 5,082,233 $ 5,340,944 $ 5,663,303 $ 5,630,178 April $ 6,311,664 $ 6,452,453 $ 6,783,548 $ 6,311,664 $ 6,520,588 % Chg over Prev Month -21.2% -21.3% -10.3% -13.7% % Chg over Prev Year 3.4% 5.1% 6.0% -0.6% YTD (Jan - May) $27,193,440 $28,329,011$28,306,441$29,273,505$30,704,161 % Chg over Prev YTD 4.2% -0.1% 3.4% 4.9%
ST.LANDRYVEHICLESALESTAX
St. Landry Parish vehicle sales tax revenue for May with previous month, year, and YTD comparisons.
Note: May tax revenue reflects sales activity inApril.
Data Source: Tax revenue data from St. Landry Parish School Board.
May -22.8% May YoY -32.2% May YTD 1.5% May 2016 2017 2018 2019 2020 May $726,835 $780,893 $792,738 $960,665 $650,959 April $891,016 $1,049,020 $879,480 $757,072 $843,064 % Chg over Prev Month -25.6% -9.9% 26.9% -22.8% % Chg over Prev Year 7.4% 1.5% 21.2% -32.2% YTD (Jan - May) $3,683,670 $4,102,393 $3,798,256 $3,938,276 $3,997,819 % Chg over Prev YTD 11.4% -7.4% 3.7% 1.5%
RAPIDESSALESTAX
(TR) Rapides Parish total sales tax revenue for May with previous month, year, and YTD comparisons.
(BR) Rapides Parish total monthly sales tax revenue from 2017 to present.
Note: May sales tax revenue reflects sales activity in April.
Data Source: Rapides Parish Police Jury Treasurer’s Reports.
2016 2017 2018 2019 2020 April $ 9,367,359 $10,299,735 $10,692,749 $11,165,361 $10,398,820 March $ 11,008,603 $12,303,146 $12,957,935 $12,371,569 $11,623,165 % Chg over Prev Month -16.3% -17.5% -9.7% -10.5% % Chg over Prev Year 10.0% 3.8% 4.4% -6.9% YTD (Jan - May) $ 51,090,946 $55,024,101 $56,493,776 $57,324,363 $57,269,543 % Chg over Prev YTD 7.7% 2.7% 1.5% -0.1% May -10.5% May YoY -6.9% May YTD -0.1% May $5 $7 $9 $11 $13 $15 Jan-17 Apr-17 Jul-17 Oct-17 Jan-18 Apr-18 Jul-18 Oct-18 Jan-19 Apr-19 Jul-19 Oct-19 Jan-20 Apr-20 Millions Rapides Parish Total Sales Tax Collections 2017 - 2020
RAPIDESVEHICLESALESTAX
Rapides Parish vehicle sales tax revenue for May with previous month, year, and YTD comparisons.
Note: May tax revenue reflects sales activity inApril.
Data Source: Tax revenue data from Rapides Parish Police Jury Treasurer’s Reports.
2016 2017 2018 2019 2020 May $ 985,718 $1,062,090 $1,208,480 $1,181,110 $ 789,052 April $ 976,751 $1,196,510 $1,169,513 $1,102,630 $1,516,978 % Chg over Prev Month -11.2% 3.3% 7.1% -48.0% % Chg over Prev Year 7.7% 13.8% -2.3% -33.2% YTD (Jan - May) $ 4,610,753 $5,186,553 $5,281,665 $5,175,057 $5,561,730 % Chg over Prev YTD 12.5% 1.8% -2.0% 7.5%
May -48.0% May YoY -33.2% May YTD 7.5% May
RAPIDESHOTELOCCUPANCYTAX
Rapides Parish hotel occupancy tax revenue for May 2020 with previous month, year, and YTD comparisons.
Note: May tax revenue reflects hotel occupancy activity in April.
Data Source: Rapides Parish Police Jury Treasurer’s Reports.
May 73.6% May YoY -11.7% May YTD -19.2% 2017 2018 2019 2020 May $146,292 $162,166 $159,950 $141,188 April $ 188,207 $ 196,377 $ 207,573 $ 81,343 % Chg over Prev Month -22.3% -17.4% -22.9% 73.6% % Chg over Prev Year 10.9% -1.4% -11.7% YTD (Jan - May) $694,792 $741,764 $798,923 $645,290 % Chg over Prev YTD 6.8% 7.7% -19.2% May
HOUSING
ALEXANDRIAHOUSINGMARKET
(L) The count of active single-family and condo/townhome listings for Alexandria MSA (excludes pending listings). (TR) The median number of days property listings spend on the market. (BR) The median listing price.
317
95 May 2020 = $197,550
$160,000 $170,000 $180,000 $190,000 $200,000 $210,000 2016-07-01 2017-05-01 2018-03-01 2019-01-01 2019-11-01 Median Listing Price in Alexandria July 2016 - May 2020 0 100 200 300 400 500 600 2016-07-01 2017-02-01 2017-09-01 2018-04-01 2018-11-01 2019-06-01 2020-01-01 Active Listings Count in Alexandria July 2016 - May 2020
Data Source: Realtor.com. Retrieved from FRED, Federal Reserve Bank of St. Louis. June 10, 2020
=
0 20 40 60 80 100 120 2016-07-01 2017-03-01 2017-11-01 2018-07-01 2019-03-01 2019-11-01 Median Days on Market in Alexandria July 2016 - May 2020
2020 =
May 2020
May
TRAVEL
AIRPASSENGERTRAFFICINLOUISIANA
(R) Shows total passenger throughput at Alexandria International and other major Louisiana airports from June 1 - 7, 2020 as a percent of traffic a year ago.
As a percent of year over year passenger traffic,AEX ranked 2nd in the state in first week of June compared to the same period last year.
AEX passenger traffic in May was 15.4% of May 2019 traffic, which compared favorably to only 9.6% nationwide.
Data Source: Alexandria International Airport, June 11, 2020
Percent of Passenger Traffic At Louisiana Airports Compared to Same Period Last Year
June 1 - 7, 2020
28% 18% 41% 21% 19% 11% 26% 15% 0% 10% 20% 30% 40% 50% Alexandria Baton Rouge Lake Charles Lafayette Monroe New Orleans Shreveport National
AEXPASSENGERTRAFFICVSUSA
Shows total passenger throughput at Alexandria International and nationwide from May 1 – June 13, 2020 as a percent of traffic a year ago.
Average percent of travelers at AEX from 5/1 to 6/13 compared to a year ago
19.0%
Average percent of travelers nationwide from 5/1 to 6/13 compared to a year ago
Data Source: Alexandria International Airport, June 15, 2020
Passenger Throughput as a Percent a Year Ago
AEX vs Nationwide (May 1 - June 13)
11.7% 0.0% 5.0% 10.0% 15.0% 20.0% 25.0% 30.0% 35.0% 40.0% 45.0% 50.0%
AEX USA
LOUISIANA
LOUISIANABUSINESSFORMATION
(L) The number of business applications in Louisiana each week in 2019 and 2020. (R) The percent of change in business applications in Louisiana in 2020 compared to the same week in 2019.
% Change in Louisiana Business Formation in 2020 vs same week in 2019
New business formations reached an all-time weekly high in Louisiana the week of June 6th with 1,590 business applications filed. YTD 27,450 businesses were formed through the first week of June compared to 27,350 in 2019.
Source: Business Formation Statistics, U.S. Census Bureau, https://www.census.gov/econ/bfs/index.html, June 8, 2020
Data
0 200 400 600 800 1000 1200 1400 1600 1800 Business Formation Applications in Louisiana 2019 vs 2020 2019 2020 -60 -40 -20 0 20 40 60 80 100
LOUISIANASMALLBUSINESSPULSESURVEY
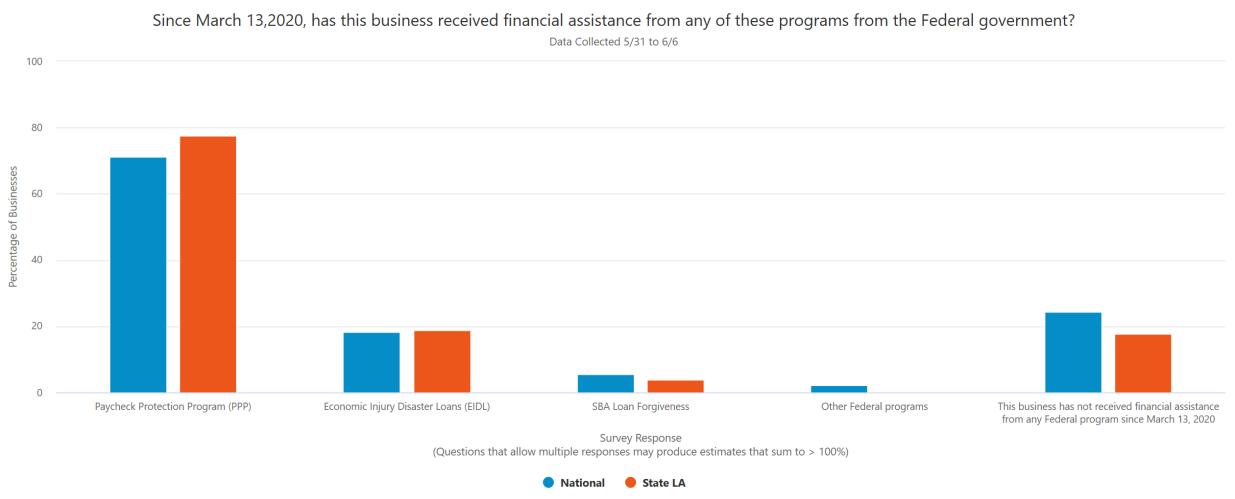
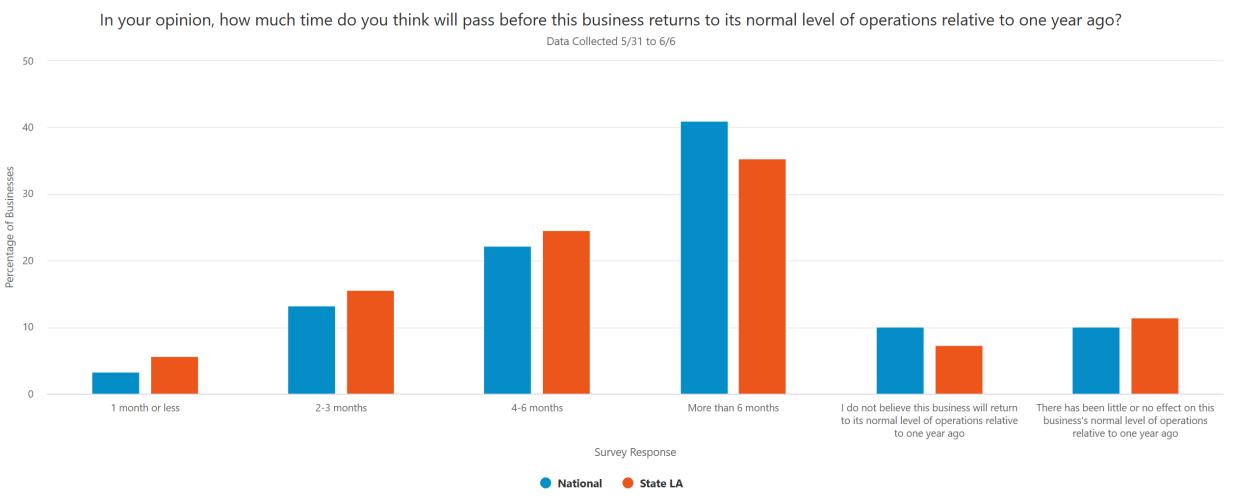
In April, the US Census initiated a survey to track the pulse of small businesses during the COVID-19 pandemic. Results for the May 31 – June 6 period in Louisiana are shown on the right.
Only 35% of LA small businesses said it would be more than 6 months for their business to return to normal compared to 41% nationally.
77.6% of LAsmall businesses reported receiving Payroll Protection Program assistance compared to 71.6% nationally.
Source: U.S. Census Bureau, https://www.census.gov/data/experimental-data-products/small-business-pulse-survey.html, June 14, 2020
BAKERHUGHESRIGCOUNT
Represents the number of drilling rigs actively exploring for or developing oil or natural gas in Louisiana and the U.S.
Rig Count in Louisiana & US
January 2020 - Present
Source: Baker Hughes, https://rigcount.bakerhughes.com/na-rig-count, June 14, 2020
Jan 20 Mar 20 May 20 N. LA-Land 31 27 22 S. LA –Int’l Water 1 1 0 S. LA-Land 3 1 11 S. LA-Offshore 20 19 13 TOTAL LOUISIANA 55 48 36 TOTAL US 791 771 348 0 10 20 30 40 50 60 70 0 100 200 300 400 500 600 700 800 900 3-Jan 10-Jan 17-Jan 24-Jan 31-Jan 7-Feb 14-Feb 21-Feb 28-Feb 6-Mar 13-Mar 20-Mar 27-Mar 3-Apr 10-Apr 17-Apr 24-Apr 1-May 8-May 15-May 22-May 29-May 5-Jun 3Jan 10Jan 17Jan 24Jan 31Jan 7Feb 14Feb 21Feb 28Feb 6Mar 13Mar 20Mar 27Mar 3Apr 9Apr 17Apr 24Apr 1May 8May 15May 22May 29May 5Jun US 796 781 796 794 790 790 790 791 790 793 792 772 728 664 602 529 465 408 374 339 318 301 284 Louisiana 58 55 54 54 52 52 52 51 50 52 47 47 44 44 43 41 40 39 38 35 35 35 34
NATIONAL
ADVANCEMONTHLYRETAILINDICATORS
Advance monthly U.S. retail indicators for May 2020. Data
20 Advance Retail Indicators Percent Change from April-20 Percent Change from May-19 Retail & Food Services 17.7% -6.1% Motor Vehicles & Parts 44.1% -3.9% Furniture 89.7% -21.5% Electronics & Applicances 50.5% -29.9% Building Materials 10.9% 16.4% Grocery Stores 1.3% 14.4% Gasoline Stations 12.8% -30.8% Sporting Goods 88.2% 4.9% Nonstore Retailers 9% 30.8%
May
Census, https://www.census.gov/retail/marts/www/marts_current.xls
Source: U.S.
NATIONALECONOMICINDICATORS
Monthly U.S. economic indicators for April 2020.
Data Source: U.S. Census, https://www.census.gov/economic-indicators/.
Indicator Apr-20 Mar-20 Monthly Wholesale Trade 3.0% -1.1% Manufacturers Shipments, Inventories, and Orders -13.0% -11.0% Construction Spending -2.9% 0.0% Advance Monthly Wholesale Inventories 0.4% -1.0% Advance Monthly Retail Inventories -3.6% 1.2% Advance Durable Goods Manf. Shipments, Inventories, and Orders -17.2% -16.6% New Residential Sales 0.6% -13.7% New Residential Construction -30.2% -18.6% Advance Monthly Sales for Retail and Food Services -16.6% -8.3% Durable Goods -17.2% Residential Sales 0.6% Residential Construction -30.2%
THANKYOU
The data presented throughout the CENLA Economic Dashboard reflects contributions from the following local organizations. Also, special thanks to the following partners for distributing the dashboard to its members.
• Rapides Parish Policy Jury Treasurer
• RapidesArea Planning Commission
• City ofAlexandria Planning Division
• Avoyelles Parish School Board
• St. Landry Parish School Board
• Evangeline Parish Sales Tax Commissioner
• Concordia, Catahoula, & La Salle TaxAdministrator
• Alexandria InternationalAirport
• LSUAFoundation
• Central Louisiana Regional Chamber of Commerce
• Marksville Chamber of Commerce
Next Issue: Week of July 6th
• Bunkie Chamber of Commerce
• Evangeline Chamber of Commerce