January 2023


January 2023
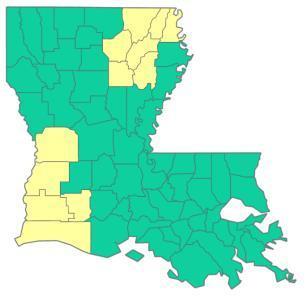
The map of Covid-19 statewide risk is now expanded to show 12 months of transition. Areview of the map shows high risk in a third of the parishes. Covid cases in 2022 in Regions 6 & 7 have been declining with each successive high.April and May had the lowest risk in 2022, follow by the fall months of October - December. All of central Louisiana parishes were at high risk in mid-January, except for Concordia, Evangeline, Vernon which were low risk.
Employment in the Alexandria MSA in November increased by 489 to 63,950 from October, while the unemployment rate fell to 2.5%. Employment in Natchitoches parish increased by 55 to 16,072, while the unemployment rate fell to 3.1%.

The local labor market remained strong in November. TheAlexandria MSA unemployment rate was the lowest among the major metro areas at 2.5%, with Baton Rouge and Lafayette closing the gap at 2.6% and 2.7%. In November, central Louisiana had an unemployment rate of 3.0%, slightly above the state’s rate of 2.9%.
The labor market inAlexandria remained extremely tight in November with the number of unemployed reaching 1,632, the lowest point in 32 years. Rapides has a 2.4% unemployment rate and Natchitoches stood at 3.1%. While continued unemployment claims fell -29% in 2022, from its peak of 17,103 on January 1 to 12,227 at year end, the trend in the second half of 2022 is up which is concerning for employment in 2023.
January 2023
TheAlexandria MSA had a current-dollar GDP of $7.03 billion in 2021 compared to $6.43 billion in 2020, a 9.5% increase. However, real GDP (adjusted for inflation) in theAlexandria MSA was $5.55 billion in 2021 compared to $5.41 billion in 2020, only a 2.6% increase.
Every jurisdictions collected less sales tax in December than November, except for Natchitoches and Vernon which matched the previous month. On a positive note, every jurisdiction was up for the year except for two. Alexandria had no change from 2021 and Concordia was down -15% from the previous year. Sales tax revenue is used as a measure of consumer spending.
Sales tax revenue for Rapides was up 1% for the year, from $169 million in 2021 to $171 million in 2022, but up 31% since 2017.AlthoughAlexandria saw no growth in its sales tax revenue in 2022, revenue is up 22% since 2017. Pineville had the second highest sales tax growth in 2022, up 5% and 12% since 2017. Sales tax revenue in Ball was up 7% in 2022 and 66% since 2017, accounting for the fastest spending growth in Rapides.
Consumer spending on vehicles as measured by tax revenue was either down or showed no growth in five of the six jurisdictions, with Evangeline as the lone exception showing a 1% gain.Aslight downturn was not unexpected after tremendous vehicle sales from 2019 to 2021 when vehicles sales 44% increase. Lodging experienced a difficult year as well, with annual hotel occupancy taxes down -3% in Vernon, -10% in Rapides, and -13% inAvoyelles. Only Natchitoches had a gain for the year, a sizeable 17%.
According to the Louisiana Remote Sellers Commission, 2022 saw $21 million in online sales taxes collected in central Louisiana compared to $17 million in 2021, a 24% increase.
Permit valuation data has been reorganized into a single page. This provides a better overview of permits in Cenla. Unfortunately, permit data from the City ofAlexandria was not available for October so year-end totals are not available. Nevertheless, Avoyelles and Pineville had the highest percentage growth at 36% and 30%, respectively.
Higher mortgage rates continue to put pressure on the housing market. The 30 year fixed mortgage rate, which reached 7.08% on November 10, is impacting new residential construction in theAlexandria MSA as shown in Census Bureau data.
New residential construction permits were in an uptrend from Summer 2020 to Summer 2022. However, the uptrend is in jeopardy as mortgage rates remained high in the second half of 2022.
The weakness in the housing market continues to impact lumber prices. In December 2022, the US Lumber Price Index fell -5% from November. Currently, the Lumber Index stands -25% below a year ago.
Gasoline prices in the Gulf Coast region have fallen from a peak on June 13 of $4.63/gallon to a low of $2.64/gallon on December 19. In December, air passenger traffic remained -7% below December 2019 and -10% below for the year.
New business applications in Louisiana in 2022 fell -20% compared to 2021. The number of new businesses established in Rapides in December 2022 decreased -40% from November and was -33% lower than a year ago. Year-to-date, 399 new businesses have been created in Rapides in 2022, compared to 518 in 2021, representing a -23% decline.
 Central Louisiana Economic Dashboard
COVID-19 statewide risk captured mid-month by parish from February 2022 – January 2023.


February March April
May June July August September October November December January ‘23
COVID-19 cases by collection date from January – December 2022 in Region 6 (Cenla).
Source: Louisiana Department of Health, COVID-19 Dashboard, https://ldh.la.gov/coronavirus, January 1, 2023.

COVID-19 cases by collection date from January - December 2022 in Region 7 (Natchitoches).
Source: Louisiana Department of Health, COVID-19 Dashboard, https://ldh.la.gov/coronavirus, January 1, 2023.
 Central Louisiana Economic Dashboard
Employed persons in the Alexandria MSA from 2020 – 2022.
Employed Persons in Alexandria, LA MSA 2020 - 2022
✓Employment in November increased 489 over October to 63,950.
✓Employment level in November increased by 2,549 over a year ago.
✓Unemployment rate in November in the Alexandria MSAwas 2.5% compared to 2.9% for the state.
Source: Louisiana Workforce Commission, January 19, 2023.
Employed persons in Natchitoches parish from 2020 – 2022.
Employed Persons in Natchitoches 2020-2022
In November 2022, 16,072 were employed in Natchitoches parish, up from 16,017 in October, an increase of 55.
The unemployment rate in Natchitoches parish in November fell to 3.1%.
Source: Louisiana Workforce Commission, January 19, 2023
The table below shows November 2022 preliminary unemployment rate, labor force, and employment data for Metropolitan Statistical Areas in the state.
At 2.5%, the Alexandria MSA unemployment rate in November remained the lowest among the state’s major metro areas.
Louisiana’s unemployment rate in November was 2.9%.
Data Source: Louisiana Workforce Commission, January 8, 2023.
The table below shows November 2022 preliminary unemployment rate, labor force, and employment data for central Louisiana parishes.
In November, parishes in central Louisiana had an unemployment rate of 3.0%, down from 3.1% in October and slightly above to the state’s rate of 2.9%.
Data Source: Louisiana Workforce Commission, January 8, 2023.
Total number in labor force and employed in the Alexandria MSA from 1990 – 2022.
Alexandria MSA Labor Force & Employment Level 1990 - 2022
✓The labor force reached approximately 74,000 in October 2005, the employment level reached 68,000+ in October 2005 and July 2008. ✓The gap between the labor force (blue line) and the employment level (green line) represents unemployed. In 2022, the gap has narrowed.
Source: Louisiana Workforce Commission, January 18, 2023.
Number unemployed in the Alexandria MSA from 1990 – 2022.
Number Unemployed in Alexandria MSA 1990 - 2022
✓The number of unemployed in the Alexandria MSA reached 5,934 in September 2005 with a secondary peak in June 2011 of 5,676. ✓Reached a low of 1,623 in November 2022.
Source: Louisiana Workforce Commission, January 18, 2023.
The graphs below shows the unemployment rate in Rapides from 1990 –2022 and 2016 - 2022.
✓
In November 2022, Rapides had an unemployment rate of 2.4%, down from 3.1% in January 2022 and a peaked at 3.6% for the year in June.
Data Source: Louisiana Workforce Commission, January 8, 2023.
Initial and continued unemployment claims in Louisiana from January 2022 to December 2022.


✓Initial unemployment claims ended 2022 down -6%, falling from 1,636 to 1,543. Initial claims peaked July 16 at 2,879.
✓Continued unemployment claims fell -29% in 2022, from its peak of 17,103 on January 1 to 12,227 at year end.
Source: Louisiana Workforce Commission, January 8, 2023
The table below shows the number of unemployed, number of advertised jobs online, and the ratio of unemployed to advertised job openings online for Metropolitan Statistical Areas in Louisiana in November 2022.
In November 2022, the Alexandria MSAlabor market had a job opening ratio of 0.26, meaning there were four job postings per unemployed.
The state ratio was .50 in November.
The graph below shows the rate of quits in the U.S. from 2000 – 2022 and in Louisiana from 2016 - 2022 as a percentage of total employed.

Quit Rate in Louisiana 2016 - 2022
✓In November 2022, the U.S. had a quit rate of 2.7% compared to 3.4% in Louisiana. Employees are more likely to change jobs when feeling secure about the economy and less likely otherwise.
Data Source: Louisiana Workforce Commission, January 10, 2023.
Central Louisiana Economic Dashboard
An overview of sales, vehicle sales, and hotel occupancy taxes collected in the December 2022 reflecting sales activity in November 2022, unless otherwise noted.
Notes: December tax revenue collection reflects sales activity in November. *Current month data are not available. Represents prior month. N/a = Not available
Data Source noted in detailed reports.
The graph below shows the gross domestic product in the Alexandria MSA from 2000 – 2022 in nominal and inflation-adjusted dollars with 2012 as the base year.

TheAlexandria MSAhad a currentdollar GDP of $7.03 billion in 2021 compared to $6.43 billion in 2020, a 9.5% increase.
Real GDP (adjusted for inflation) in theAlexandria MSAwas $5.55 billion in 2021 compared to $5.41 billion in 2020, only a 2.6% increase.
An overview of annual sales tax revenues in Rapides parish, Alexandria, and Pineville from 2017-2022.
An overview of annual sales tax revenues in rural areas of Rapides parish and Ball from 2017-2022.
2019-21 = 26%
2021-22 = 1%
2019-21 = 53%
2021-22 = 7%
An overview of annual vehicle and lodging sales tax revenues in Rapides parish from 2017-2022.
Data Source: Rapides Parish Police Jury Treasurer’s Reports 2017-2022.


An overview of sales tax revenue collected in other Rapides Parish towns and cities in December 2022 (excluding Alexandria and Pineville).
Note: Current tax revenue reflects sales activity in prior month.


(TR) Alexandria total sales tax revenue collected in December with previous month, year, and YTD comparisons.
(BR) Alexandria total monthly sales tax revenue from 2020 to present.
Note: Current month sales tax revenue reflects sales activity in previous month.
Data Source: Rapides Parish Police Jury Treasurer’s Reports, January 2023.
Avoyelles Parish total sales tax revenue collected in December with previous month, year, and year-to-date comparisons. Vehicle and hotel tax revenues are excluded.
Note: Current sales tax revenue reflects sales activity in the prior month.
Data Source: Avoyelles Parish School Board. January 2023.
Avoyelles Parish vehicle sales tax revenue collected in December with previous month, year, and year-to-date comparisons.
Note: Current sales tax revenue reflects sales activity in the prior month.
Catahoula Parish total sales tax revenue collected in December with previous month, year, and yearto-date comparisons.
YTD
Note: Current month sales tax revenue reflects sales activity in the prior month.
Data Source: Catahoula Parish Tax Administrator, January 2023
Concordia Parish total sales tax revenue collected in December with previous month, year, and year-todate comparisons.
Note: Current month sales tax revenue reflects sales activity in the prior month.
Data Source: Concordia Parish Tax Administrator. January 2023
Evangeline Parish total sales tax revenue collected in December with previous month, year and YTD comparisons.
Note: Current sales tax revenue reflects sales activity in prior month. Evangeline implemented a 1% sales tax increase
Data Source: Evangeline Parish Sales Tax Commissioner. January 2023
1, 2021.
Evangeline Parish vehicle sales tax revenue collected in December with previous month, year and YTD comparisons.
Note: Current sales tax revenue reflects sales activity in prior month. Evangeline implemented a 1% sales tax increase July 1, 2021.
Data Source: Evangeline Parish Sales Tax Commissioner. January 2023
(TR) Grant sales tax revenue collected in December with previous month, year, and YTD comparisons.
(BR) Grant monthly sales tax revenue from 2020 to present.
Note: Current sales tax revenue reflects sales activity in prior month.
Data Source: Grant Parish Sheriff’s Office, January 2023.
La Salle Parish total sales tax revenue collected in December with previous month, year, and year-to-date comparisons.
Note: Current month sales tax revenue reflects sales activity in the previous month.
Data Source: La Salle Parish Tax Administrator, January 2023
(TR) Natchitoches sales tax revenue collected in December with previous month, year, and YTD comparisons.
(BR) Natchitoches monthly sales tax revenue from 2020 to present.
Note: Current month sales tax revenue collections reflects sales activity in the prior month.
Data Source: Natchitoches Parish Tax Commission, January 2023.
(TR) Natchitoches vehicle sales tax revenue collected in November with previous month, year, and YTD comparisons.
(BR) Natchitoches monthly vehicle sales tax revenue from 2020 to present.
Note: Current sales tax revenue collections reflects sales activity in the prior month. *December 2022 vehicle sales tax revenue was not available at time of publication.
Data Source: Natchitoches Parish Tax Commission, January 2023.

(TR) Pineville sales tax revenue collected in December with previous month, year, and YTD comparisons.
(BR) Pineville monthly sales tax revenue from 2020 to present.
Note: Current month sales tax revenue reflects sales activity in the prior month.
Data Source: Rapides Parish Police Jury Treasurer’s Reports, January 2023.
(TR) Rapides Parish sales tax revenue collected in December with previous month, year, and YTD comparisons.
(BR) Rapides monthly sales tax revenue from 2020 to present.
Note: Current sales tax revenue reflects sales activity in the prior month.
Data Source: Rapides Parish Police Jury Treasurer’s Reports, January 2023.
Rapides Parish vehicle sales tax revenue collected in December with previous month, year, and YTD comparisons.
Note: Current sales tax revenue reflects sales activity in the prior month.
Data Source: Rapides Parish Police Jury Treasurer’s Reports, January 2023.
St. Landry Parish sales tax revenue collected in December with previous month, year, and YTD comparisons.
Note: Current sales tax revenue collection reflects sales activity in prior month.
Data Source: Tax revenue data from St. Landry Parish School Board. January 2023
St. Landry Parish vehicle sales tax revenue collected in December with previous month, year, and YTD comparisons.
Note: Current sales tax revenue reflects sales activity in prior month.
Data Source: Tax revenue data from St. Landry Parish School Board. January 2023
Vernon Parish sales tax revenue collected in December with previous month, year, and year-to-date comparisons.
Data Source: Vernon Parish Sales Tax Department. January 2023.
Vernon Parish vehicle tax revenue collected in December with previous month, year, and year-to-date comparisons. Data Source: Vernon Parish Sales Tax Department. January 2023.
Remote sellers tax revenue by parish with month-over-month, year-over-year, and year-to-date comparisons.
Total online sales tax revenue in Cenla in
2022 is up 69% from a month earlier and up 2% from December 2021.
YTD online sales tax revenue are up 24% in central Louisiana.
Note: Sales tax revenue collected in the current month reflects sales activity in the prior month.
Data Source: Louisiana Sales and Use Tax Commission for Remote Sellers.August 2020 – January 2022
Remote seller tax revenue is tax revenue from online sales by location of the seller at the time of purchase.
Remote Sellers Sales Tax Collection in Cenla
August 2020 - December 2022
✓2022 saw $21 million in online sales taxes collected in Cenla compared to $17 million in 2021, a 24% increase.
✓SinceAugust 2020 when remote sellers tax revenue collection started, $43 million in sales tax revenue have been collected from online sales in central Louisiana.
Note: Sales tax revenue collected in the current month reflects sales activity in the prior month.
Data Source: Louisiana Sales and Use Tax Commission for Remote Sellers.August 2020 – December 2022
Remote sellers tax revenue from online sales in Evangeline Parish from August 2020 – December 2022.

August 2020 - December 2022
Note: Sales tax revenue collected in the current month reflects sales activity in the prior month.
Data Source: Louisiana Sales and Use Tax Commission for Remote Sellers.August 2020 – December 2022
Remote sellers tax revenue from online sales in Natchitoches Parish from August 2020 – December 2022.
Note: Sales tax revenue collected in the current month reflects sales activity in the prior month.
Data Source: Louisiana Sales and Use Tax Commission for Remote Sellers.August 2020 – December 2022

Remote sellers tax revenue from online sales in Rapides Parish from August 2020 – December 2022.
Note: Sales tax revenue collected in the current month reflects sales activity in the prior month.
Data Source: Louisiana Sales and Use Tax Commission for Remote Sellers.August 2020 – December 2022
 Central Louisiana Economic Dashboard
This table shows the valuation of permits issued in December for select jurisdictions of Rapides Area Planning Commission, the City of Alexandria, the City of Natchitoches, and Natchitoches Parish with month-to-month, year-toyear, and year-to-date comparisons.
Note: n/a = not available. Data was incomplete for City ofAlexandria in October 2022.
Data Source: RapidesArea Planning Commission, City ofAlexandria and Natchitoches, Natchitoches Parish, January 2023.
30-Year Fixed Rate Mortgage Average in the United States from 1971 – 2023 and from 2019 – 2023.
30 Yr Fixed Mortgage Rate 1971 - 2023
30 Yr Fixed Mortgage Rate 2019 - 2023
▪ 30 year fixed mortgage rates this year peaked in 2022 the week of November 10 at 7.08%.
Data Source: Fed Reserve Economic Database, St. Louis Federal Reserve Bank, January 21, 2023.
The chart represents the Lumber Price Index in the U.S. from January 2020 – December 2022.
Monthly Price Index of Lumber 2020 - 2022
▪ In December 2022, the US Lumber Price Index fell -5% to 262 from 274 in November. ▪ Currently, the Lumber Index stands -25% below a year ago.
Data Source: Fed Reserve Economic Database, St. Louis Federal Reserve Bank, January 18, 2023.
The chart represents the number of permits issued for new residential units in the Alexandria MSA from 2012-2022.
New Residential Construction
Alexandria MSA 2012 - 2022
✓
New residential construction permits were in an uptrend from Spring 2020 to Spring 2022. ▪ Permits for housing experienced a downtrend from 2012-2015 and leveled off from 2016-2019, before trending up in 2020.
The uptrend is in jeopardy as mortgage rates have risen.
Data Source: U.S. Census Bureau, Monthly Construction by MSA, January 18, 2023.
The count of active single-family and condo/townhome listings from January 2019- December 2022 for Alexandria, Fort Polk (Leesville), Natchitoches, and Opelousas.
The median number of days property listings spend on the market from January 2019 – December 2022 for Alexandria, Fort Polk (Leesville), Natchitoches, and Opelousas.
The median listing price of houses from January 2019 - December 2022 for Alexandria, Fort Polk (Leesville), Natchitoches, and Opelousas.
The average listing price of houses from January 2019 - December 2022 for Alexandria, Fort Polk (Leesville), Natchitoches, and Opelousas.
Central Louisiana Economic Dashboard
Avoyelles Parish hotel occupancy tax revenue for December with previous month, year, and year-to-date comparisons.
Note: Current tax revenue reflects hotel occupancy activity in the prior month. Hotel occupancy tax revenue is used as a proxy for hotel occupancy rate.
Data Source: Avoyelles Parish School Board. January 2023.
Natchitoches Parish hotel occupancy tax revenue for December with previous month, year, and YTD comparisons.
Note: Current tax revenue reflects hotel occupancy activity in the prior month. Hotel occupancy tax revenue is used as a proxy for hotel occupancy rate.
Data Source: Natchitoches Parish Tax Administrator, January 2023.
Rapides Parish hotel occupancy tax revenue for December with previous month, year, and YTD comparisons.
Note: Current tax revenue reflects hotel occupancy activity in the prior month. Hotel occupancy tax revenue is used as a proxy for hotel occupancy rate.
Data Source: Rapides Parish Police Jury Treasurer’s Reports, January 2023.
Vernon Parish hotel, motel, and RV occupancy tax revenue for December with previous month, year, and year-to-date comparisons.
Note: Current tax revenue collection reflects hotel occupancy activity in the prior month. Hotel occupancy tax revenue is used as a proxy for hotel occupancy rate.
Data Source: Vernon Parish Sales Tax Department. January 2023.

Nationally, air passenger traffic in December 2022 decreased -1.3% from the previous month.
In December, air passenger traffic remained -7% below the December 2019 level.
U.S. air passenger traffic in 2022 was down -10.3% from 2019.
Nationwide daily percentage of passengers passing through current TSA checkpoints in 2022 expressed as a percentage of traffic in 2019. Data
U.S. Airport Passenger Throughput Traffic in 2022 as a Percent of Traffic from 2019

Weekly retail price of gasoline in the Gulf Coast region for all formulations from 2020 - 2022.
Weekly Retail Gasoline Price All Formulations in Gulf Coast Region 2020-2022
▪ Gasoline peaked on June 13 at $4.63 a gallon. The low of 2022 was December 19 at 2.64.
December 2022 average retail gasoline price in Gulf Coast region was $2.71/gal., down 35 cents from November and 9% lower than a year ago.
Data Source: U.S. Energy Information Administration, Prices, Sales Volumes & Stocks by State, January 21, 2023
Central Louisiana Economic Dashboard
The chart below represents the monthly number of new businesses applications in Louisiana from 2020-2022 (seasonally adjusted).
Note: Data reflects businesses applications, not necessarily business formations.
Data Source: U.S. Census Bureau, Business Formation Statistics, Retrieved January 21, 2023.
The table and chart below represent the number of new businesses established each month in Rapides from January 2020 through December 2022.


The number of new businesses established in Rapides in December 2022 decreased -40% from November and was -33% lower than a year ago.
Year-to-date, 399 new businesses have been created in Rapides in 2022, compared to 518 in 2021, representing a -23% decline.
Note: Data reflects businesses established in the current month.
Rapides Parish occupational license revenue YTD with previous YTD comparisons.
Note: Rapides Parish reflects unincorporated areas. Data reflects licenses paid year-to-date.
Data Source: Rapides Parish Police Jury Treasurer’s Reports, January 2023.
The Coincident Economic Activity Index for Louisiana is set to match the trend in the gross state product and includes four indicators: nonfarm payroll employment, the unemployment rate, average hours worked in manufacturing and wages and salaries. The column graph below represents the percentage change in the index. A positive percentage represents an expanding statewide economy.
In November 2022, the Index rose to 110.28, compared to 110.14 in October 2022.
The Index is up 2.8% since January 2022.
Represents the number of drilling rigs actively exploring for or developing oil or natural gas in Louisiana and the U.S. in 2020-2022.


Average rig count in Louisiana in December was down three rigs from November and up 17 rigs from a year ago, an increase of 38%.
Nationwide, the rig count rose from 579 a year ago to 780 in December, an increase of 35%.
Source: Baker Hughes, https://rigcount.bakerhughes.com/na-rig-count, January 17, 2023
Gaming revenue in Louisiana for November 2022 with previous month and year comparisons.
November 2022
* Note: Year-to-Date percentage reflects calendar year.
Data Source: Louisiana Gaming Control Board, November 20, 2022. http://lgcb.dps.louisiana.gov/revenue_reports.html
The data presented throughout the CENLA Economic Dashboard reflects contributions from the following local organizations.
Also, special thanks to the following partners for distributing the dashboard.
• Rapides Parish Policy Jury Treasurer
• Rapides Sales TaxAdministrator
• Avoyelles Parish School Board
• Alexandria International Airport
• Alexandria / Pineville Area CVB
• RapidesArea Planning Commission
• City ofAlexandria Planning Division
• Evangeline Parish Sales Tax Commissioner
• Concordia, Catahoula, & La Salle Tax Administrator
• Louisiana Office of Public Health
• St. Landry Parish School Board
• Grant Parish Sheriff’s Office
• Natchitoches Parish Tax Commission
• Natchitoches Parish Planning and Zoning
• City of Natchitoches Planning
• Vernon Parish Sales Tax Department
• LSUAFoundation
• Central Louisiana Regional Chamber of Commerce
• Marksville Chamber of Commerce
• Bunkie Chamber of Commerce
• Evangeline Chamber of Commerce
• Concordia Chamber of Commerce
• Greater Vernon Chamber of Commerce
• Natchitoches Chamber of Commerce
• Next Issue: Week of March 20, 2023
