September 23, 2022


September 23, 2022
September 23, 2022 COVID
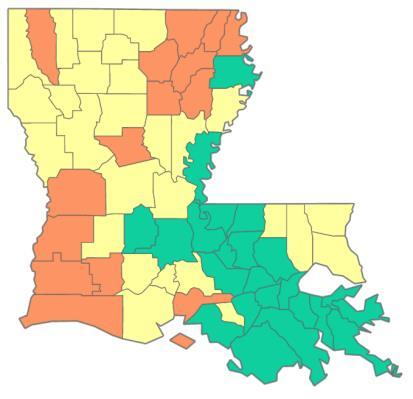
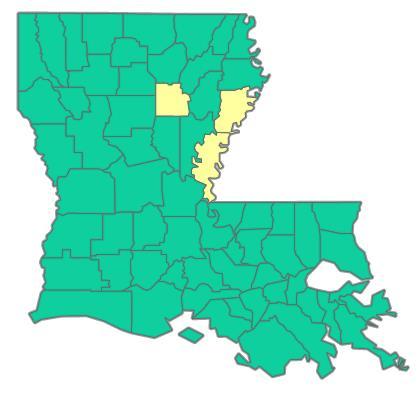
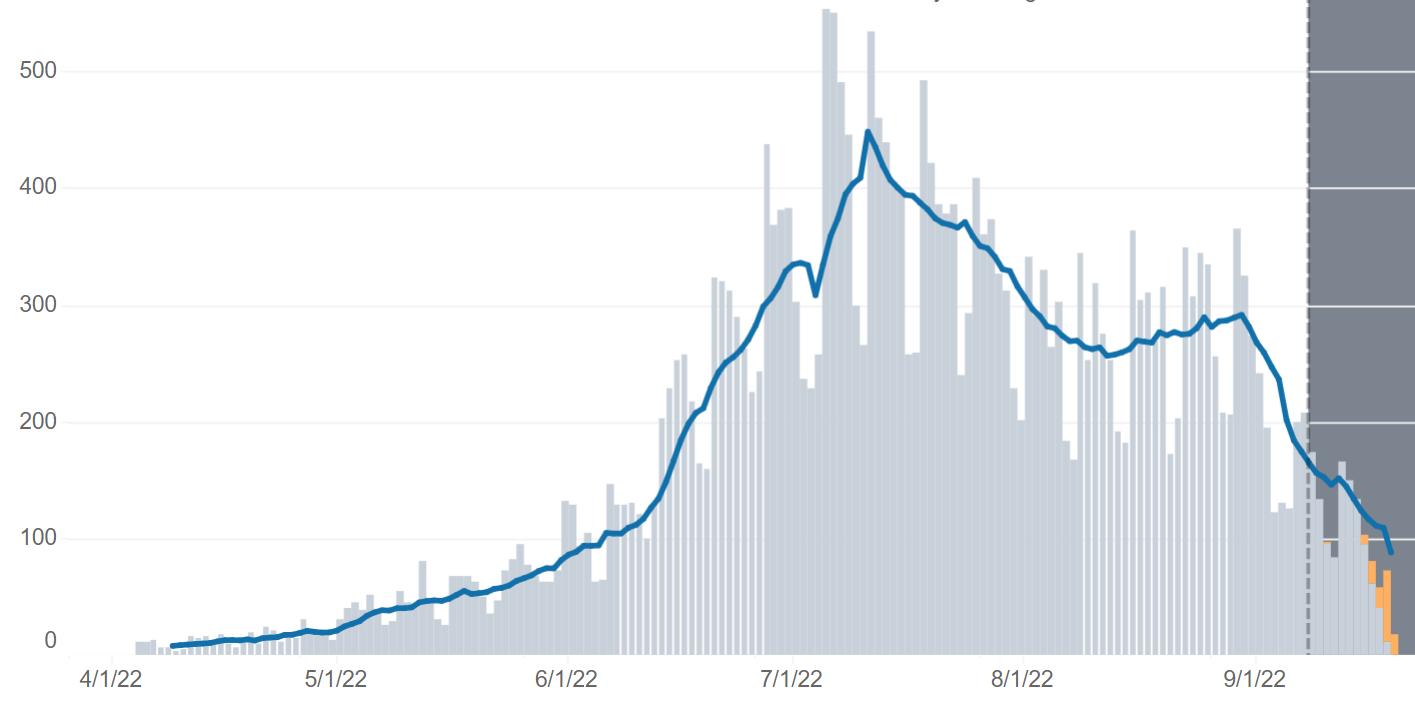
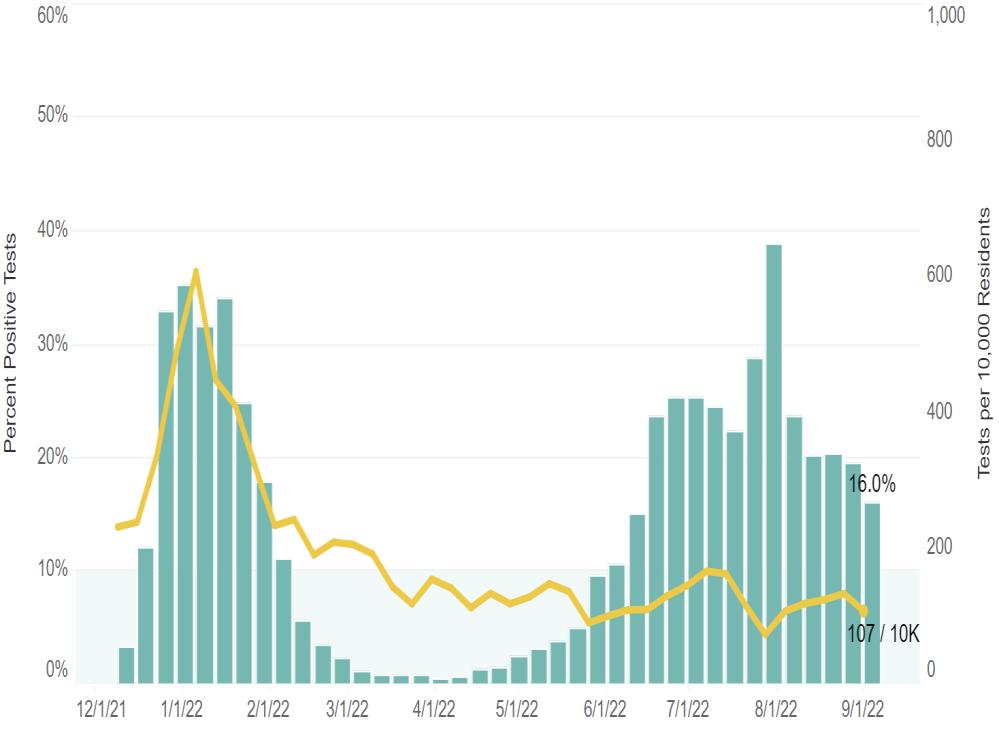
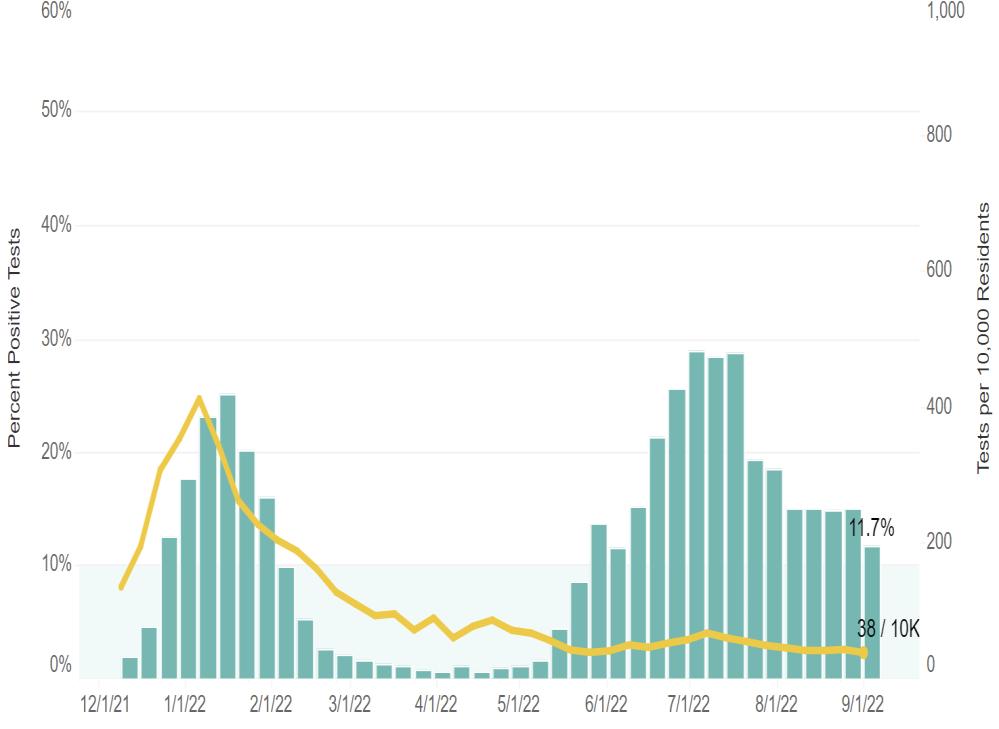
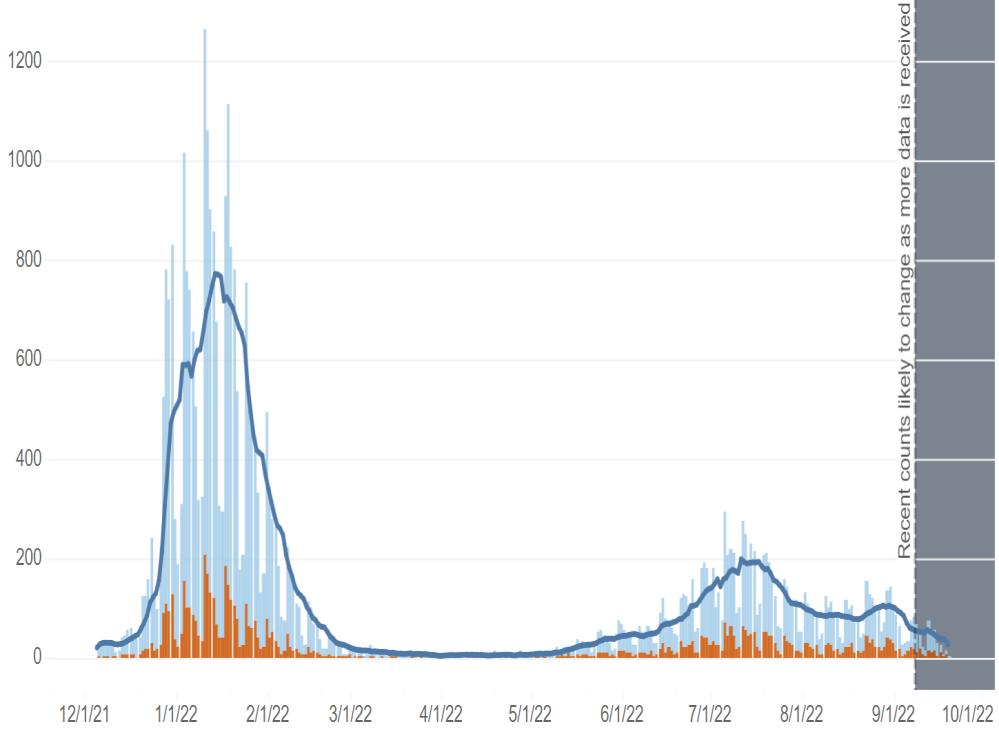
Covid cases in Regions 6 & 7 have been declining since its peak in early July. Nearly all of central Louisiana is considered at medium risk for Covid, except for Grant and Vernon which remain high. Individuals aged 18-29 experienced the most cases early in the recent wave which began in late June. However, 50-59 year-olds were infected the most in a secondary surge from mid-August to early-September. Of those being tested, the percent of positive cases in both regions exceeded the December / January surge.
Employment has remained relatively strong throughout the summer with the June employment level revised upward, while July’s employment of 63,763 was the second highest post-pandemic.
The labor market remains strong despite the possibility of a slowdown from rising interest rates. TheAlexandria MSAunemployment rate remained at 3.6% in July, unchanged from the previous month and is still the lowest among the state’s metro areas for the past two years. Natchitoches’ unemployment rate remained unchanged in July at 4.9%.
The tight labor market inAlexandria became even tighter this summer as the number of unemployed dropped 2.5% in July from a month earlier, while the number of job postings increased 30%. Job postings increased throughout the state as employers posted openings in multiple cities in search of workers. Currently, there are four postings for each unemployed inAlexandria in comparison to the state with four postings for three unemployed.

September 23, 2022
Further evidence that the labor market in Louisiana is remaining strong for now is the reversal in initial and continued unemployment claims. Since March, initial unemployment insurance claims have been trending upward, more than doubling in the period through late July. The upward trend in continued claims began in May. However, initial claims reversed inAugust, falling -17%, while continued claims which normally lag have begun to fall as well.
While employment has remained strong, consumer spending was mixed in July according to taxes collected in August. Of the twelve jurisdictions reporting, half reported gains over the previous month and all but one report yearto-date gains. Natchitoches and La Salle are leading in terms of percentage of consumer spending growth. Vehicles sales as measured by sales tax revenue reports a different picture for the region. Monthly and year-to-date spending on vehicles are down overall.
Online sales in Cenla are rising faster than brick-and-mortar sales in terms of percentage growth. While August online sales tax collections showed a 1% decline in July activity, sales were 18% higher than a year ago and year-todate are running 14% ahead of last year.
Higher mortgage rates are putting pressure on the housing market. The 30 year fixed mortgage rate is now included in the CENLA Economic Dashboard. In September, the 30 year rate exceeded it’s old peaked of 5.81% set on
September 23, 2022
June 23.After declining to 5.18% as ofAugust 18, it established a new peak of 6.02% on September 15 with the likelihood of further hikes in the future.
Lumber prices inAugust reflect the slowdown in housing. Prices fell 3% inAugust but remain 10% higher than a year ago.Active listings in August were upAlexandria, Leesville, and Opelousas indicating an increase in supply. The median days a house stays on the market remains historically low.
Gasoline prices have fallen from a peak on June 13 of $4.63/gallon to $3.13/gallon on September 12, a 32% decline. Summer is vacation season, but occupancy at area hotels are slightly down so far this year, except for Natchitoches which is up 26% YTD.
While August is normally a busy month for travel, U.S. air passenger traffic was down -4% inAugust from July and -9% below a year ago. Year-to-date, passenger traffic in 2022 is -12% below the 2019 level, the year used for benchmarking.
New business applications in Louisiana inAugust 2022 increased 28% from the previous month. In the first eight months, nearly 60,000 business applications were filed in Louisiana, down -16% from a year ago. Likewise, the number of new businesses established in Rapides inAugust 2022 fell -16% from July and -50% from a year ago. 2021. Year-to-date, 281 new businesses have been created in Rapides in 2022, compared to 369 in 2021.
 Central Louisiana Economic Dashboard
February 16, 2022
March 18, 2022
April 16, 2022
May 19, 2022
June 20, 2022
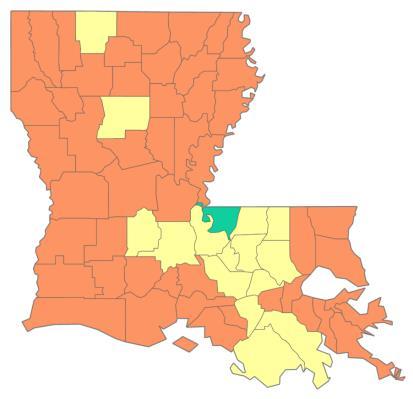
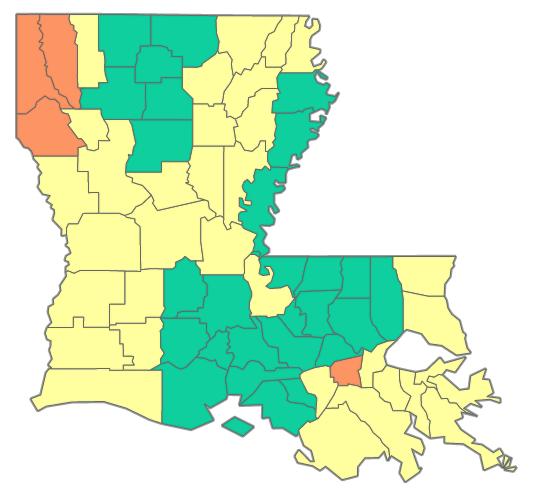
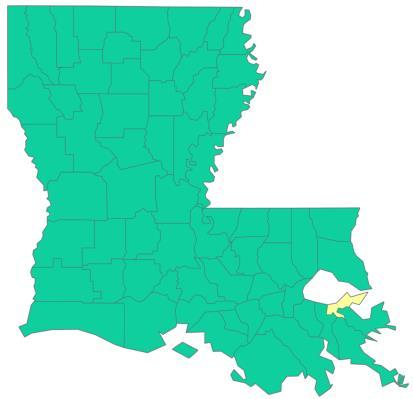
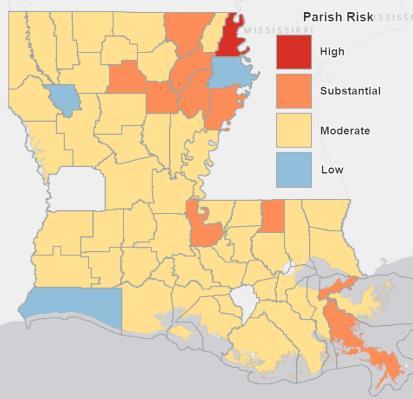
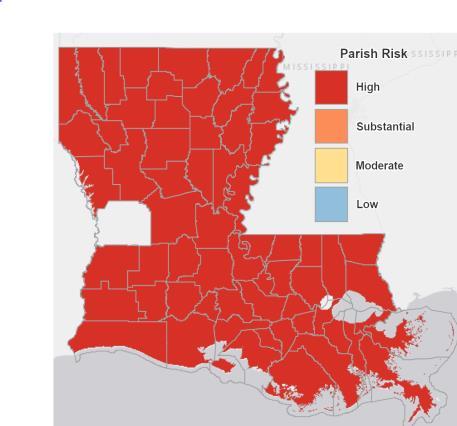
COVID-19 statewide risk by parish over time. Source: Louisiana Office of Public Health, September 21, 2022.

July 19, 2022
August 21, 2022
September 20, 2022
COVID-19 cases by collection date from April 4 – September 21, 2022 in Region 6 (Cenla).
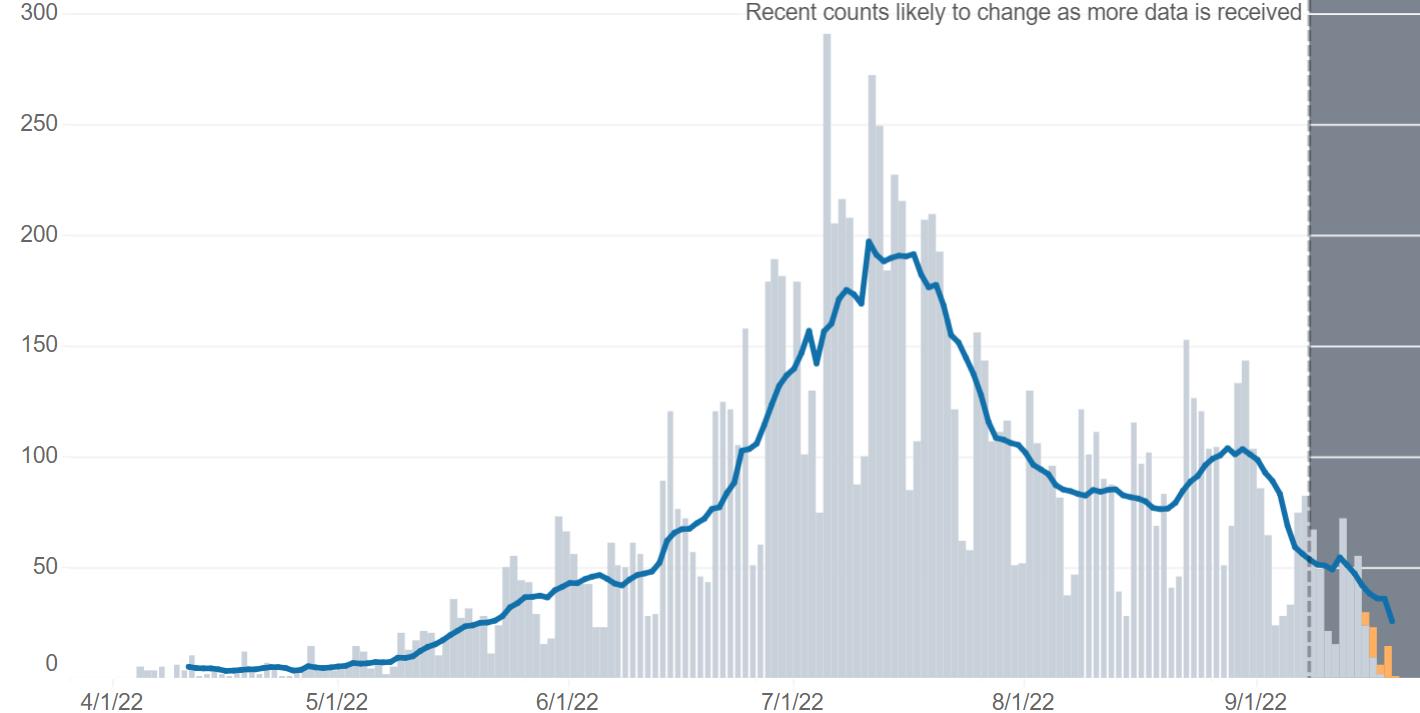
Source: Louisiana Department of Health, COVID-19 Dashboard, https://ldh.la.gov/, September 21, 2022.
COVID-19 cases by collection date from April 4 – September 21, 2022 in Region 7 (Natchitoches).
Source: Louisiana Department of Health, COVID-19 Dashboard, https://ldh.la.gov/, September 21, 2022.
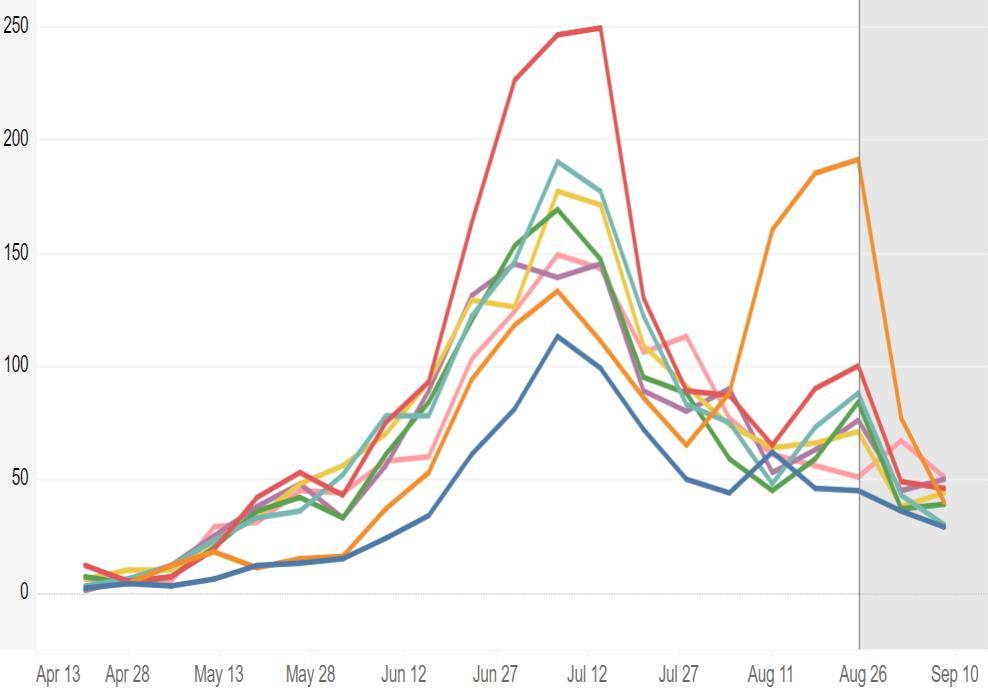
Cumulative cases by age range by week of test collection in Region 6 and Region 7 from April 15 to September 20, 2022.
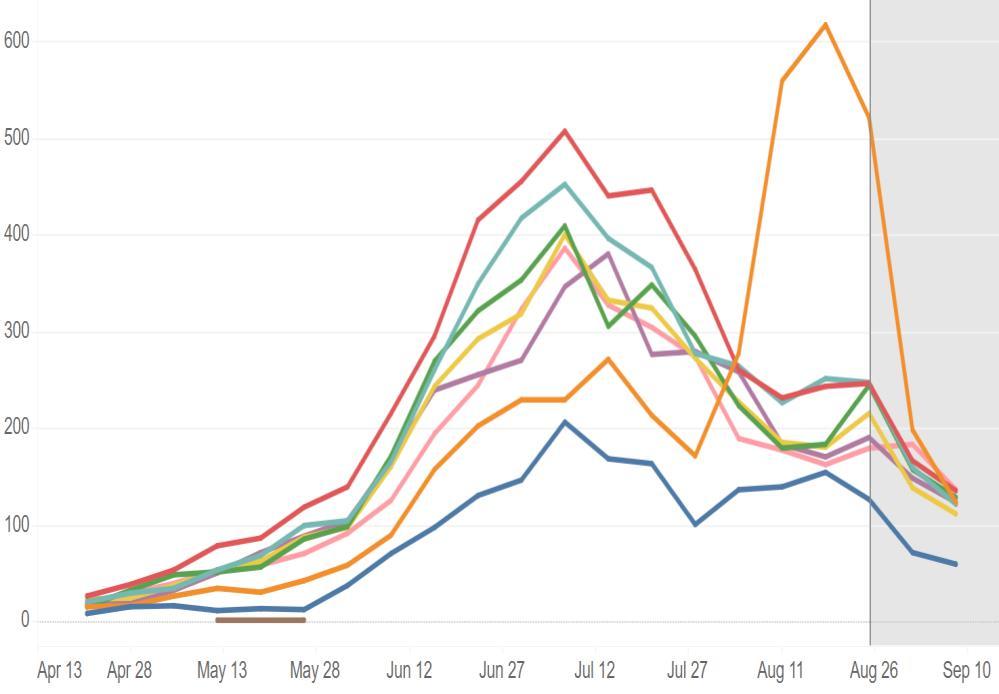
Central LA (Region 6)
Source: Louisiana Department of Health, COVID-19 Dashboard, https://ldh.la.gov/, September 20, 2022.
Natchitoches (Region 7)
COVID-19 percent positive and test volume in Region 6 (Cenla) and Region 7 (Natchitoches) from December 1, 2021 – September 20, 2022.
Central LA (Region 6)
Source: Louisiana Department of Health, COVID-19 Dashboard, https://ldh.la.gov/, September 20, 2022.
Natchitoches (Region 7)
COVID-19 initial infections (blue) and reinfections (orange) for Regions 6 & 7 from December 2, 2021 – September 20, 2022.
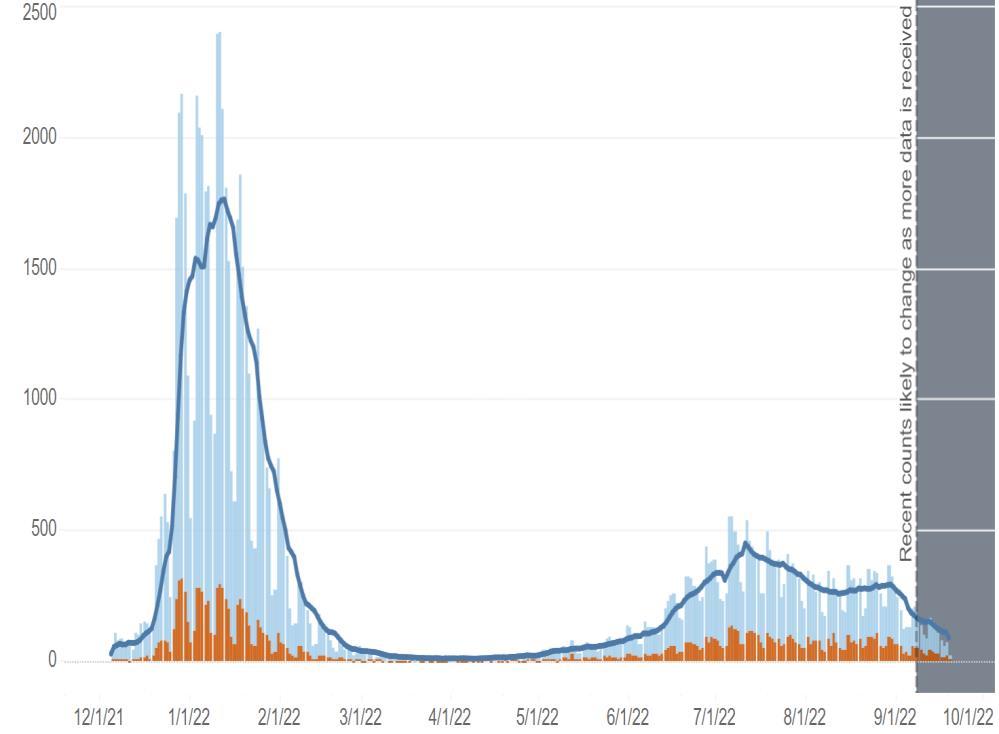
Central LA (Region 6)
Source: Louisiana Department of Health, COVID-19 Dashboard, https://ldh.la.gov/, September 20, 2022.
Natchitoches (Region 7)
Central Louisiana Economic Dashboard
Employed persons in the Alexandria MSA from 2020 – 2022.
Employed Persons in Alexandria, LA MSA 2020 - 2022
✓In July 2022, 63,763 were employed in the Alexandria metro area, a decrease of 82 from June. ✓Unemployment in Alexandria MSA remained unchanged from June at 3.6%.
Source: Louisiana Workforce Commission, September 19, 2022
Employed persons in Natchitoches parish from 2020 – 2022.
Employed Persons in Natchitoches 2020-2022
In July 2022, 15,291 were employed in Natchitoches parish, down from 15,376 in June.
The unemployment rate in Natchitoches parish in July remained unchanged from June at 4.9%.
Source: Louisiana Workforce Commission, September 19, 2022
Initial and continued unemployment claims in Louisiana from January 2022 to August 2022.
✓Initial unemployment claims decreased for the first time in six months. The average weekly initial unemployment claims filed inAugust decreased -17% from July.
✓Statewide average weekly continued unemployment claims filed inAugust fell -0.3% a month earlier, reversing an uptrend that started in May.
Source: Louisiana Workforce Commission, September 19, 2022
Unemployment Claims in Louisiana in 2022


The table below shows July 2022 preliminary unemployment rate, labor force, and employment data for central Louisiana parishes.
In July, parishes in central Louisiana had an unemployment rate of 4.5%, down from 4.6% in June and below the state’s rate of 4.6%.
Data Source: Louisiana Workforce Commission, September 19, 2022.
The table below shows July 2022 preliminary unemployment rate, labor force, and employment data for Metropolitan Statistical Areas in the state.
At 3.6%, theAlexandria MSAunemployment rate in July remained unchanged and still the lowest among the state’s major metro areas.
Likewise, Louisiana’s unemployment rate in July remained unchanged from June at 4.6%.
✓The state’s unemployment rate for August fell to 3.8%. August MSAdata are not yet available.
Data Source: Louisiana Workforce Commission, September 19, 2022.
July 2022
The table below shows the number of unemployed, number of advertised jobs online, and the ratio of unemployed to advertised job openings online for Metropolitan Statistical Areas in Louisiana in July 2022.
July 2022
In July 2022, the Alexandria MSAlabor market had a job opening ratio of 0.26 compared to .34 in June.
TheAlexandria MSAlabor market tightened again to four job openings per unemployed.
The state ratio fell from 0.73 in June, to 0.58 in July.
The tables below shows employers with the highest number of job openings advertised online on September 19, 2022.
Central Louisiana Economic Dashboard
An overview of sales, vehicle sales, and hotel occupancy taxes collected in the August 2022 reflecting sales activity in July 2022, unless otherwise noted.
August 2022
Notes: August tax revenue reflects sales activity in July. * Current month data are not available. Represents prior month. N/a = Not available
Data Source noted in detailed reports.


An overview of sales tax revenue collected in other Rapides Parish towns and cities in August 2022 (excluding Alexandria and Pineville).
Note: Current tax revenue reflects sales activity in prior month.
Data Source: Rapides Parish Police Jury Treasurer’s Reports, September 2022.


(TR) Alexandria total sales tax revenue collected in August with previous month, year, and YTD comparisons.
(BR) Alexandria total monthly sales tax revenue from 2020 to present.
Note: Current month sales tax revenue reflects sales activity in previous month.
Data Source: Rapides Parish Police Jury Treasurer’s Reports, September 2022.
Avoyelles Parish total sales tax revenue collected in August with previous month, year, and year-to-date comparisons. Vehicle and hotel tax revenues are excluded.
Note: Current sales tax revenue reflects sales activity in the previous month.
Data Source: Avoyelles Parish School Board. September 2022.
Avoyelles Parish vehicle sales tax revenue collected in August with previous month, year, and year-to-date comparisons.
Note: Current sales tax revenue reflects sales activity in the previous month.
Data Source: Avoyelles Parish School Board. September 2022
Catahoula Parish total sales tax revenue collected in August with previous month, year, and year-todate comparisons.
Note: Current month sales tax revenue reflects sales activity in the previous month.
Data Source: Catahoula Parish Tax Administrator, September 2022
Concordia Parish total sales tax revenue collected in August with previous month, year, and year-to-date comparisons.
Note: Current month sales tax revenue reflects sales activity in the previous month.
Data Source: Concordia Parish Tax Administrator. September 2022
Evangeline Parish total sales tax revenue collected in August with previous month, year and YTD comparisons.
Note: Current sales tax revenue reflects sales activity in previous month. Evangeline implemented a 1% sales tax increase
Data Source: Evangeline Parish Sales Tax Commissioner. September 2022
Evangeline Parish vehicle sales tax revenue collected in August with previous month, year and YTD comparisons.
Note: Current sales tax revenue reflects sales activity in previous month. Evangeline implemented a 1% sales tax increase July 1, 2021.
Data Source: Evangeline Parish Sales Tax Commissioner. September 2022
(TR) Grant sales tax revenue collected in August with previous month, year, and YTD comparisons.
(BR) Grant monthly sales tax revenue from 2020 to present.
Note: July sales tax revenue reflects sales activity in June.
Data Source: Grant Parish Sheriff’s Office, September 2022.
La Salle Parish total sales tax revenue collected in August with previous month, year, and year-to-date comparisons.
Note: Current month sales tax revenue reflects sales activity in the previous month.
Data Source: La Salle Parish Tax Administrator, September 2022
(TR) Natchitoches sales tax revenue collected in August with previous month, year, and YTD comparisons.
(BR) Natchitoches monthly sales tax revenue from 2020 to present.
Note: July sales tax revenue reflects sales activity in June.
Data Source: Natchitoches Parish Tax Commission, September 2022.
(TR) Natchitoches vehicle sales tax revenue collected in July with previous month, year, and YTD comparisons.
(BR) Natchitoches monthly vehicle sales tax revenue from 2020 to present.
Note: June sales tax revenue reflects sales activity in May. *July 2022 vehicle sales tax revenue was not available at time of publication.
Data Source: Natchitoches Parish Tax Commission, September 2022.

(TR) Pineville sales tax revenue collected in August with previous month, year, and YTD comparisons.
(BR) Pineville monthly sales tax revenue from 2020 to present.
Note: Current month sales tax revenue reflects sales activity in the prior month.
Data Source: Rapides Parish Police Jury Treasurer’s Reports, September 2022.
(TR) Rapides Parish sales tax revenue collected in August with previous month, year, and YTD comparisons.
(BR) Rapides monthly sales tax revenue from 2020 to present.
Note: Current sales tax revenue reflects sales activity in the prior month.
Data Source: Rapides Parish Police Jury Treasurer’s Reports, September 2022.
Rapides Parish vehicle sales tax revenue collected in August with previous month, year, and YTD comparisons.
Note: Current sales tax revenue reflects sales activity in the prior month. Sales tax revenue for July &August in 2022 and 2021 are apportioned equally.
Data Source: Rapides Parish Police Jury Treasurer’s Reports, September 2022.
St. Landry Parish sales tax revenue collected in August with previous month, year, and YTD comparisons.
Note: Current sales tax revenue reflects sales activity in prior month.
Data Source: Tax revenue data from St. Landry Parish School Board. September 2022
St. Landry Parish vehicle sales tax revenue collected in August with previous month, year, and YTD comparisons.
Note: Current sales tax revenue reflects sales activity in prior month.
Data Source: Tax revenue data from St. Landry Parish School Board. September 2022
Vernon Parish sales tax revenue collected in August with previous month, year, and year-to-date comparisons.
Data Source: Vernon Parish Sales Tax Department. September 2022.
Vernon Parish vehicle tax revenue collected in August with previous month, year, and year-to-date comparisons.
Data Source: Vernon Parish Sales Tax Department. September 2022.
Remote seller tax revenue by parish with month-over-month, year-over-year, and year-to-date comparisons.
Total online sales tax revenue in Cenla in August 2022 fell -1% from a month earlier but is up 18% from August 2021. ✓YTD online sales are up 14% in central Louisiana.
Note: Sales tax revenue collected inApril reflects sales activity in March.
Data Source: Louisiana Sales and Use Tax Commission for Remote Sellers.August 2020 – September 2022
Remote seller tax revenue is tax revenue from online sales by location of the seller at the time of purchase.
✓The first eight months of 2022 saw $12.4 million in online sales taxes collected in Cenla compared to $10.9 million in 2021, a 14% increase.
SinceAugust 2020 when remote sellers tax revenue collection started, $34.3 million in sales tax revenue have been collected from online sales in central Louisiana.
Note: Sales tax revenue collected in May reflects sales activity inApril.
August 2020 - August 2022
Data Source: Louisiana Sales and Use Tax Commission for Remote Sellers.August 2020 – September 2022
Remote sellers tax revenue from online sales in Avoyelles Parish from August 2020 – August 2022.
Note: Sales tax revenue collected in one month reflects sales activity in the prior month.
Data Source: Louisiana Sales and Use Tax Commission for Remote Sellers.August 2020 – September 2022

Remote sellers tax revenue from online sales in Evangeline Parish from August 2020 – August 2022.
Note: Sales tax revenue collected in one month reflects sales activity in the prior month.
Data Source: Louisiana Sales and Use Tax Commission for Remote Sellers.August 2020 – September 2022

Remote sellers tax revenue from online sales in Natchitoches Parish from August 2020 – August 2022.
Note: Sales tax revenue collected in one month reflects sales activity in the prior month.
Data Source: Louisiana Sales and Use Tax Commission for Remote Sellers.August 2020 – September 2022

Remote sellers tax revenue from online sales in Rapides Parish from August 2020 – August 2022.
Note: Sales tax revenue collected in one month reflects sales activity in the prior month.
Data Source: Louisiana Sales and Use Tax Commission for Remote Sellers.August 2020 – September 2022
 Central Louisiana Economic Dashboard
The valuation (estimated development cost) of new commercial construction permits issued by the City of Alexandria in August 2022 with previous month, year, and YTD comparisons.
The valuation (estimated development cost) of new residential construction permits issued by the City of Alexandria in August 2022 with previous month, year, and YTD comparisons.
This chart shows the valuation of permits issued by Rapides Area Planning Commission in Avoyelles Parish in August between 2019-2022 with month-to-month, year-to-year, and year-to-date comparisons.
Data Source: RapidesArea Planning Commission, September 2022.
This chart shows the valuation of permits issued by Rapides Area Planning Commission in Evangeline Parish in August between 2019-2022 with month-to-month, year-to-year, and year-to-date comparisons.
Data Source: RapidesArea Planning Commission, September 2022.
This table below shows the valuation of permits issued by the City of Natchitoches Planning and Zoning Office between 2019 – 2022 with month-to-month, year-to-year, and year-to-date comparisons.
Data Source: City of Natchitoches Planning and Zoning Office, September 2022.
This table and chart shows the valuation of permits issued by Natchitoches Parish Permit Office between 2021 – 2022 with month-to-month, year-to-year, and year-todate comparisons.
Data Source: Natchitoches Parish Permit Office, September 2022.
This chart shows the valuation of permits issued by Rapides Area Planning Commission in the City of Pineville in August between 2019-2022 with month-to-month, year-to-year, and year-to-date comparisons.
Data Source: RapidesArea Planning Commission, September 2022.
This charts shows the valuation of permits issued by Rapides Area Planning Commission in Rapides Parish (excluding Alexandria) in August between 2019-2022 with month-to-month, year-to-year, and year-to-date comparisons.
Data Source: RapidesArea Planning Commission, September 2022.
Central Louisiana Economic Dashboard
30-Year Fixed Rate Mortgage Average in the United States from 1971 – 2022 and from 2019 – 2022.
▪ 30 year fixed mortgage rates this year peaked the week of September 15 at 6.02%.
Data Source: Fed Reserve Economic Database, St. Louis Federal Reserve Bank, September 15, 2022.
The chart represents the Lumber Price Index in the U.S. from January 2020 – August 2022.
Monthly Price Index of Lumber 2020 - 2022
▪ InAugust 2022, the US Lumber Price Index fell -3% to 312 from 322 in July.
▪ Currently, the Lumber Index stands 10% above a year ago.
Data Source: Fed Reserve Economic Database, St. Louis Federal Reserve Bank, September 16, 2022.
The count of active listings, median days on the market, average listing price, and median listing price for the Alexandria MSA for August 20192022 with month-to-month and year-over-year comparisons.
The count of active listings, median days on the market, average listing price, and median listing price for the Ft. Polk / Leesville market for August 2019-2022 with month-to-month and year-over-year comparisons.
The count of active listings, median days on the market, average listing price, and median listing price for the Natchitoches market for August 2019-2022 with month-to-month and year-over-year comparisons.
The count of active single-family and condo/townhome listings from 2019-2022 for Alexandria, Fort Polk (Leesville), Natchitoches, and Opelousas.
The median number of days property listings spend on the market from 2019-2022 for Alexandria, Fort Polk (Leesville), Natchitoches, and Opelousas.
The median listing price of houses from 2019-2022 for Alexandria, Fort Polk (Leesville), Natchitoches, and Opelousas.
The average listing price of houses from 2019-2022 for Alexandria, Fort Polk (Leesville), Natchitoches, and Opelousas.
Central Louisiana Economic Dashboard
Avoyelles Parish hotel occupancy tax revenue for August with previous month, year, and year-to-date comparisons.
Note: Current tax revenue reflects hotel occupancy activity in the previous month. Hotel occupancy tax revenue is used as a proxy for hotel occupancy rate.
Data Source: Avoyelles Parish School Board. September 2022.
Natchitoches Parish hotel occupancy tax revenue for August with previous month, year, and YTD comparisons.
Note: July tax revenue reflects hotel occupancy activity in June. Hotel occupancy tax revenue is used as a proxy for hotel occupancy rate.
Data Source: Natchitoches Parish Tax Administrator, September 2022.
Rapides Parish hotel occupancy tax revenue for August with previous month, year, and YTD comparisons.
Note: Current tax revenue reflects hotel occupancy activity in previous month. Hotel occupancy tax revenue is used as a proxy for hotel occupancy rate.
Data Source: Rapides Parish Police Jury Treasurer’s Reports, September 2022.
Vernon Parish hotel, motel, and RV occupancy tax revenue for August with previous month, year, and year-to-date comparisons. Data Source: Vernon Parish Sales Tax Department. September 2022.

Nationally, air passenger traffic inAugust 2022 fell -4.2% from the previous month.
Last month, air passenger traffic remained -9% below 2019 levels.
U.S. air passenger traffic
YTD in 2022 was down -12% from 2019.
Nationwide daily percentage of passengers passing through current TSA checkpoints in 2022 expressed as a percentage of traffic in 2019. Data
U.S. Airport Passenger Throughput Traffic in 2022 as a Percent of Traffic from 2019
Weekly retail price of gasoline in the Gulf Coast region for all formulations from 2020 - 2022.
Weekly Retail Gasoline Price All Formulations in Gulf Coast Region 2020-2022
▪ Gasoline peaked on June 13 at $4.63 a gallon.As of September 12, the price had fallen to $3.13. ▪ August 2022 average retail gasoline price in Gulf Coast region $3.48/gal. compared to $2.82/gal. a year ago, a 23% increase.
Data Source: U.S. Energy Information Administration, Prices, Sales Volumes & Stocks by State, September 16, 2022
 Central Louisiana Economic Dashboard
The chart below represents the monthly number of new businesses applications in Louisiana from 2020-2022
New business applications in Louisiana inAugust 2022 increased 28% from July 2022.
YTD business applications in Louisiana are down -16%, 59,766 compared to 71,129.
Note: Data reflects businesses applications, not necessarily business formations.
Data Source: U.S. Census Bureau, Business Formation Statistics, Retrieved September 16, 2022.
The chart below represents the number of new businesses established each month in Rapides from January 2019 through August 2022.


✓The number of new businesses established in Rapides inAugust 2022 fell -17% from July and -50% from the previous year.
✓Year-to-date, 281 new businesses have been created in Rapides in 2022, compared to 369 in 2021, representing a -24% decline.
Note: Data reflects businesses established in the current month.
Data Source: Rapides Parish Sales and Use Tax Department, September 2022.
Rapides Parish occupational license revenue YTD with previous YTD comparisons.
Note: Rapides Parish reflects unincorporated areas. Data reflects licenses paid year-to-date.
Data Source: Rapides Parish Police Jury Treasurer’s Reports, September 2022.
The Coincident Economic Activity Index for Louisiana is set to match the trend in the gross state product and includes four indicators: nonfarm payroll employment, the unemployment rate, average hours worked in manufacturing and wages and salaries. The column graph below represents the percentage change in the index. A positive percentage represents an expanding statewide economy.
In July 2022, the Index rose to 109.32, compared to 108.67 in June 2022.
The Index remains exceeded the January 2020 level for the first time since the pandemic started.
A revised number for June and a strong July may indicate the beginning of a reversal of the downtrend that started in July 2021.
Data Source: FRED Economic Data, Federal Reserve Bank of St. Louis, September 163,2022. https://fred.stlouisfed.org/series/LAPHCI
Represents the number of drilling rigs actively exploring for or developing oil or natural gas in Louisiana and the U.S. in 2020-2022.


✓Average rig count in Louisiana was unchanged from last month.
✓Nationwide, the rig count rose from 503 a year ago to 764 inAugust, an increase of 52%.
Source: Baker Hughes, https://rigcount.bakerhughes.com/na-rig-count, September 16, 2022
Gaming revenue in Louisiana for August 2022 with previous month and year comparisons.
August 2022
* Note: Year-to-Date percentage reflects calendar year.
Data Source: Louisiana Gaming Control Board, September 16, 2022. http://lgcb.dps.louisiana.gov/revenue_reports.html
The data presented throughout the CENLA Economic Dashboard reflects contributions from the following local organizations.
Also, special thanks to the following partners for distributing the dashboard.
• Rapides Parish Policy Jury Treasurer
• Rapides Sales TaxAdministrator
• Avoyelles Parish School Board
• Alexandria International Airport
• Alexandria / Pineville Area CVB
• RapidesArea Planning Commission
• City ofAlexandria Planning Division
• Evangeline Parish Sales Tax Commissioner
• Concordia, Catahoula, & La Salle Tax Administrator
• Louisiana Office of Public Health
• St. Landry Parish School Board
• Grant Parish Sheriff’s Office
• Natchitoches Parish Tax Commission
• Natchitoches Parish Planning and Zoning
• City of Natchitoches Planning
• Vernon Parish Sales Tax Department
• LSUAFoundation
• Central Louisiana Regional Chamber of Commerce
• Marksville Chamber of Commerce
• Bunkie Chamber of Commerce
• Evangeline Chamber of Commerce
• Concordia Chamber of Commerce
• Greater Vernon Chamber of Commerce
• Natchitoches Chamber of Commerce
• Next Issue: Week of October 24, 2022