August 24, 2022


August 24, 2022
August 24, 2022
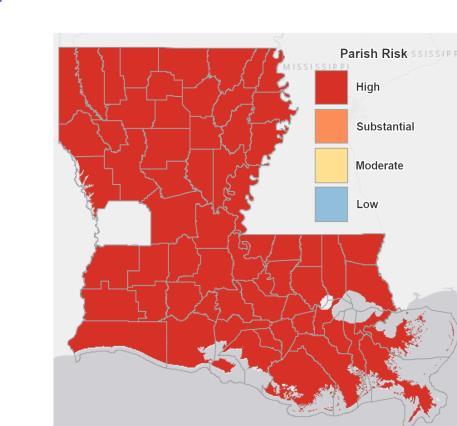
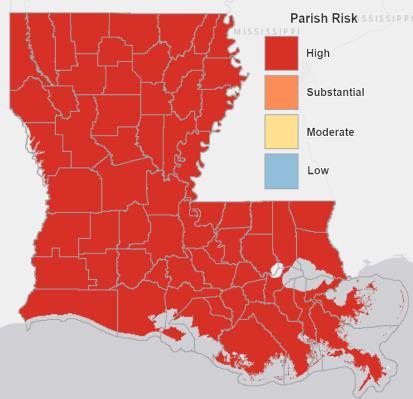
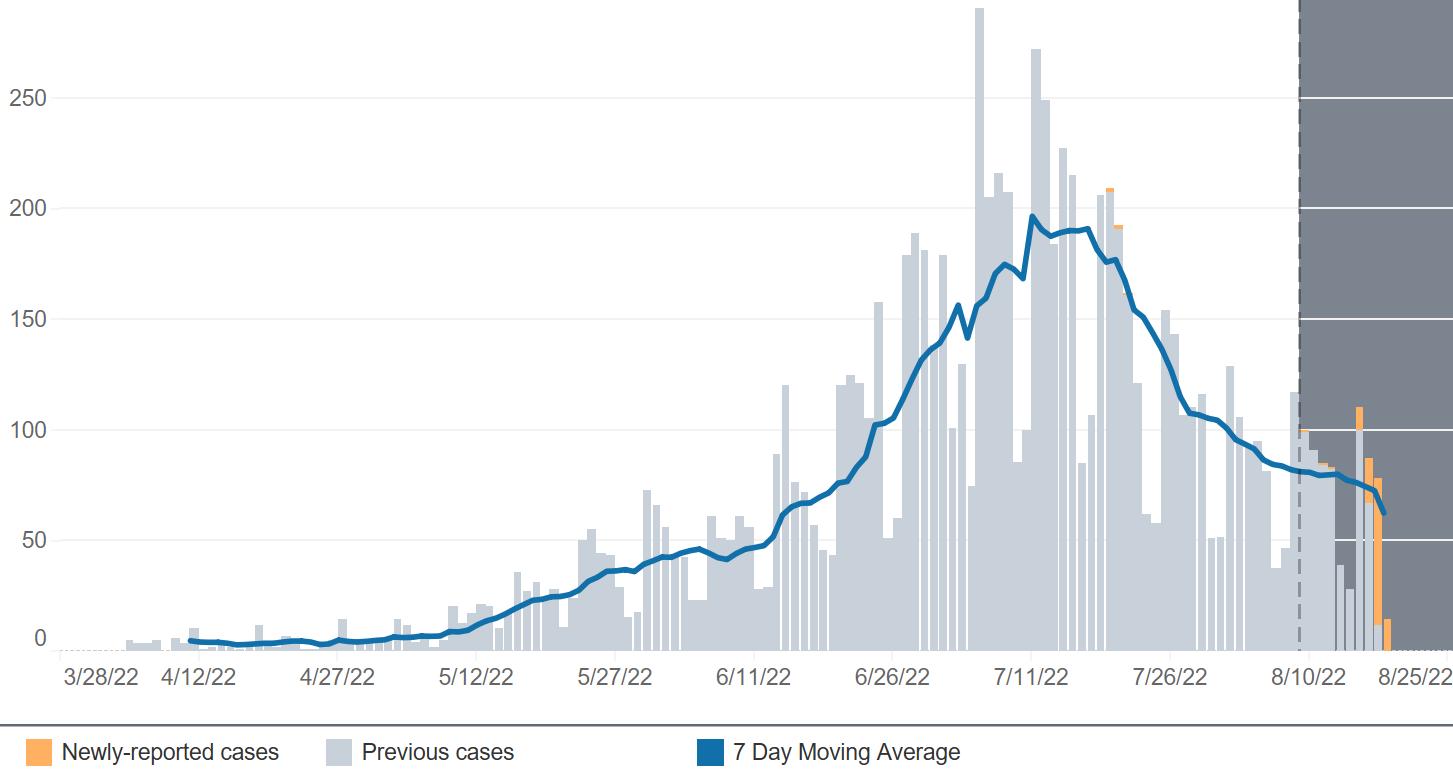
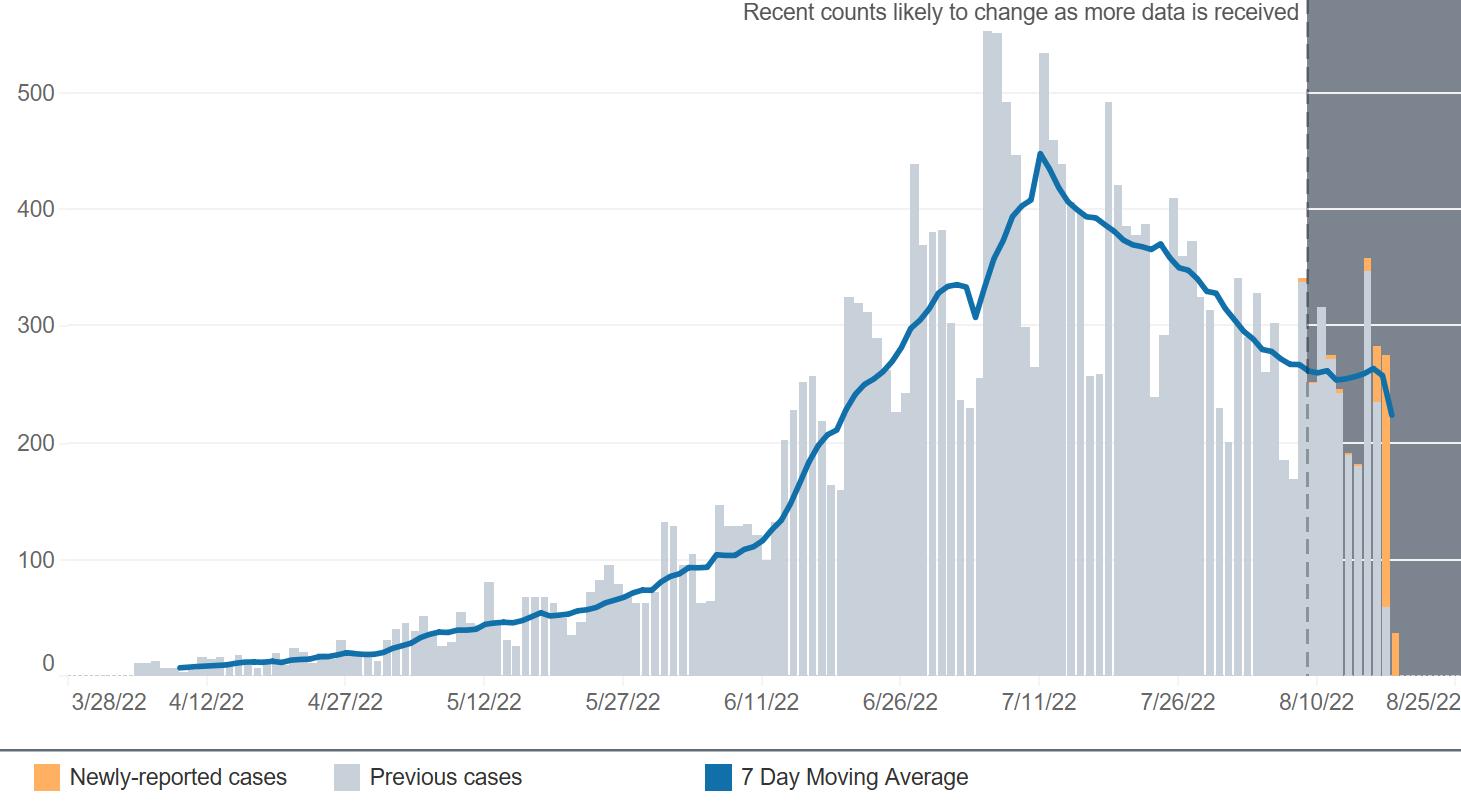
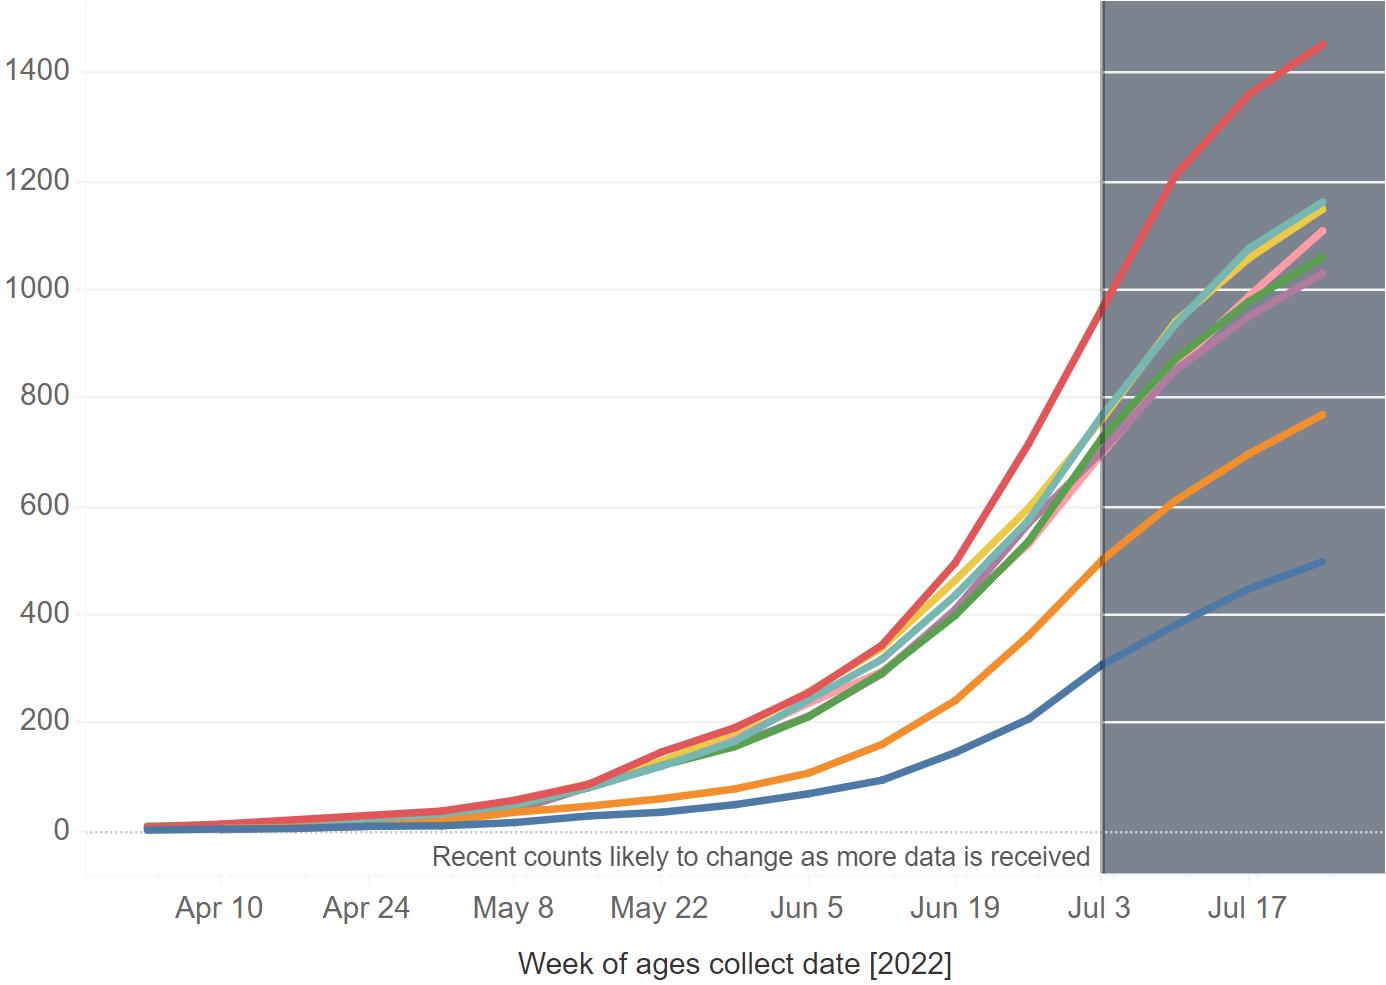
Covid cases in Regions 6 & 7 have been declining since its peak in early July. However, nearly all of central Louisiana is still considered at high risk for Covid. Individuals aged 18-29 and 30-39 have experienced the most cases in the recent wave. Of those being tested, the percent of positive cases in both regions exceeded the December / January surge.
The employment level in theAlexandria MSAreached another post-pandemic high in June, making it the fifth such high since December. In June, 63,635 were employed in the Alexandria metro area, an increase of 351 from May. The new post-pandemic record occurred despite a near full percentage point rise in the unemployment rate. The June unemployment rate rose to 3.6% from 2.7% in May. In Natchitoches, 15,862 were employed in June, down from 16,297 in May with the unemployment rate rising to 4.8% from 3.2% in May. The sudden rise in June unemployment can be attributed to the addition of new high school and college graduates entering the labor market.
While the employment picture looks positive, unemployment claims bear watching. Initial unemployment claims statewide have increased for the fifth consecutive month with initial claims in July increasing 8% over June. Likewise, statewide average weekly continued unemployment claims rose 6% in July from a month earlier for the second consecutive monthly increase.
Hiring in theAlexandria metro area eased somewhat in June, although it remains the tightest labor market in the state. In June there were three jobs for each unemployed, compared to four in May.

August 24, 2022
While employment has remained strong, consumer spending has slowed compared to the first half of 2021. Consumer spending in central Louisiana through July 2022 remained slightly above 2021 levels in most parishes and cities, while some areas showed sizeable gains such as Evangeline, Natchitoches, and LaSalle. These parishes posted increases of 21%, 15%, and 10%, respectively. Vehicles sales as measured by tax revenue were down in four of the six jurisdictions, with declines ranging from -7% and -18%. Data for Rapides was not available this month and Natchitoches vehicle sales tax data is delayed a month.
Online sales declined in July according to the most recent data. Total online sales tax revenue in Cenla in July 2022 fell -5% from a month earlier, but is up 16% from July 2021. Year-to-date online sales are up 13% in central Louisiana compared to the same period last year. Online sales in Rapides fell -8% last month, but remains 13% ahead for the year compared to 2021. Natchitoches reported a -4% decline in July but a 26% increase so far over last year.
Higher mortgage rates have slowed the housing market. Data on the 30 year fixed mortgage rate is now included in the CENLA Economic Dashboard. The 30 year rate peaked the week of June 23 at 5.81% and has since declined to 5.18% as ofAugust 18. Lumber prices in July remained unchanged from June and stand -7% below a year ago. While the number of July active listings in Natchitoches, Leesville, andAlexandria, have increased by 8%, 12%, and 14%, respectively, houses are not staying on the market as long. TheAlexandria market saw a -5% decline in the time houses stayed on the market in July compared to June, while Natchitoches saw an -18% decline.
August 24, 2022
Gasoline prices have fallen from a peak on June 13 of $4.63/gallon to $3.54/gallon onAugust 8. Nevertheless, gas prices along the Gulf coast averaged $4.09/gal in July, up 45% from a year ago when prices were $2.82/gal.
Based on hotel occupancy tax revenue collected in July, occupancy was up 28% inAvoyelles, but down from -2% to -4% in Natchitoches, Rapides, and Vernon. Year-to-date, Avoyelles remains unchanged while Natchitoches is up 30% and Rapides 4%.
U.S. air passenger traffic remained unchanged in July from the previous month and was -12% below a year ago. Year-todate, passenger traffic in 2022 is -13% before the 2019 level, the year used for benchmarking.
New business applications in Louisiana in July 2022 fell -22% from the previous month. In the first seven months, business applications in Louisiana are down -18%, 52,325 compared to 62,749 for the same period last year. Likewise, the number of new businesses established in Rapides in July 2022 fell -17% from June and stood -40% below June 2021. Yearto-date, 256 new businesses have been created in Rapides in 2022, compared to 319 in 2021, representing a -20% decline.
Economic activity in Louisiana has been in a downtrend since July 2021 according to the Coincident Economic Activity Index for Louisiana which matches the trend in the gross state product. The Index still remains below the pre-pandemic January 2020 level.
 Central Louisiana Economic Dashboard
January 17, 2022
February 16, 2022
March 18, 2022
April 16, 2022
May 19, 2022
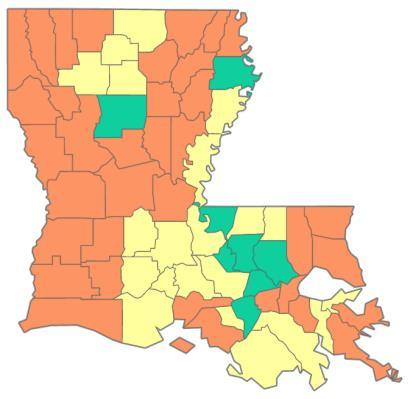
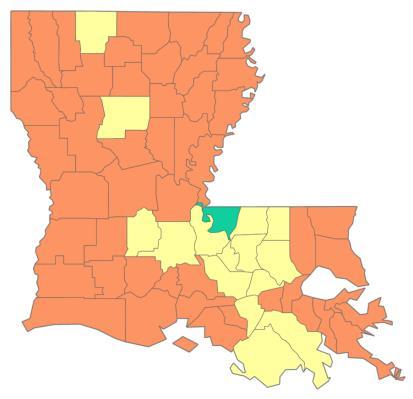
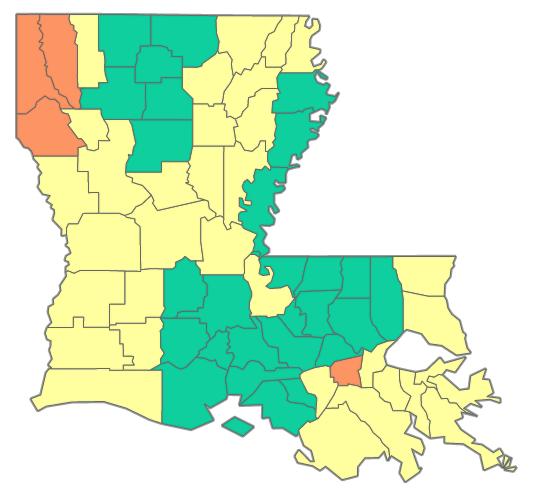
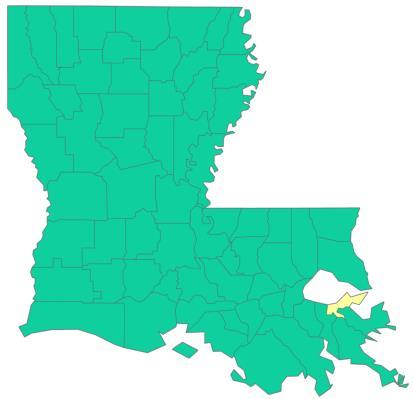
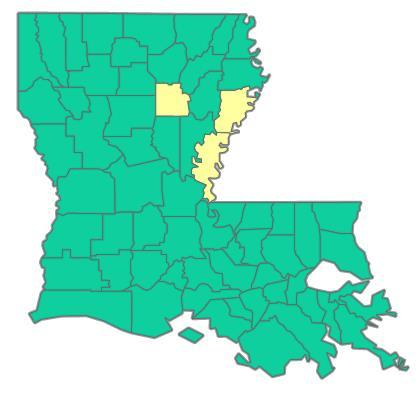
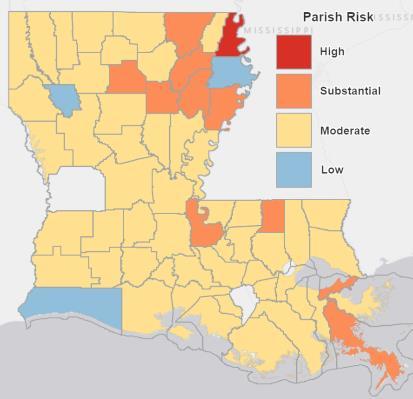
COVID-19 statewide risk by parish over time. Source: Louisiana Office of Public Health, August 21, 2022.
June 20, 2022
July 19, 2022
August 21, 2022
COVID-19 cases by collection date from April 4 – August 21, 2022 in Region 6 (Cenla).
Source: Louisiana Department of Health, COVID-19 Dashboard, https://ldh.la.gov/, August 21, 2022.
COVID-19 cases by collection date from April 4 – August 21, 2022 in Region 7 (Natchitoches).
Source: Louisiana Department of Health, COVID-19 Dashboard, https://ldh.la.gov/, August 21, 2022.
Cumulative cases by age range by week of test collection in Region 6 and Region 7 from April 4 to August 21, 2022.
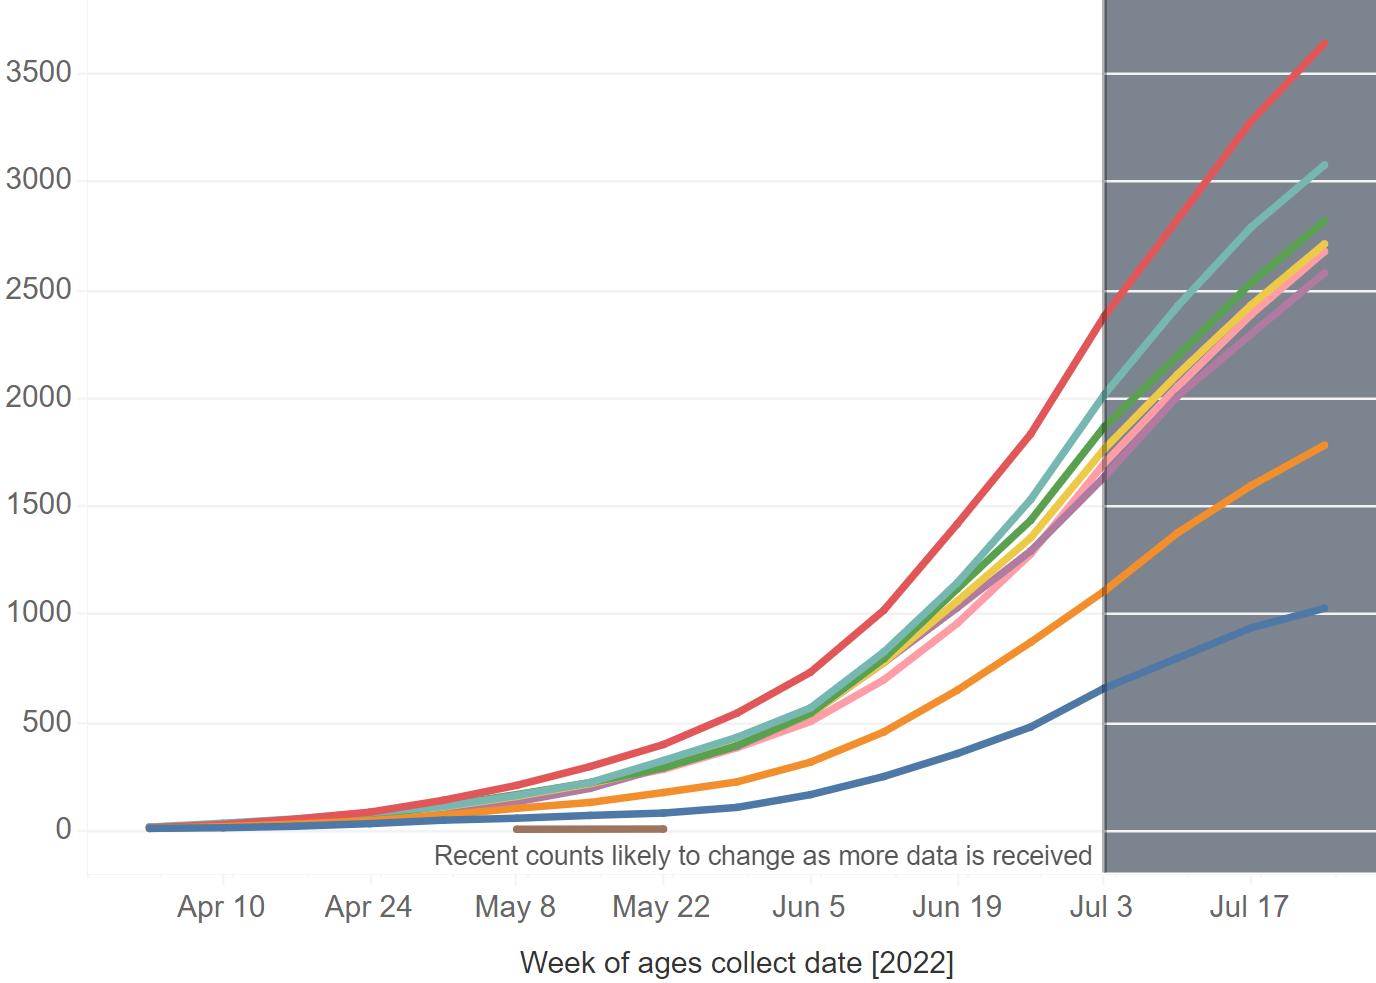
Central LA (Region 6)
Source: Louisiana Department of Health, COVID-19 Dashboard, https://ldh.la.gov/, August 21, 2022.
Natchitoches (Region 7)
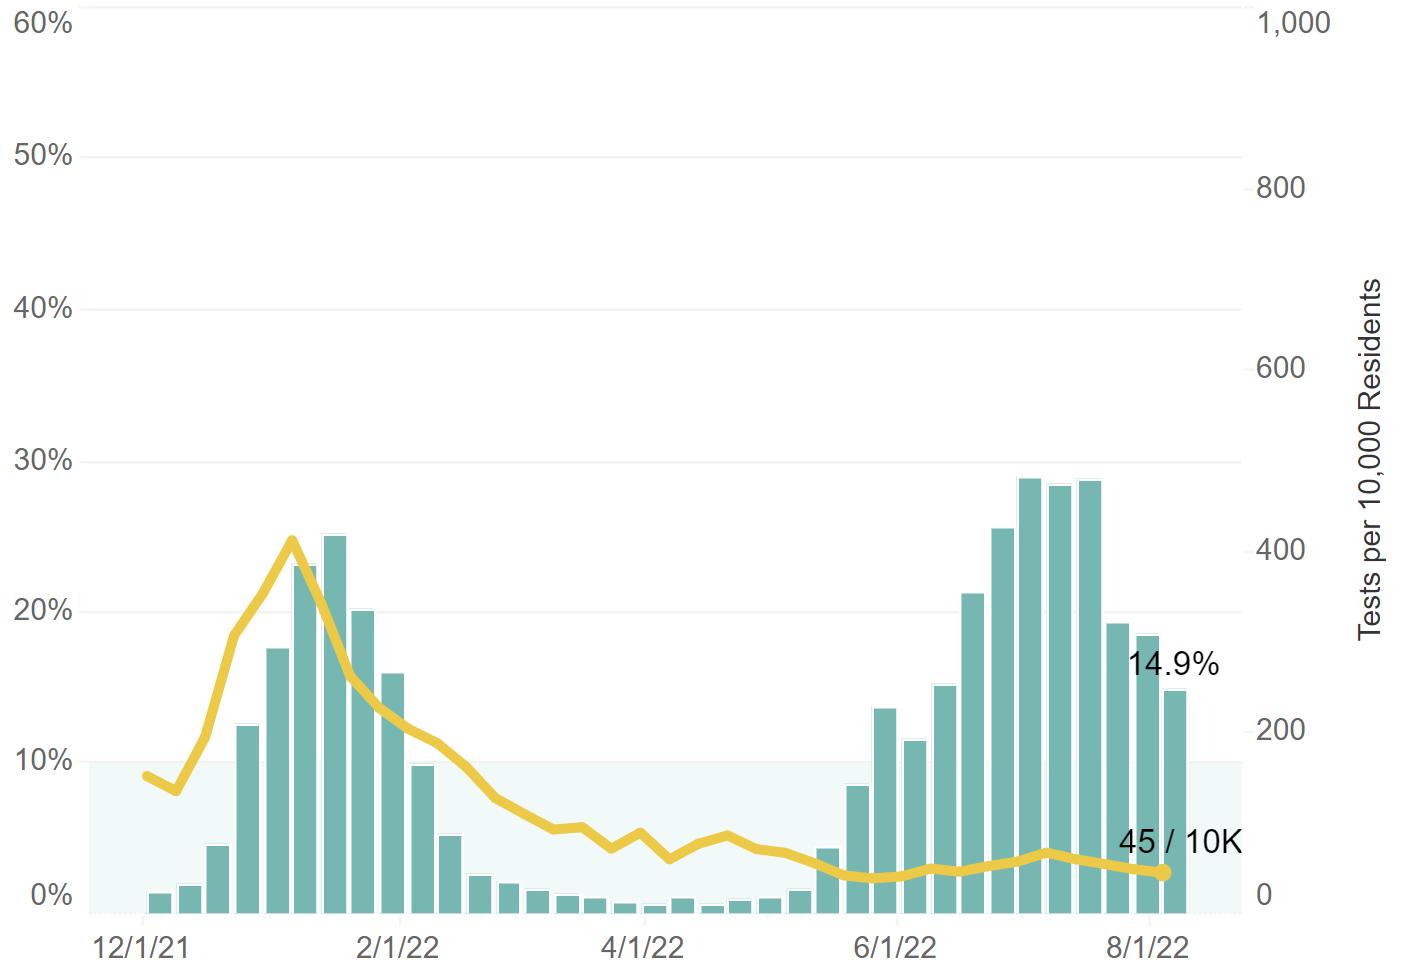
COVID-19 percent positive and test volume in Region 6 (Cenla) and Region 7 (Natchitoches) from December 1, 2021 – August 21, 2022.
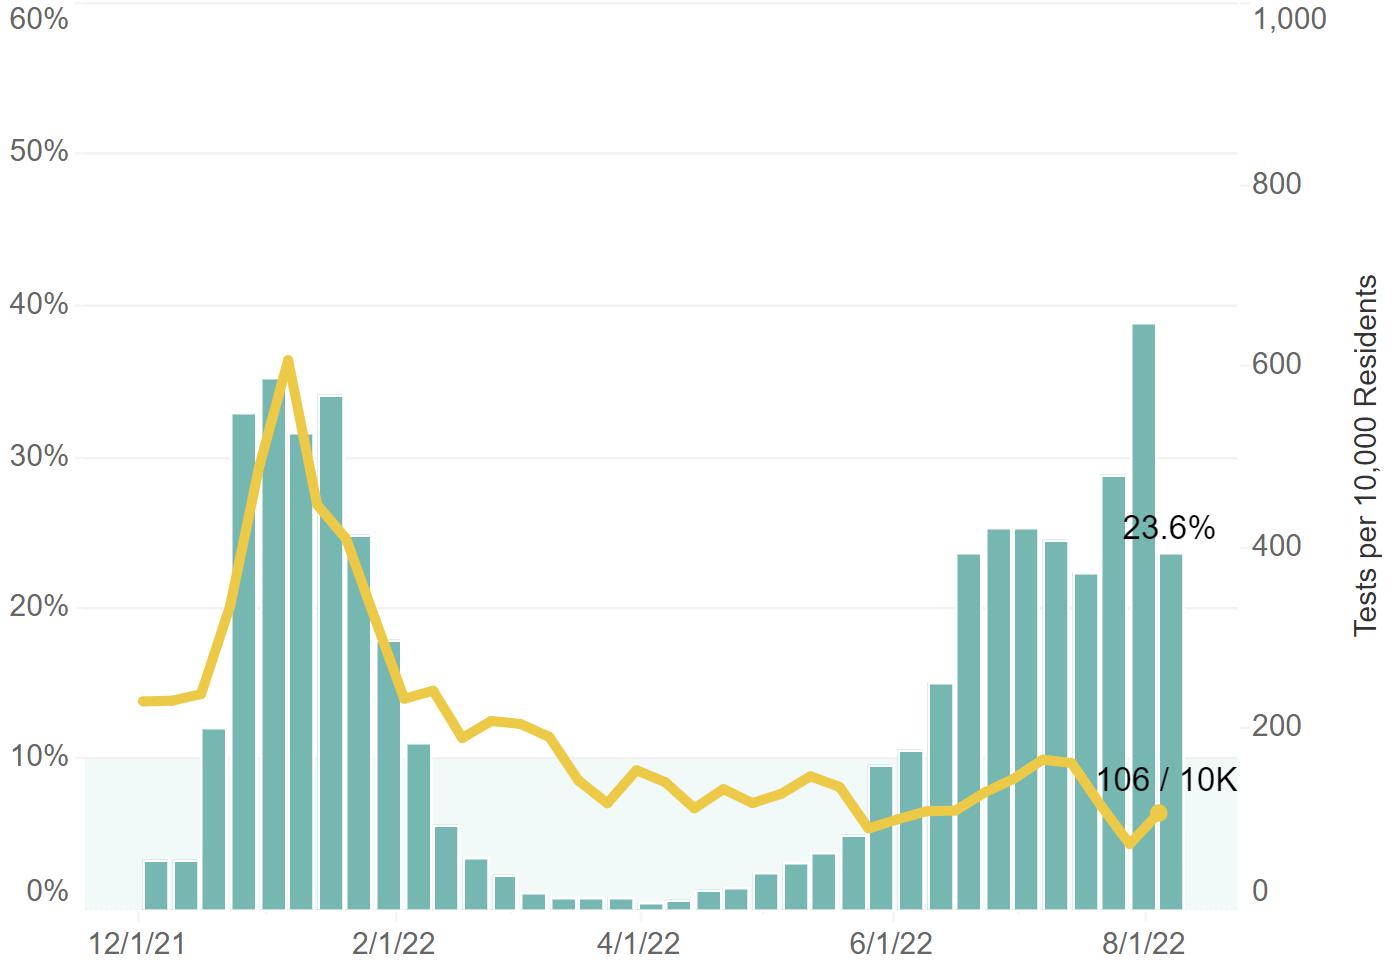
Central LA (Region 6)
Source: Louisiana Department of Health, COVID-19 Dashboard, https://ldh.la.gov/, August 21, 2022.
Natchitoches (Region 7)
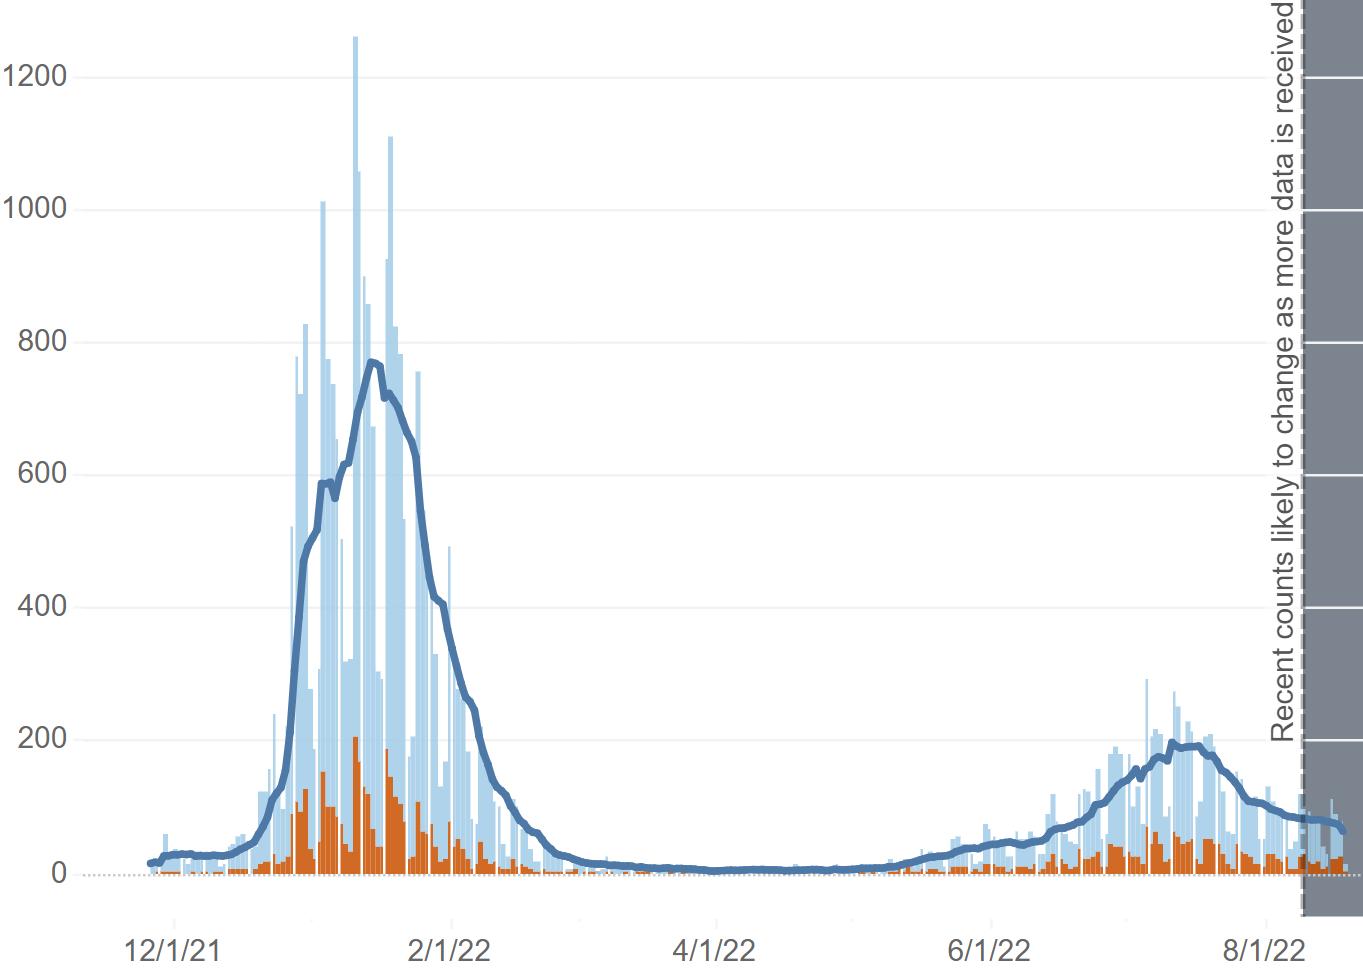
COVID-19 initial infections (blue) and reinfections (orange) for Regions 6 & 7 from December 2, 2021 – August 21, 2022.
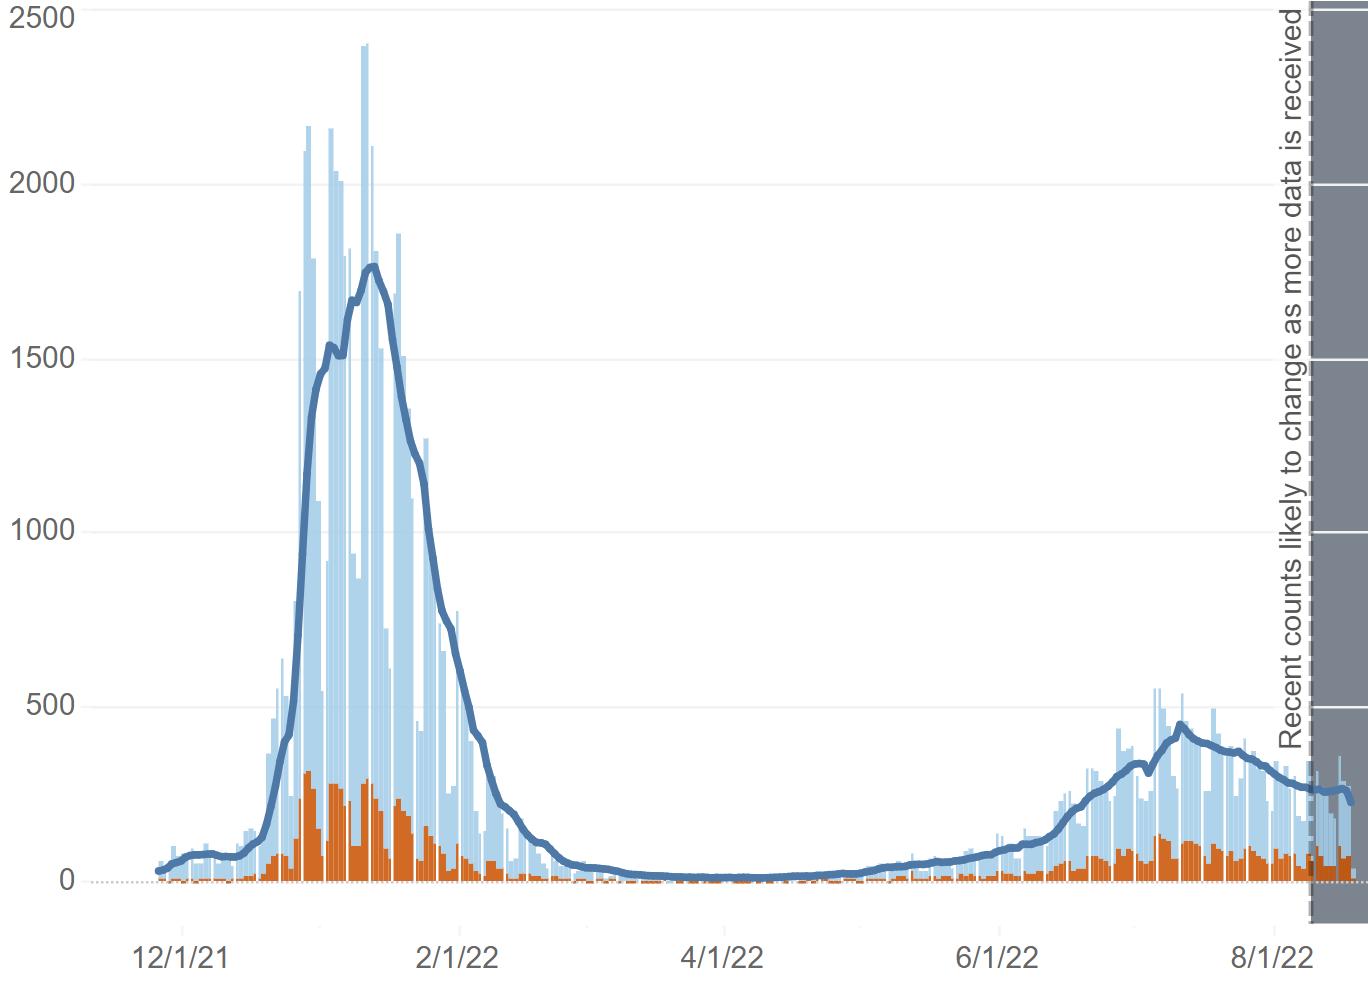
Central LA (Region 6)
Source: Louisiana Department of Health, COVID-19 Dashboard, https://ldh.la.gov/, August 21, 2022.
Natchitoches (Region 7)
Central Louisiana Economic Dashboard
Employed persons in the Alexandria MSA from 2020 – 2022.
Employed Persons in Alexandria, LA MSA 2020 - 2022
✓In June 2022, 63,635 were employed in the Alexandria metro area, an increase of 351 from May. ✓June employment represents the fourth record high in six months and the seventh since the pandemic started.
✓Unemployment in Alexandria MSArose to 3.6% in June from 2.7% in May.
Source: Louisiana Workforce Commission,August 8, 2022
Employed persons in Natchitoches parish from 2020 – 2022.
✓In June 2022, 15,862 were employed in Natchitoches parish, down from 16,297 in May. ✓The unemployment rate in Natchitoches parish rose to 4.8% in June from 3.2% in May.
Source: Louisiana Workforce Commission,August 8, 2022
Employed Persons in Natchitoches 2020-2022
Initial and continued unemployment claims in Louisiana from January 2022 to July 2022.


✓Initial unemployment claims increased for the fifth consecutive month. The average weekly initial unemployment claims filed in July increased 8% to 2,321 from 2,146 in June.
✓Statewide average weekly continued unemployment claims filed in July rose 6% to 12,256 from 11,537 a month earlier. This is the second consecutive monthly increase in continued claims this year.
Source: Louisiana Workforce Commission,August 7, 2022
The table below shows June 2022 preliminary unemployment rate, labor force, and employment data for central Louisiana parishes.
✓In June, parishes in central Louisiana had an unemployment rate of 4.6%, up from 3.4% in May.
✓June 4.6% unemployment rate for Cenla equals the state’s rate.
Data Source: Louisiana Workforce Commission, August 8, 2022.
The table below shows June 2022 preliminary unemployment rate, labor force, and employment data for Metropolitan Statistical Areas in the state.
June 2022
✓At 3.6%, theAlexandria MSAunemployment rate in June rose nearly a full percentage, 0.9%, but remained the lowest among the state’s major metro areas.
▪ Louisiana’s unemployment rate rose 1.0% in June to 4.6% from 3.6% in May.
Data Source: Louisiana Workforce Commission,August 8, 2022.
The table below shows the number of unemployed, number of advertised jobs online, and the ratio of unemployed to advertised job openings online for Metropolitan Statistical Areas in Louisiana in June 2022.
In June 2022, the Alexandria MSAlabor market had a job opening ratio of 0.34 in June compared to 0.25 in May.
TheAlexandria MSAlabor market eased from four job openings per unemployed in May to three in June.
The state ratio jumped to 0.73 in June, up significantly from 0.52 in May.
The tables below shows employers with the highest number of job openings advertised online on August 8, 2022.
Central Louisiana Economic Dashboard
An overview of sales, vehicle sales, and hotel occupancy taxes collected in the July 2022 reflecting sales activity in June 2022, unless otherwise noted.
Notes: July tax revenue reflects sales activity in June. * Current month data are not available. Represents prior month. N/a = Not available
Data Source noted in detailed reports.


An overview of sales tax revenue collected in other Rapides Parish towns and cities in July 2022 (excluding Alexandria and Pineville).
Note: Current tax revenue reflects sales activity in prior month.
Data Source: Rapides Parish Police Jury Treasurer’s Reports, August 2022.


(TR) Alexandria total sales tax revenue collected in July with previous month, year, and YTD comparisons.
(BR) Alexandria total monthly sales tax revenue from 2020 to present.
Note: Current month sales tax revenue reflects sales activity in previous month.
Data Source: Rapides Parish Police Jury Treasurer’s Reports,August 2022.
Avoyelles Parish total sales tax revenue collected in July with previous month, year, and year-to-date comparisons. Vehicle and hotel tax revenues are excluded.
Note: Current sales tax revenue reflects sales activity in the previous month.
Data Source: Avoyelles Parish School Board. August 2022.
Avoyelles Parish vehicle sales tax revenue collected in July with previous month, year, and year-to-date comparisons.
Note: Current sales tax revenue reflects sales activity in the previous month.
Data Source: Avoyelles Parish School Board. August 2022
Catahoula Parish total sales tax revenue collected in July with previous month, year, and year-to-date comparisons.
Note: Current month sales tax revenue reflects sales activity in the previous month.
Data Source: Catahoula Parish Tax Administrator, August 2022
Concordia Parish total sales tax revenue collected in July with previous month, year, and year-to-date comparisons.
Note: Current month sales tax revenue reflects sales activity in the previous month.
Data Source: Concordia Parish Tax Administrator.August 2022
Evangeline Parish total sales tax revenue collected in July with previous month, year and YTD comparisons.
Note: Current sales tax revenue reflects sales activity in previous month. Evangeline implemented a 1% sales tax increase July 1, 2021.
Data Source: Evangeline Parish Sales Tax Commissioner.August 2022
Evangeline Parish vehicle sales tax revenue collected in July with previous month, year and YTD comparisons.
Note: Current sales tax revenue reflects sales activity in previous month. Evangeline implemented a 1% sales tax increase July 1, 2021.
Data Source: Evangeline Parish Sales Tax Commissioner.August 2022
(TR) Grant sales tax revenue collected in July with previous month, year, and YTD comparisons.
(BR) Grant monthly sales tax revenue from 2020 to present.
Note: July sales tax revenue reflects sales activity in June.
Data Source: Grant Parish Sheriff’s Office, August 2022.
La Salle Parish total sales tax revenue collected in July with previous month, year, and year-to-date comparisons.
Note: Current month sales tax revenue reflects sales activity in the previous month.
Data Source: La Salle Parish Tax Administrator, August 2022
(TR) Natchitoches sales tax revenue collected in July with previous month, year, and YTD comparisons.
(BR) Natchitoches monthly sales tax revenue from 2020 to present.
Note: July sales tax revenue reflects sales activity in June.
Data Source: Natchitoches Parish Tax Commission,August 2022.
(TR) Natchitoches vehicle sales tax revenue collected in June with previous month, year, and YTD comparisons.
(BR) Natchitoches monthly vehicle sales tax revenue from 2020 to present.
Note: June sales tax revenue reflects sales activity in May. *July 2022 vehicle sales tax revenue was not available at time of publication.
Data Source: Natchitoches Parish Tax Commission,August 2022.

(TR) Pineville sales tax revenue collected in July with previous month, year, and YTD comparisons.
(BR) Pineville monthly sales tax revenue from 2020 to present.
Note: Current month sales tax revenue reflects sales activity in the prior month.
Data Source: Rapides Parish Police Jury Treasurer’s Reports,August 2022.
(TR) Rapides Parish sales tax revenue collected in July with previous month, year, and YTD comparisons.
(BR) Rapides monthly sales tax revenue from 2020 to present.
Note: Current sales tax revenue reflects sales activity in the prior month.
Data Source: Rapides Parish Police Jury Treasurer’s Reports,August 2022.
Rapides Parish Total Sales Tax Revenue
St. Landry Parish sales tax revenue collected in July with previous month, year, and YTD comparisons.
Note: Current sales tax revenue reflects sales activity in prior month.
Data Source: Tax revenue data from St. Landry Parish School Board. August 2022
St. Landry Parish vehicle sales tax revenue collected in July with previous month, year, and YTD comparisons.
Note: Current sales tax revenue reflects sales activity in prior month.
Data Source: Tax revenue data from St. Landry Parish School Board. August 2022
Vernon Parish sales tax revenue collected in July with previous month, year, and year-to-date comparisons.
Data Source: Vernon Parish Sales Tax Department. August 2022.
Vernon Parish vehicle tax revenue collected in July with previous month, year, and year-to-date comparisons.
Data Source: Vernon Parish Sales Tax Department. August 2022.
Remote seller tax revenue by parish with month-over-month and year-over-year comparisons.
✓Total online sales tax revenue in Cenla in July 2022 fell -5% from a month earlier but is up 16% from July 2021. ✓YTD online sales are up 13% in central Louisiana.
Note: Sales tax revenue collected inApril reflects sales activity in March.
Data Source: Louisiana Sales and Use Tax Commission for Remote Sellers.August 2020 –August 2022
Remote seller tax revenue is tax revenue from online sales by location of the seller at the time of purchase.
✓The first seven months of 2022 saw $10.8 million in online sales taxes collected in Cenla compared to $9.6 million in 2021, a 13% increase.
SinceAugust 2020 when remote sellers tax revenue collection started, $32.7 million in sales tax revenue have been collected from online sales in central Louisiana.
Note: Sales tax revenue collected in May reflects sales activity inApril.
August 2020 - July 2022
Data Source: Louisiana Sales and Use Tax Commission for Remote Sellers.August 2020 –August 2022
Remote sellers tax revenue from online sales in Avoyelles Parish from July 2020 – July 2022.
Note: Sales tax revenue collected in one month reflects sales activity in the prior month.
Data Source: Louisiana Sales and Use Tax Commission for Remote Sellers.August 2020 –August 2022

Remote sellers tax revenue from online sales in Evangeline Parish from July 2020 – July 2022.
July 2020 - July 2022
Note: Sales tax revenue collected in one month reflects sales activity in the prior month.
Data Source: Louisiana Sales and Use Tax Commission for Remote Sellers.August 2020 –August 2022

Remote sellers tax revenue from online sales in Natchitoches Parish from July 2020 – July 2022.
Note: Sales tax revenue collected in one month reflects sales activity in the prior month.
Data Source: Louisiana Sales and Use Tax Commission for Remote Sellers.August 2020 –August 2022

Remote sellers tax revenue from online sales in Rapides Parish from July 2020 – July 2022.
Note: Sales tax revenue collected in one month reflects sales activity in the prior month.
Data Source: Louisiana Sales and Use Tax Commission for Remote Sellers.August 2020 –August 2022

(TR) Louisiana tax revenue from all sources for July with previous month, year, and YTD comparisons.
(BR) Louisiana monthly tax revenue from 2020 to present.
Central Louisiana Economic Dashboard
This chart shows the valuation of permits issued by Rapides Area Planning Commission in Avoyelles Parish in July between 2019-2022 with month-to-month, year-to-year, and year-to-date comparisons.
Data Source: RapidesArea Planning Commission,August 2022.
This chart shows the valuation of permits issued by Rapides Area Planning Commission in Evangeline Parish in July between 2019-2022 with month-to-month, year-to-year, and year-to-date comparisons.
Data Source: RapidesArea Planning Commission,August 2022.
This table below shows the valuation of permits issued by the City of Natchitoches Planning and Zoning Office between 2019 – 2022 with month-to-month, year-to-year, and year-to-date comparisons.
Data Source: City of Natchitoches Planning and Zoning Office, August 2022.
This table and chart shows the valuation of permits issued by Natchitoches Parish Permit Office between 2021 – 2022 with month-to-month, year-to-year, and year-todate comparisons.
Data Source: Natchitoches Parish Permit Office, August 2022.
This chart shows the valuation of permits issued by Rapides Area Planning Commission in the City of Pineville in July between 2019-2022 with month-to-month, year-to-year, and year-to-date comparisons.
Data Source: RapidesArea Planning Commission,August 2022.
This charts shows the valuation of permits issued by Rapides Area Planning Commission in Rapides Parish (excluding Alexandria) in July between 20192022 with month-to-month, year-to-year, and year-to-date comparisons.
Data Source: RapidesArea Planning Commission, August 2022.
Central Louisiana Economic Dashboard
30-Year Fixed Rate Mortgage Average in the United States from 1971 – 2022 and from 2019 – 2022.
▪ 30 year fixed mortgage rates this year peaked the week of June 23 at 5.81% and has declined to 5.18% on August 18.
Data Source: Fed Reserve Economic Database, St. Louis Federal Reserve Bank, August 22, 2022.
The chart represents the Lumber Price Index in the U.S. from January 2020 – July 2022.
Monthly Price Index of Lumber 2020 - 2022
▪ In July 2022, the US Lumber Price Index remain unchanged from June.
▪ Currently, the Lumber Index stands -7% below a year ago.
Data Source: Fed Reserve Economic Database, St. Louis Federal Reserve Bank, August 14, 2022.
The count of active listings, median days on the market, average listing price, and median listing price for the Alexandria MSA for July 20192022 with month-to-month and year-over-year comparisons.
The count of active listings, median days on the market, average listing price, and median listing price for the Ft. Polk / Leesville market for July 2019-2022 with month-to-month and year-over-year comparisons.
The count of active listings, median days on the market, average listing price, and median listing price for the Natchitoches market for July 20192022 with month-to-month and year-over-year comparisons.
The count of active single-family and condo/townhome listings from 2019-2022 for Alexandria, Fort Polk (Leesville), Natchitoches, and Opelousas.
The median number of days property listings spend on the market from 2019-2022 for Alexandria, Fort Polk (Leesville), Natchitoches, and Opelousas.
The median listing price of houses from 2019-2022 for Alexandria, Fort Polk (Leesville), Natchitoches, and Opelousas.
The average listing price of houses from 2019-2022 for Alexandria, Fort Polk (Leesville), Natchitoches, and Opelousas.
Central Louisiana Economic Dashboard
Avoyelles Parish hotel occupancy tax revenue for July with previous month, year, and year-to-date comparisons.
Note: Current tax revenue reflects hotel occupancy activity in the previous month. Hotel occupancy tax revenue is used as a proxy for hotel occupancy rate.
Data Source: Avoyelles Parish School Board. August 2022.
Natchitoches Parish hotel occupancy tax revenue for July with previous month, year, and YTD comparisons.
Note: July tax revenue reflects hotel occupancy activity in June. Hotel occupancy tax revenue is used as a proxy for hotel occupancy rate.
Data Source: Natchitoches Parish Tax Administrator, August 2022.
Rapides Parish hotel occupancy tax revenue for July with previous month, year, and YTD comparisons.
Note: Current tax revenue reflects hotel occupancy activity in previous month. Hotel occupancy tax revenue is used as a proxy for hotel occupancy rate.
Data Source: Rapides Parish Police Jury Treasurer’s Reports, August 2022.
Vernon Parish hotel, motel, and RV occupancy tax revenue for July with previous month, year, and year-to-date comparisons. Data Source: Vernon Parish Sales Tax Department. August 2022.

Nationally, air passenger traffic in July 2022 was unchanged from the previous month.
Last month, air passenger traffic remained -12% below 2019 levels.
U.S. air passenger traffic YTD in 2022 was down -13% from 2019.
Nationwide daily percentage of passengers passing through current TSA checkpoints in 2022 expressed as a percentage of traffic in 2019. Data Source: DHS, Transportation
U.S. Airport Passenger Throughput Traffic in 2022 as a Percent of Traffic from 2019

Weekly retail price of gasoline in the Gulf Coast region for all formulations from 2020 - 2022.
Weekly Retail Gasoline Price All Formulations in Gulf Coast Region 2020-2022
▪ Gasoline peaked on June 13 at $4.63 a gallon.As of August 8, the price had fallen to $3.54.
July 2022 retail gasoline price in Gulf Coast region average $4.09/gal. compared to $2.82 in 2021, a 45% increase.
Data Source: U.S. Energy Information Administration, Prices, Sales Volumes & Stocks by State, August 13, 2022
Central Louisiana Economic Dashboard
The chart below represents the monthly number of new businesses applications in Louisiana from 2020-2022
New business applications in Louisiana in July 2022 decreased -22% from June 2022.
YTD business applications in Louisiana are down -18%, 52,325 compared to 62,749.
Note: Data reflects businesses applications, not necessarily business formations.
Data Source: U.S. Census Bureau, Business Formation Statistics, Retrieved August 13, 2022.
The chart below represents the number of new businesses established each month in Rapides from January 2019 through July 2022.


✓The number of new businesses established in Rapides in July 2022 fell -17% from June and was -40% below the previous year.
✓Year-to-date, 256 new businesses have been created in Rapides in 2022, compared to 319 in 2021, representing a -20% decline.
Note: Data reflects businesses established in the current month.
Data Source: Rapides Parish Sales and Use Tax Department, August 2022.
Rapides Parish occupational license revenue YTD with previous YTD comparisons.
Note: Rapides Parish reflects unincorporated areas. Data reflects licenses paid year-to-date.
Data Source: Rapides Parish Police Jury Treasurer’s Reports, August 2022.
Louisiana Coincident Economic Activity Index
2021 - 2022
In June 2022, the Index was 108.13 compared to 108.03 in May 2022.
▪ The Index remains below the January 2020 level of 108.35.
▪ Since January the growth rate of the Index has fallen from 0.43% to 0.09%, indicating a slowing recovery.
The Coincident Economic Activity Index for Louisiana is set to match the trend in the gross state product and includes four indicators: nonfarm payroll employment, the unemployment rate, average hours worked in manufacturing and wages and salaries. The column graph below represents the percentage change in the index. A positive percentage represents an expanding statewide economy. Data
Indicates slowing economy
Represents the number of drilling rigs actively exploring for or developing oil or natural gas in Louisiana and the U.S. in 2020-2022.


Rig Count in Louisiana & US
2020-2022
✓Average rig count in Louisiana rose by two rigs in July from June.
✓Nationwide, the rig count rose from 483 a year ago to 757 in July, an increase of 57%.
Source: Baker Hughes, https://rigcount.bakerhughes.com/na-rig-count, August 13, 2022
Gaming revenue in Louisiana for June 2022 with previous month and year comparisons.
June 2022
* Note: Year-to-Date percentage reflects calendar year.
Data Source: Louisiana Gaming Control Board, August 13, 2022. http://lgcb.dps.louisiana.gov/revenue_reports.html
The data presented throughout the CENLA Economic Dashboard reflects contributions from the following local organizations.
Also, special thanks to the following partners for distributing the dashboard.
• Rapides Parish Policy Jury Treasurer
• Rapides Sales TaxAdministrator
• Avoyelles Parish School Board
• Alexandria International Airport
• Alexandria / Pineville Area CVB
• RapidesArea Planning Commission
• City ofAlexandria Planning Division
• Evangeline Parish Sales Tax Commissioner
• Concordia, Catahoula, & La Salle TaxAdministrator
• Louisiana Office of Public Health
• St. Landry Parish School Board
• Grant Parish Sheriff’s Office
• Natchitoches Parish Tax Commission
• Natchitoches Parish Planning and Zoning
• City of Natchitoches Planning
• Vernon Parish Sales Tax Department
• LSUAFoundation
• Central Louisiana Regional Chamber of Commerce
• Marksville Chamber of Commerce
• Bunkie Chamber of Commerce
• Evangeline Chamber of Commerce
• Concordia Chamber of Commerce
• Greater Vernon Chamber of Commerce
• Natchitoches Chamber of Commerce
• Next Issue: Week of September 19, 2022