July 22, 2022


July 22, 2022
This issue of the CENLAEconomic Dashboard which includes a Mid-Year Report on the central Louisiana economy. Economic indicators for central Louisiana have been mixed the first half of the year.Although there is good news on the employment front, rising interest rates, inflation, and energy costs are slowing the economy.
Employment levels in central Louisiana reached new post-pandemic highs forAlexandria and Natchitoches in the Spring. By mid-year,Alexandria had added 1,062 jobs while Natchitoches added 656, representing increases of 1.7% and 4.1%, respectively. The backlog of job openings has been filled to some degree by additional workers returning to the labor force, driving unemployment rates to record lows.
Central Louisiana saw record low unemployment rates inApril. The unemployment rate for the 11 parishes area reached a low of 3.2%, while Natchitoches and theAlexandria MSAreported unemployment rates of 3.0% and 2.6%. Unemployment rates such as these have not been seen in a decade or more.
However, the employment picture may be changing in the second half of the year, according to unemployment claim data. Initial unemployment claims bottomed in February and have risen every month since. By late June, initial claims had risen 61%. Continued unemployment claims followed suit in late April and had risen 20% by June. Nevertheless, hiring remained tight in the central Louisiana labor market. TheAlexandria MSAhad the tightest metropolitan labor market in the state this year, averaging about four jobs for each unemployed.

While employment has remained strong, consumer spending growth has slowed compared to the first half of last year. Consumer spending in Rapides through June 2022 remained at the same level as 2021, meaning there was no growth.Alexandria saw a 1% increase in spending year-to-date, while Pineville and Natchitoches experienced 13% and 18% spending growth during the period. While the rate of growth may have slowed, only one of the twelve tax jurisdictions in the CENLAEconomic Dashboard reported a decrease in consumer spending compared to last year.
Online sales, on the other hand, grew at a faster pace than last year. Whereas Rapides had no change in total consumer spending so far in 2022, online sales within the parish grew 11% compared to the same period in 2021. Vernon recorded a 5% increase in online sales, while Grant saw a 6% increase. Overall, online sales in central Louisiana increased 13%, with Natchitoches leading the region with a 26% increase.
Higher mortgage rates have slowed the housing market causing lumber prices to fall -27% from a year ago. The average number of active listings inAlexandria and Leesville increased by 10% in the first half of 2022 compared to the same period in 2021. Natchitoches saw a -35% decline in listings. The average number of days a house stayed on the market fell by -14% inAlexandria, -25% in Leesville, and -11% in Natchitoches in 2022 compared to 2021. The average listing price fell -7.0% and -2.6% in the Natchitoches andAlexandria markets, respectively, but was up 2.4% in Leesville / Fort Polk.
Travel and tourism indicators were mixed. With gas prices up 53% since January, some travel-related businesses in central Louisiana felt the impact. For the first half of 2022, hotel occupancy tax revenues were down -3% inAvoyelles and -7% in Vernon, while Rapides saw an 8% increase.Atemporary, out-of-town boost in the workforce accelerated hotel occupancy tax revenue in Natchitoches by 30% through mid-year. Nationwide, year-to-date air passenger traffic remains -13% below 2019 levels, the last “normal” year for airline traffic.
Through June, 226 new businesses had been created in Rapides compared to 269 in 2021, representing a -16% decline. The decline in local business applications corresponds with the decline in statewide business applications. New business applications in Louisiana through June 2022 were down -17%, 46,532 compared to 55,858 in 2021.
Dr. Randall Dupont, Dean, College of Business LSU of Alexandria
 Central Louisiana Economic Dashboard
COVID-19 statewide risk by parish over time.
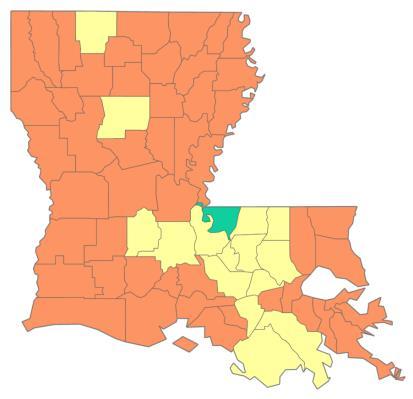
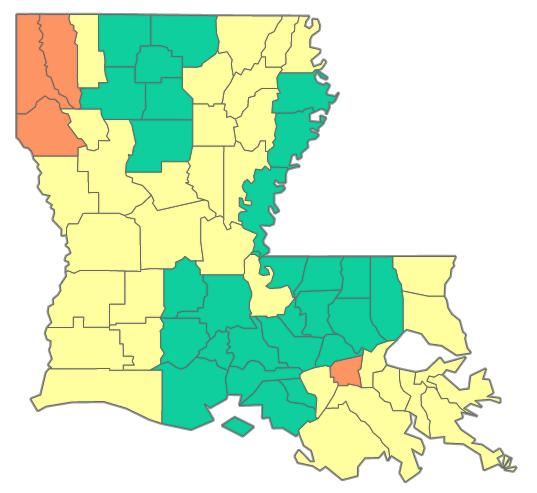
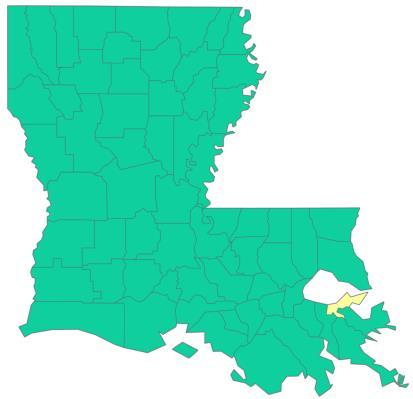
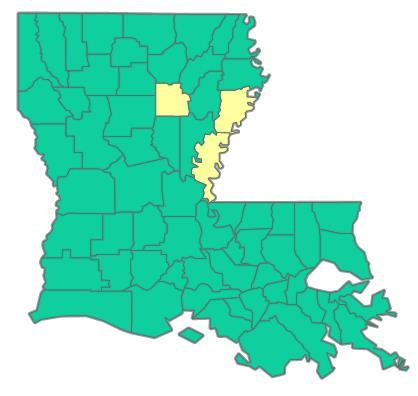
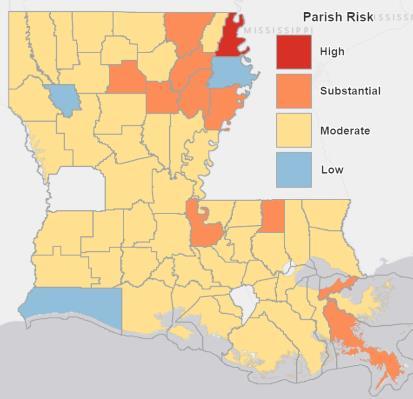
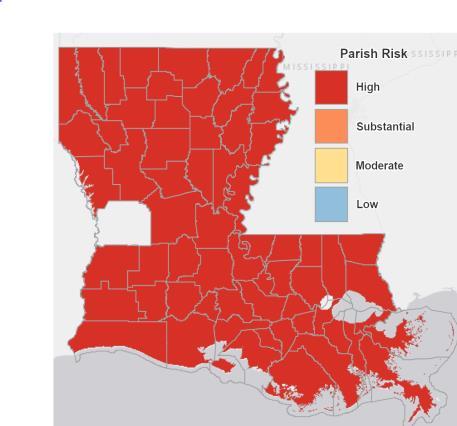
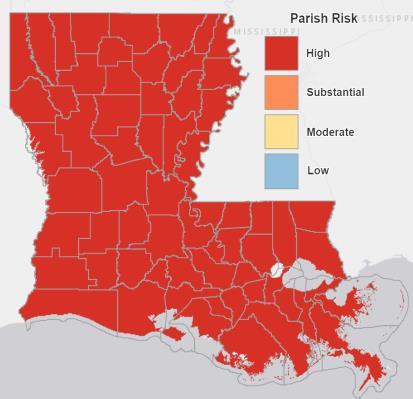
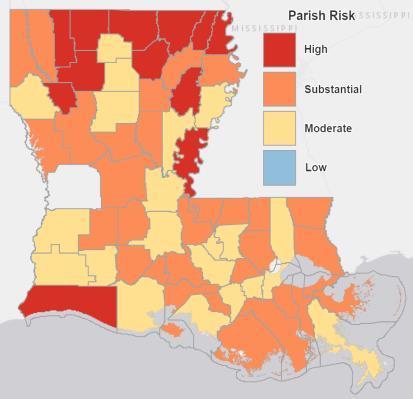
December 18, 2021
January 17, 2022
February 16, 2022
March 18, 2022
April 16, 2022
May 19, 2022
June 20, 2022
July 19, 2022
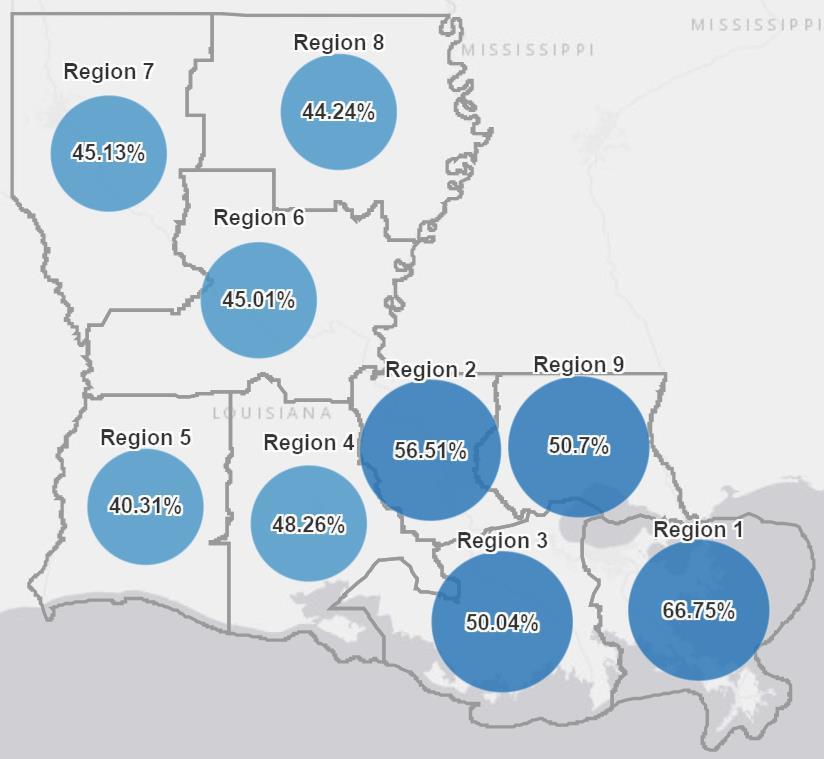
COVID-19 vaccinations as a percent of region population as of July 20, 2022.
✓Region 6 has 45.0% of the population vaccinated as of July 20, up from 44.8% in mid-June.
✓Region 7 has a 45.1% of the population vaccinated as of July 20, up from 44.9% in mid-June.
Source: Louisiana Office of Public Health, https://ldh.la.gov/covidvaccine, July 20, 2022
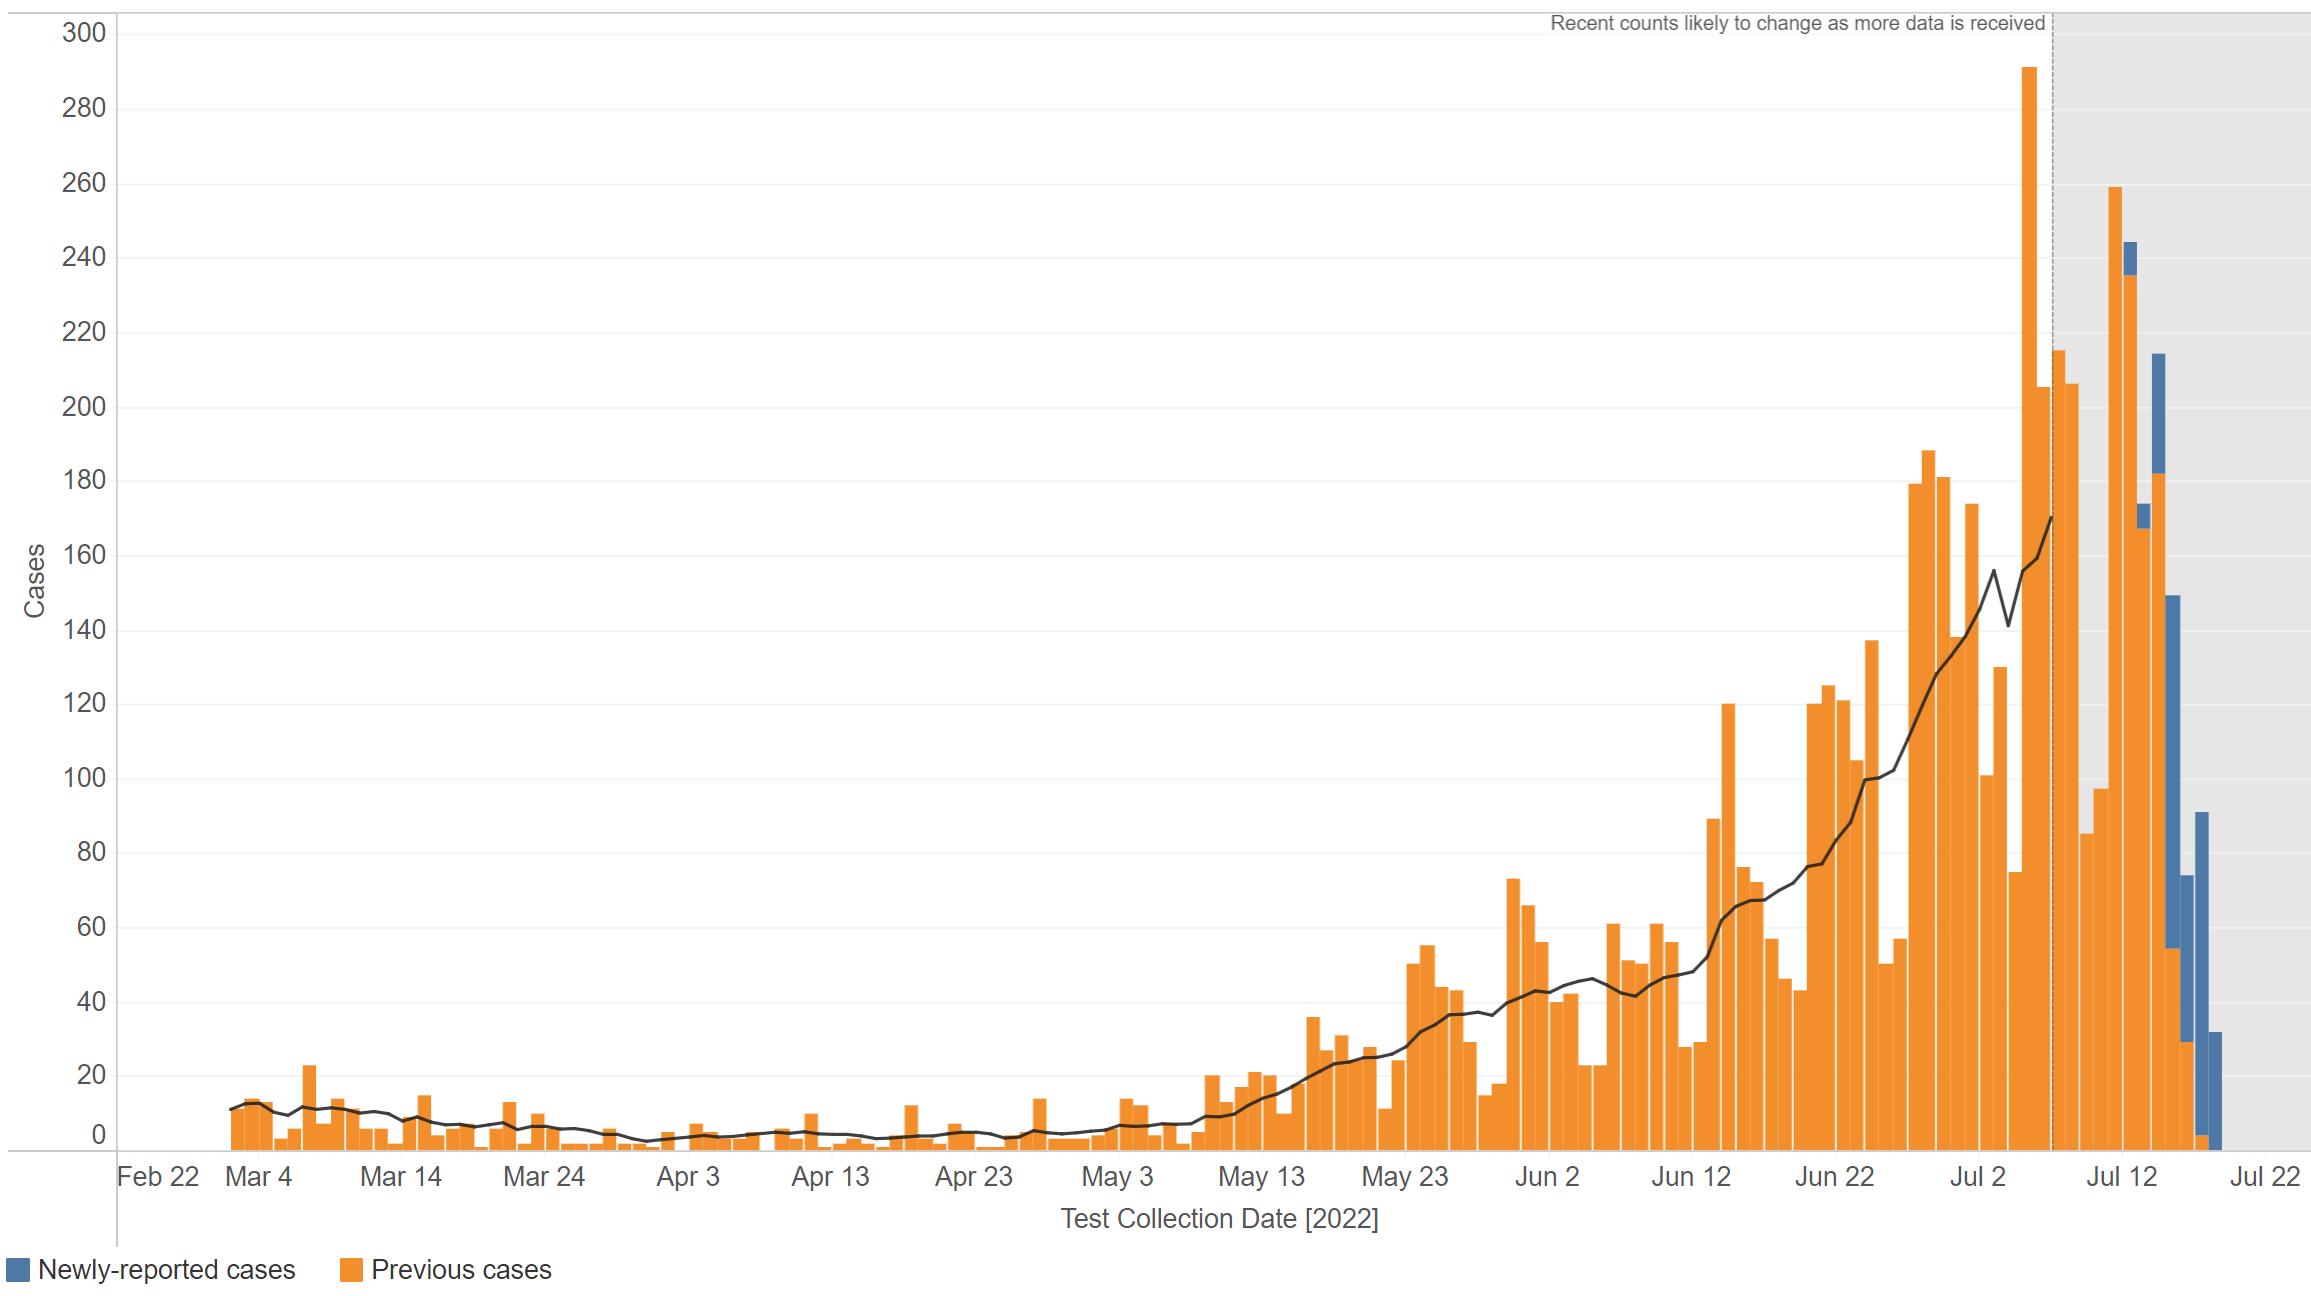
COVID-19 cases by collection date as of July 19, 2022 in Region 6 (Cenla).
Source: Louisiana Department of Health, COVID-19 Dashboard, https://ldh.la.gov/, July 19, 2022.
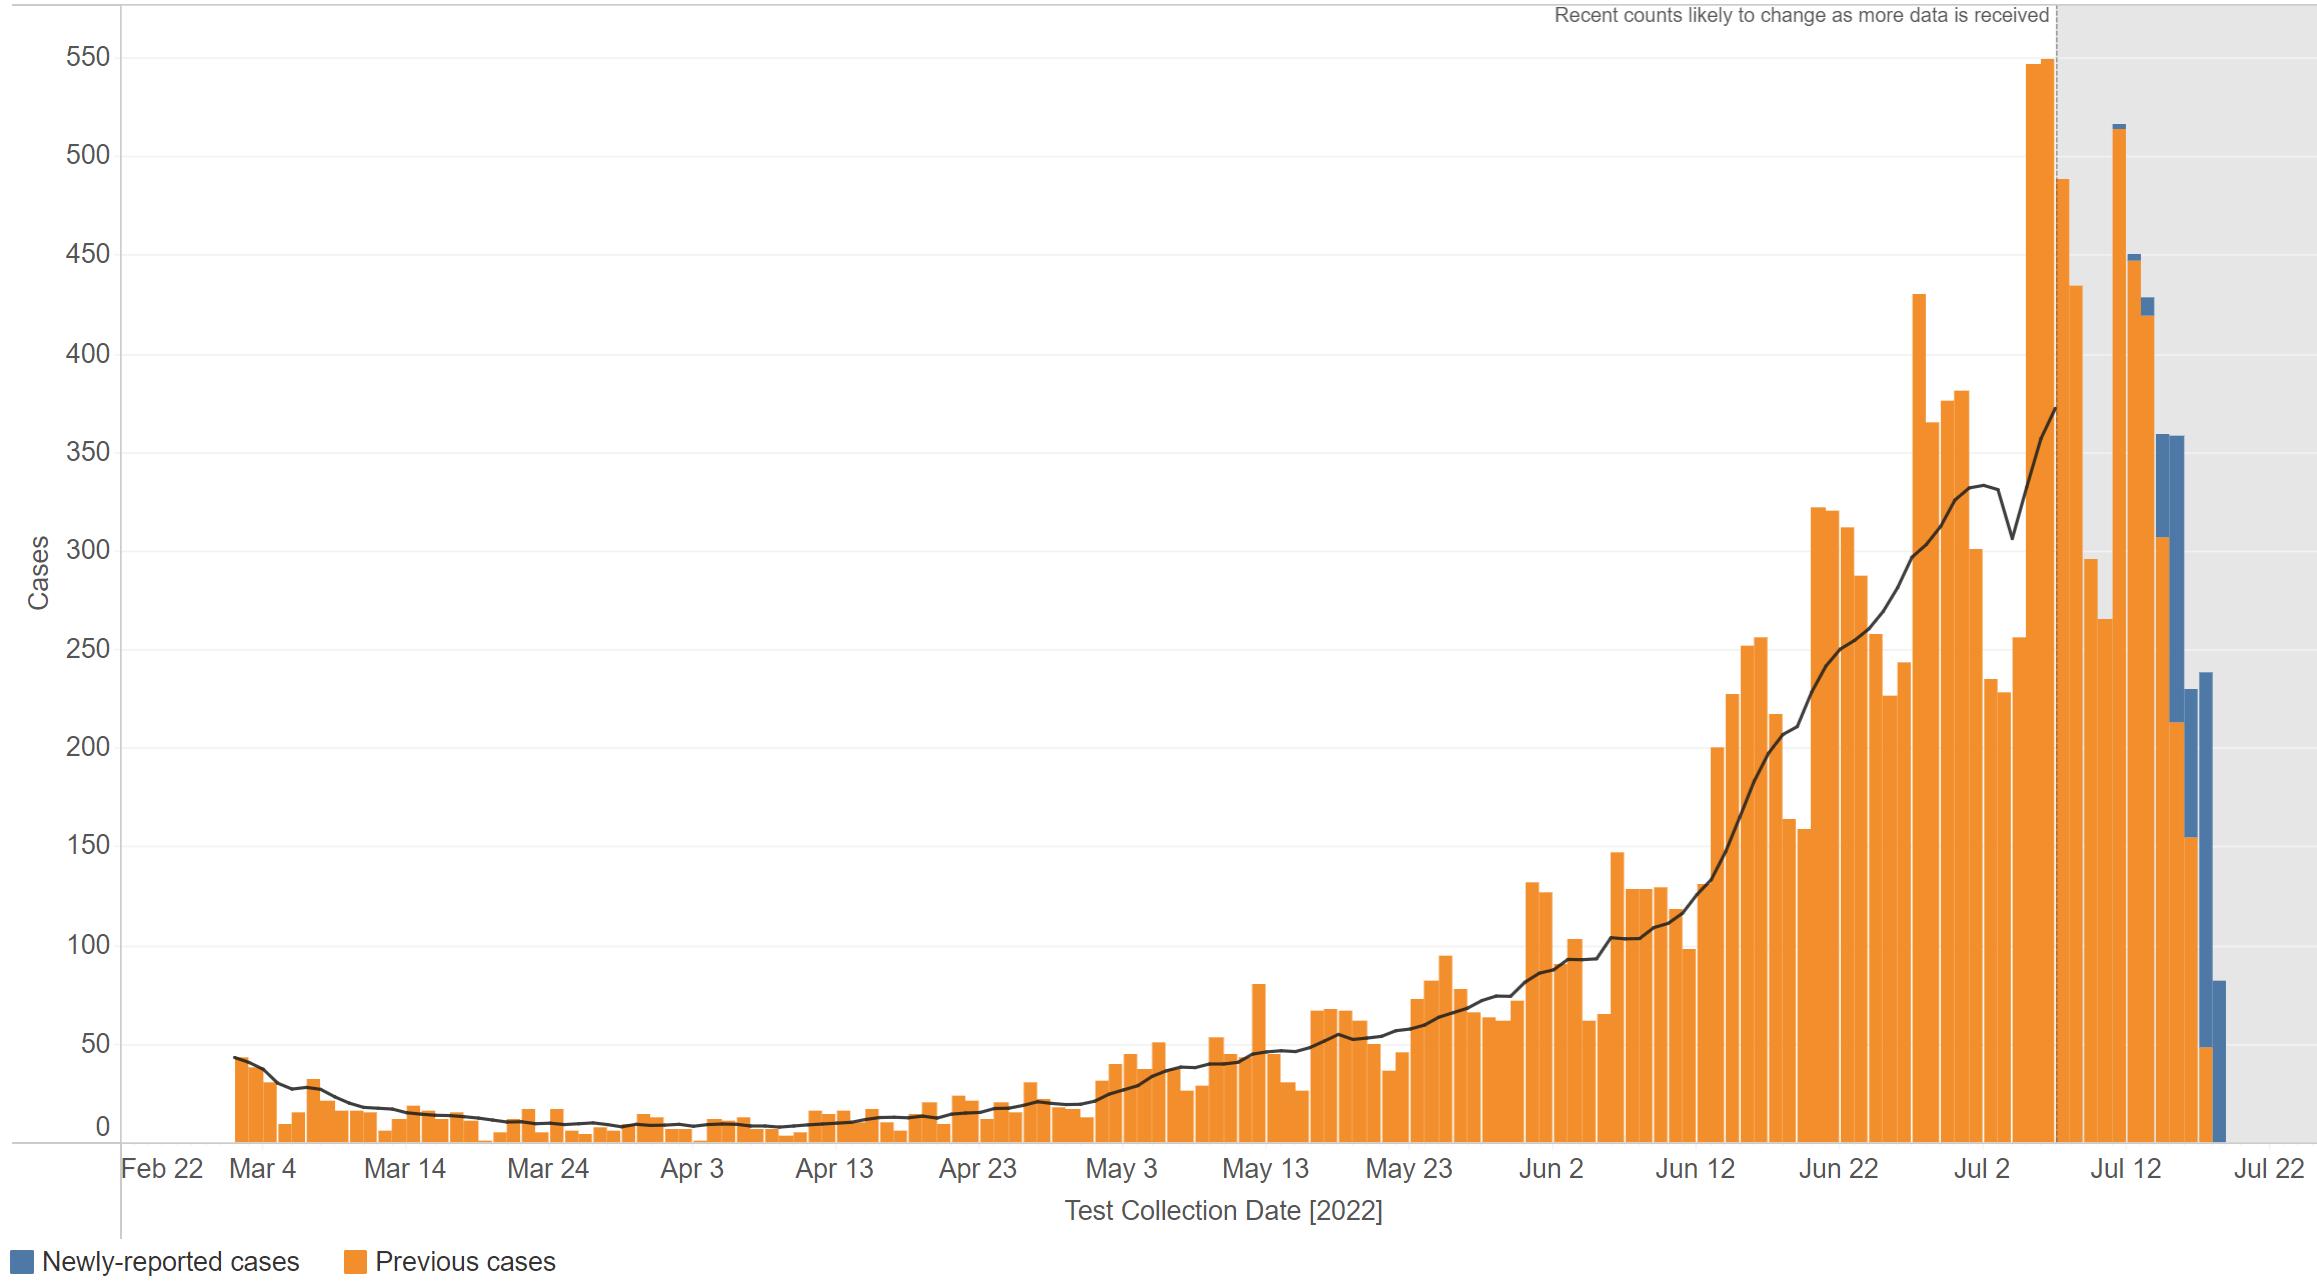
COVID-19 cases by collection date as of June 19, 2022 in Region 7 (Natchitoches).
Source: Louisiana Department of Health, COVID-19 Dashboard, https://ldh.la.gov/, July 19, 2022.
Cases over time by age group in Region 6 and Region 7 from March 6 to July 7, 2022.
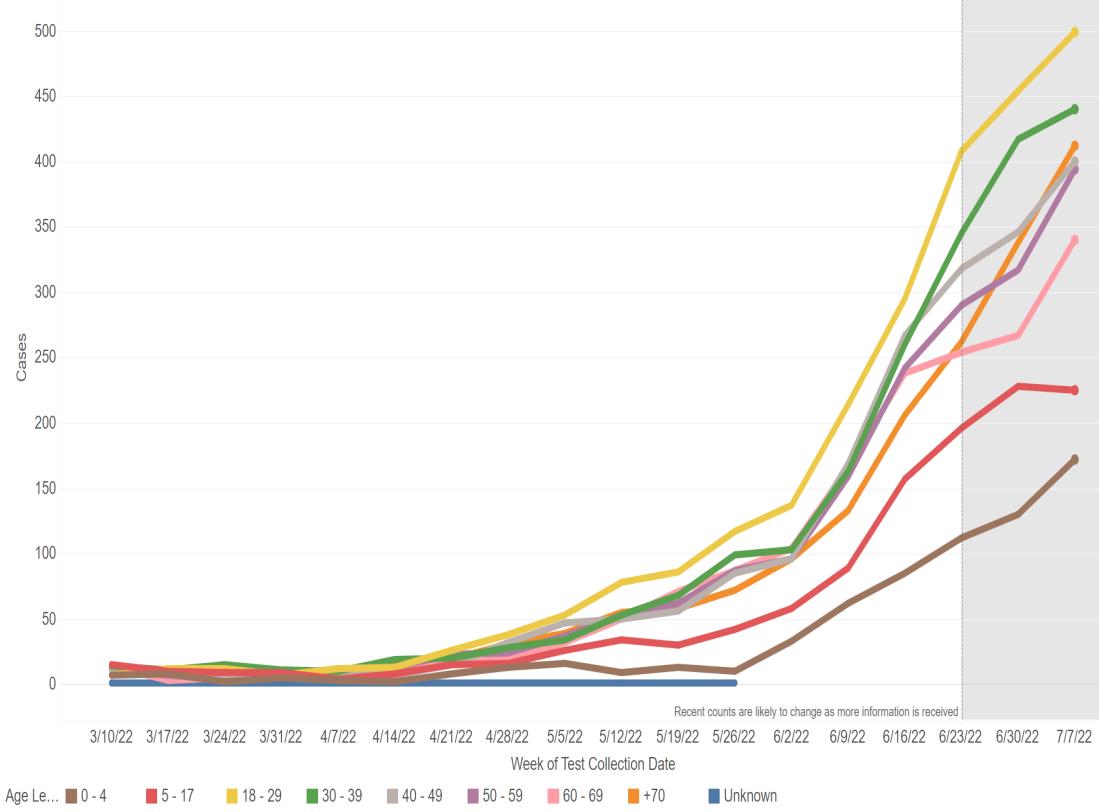
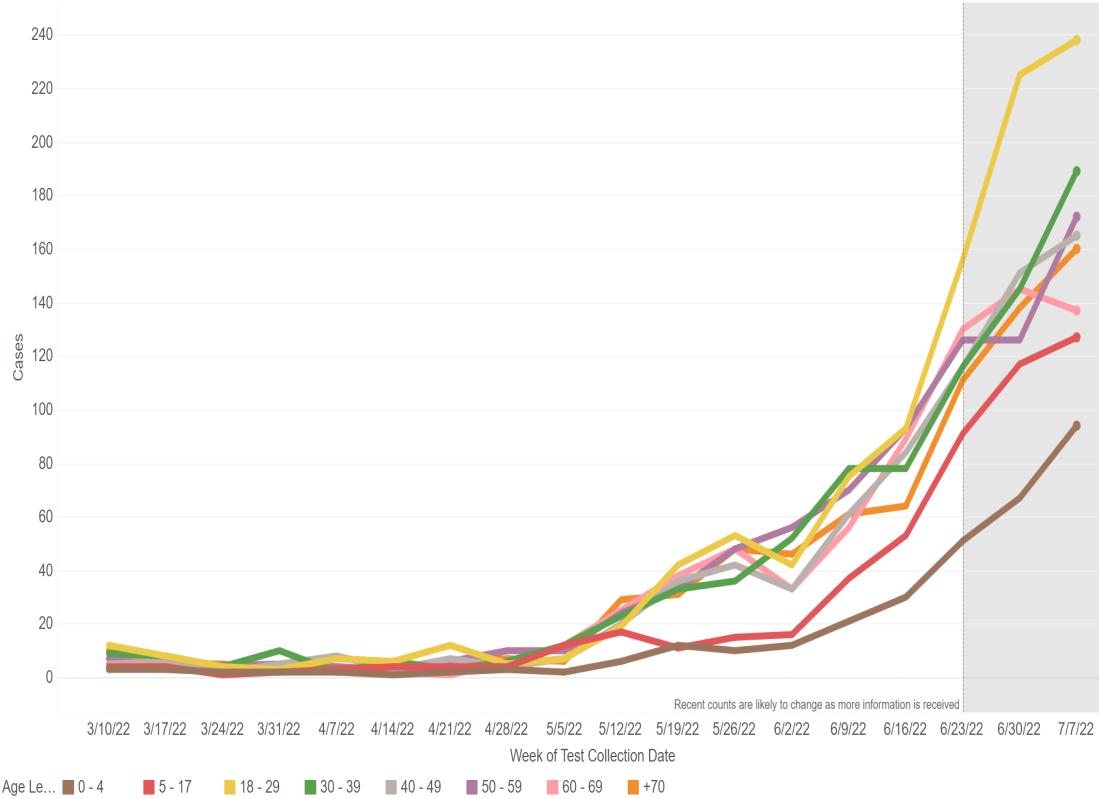
Central LA (Region 6) Natchitoches (Region 7)
Source: Louisiana Department of Health, COVID-19 Dashboard, https://ldh.la.gov/, July 20, 2022.
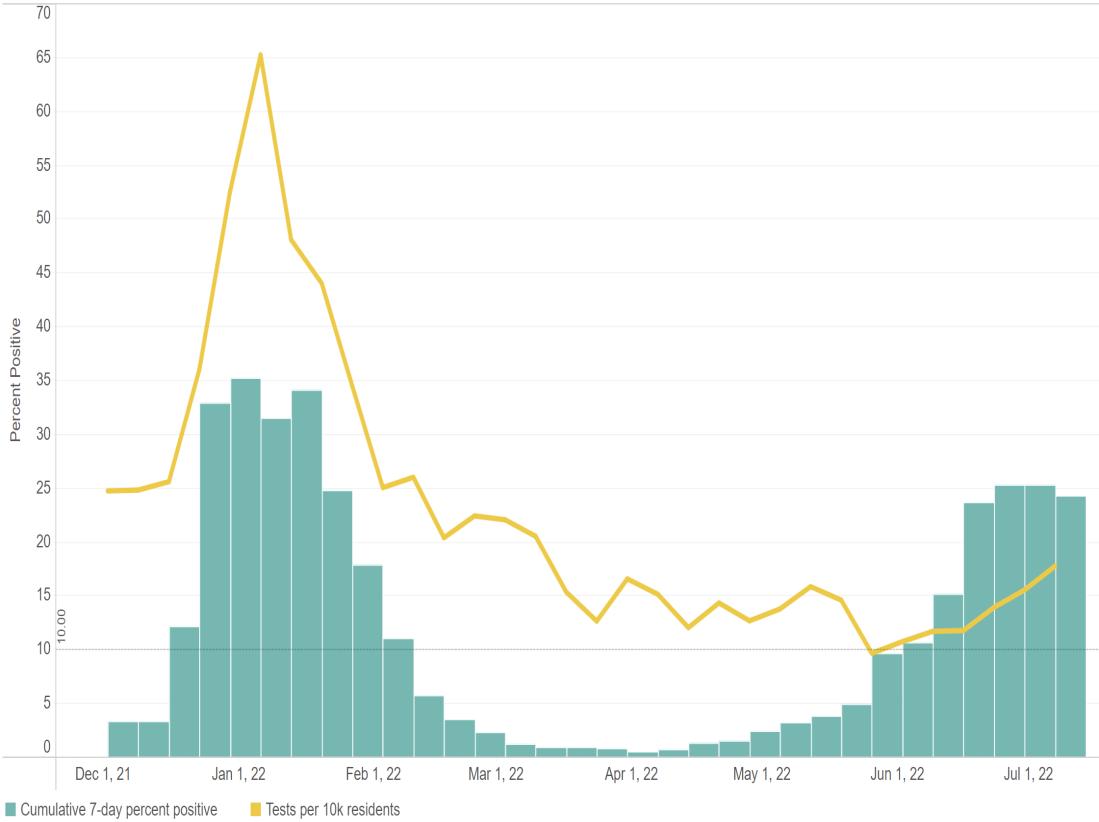
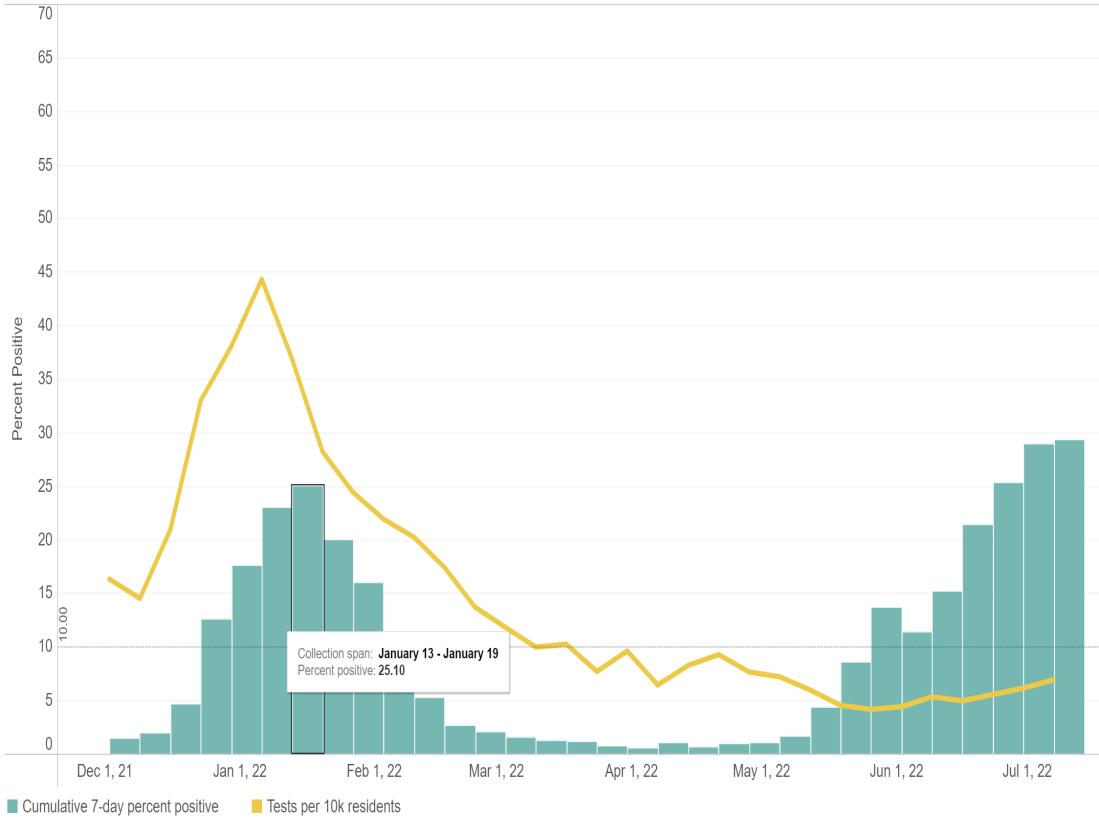
COVID-19 percent positive and test volume in Region 6 (Cenla) and Region 7 (Natchitoches) from December 1, 2021 – July 7, 2022.
Central LA (Region 6)
Source: Louisiana Department of Health, COVID-19 Dashboard, https://ldh.la.gov/, July 20, 2022.
Natchitoches (Region 7)
COVID-19 initial infections (blue) and reinfections (yellow) for Regions 6 & 7 from January 2 – July 20, 2022.
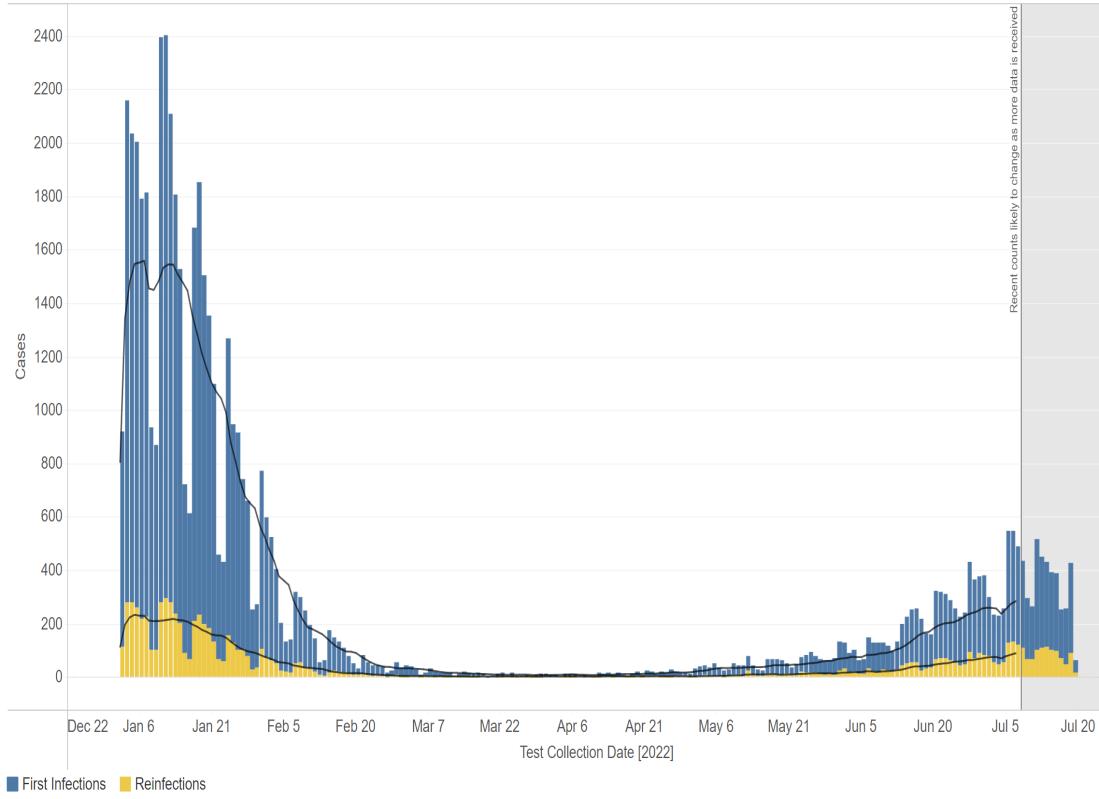
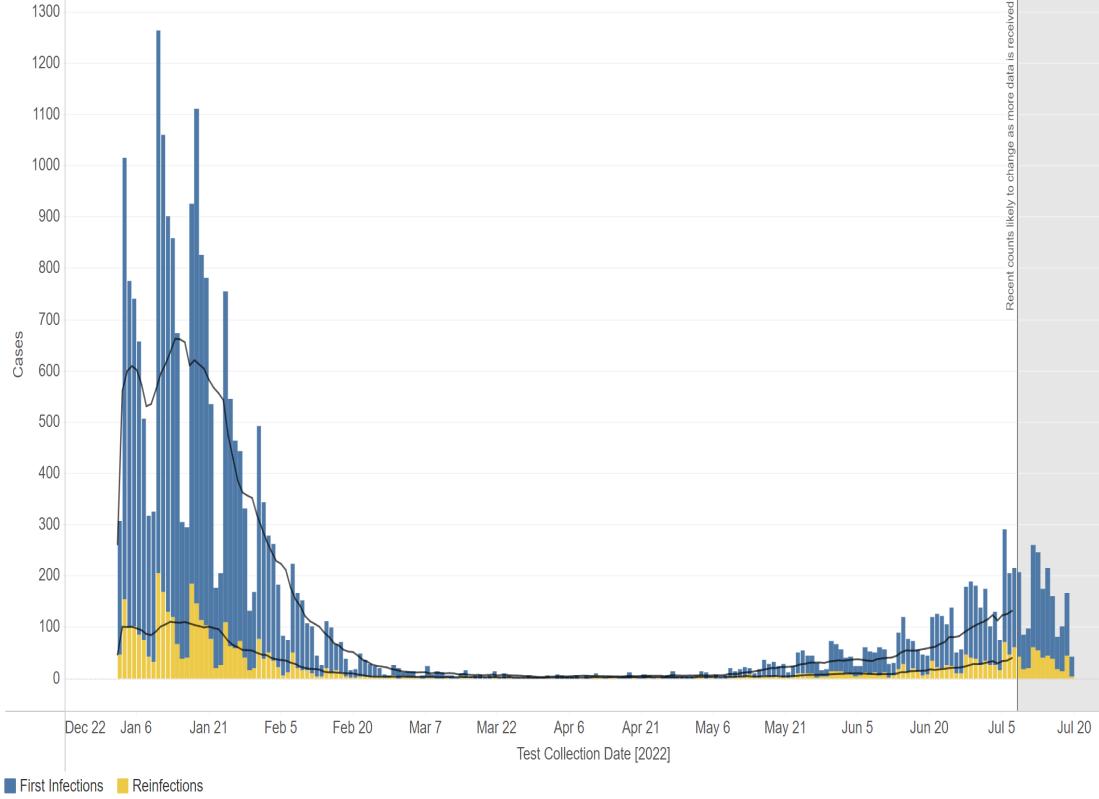
Central LA (Region 6)
Source: Louisiana Department of Health, COVID-19 Dashboard, https://ldh.la.gov/, July 20, 2022.
Natchitoches (Region 7)
Central Louisiana Economic Dashboard
Employed persons in the Alexandria MSA from 2020 – 2022.
Employed Persons in Alexandria, LA MSA
2020 - 2022
✓In May 2022, 63,284 were employed in the Alexandria metro area, a decrease of 172 from April. ✓Unemployment in Alexandria MSArose to 2.7% in May from 2.6% inApril.
Source: Louisiana Workforce Commission, July 20, 2022
Employed persons in Natchitoches parish from 2020 – 2022.
Employed
✓In May 2022, 16,297 were employed in Natchitoches parish exceedingApril’s level of 12,285.
Initial and continued unemployment claims in Louisiana from January 2022 to June 2022.


Unemployment Claims in Louisiana 2022
✓Initial unemployment claims increased for the fourth consecutive month. The average weekly initial unemployment claims filed in June increased 16% to 2,146 from 1,849 in May. ✓Statewide average weekly continued unemployment claims filed in June rose 17% to 11,537 from 9,827 a month earlier. This is the first rise in monthly continued claims this year.
Source: Louisiana Workforce Commission, July 20, 2022
The table below shows May 2022 preliminary unemployment rate, labor force, and employment data for central Louisiana parishes.
✓In May, parishes in central Louisiana had an unemployment rate of 3.4%, up from 3.2% in April.
✓May’s 3.4% unemployment rate for Cenla remained below the state’s 3.6% rate.
Data Source: Louisiana Workforce Commission, July 20, 2022.
The table below shows May 2022 preliminary unemployment rate, labor force, and employment data for Metropolitan Statistical Areas in the state.
✓
At 2.7%, theAlexandria MSAunemployment rate in May rose 0.1% but remained the lowest among the state’s major metro areas.
✓Louisiana’s unemployment rate rose 0.1% in May to 3.6%.
Data Source: Louisiana Workforce Commission, July 20, 2022.
The table below shows the number of unemployed, number of advertised jobs online, and the ratio of unemployed to advertised job openings online for Metropolitan Statistical Areas in Louisiana in May 2022.
✓
In May 2022, the Alexandria MSAlabor market reach an unemployed persons per job opening ratio of 0.25, meaning there were four job openings for every unemployed.✓Every metro area in the state had more job openings than unemployed. ✓The state ratio remain unchanged in May from a month earlier at 0.52.
The tables below shows employers with the highest number of job openings advertised online on July 20, 2022.
Central Louisiana Economic Dashboard
An overview of sales, vehicle sales, and hotel occupancy taxes collected in the June 2022 reflecting sales activity in May 2022, unless otherwise noted.
Notes: June tax revenue reflects sales activity in May. * Current month data are not available. Represents prior month. N/a = Not available
Data Source noted in detailed reports.

An overview of sales tax revenue collected in other Rapides Parish towns and cities in June 2022 (excluding Alexandria and Pineville).
Note: Current tax revenue reflects sales activity in prior month.
Data Source: Rapides Parish Police Jury Treasurer’s Reports, July 2022.


(TR) Alexandria total sales tax revenue collected in June with previous month, year, and YTD comparisons.
(BR) Alexandria total monthly sales tax revenue from 2020 to present.
Note: Current month sales tax revenue reflects sales activity in previous month.
Data Source: Rapides Parish Police Jury Treasurer’s Reports, July 2022.
Avoyelles Parish total sales tax revenue collected in June with previous month, year, and year-to-date comparisons. Vehicle and hotel tax revenues are excluded.
Note: Current sales tax revenue reflects sales activity in the previous month.
Data Source: Avoyelles Parish School Board. July 2022.
Avoyelles Parish vehicle sales tax revenue collected in June with previous month, year, and year-to-date comparisons.
Note: Current sales tax revenue reflects sales activity in the previous month.
Data Source: Avoyelles Parish School Board. July 2022
Catahoula Parish total sales tax revenue collected in June with previous month, year, and year-to-date comparisons.
Note: Current month sales tax revenue reflects sales activity in the previous month.
Data Source: Catahoula Parish Tax Administrator, July 2022
Concordia Parish total sales tax revenue collected in June with previous month, year, and year-to-date comparisons.
Note: Current month sales tax revenue reflects sales activity in the previous month.
Data Source: Concordia Parish Tax Administrator. July 2022
Evangeline Parish total sales tax revenue collected in June with previous month, year and YTD comparisons.
Note: Current sales tax revenue reflects sales activity in previous month. Evangeline implemented a 1% sales tax increase July 1, 2021.
Data Source: Evangeline Parish Sales Tax Commissioner. July 2022
Evangeline Parish vehicle sales tax revenue collected in June with previous month, year and YTD comparisons.
Note: Current sales tax revenue reflects sales activity in previous month. Evangeline implemented a 1% sales tax increase July 1, 2021.
Data Source: Evangeline Parish Sales Tax Commissioner. July 2022
(TR) Grant sales tax revenue collected in June with previous month, year, and YTD comparisons.
(BR) Grant monthly sales tax revenue from 2020 to present.
Note: March sales tax revenue reflects sales activity in February.
Data Source: Grant Parish Sheriff’s Office, July 2022.
La Salle Parish total sales tax revenue collected in June with previous month, year, and year-to-date comparisons.
Note: Current month sales tax revenue reflects sales activity in the previous month.
Data Source: La Salle Parish Tax Administrator, July 2022
(TR) Natchitoches sales tax revenue collected in June with previous month, year, and YTD comparisons.
(BR) Natchitoches monthly sales tax revenue from 2020 to present.
Note: June sales tax revenue reflects sales activity in May.
Data Source: Natchitoches Parish Tax Commission, July 2022.
(TR) Natchitoches vehicle sales tax revenue collected in May with previous month, year, and YTD comparisons.
(BR) Natchitoches monthly vehicle sales tax revenue from 2020 to present.
Note: May sales tax revenue reflects sales activity inApril. *June 2022 vehicle sales tax revenue was not available at time of publication.
Data Source: Natchitoches Parish Tax Commission, July 2022.

(TR) Pineville sales tax revenue collected in June with previous month, year, and YTD comparisons.
(BR) Pineville monthly sales tax revenue from 2020 to present.
Note: Current month sales tax revenue reflects sales activity in the prior month.
Data Source: Rapides Parish Police Jury Treasurer’s Reports, July 2022.
(TR) Rapides Parish sales tax revenue collected in June with previous month, year, and YTD comparisons.
(BR) Rapides monthly sales tax revenue from 2020 to present.
Note: Current sales tax revenue reflects sales activity in the prior month.
Data Source: Rapides Parish Police Jury Treasurer’s Reports, July 2022.
Rapides Parish vehicle sales tax revenue collected in June with previous month, year, and YTD comparisons.
Data Source: Rapides Parish Police Jury Treasurer’s Reports, July 2022.
St. Landry Parish sales tax revenue collected in June with previous month, year, and YTD comparisons.
Note: Current sales tax revenue reflects sales activity in prior month.
Data Source: Tax revenue data from St. Landry Parish School Board. July 2022
St. Landry Parish vehicle sales tax revenue collected in June with previous month, year, and YTD comparisons.
Note: Current sales tax revenue reflects sales activity in prior month.
Data Source: Tax revenue data from St. Landry Parish School Board. July 2022
Vernon Parish sales tax revenue collected in June with previous month, year, and year-to-date comparisons.
Data Source: Vernon Parish Sales Tax Department. July 2022.
Vernon Parish vehicle tax revenue collected in June with previous month, year, and year-to-date comparisons.
Data Source: Vernon Parish Sales Tax Department. July 2022.
Remote seller tax revenue is tax revenue from online sales by location of the seller at the time of purchase.
August 2020 - June 2022
✓The first half of 2022 saw $9.3 million in online sales taxes collected in Cenla compared to $8.3 million in 2021, a 12% increase.
SinceAugust 2020 when remote sellers tax revenue collection started, $31.1 million in sales tax revenue have been collected from online sales in central Louisiana.
Note: Sales tax revenue collected in May reflects sales activity in April.
Data Source: Louisiana Sales and Use Tax Commission for Remote Sellers.August 2020 – July 2022
Remote seller tax revenue by parish with month-over-month and year-over-year comparisons.
✓Total online sales tax revenue in Cenla in June 2022 increased 8% from a month earlier and is up 10% from June 2021.
✓YTD online sales are up 12% in central Louisiana.
Note: Sales tax revenue collected inApril reflects sales activity in March.
Data Source: Louisiana Sales and Use Tax Commission for Remote Sellers.August 2020 – July 2022
Remote sellers tax revenue from online sales in Avoyelles Parish from July 2020 – June 2022.
Note: Sales tax revenue collected in one month reflects sales activity in the prior month.
Data Source: Louisiana Sales and Use Tax Commission for Remote Sellers.August 2020 – July 2022

Remote sellers tax revenue from online sales in Evangeline Parish from July 2020 – June 2022.
Note: Sales tax revenue collected in one month reflects sales activity in the prior month.
Data Source: Louisiana Sales and Use Tax Commission for Remote Sellers.August 2020 – July 2022

Remote sellers tax revenue from online sales in Natchitoches Parish from July 2020 – June 2022.
Note: Sales tax revenue collected in one month reflects sales activity in the prior month.
Data Source: Louisiana Sales and Use Tax Commission for Remote Sellers.August 2020 – July 2022

Remote sellers tax revenue from online sales in Rapides Parish from July 2020 – June 2022.
Note: Sales tax revenue collected in one month reflects sales activity in the prior month.
Data Source: Louisiana Sales and Use Tax Commission for Remote Sellers.August 2020 – July 2022

(TR) Louisiana tax revenue from all sources for June with previous month, year, and YTD comparisons.
(BR) Louisiana monthly tax revenue from 2020 to present.
Central Louisiana Economic Dashboard
The valuation (estimated development cost) of new commercial construction permits issued by the City of Alexandria in June 2022 with previous month, year, and YTD comparisons.
The valuation (estimated development cost) of new residential construction permits issued by the City of Alexandria in June 2022 with previous month, year, and YTD comparisons.
This chart shows the valuation of permits issued by Rapides Area Planning Commission in Avoyelles Parish in June between 2019-2022 with month-to-month, year-to-year, and year-to-date comparisons.
Data Source: Rapides Area Planning Commission, July 2022.
This chart shows the valuation of permits issued by Rapides Area Planning Commission in Evangeline Parish in June between 2019-2022 with month-to-month, year-to-year, and year-to-date comparisons.
Data Source: Rapides Area Planning Commission, July 2022.
This table below shows the valuation of permits issued by the City of Natchitoches Planning and Zoning Office between 2019 – 2022 with month-to-month, year-to-year, and year-to-date comparisons.
Data Source: City of Natchitoches Planning and Zoning Office, July 2022.
This table and chart shows the valuation of permits issued by Natchitoches Parish Permit Office between 2021 – 2022 with month-to-month, year-to-year, and year-todate comparisons.
Data Source: Natchitoches Parish Permit Office, July 2022.
This chart shows the valuation of permits issued by Rapides Area Planning Commission in the City of Pineville in June between 2019-2022 with month-to-month, year-to-year, and year-to-date comparisons.
Data Source: Rapides Area Planning Commission, July 2022.
This charts shows the valuation of permits issued by Rapides Area Planning Commission in Rapides Parish (excluding Alexandria) in June between 20192022 with month-to-month, year-to-year, and year-to-date comparisons.
Data Source: Rapides Area Planning Commission, July 2022.
Central Louisiana Economic Dashboard
The chart represents the Lumber Price Index in the U.S. from January 2020 – June 2022.
▪ In June 2022, the US Lumber Price Index decreased -18% from May.
Currently, the Lumber Index stands -27% below a year ago.
Data Source: Fed Reserve Economic Database, St. Louis Federal Reserve Bank, July 214, 2022.
The count of active listings, median days on the market, average listing price, and median listing price for the Alexandria MSA for June 20192022 with month-to-month and year-over-year comparisons.
The count of active listings, median days on the market, average listing price, and median listing price for the Ft. Polk / Leesville market for June 2019-2022 with month-to-month and year-over-year comparisons.
The count of active listings, median days on the market, average listing price, and median listing price for the Natchitoches market for June 2019-2022 with month-to-month and year-over-year comparisons.
The count of active single-family and condo/townhome listings from 2019-2022 for Alexandria, Fort Polk (Leesville), Natchitoches, and Opelousas.
The median number of days property listings spend on the market from 2019-2022 for Alexandria, Fort Polk (Leesville), Natchitoches, and Opelousas.
The median listing price of houses from 2019-2022 for Alexandria, Fort Polk (Leesville), Natchitoches, and Opelousas.
The average listing price of houses from 2019-2022 for Alexandria, Fort Polk (Leesville), Natchitoches, and Opelousas.
Average Listing Price 2019-2022
Central Louisiana Economic Dashboard
Avoyelles Parish hotel occupancy tax revenue for June with previous month, year, and year-to-date comparisons.
Note: Current tax revenue reflects hotel occupancy activity in the previous month. Hotel occupancy tax revenue is used as a proxy for hotel occupancy rate.
Data Source: Avoyelles Parish School Board. July 2022.
Natchitoches Parish hotel occupancy tax revenue for June with previous month, year, and YTD comparisons.
Note: June tax revenue reflects hotel occupancy activity in May. Hotel occupancy tax revenue is used as a proxy for hotel occupancy rate.
Data Source: Natchitoches Parish Tax Administrator, July 2022.
Rapides Parish hotel occupancy tax revenue for June with previous month, year, and YTD comparisons.
Note: Current tax revenue reflects hotel occupancy activity in previous month. Hotel occupancy tax revenue is used as a proxy for hotel occupancy rate.
Data Source: Rapides Parish Police Jury Treasurer’s Reports, July 2022.
Vernon Parish hotel, motel, and RV occupancy tax revenue for June with previous month, year, and year-to-date comparisons. Data Source: Vernon Parish Sales Tax Department. July 2022.

Nationwide daily percentage of passengers passing through current TSA checkpoints in 2022 expressed as a percentage of traffic in 2019.
U.S. Airport Passenger Throughput Traffic in 2022 as a Percent of Traffic from 2019
✓Nationally, air passenger traffic in June 2022 increased 4.8% from May.
✓Last month, air passenger traffic remained -11% below 2019 levels.
U.S. air passenger traffic YTD in 2022 was down -13% from 2019.
Data Source: DHS, Transportation SecurityAdministration, https://www.tsa.gov/coronavirus/passenger-throughput, July 13, 2022

Weekly retail price of gasoline in the Gulf Coast region for all formulations from 2020 - 2022.
Weekly Retail Gasoline Price All Formulations in Gulf Coast Region 2020-202
▪ Gasoline peaked on June 13 at $4.63 a gallon.As of July 11, the price fell to $4.19.
▪ June 2022 retail gasoline price in Gulf Coast region average $4.57/gal. compared to $2.74 in 2021, a 67% increase.
Data Source: U.S. Energy Information Administration, Prices, Sales Volumes & Stocks by State, July 13, 2022
Central Louisiana Economic Dashboard


The chart below represents the weekly number of new businesses applications in Louisiana from 2020-2022
New business applications in Louisiana in June 2022 increased 5% from May 2022, but are down -9% from June 2021. YTD, business applications in Louisiana are down -17%, 46,532 compared to 55,858.
Note: Data reflects businesses applications, not necessarily business formations.
Data Source: U.S. Census Bureau, Business Formation Statistics, Retrieved July 14, 2022.
The chart below represents the number of new businesses established each month in Rapides from January 2019 through June 2022.


✓The number of new businesses established in Rapides in June 2022 increased 44% from May but remains 14% below the previous year.
✓Year-to-date, 226 new businesses have been created in Rapides in 2022, compared to 269 in 2021, representing a 16% decline.
Note: Data reflects businesses established in the current month.
Data Source: Rapides Parish Sales and Use Tax Department, July 2022.
Rapides Parish occupational license revenue YTD with previous YTD comparisons.
Note: Rapides Parish reflects unincorporated areas. Data reflects licenses paid year-to-date.
Data Source: Rapides Parish Police Jury Treasurer’s Reports, July 2022.
The Coincident Economic Activity Index for Louisiana is set to match the trend in the gross state product and includes four indicators: nonfarm payroll employment, the unemployment rate, average hours worked in manufacturing and wages and salaries. The column graph below represents the percentage change in the index. A positive percentage represents an expanding statewide economy.
In May 2022, the Index was 108.24 compared to 107.99 in April 2022.
▪ The Index remains below the January 2020 level of 108.35 and below the previous peak of 109.27 in September 2019.
Represents the number of drilling rigs actively exploring for or developing oil or natural gas in Louisiana and the U.S. in 2020-2022.
Rig Count in Louisiana & US 2020-2022
21


✓Average rig count in Louisiana fell by 1 rigs in June from May.
✓Nationwide, the rig count rose from 464 a year ago to 738 in June, an increase of 59%.
Source: Baker Hughes, https://rigcount.bakerhughes.com/na-rig-count, July 11, 2022
Gaming revenue in Louisiana for May 2022 with previous month and year comparisons.
May 2022
* Note: Year-to-Date percentage reflects calendar year.
Data Source: Louisiana Gaming Control Board, July 11, 2022. http://lgcb.dps.louisiana.gov/revenue_reports.html
The data presented throughout the CENLA Economic Dashboard reflects contributions from the following local organizations.
Also, special thanks to the following partners for distributing the dashboard.
• Rapides Parish Policy Jury Treasurer
• Rapides Sales TaxAdministrator
• Avoyelles Parish School Board
• Alexandria International Airport
• Alexandria / Pineville Area CVB
• RapidesArea Planning Commission
• City ofAlexandria Planning Division
• Evangeline Parish Sales Tax Commissioner
• Concordia, Catahoula, & La Salle TaxAdministrator
• Louisiana Office of Public Health
• St. Landry Parish School Board
• Grant Parish Sheriff’s Office
• Natchitoches Parish Tax Commission
• Natchitoches Parish Planning and Zoning
• City of Natchitoches Planning
• Vernon Parish Sales Tax Department
• LSUA Foundation
• Central Louisiana Regional Chamber of Commerce
• Marksville Chamber of Commerce
• Bunkie Chamber of Commerce
• Evangeline Chamber of Commerce
• Concordia Chamber of Commerce
• Greater Vernon Chamber of Commerce
• Natchitoches Chamber of Commerce
• Next Issue: Week of August 22, 2022