June 23, 2022


June 23, 2022
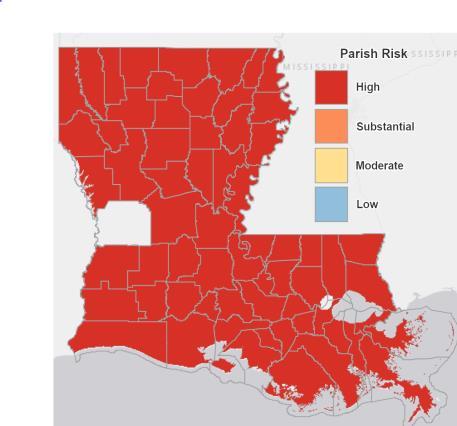
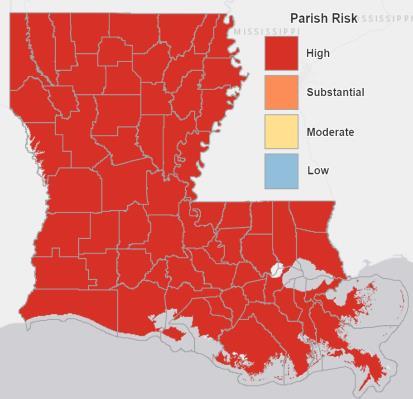
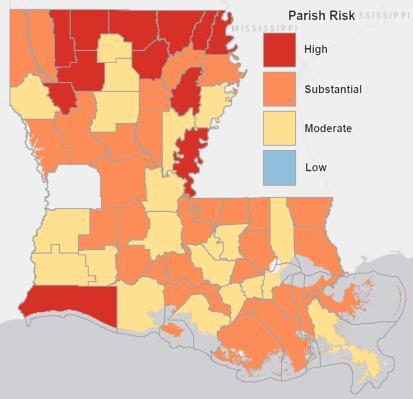
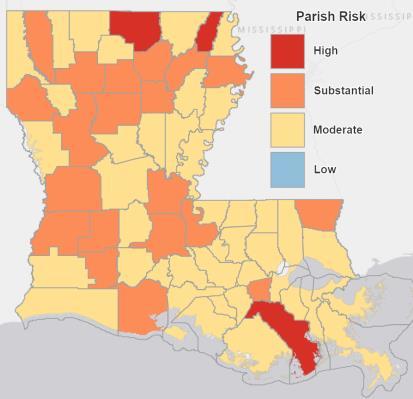
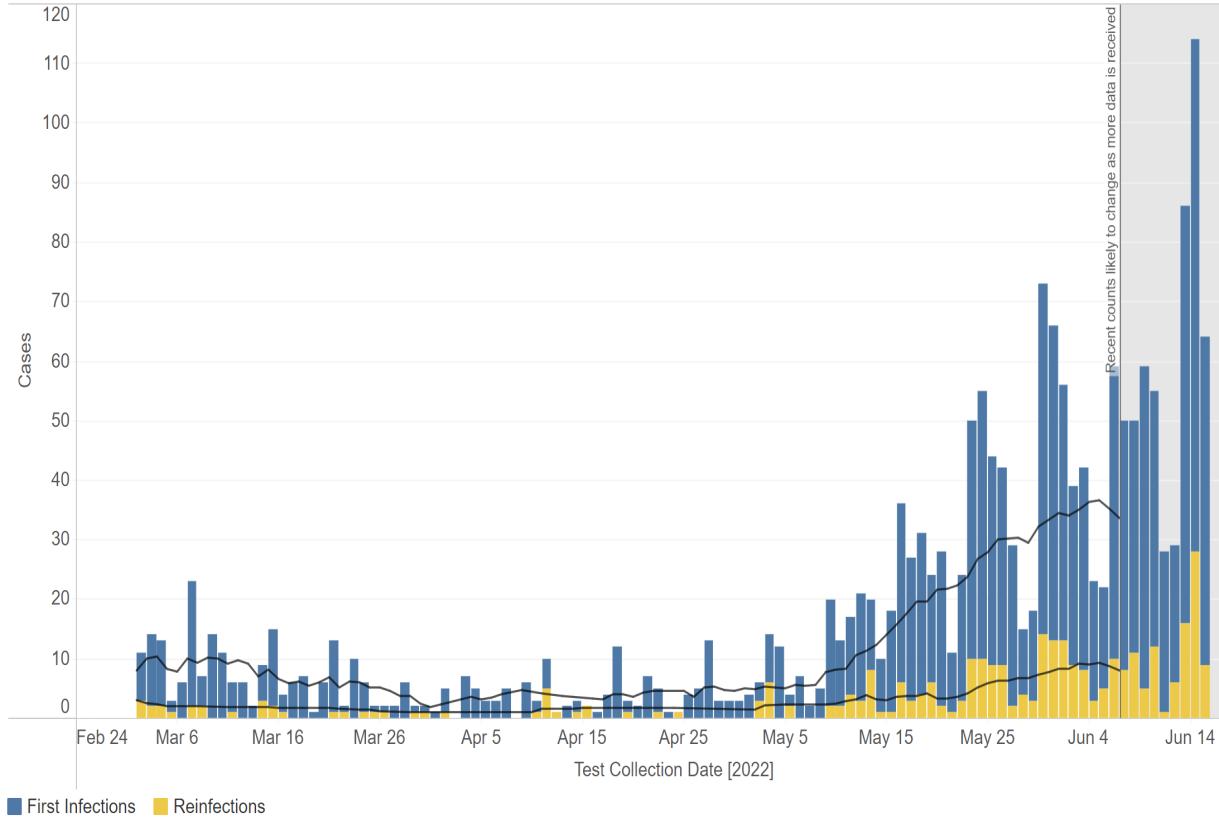
In mid-May nearly every parish in Louisiana was at a low level of risk for Covid, other than Orleans. Cases of Covid in the New Orleans are now moderate, but the Shreveport area is now rated high risk. Most of central Louisiana is rated at a moderate risk level with uptrends in Regions 6 & 7 as shown in the initial cases and reinfections charts.
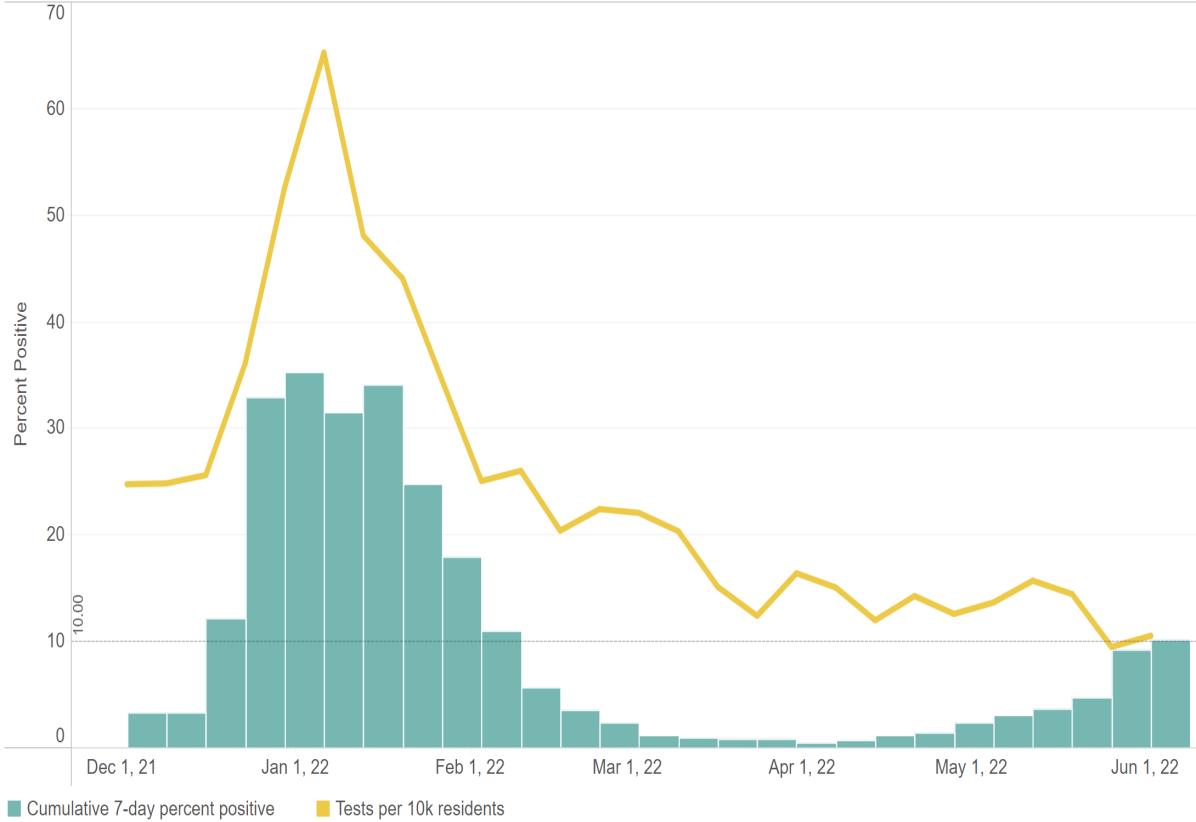
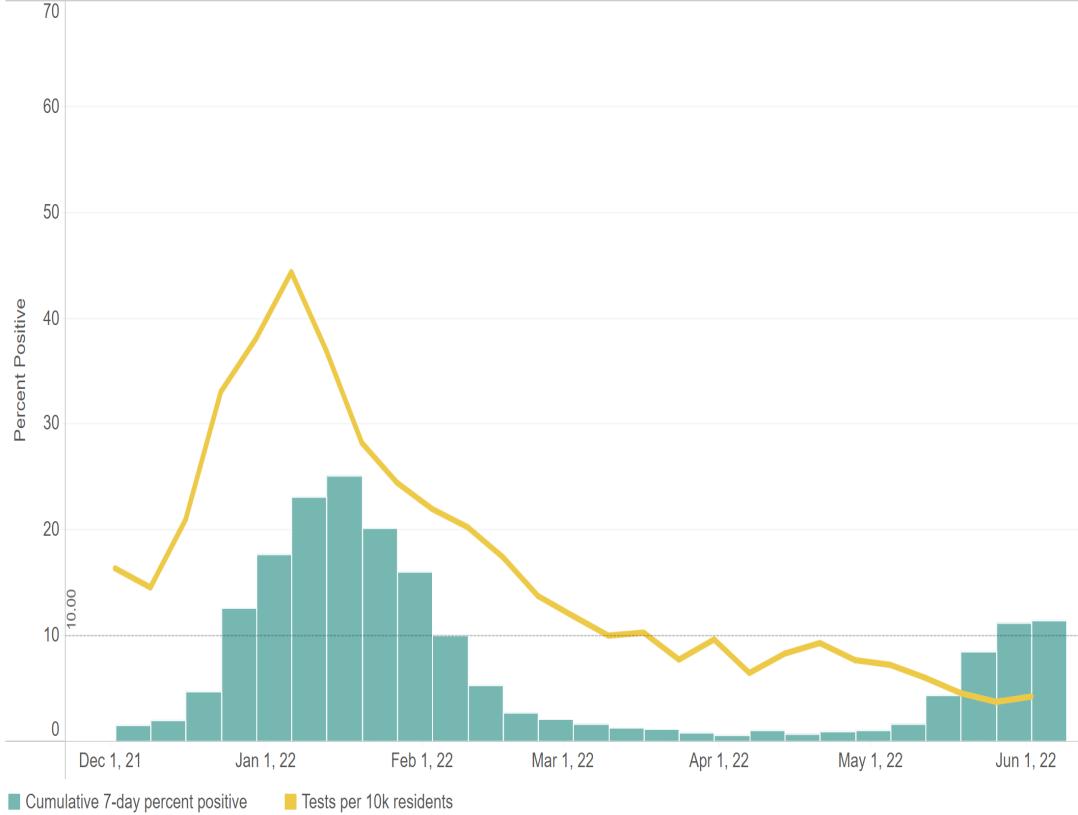
For the period from June 2 - 8, Louisiana had a positivity rate of 13.6% compared to 11.4% in Region 6 and 10.1% in Region 7. In mid-May, the positivity rates stood at 1.7% and 3.0%, respectively. 18 -29 year-olds and 30-39 yearolds are currently leading the uptrend.
In April, the Alexandria metro area set another post-pandemic high in employment, the fourth record high in five months. In April 2022, 63,456 were employed in the Alexandria metro area, an increase of 229 from March.
Alexandria’s employment level is 7,868 above the pandemic low of 55,588 reached in May 2020. In April 2022, 16,285 were employed in Natchitoches parish. While this level exceeds the preliminary March 2022 level of 16,257, the final March employment figure was revised upward to 16,461, therefore showing a slight decline in April.
At 2.6%, the Alexandria MSA unemployment rate in April was the lowest among the state’s major metro areas. Unemployment in Natchitoches parish fell to 3.0% in April from 3.2% in March. April’s 3.2% unemployment rate for central Louisiana compared favorably to the state’s 3.5% rate.
Statewide the unemployed to job openings ratio is 0.52 meaning there are two openings for each unemployed. Alexandria’s status as the tightest labor market in the state has not changed. Locally, there are four job openings for each unemployed.

Sales tax data are used to measure changes in consumer spending. Sales taxes collected in May reflect sales activity in April. Consumer spending in April when compared to March was down in all twelve Cenla jurisdictions reporting, with declines ranging from -6% to -31%. However, YTD all jurisdiction except Catahoula are ahead of last year. April vehicle sales are mixed across all three time horizons when compared to March.
Online shopping in central Louisiana in April fell -9% from March, but is up 17% over a year ago. Year-to-date every jurisdiction in central Louisiana is reporting higher online sales, with the region averaging a 13% YTD increase.
Hotel occupancy, as measured by the hotel tax, was mixed for Avoyelles, Rapides, and Vernon. Only Natchitoches saw month-over-month (M/M), year-over-year (Y/Y), and year-to-day (YTD) increases in April. Vernon posted a 34% gain while Natchitoches posted 12%.
Nationally, air passenger traffic in May 2022 edged up 2.5% over April, but remains -10% below May 2019, the last “normal” timeframe for comparison purposes. For the first five months of 2022, US air passenger traffic is -14% below 2019. Gasoline sales data for Louisiana lags two months. Gasoline sales in Louisiana in March, the latest available data, were up 0.3%, but -3% below March 2021. Nevertheless, YTD sales in March are running 3% higher than a year ago. The impact of higher prices on gasoline sales is becoming evident, but not substantial through March. However, sustained higher prices going into the Summer are expected to lower sales.
June 23, 2022 CENLA Economic Dashboard
Because of the volatility of monthly data, year-to-date permit (YTD) valuations present a clearer picture of local construction. Permit data for the City of Alexandria was unavailable this month. So far in 2022, Pineville has seen a 112% increase in permit valuations. while Avoyelles has increased 107%. Natchitoches parish and the City of Natchitoches have year-to-date valuations up 64% and 24%, respectively. Evangeline permits are down -41% year-to-date. Rapides’ underperformance is largely the result of an outstanding 2021, which is unlikely to be repeated in 2022. Otherwise Rapides’ permits are comparable to previous years.
The May 2022 the US Lumber Price Index increased 2.7% from April. April 2022 prices marked was the first decline after six consecutive monthly increases. Currently, the Index stands -13% below a year ago. Housing data for Alexandria, Natchitoches, and Ft. Polk/Leesville are now included in the Dashboard.
The median and average listing price of homes are up in Alexandria, Leesville/Ft. Polk, and Natchitoches on a monthly basis. Active listings climbed significantly in May in the Alexandria market, but fell considerably in Natchitoches. Median days on the market rose in all three cities, with Leesville/Ft. Polk posting a 42% increase. A lengthening of days on the market indicates a slow down, most likely the result of rising mortgage rates in this case.
The number of new businesses established in Rapides in May 2022 fell -36% from April and is -56% below the previous year. Statewide, new business applications in May 2022 decreased -10% from April 2022 and are down -39% from May 2021.
 Central Louisiana Economic Dashboard
November 14, 2021
December 18, 2021
January 17, 2022
February 16, 2022
March 18, 2022
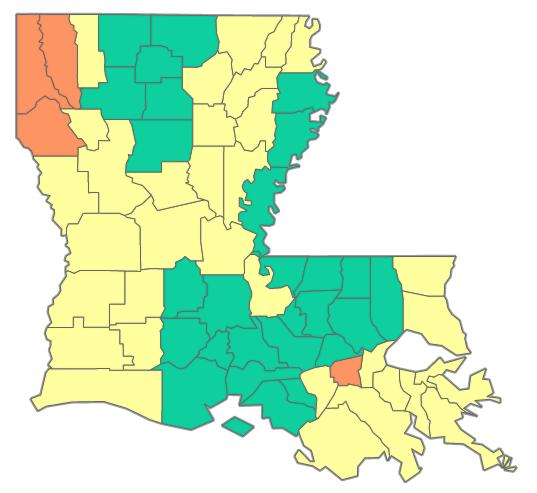
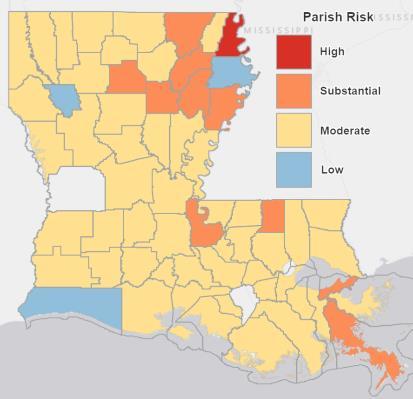
COVID-19 statewide risk by parish over time. Source: Louisiana Office of Public Health, June 20, 2022.
April 16, 2022
May 19, 2022
June 20, 2022
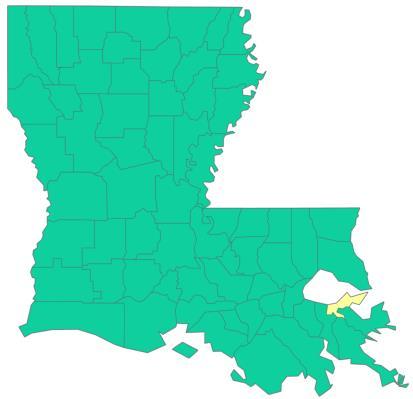
COVID-19 vaccinations as a percent of region population as of June 19, 2022.
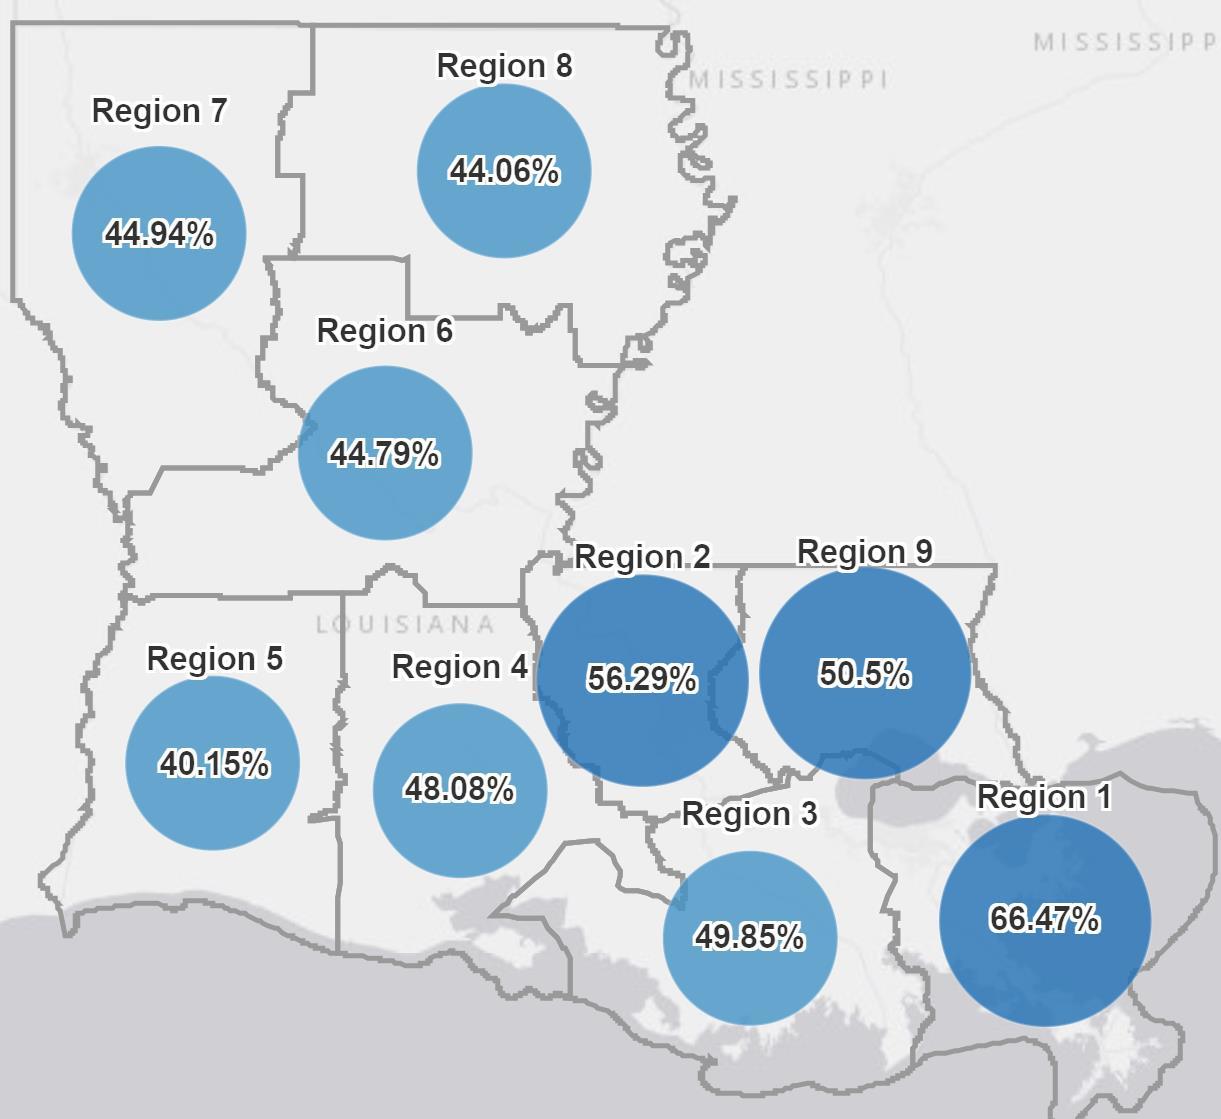
Region 6 has 44.8% of the population vaccinated as of June 19, up from 44.6% on May 20.
Region 7 has a 44.9% of the population vaccinated as of June 19, up from 44.7% on May 20.
Source: Louisiana Office of Public Health, https://ldh.la.gov/covidvaccine, June 19, 2022
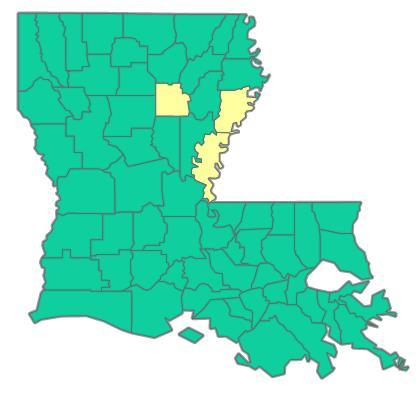
COVID-19 vaccinations as a percent of parish population as of June 19, 2022.
Rapides and Avoyelles have the highest percentage of completed vaccinations in mid-June in Region 6 at 49.9% and 47.7%, up from 49.7% and 47.5% a month earlier.
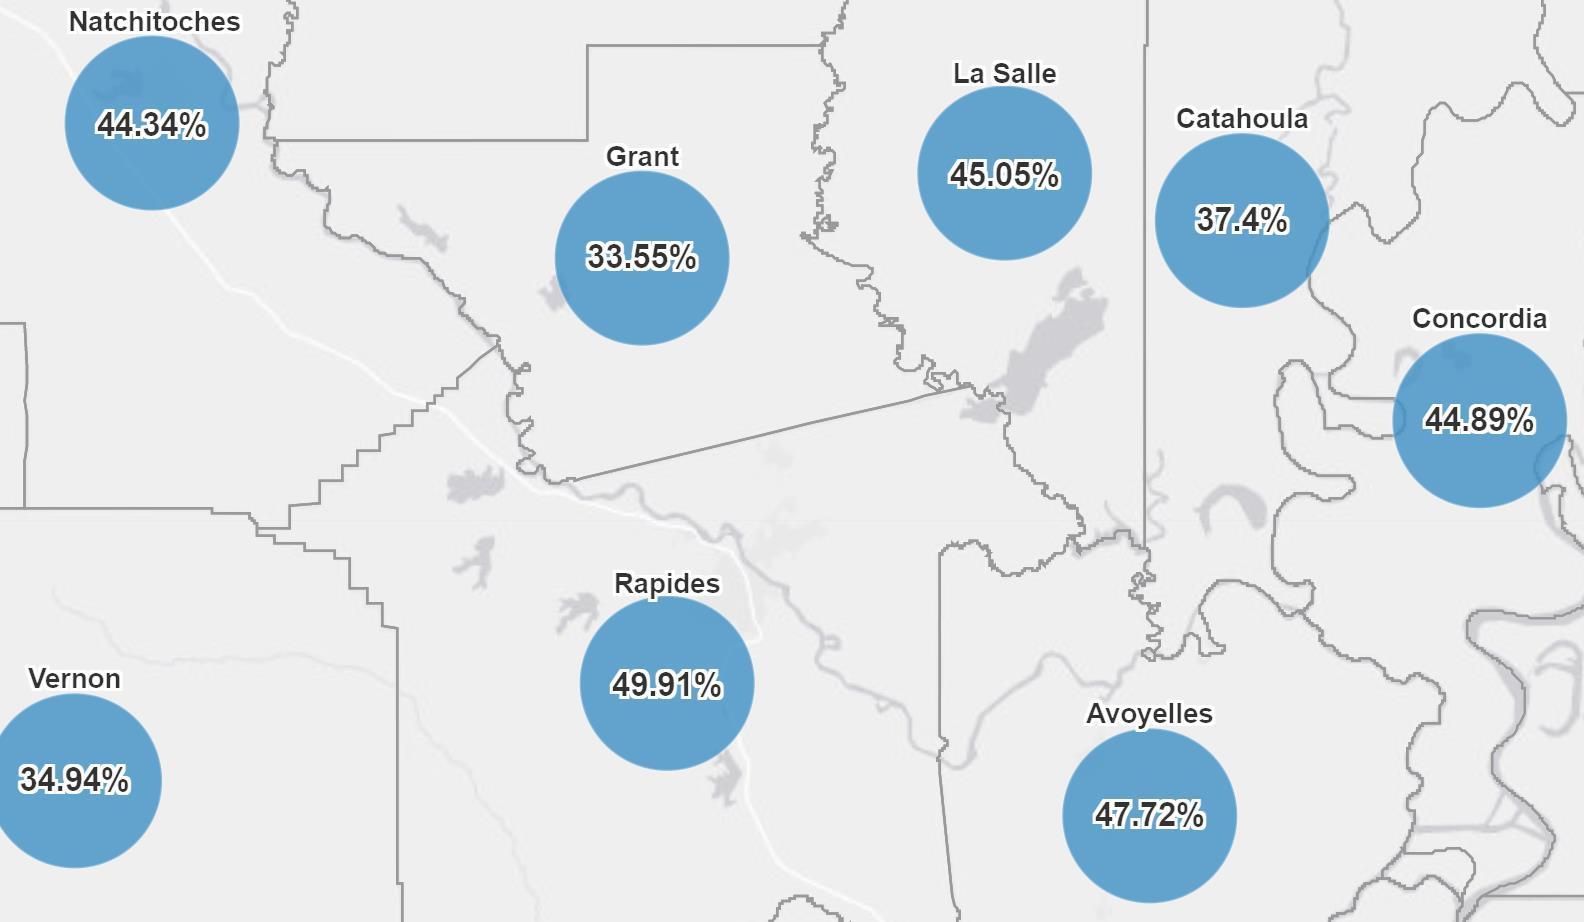
Source: Louisiana Office of Public Health, https://ldh.la.gov/covidvaccine, June 19, 2022
COVID-19 vaccinations as a percent of parish population as of June 19 2022.
Caddo and Bossier have the highest percentage of completed vaccinations in mid-June in Region 7 at 46.7% and 45.3%, respectively.
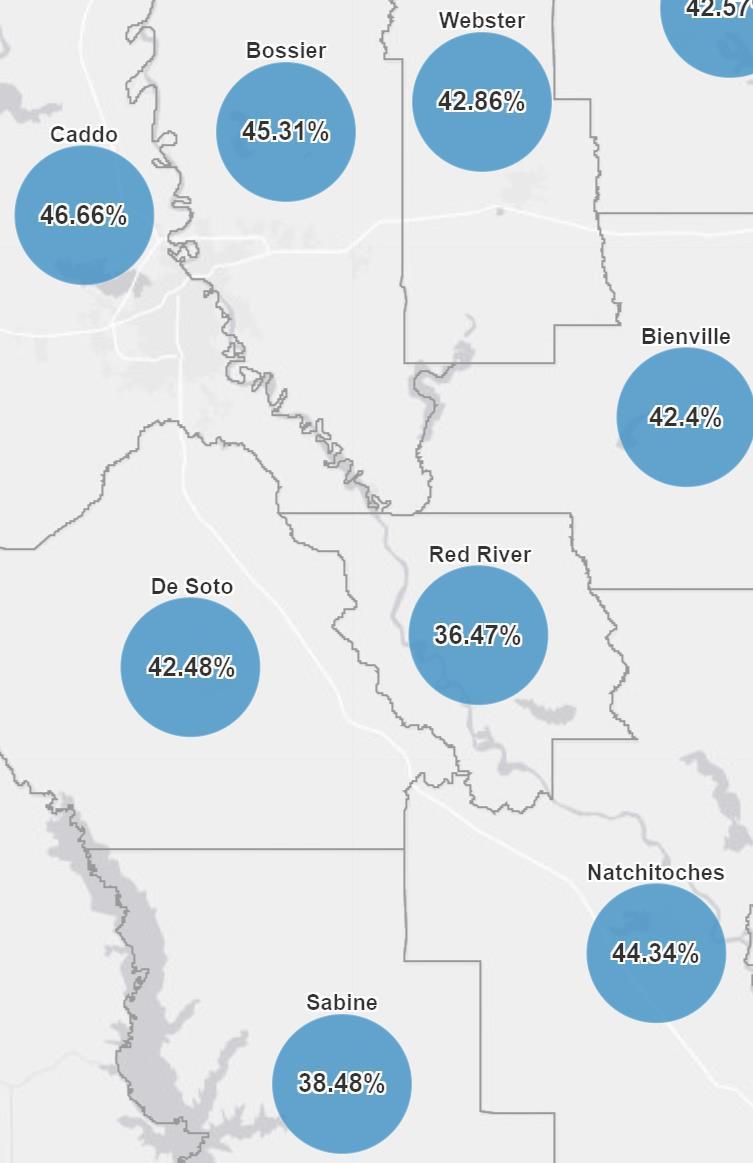
Natchitoches is ranked third at 44.3%.
Source: Louisiana Office of Public Health, https://ldh.la.gov/covidvaccine, June 19, 2022
COVID-19 cases by collection date as of June 19, 2022 in Region 6 (Cenla) compared to all regions in the state with a 7-day moving average.
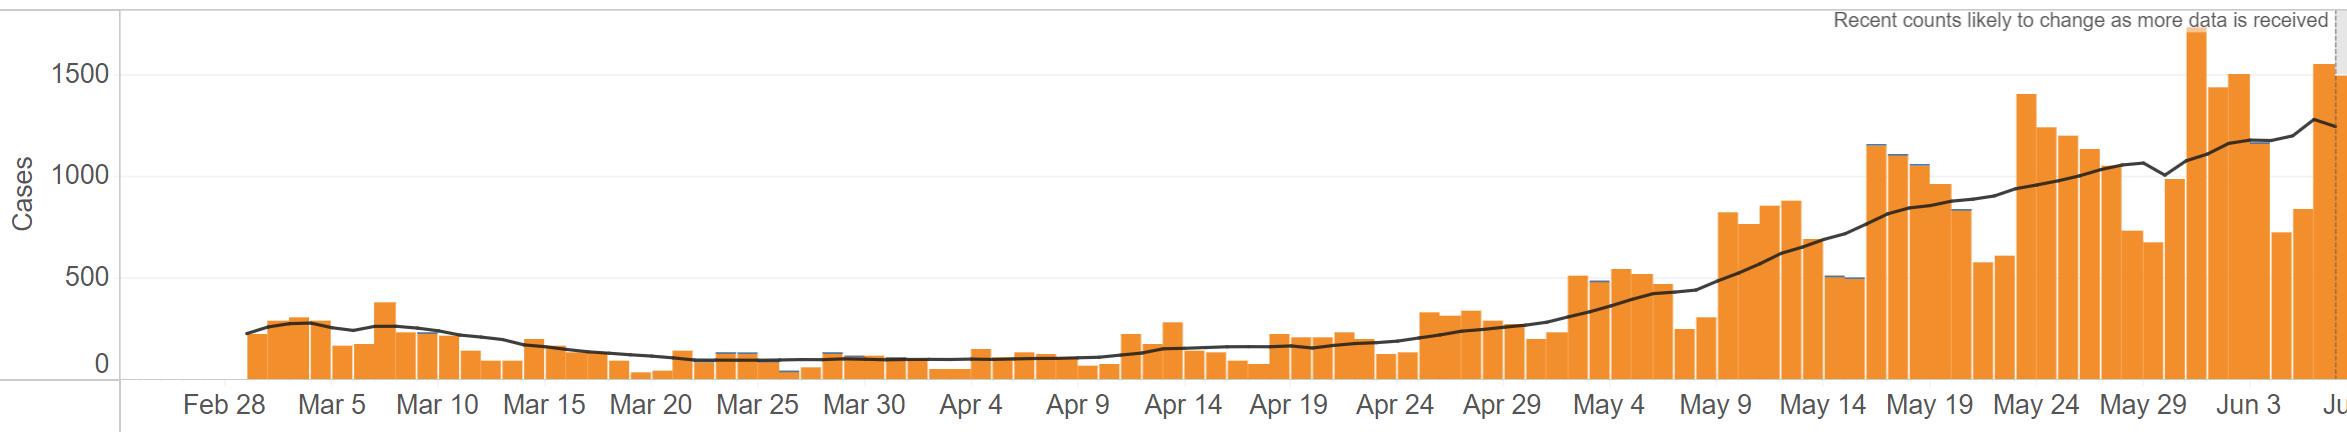
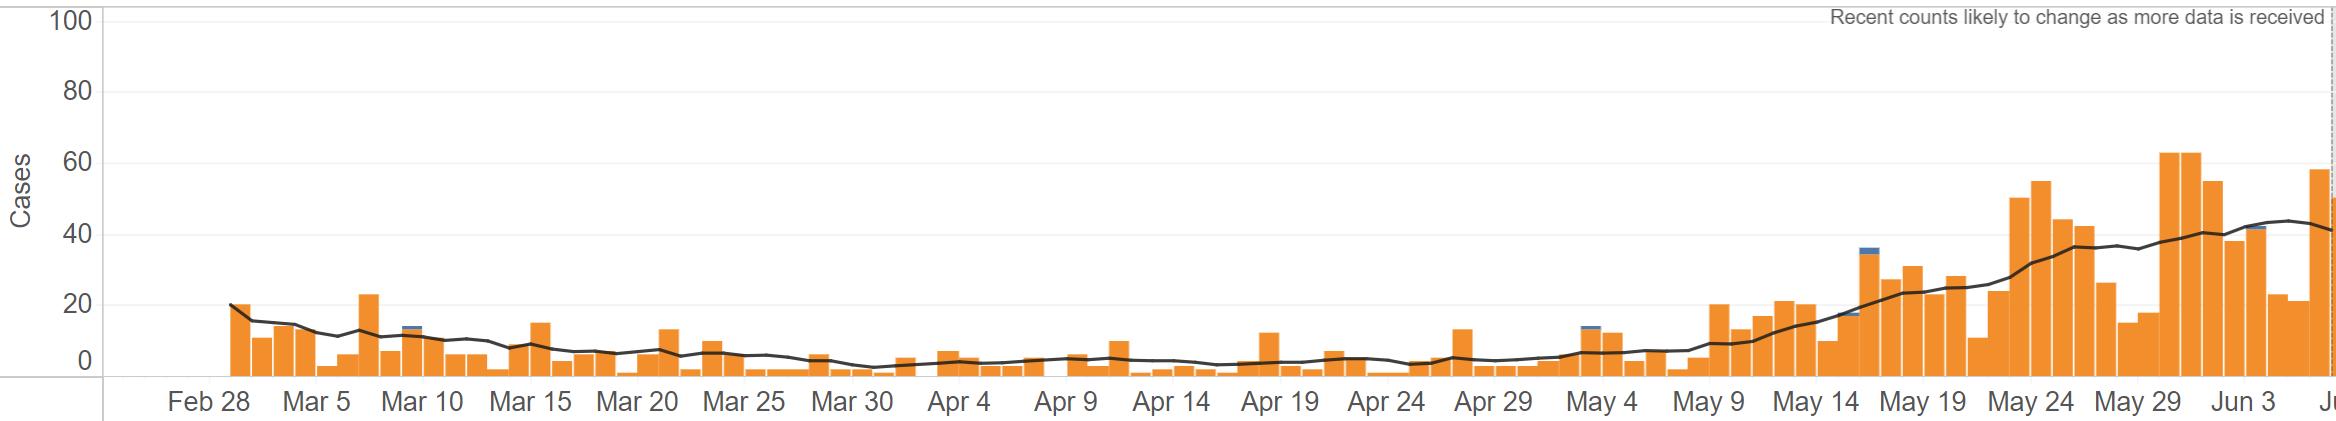
Central Louisiana
Louisiana (All Regions)
Source: Louisiana Department of Health, COVID-19 Dashboard, https://ldh.la.gov/, June 19, 2022.
COVID-19 cases by collection date as of June 19, 2022 in Region 7 (Natchitoches) compared to all regions in the state with a 7-day moving average.
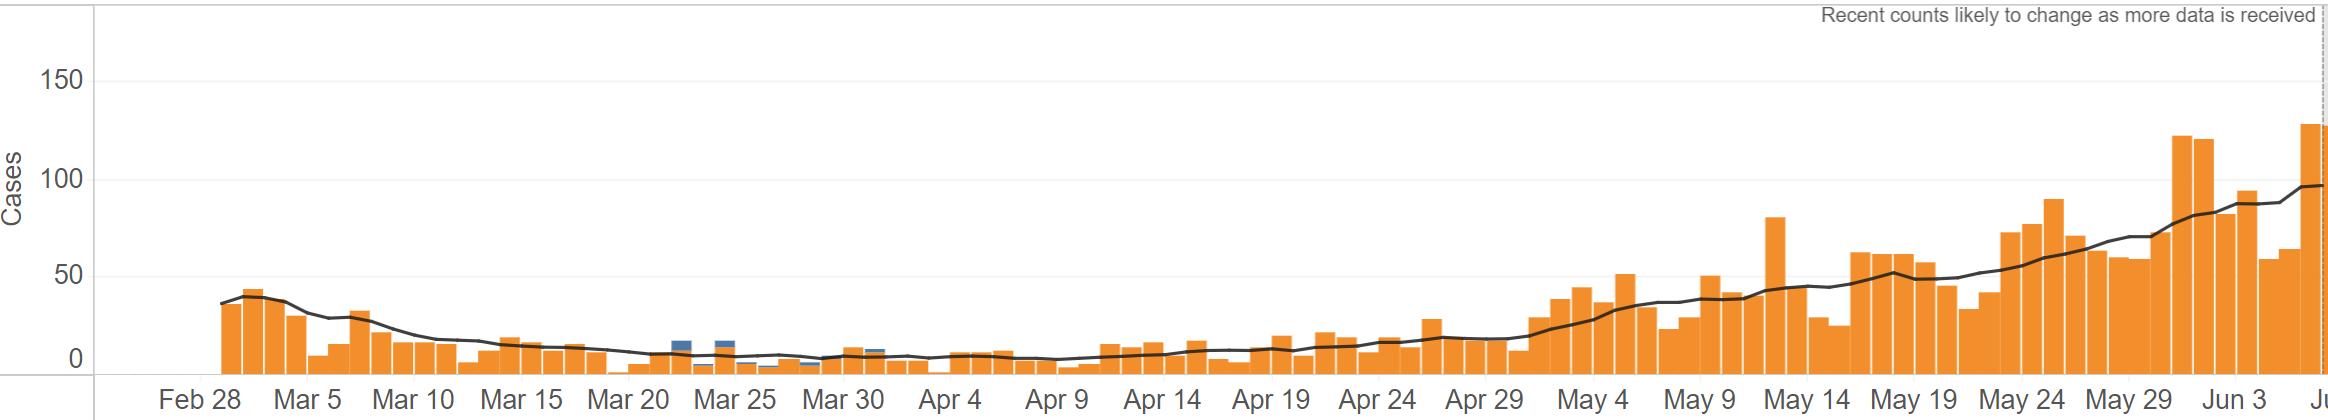
Natchitoches (Region 7)
Louisiana (All Regions)
Source: Louisiana Department of Health, COVID-19 Dashboard, https://ldh.la.gov/, June 19, 2022.
Cases over time by age group in Region 6 and Region 7 from March 1 to June 9, 2022.
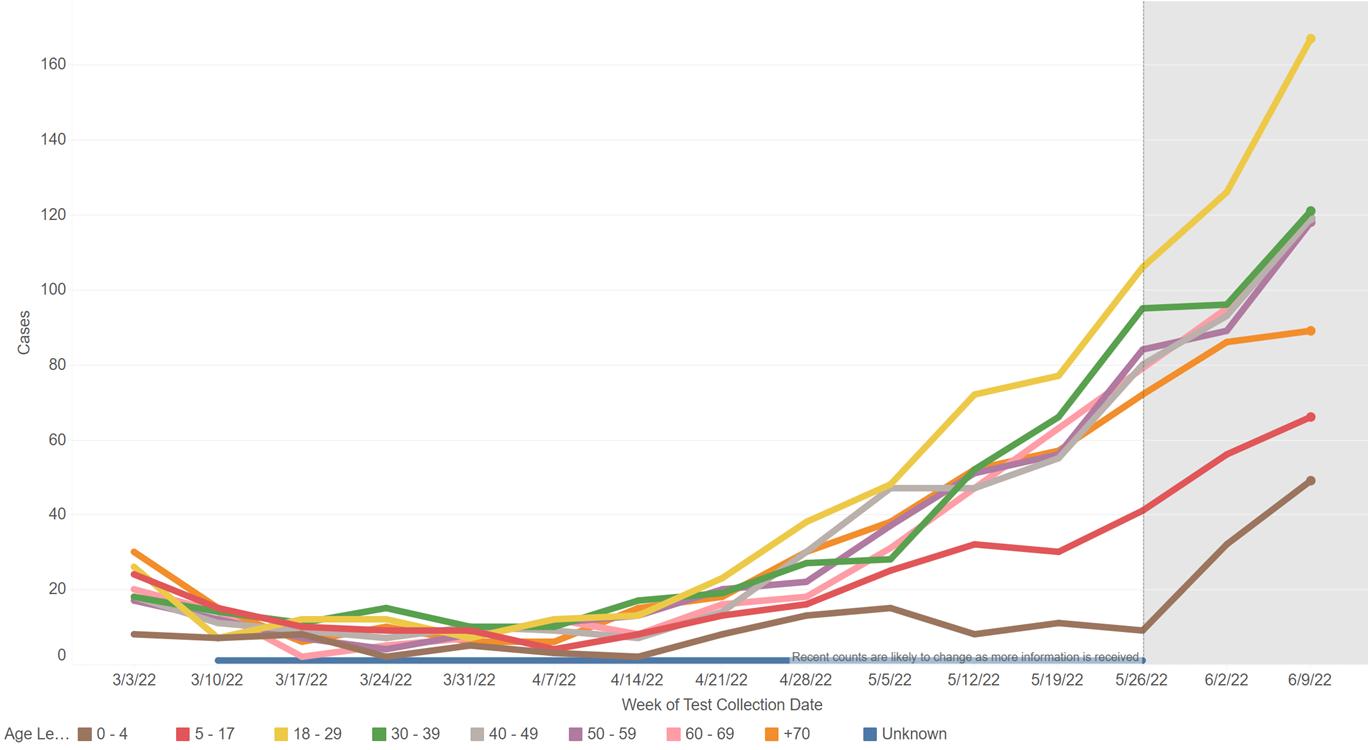
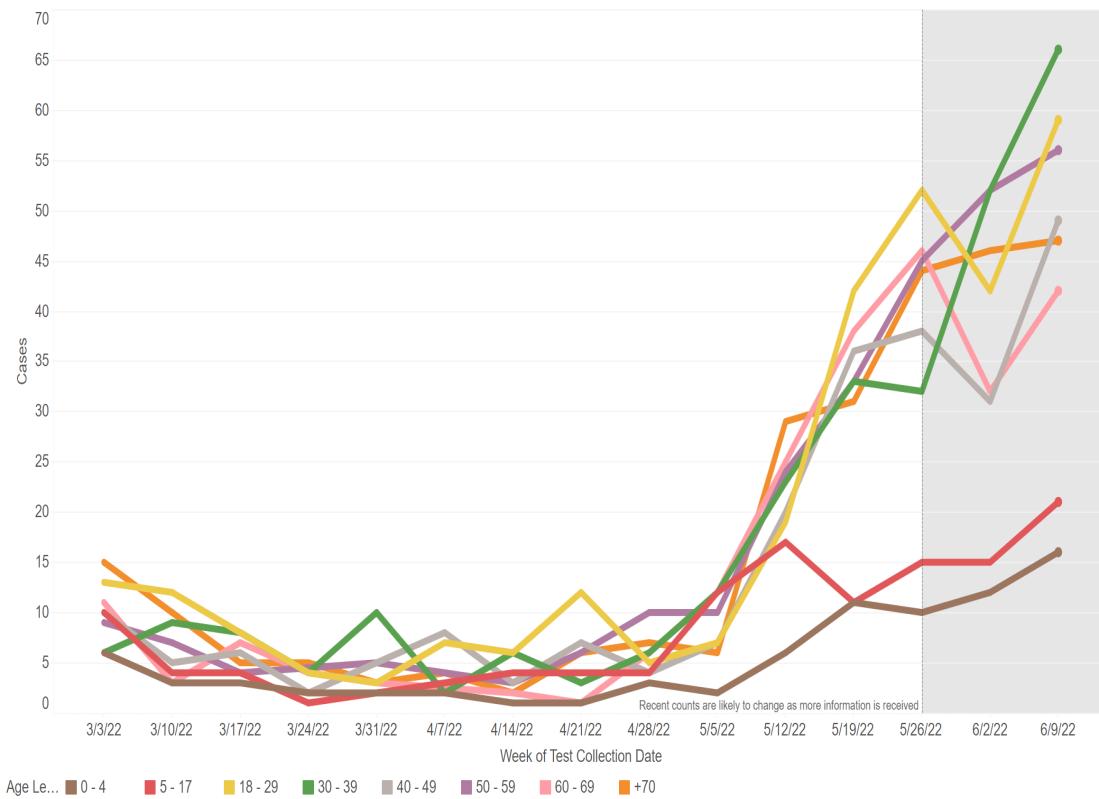
Central LA (Region 6) Natchitoches (Region 7)
Source: Louisiana Department of Health, COVID-19 Dashboard, https://ldh.la.gov/, June 19, 2022.
COVID-19 percent positive and test volume in Region 6 (Cenla) and Region 7 (Natchitoches) from December 1, 2021 – June 2, 2022.
Central LA (Region 6)
Source: Louisiana Department of Health, COVID-19 Dashboard, https://ldh.la.gov/, June 20, 2022.
Natchitoches (Region 7)
COVID-19 initial infections (blue) and reinfections (yellow) for Regions 6 & 7 from March 2 – June 15, 2022.
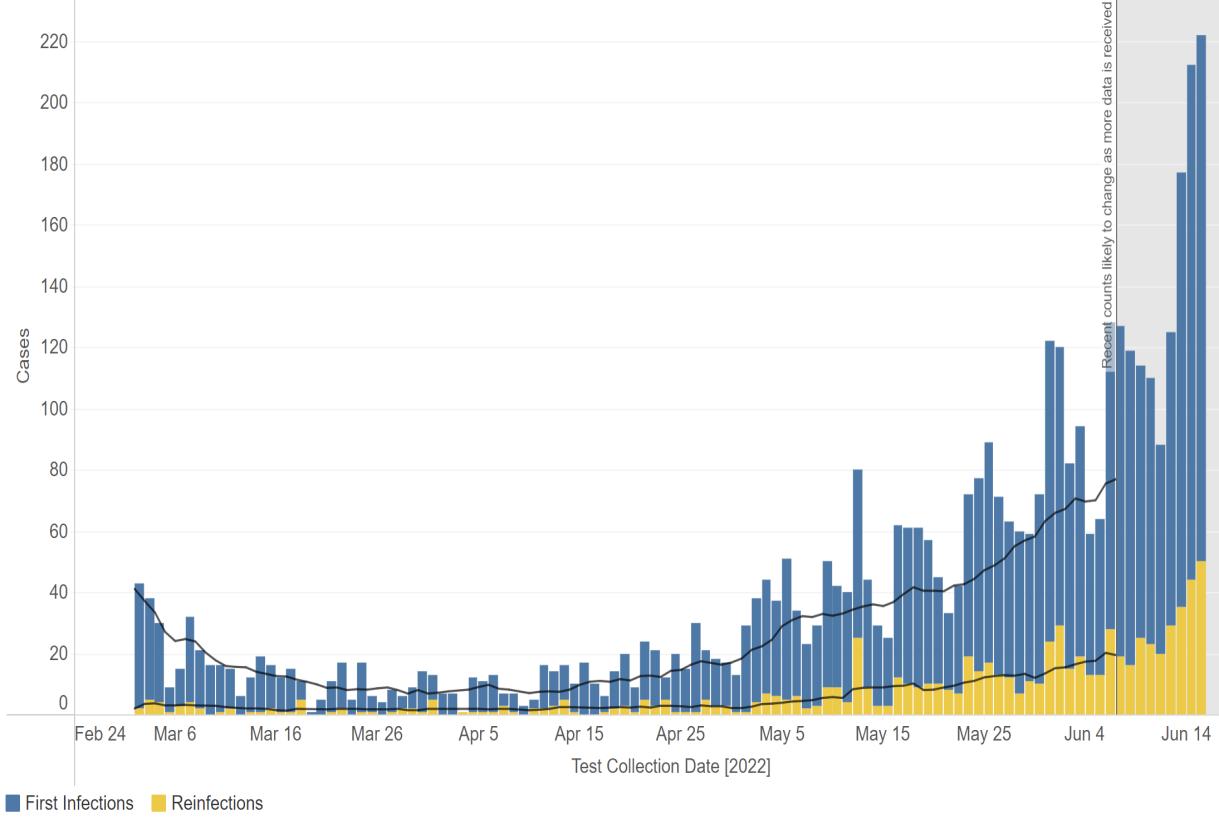
Central LA (Region 6)
Source: Louisiana Department of Health, COVID-19 Dashboard, https://ldh.la.gov/, June 20, 2022.
Natchitoches (Region 7)
Central Louisiana Economic Dashboard
Employed persons in the Alexandria MSA from 2019 – 2022.
Employed Persons in Alexandria, LA MSA 2019 - 2022
In April 2022, 63,456 were employed in the Alexandria metro area, an increase of 229 from March. Unemployment in Alexandria MSA dropped to 2.6% from 2.8% in March.
Source: Louisiana Workforce Commission, June 20, 2022
Employed persons in Natchitoches parish from 2019 – 2022.
Employed Person in Natchitoches 2019-2022
In April 2022, 16,285 were employed in Natchitoches parish. While this level exceeds the preliminary March 2022 level of 16,257, final March employment was revised upward to 16,461, therefore showing a slight decline in April.
Unemployment in Natchitoches parish fell to 3.0% in April from 3.2% in March.
Source: Louisiana Workforce Commission, June 20, 2022
Initial and continued unemployment claims in Louisiana from January 2022 to May 2022.


Initial unemployment claims increased for the third consecutive month. The average weekly initial unemployment claims filed in May increased 10% to 1,849 from 1,686 in April.
Statewide average weekly continued unemployment claims filed in May fell -3% to 9,827 from 10,105 a month earlier. Continued claims have declined every month this year.
Source: Louisiana Workforce Commission, June 21, 2022
The table below shows April 2022 preliminary unemployment rate, labor force, and employment data for central Louisiana parishes.
In April, parishes in central Louisiana had an unemployment rate of 3.2%, down from 3.5% in March.
April’s 3.2% unemployment rate for Cenla compared favorably to the state’s 3.5% rate.
LaSalle had the lowest unemployment rate in the state in April, with Grant ranked 8th and Rapides ranked at 13th.
Data Source: Louisiana Workforce Commission, June 21, 2022.
The table below shows April 2022 preliminary unemployment rate, labor force, and employment data for Metropolitan Statistical Areas in the state.
At 2.6%, the Alexandria MSA unemployment rate in April was the lowest among the state’s major metro areas.
Louisiana’s unemployment rate fell -0.2% in April to 3.5%. The preliminary rate for May 2022 is 3.6%.
April 2022
Data Source: Louisiana Workforce Commission, June 21, 2022.
The table below shows the number of unemployed, number of advertised jobs online, and the ratio of unemployed to advertised job openings online for Metropolitan Statistical Areas in Louisiana in April 2022.
In April 2022, the Alexandria MSA labor market reach an unemployed persons per job opening ratio of 0.25, meaning there were four job openings for every unemployed.
Every metro area in the state had more job openings than unemployed. The state ratio fell to 0.53 in April from 0.56 in March.
The tables below shows employers with the highest number of job openings advertised online on June 21, 2022.
Central Louisiana Economic Dashboard
An overview of sales, vehicle sales, and hotel occupancy taxes collected in the May 2022 reflecting sales activity in April 2022, unless otherwise noted.
April 2022
Notes: May tax revenue reflects sales activity in April. * Current month data are not available. N/a = Not available
Data Source noted in detailed reports.

An overview of sales tax revenue collected in other Rapides Parish towns and cities in May 2022 (excluding Alexandria and Pineville).
Note: Current tax revenue reflects sales activity in prior month .
Data Source: Rapides Parish Police Jury Treasurer’s Reports, June 2022.


(TR) Alexandria total sales tax revenue collected in May with previous month, year, and YTD comparisons.
(BR) Alexandria total monthly sales tax revenue from 2020 to present.
Note: Current month sales tax revenue reflects sales activity in previous month .
Data Source: Rapides Parish Police Jury Treasurer’s Reports, June 2022.
Avoyelles Parish total sales tax revenue collected in May with previous month, year, and year-to-date comparisons. Vehicle and hotel tax revenues are excluded.
Note: Current sales tax revenue reflects sales activity in the previous month .
Data Source: Avoyelles Parish School Board. June 2022.
Avoyelles Parish vehicle sales tax revenue collected in May with previous month, year, and year-to-date comparisons.
Note: Current sales tax revenue reflects sales activity in the previous month .
Data Source: Avoyelles Parish School Board. June 2022
Catahoula Parish total sales tax revenue collected in May with previous month, year, and year-to-date comparisons.
Note: Current month sales tax revenue reflects sales activity in the previous month .
Data Source: Catahoula Parish Tax Administrator, June 2022
Concordia Parish total sales tax revenue collected in May with previous month, year, and year-to-date comparisons.
Note: Current month sales tax revenue reflects sales activity in the previous month .
Data Source: Concordia Parish Tax Administrator. June 2022
Evangeline Parish total sales tax revenue collected in May with previous month, year and YTD comparisons.
Note: Current sales tax revenue reflects sales activity in previous month . Evangeline implemented a 1% sales tax increase July 1, 2021.
Data Source: Evangeline Parish Sales Tax Commissioner. June 2022
Evangeline Parish vehicle sales tax revenue collected in May with previous month, year and YTD comparisons.
Note: Current sales tax revenue reflects sales activity in previous month . Evangeline implemented a 1% sales tax increase July 1,
Data Source: Evangeline Parish Sales Tax Commissioner. June 2022
(TR) Grant sales tax revenue collected in May with previous month, year, and YTD comparisons.
(BR) Grant monthly sales tax revenue from 2020 to present.
Note: March sales tax revenue reflects sales activity in February.
Data Source: Grant Parish Sheriff’s Office, June 2022.
La Salle Parish total sales tax revenue collected in May with previous month, year, and year-to-date comparisons.
Note: Current month sales tax revenue reflects sales activity in the previous month .
Data Source: La Salle Parish Tax Administrator, June 2022
(TR) Natchitoches sales tax revenue collected in May with previous month, year, and YTD comparisons.
(BR) Natchitoches monthly sales tax revenue from 2020 to present.
Note: May sales tax revenue reflects sales activity in April.
Data Source: Natchitoches Parish Tax Commission, June 2022.
(TR) Natchitoches vehicle sales tax revenue collected in April with previous month, year, and YTD comparisons.
(BR) Natchitoches monthly vehicle sales tax revenue from 2020 to present.
Note: April sales tax revenue reflects sales activity in March. *May 2022 vehicle sales tax revenue was not available at time of pu blication.
Data Source: Natchitoches Parish Tax Commission, June 2022.

(TR) Pineville sales tax revenue collected in May with previous month, year, and YTD comparisons.
(BR) Pineville monthly sales tax revenue from 2020 to present.
Note: Current month sales tax revenue reflects sales activity in the prior month.
Data Source: Rapides Parish Police Jury Treasurer’s Reports, June 2022.
(TR) Rapides Parish sales tax revenue collected in May with previous month, year, and YTD comparisons.
(BR) Rapides monthly sales tax revenue from 2020 to present.
Note: Current sales tax revenue reflects sales activity in the prior month .
Data Source: Rapides Parish Police Jury Treasurer’s Reports, June 2022.
Rapides Parish vehicle sales tax revenue collected in May with previous month, year, and YTD comparisons.
Data Source: Rapides Parish Police Jury Treasurer’s Reports, June 2022.
St. Landry Parish sales tax revenue collected in May with previous month, year, and YTD comparisons.
Note: Current sales tax revenue reflects sales activity in prior month .
Data Source: Tax revenue data from St. Landry Parish School Board. June 2022
St. Landry Parish vehicle sales tax revenue collected in May with previous month, year, and YTD comparisons.
Note: Current sales tax revenue reflects sales activity in prior month .
Data Source: Tax revenue data from St. Landry Parish School Board. June 2022
Vernon Parish sales tax revenue collected in May with previous month, year, and year-to-date comparisons.
Data Source: Vernon Parish Sales Tax Department. June 2022.
Vernon Parish vehicle tax revenue collected in May with previous month, year, and year-to-date comparisons.
Data Source: Vernon Parish Sales Tax Department. June 2022.
Remote seller tax revenue is tax revenue from online sales by location of the seller at the time of purchase.
August 2020 - May 2022
In the first five months of 2022, $7.7 million in online sales taxes have been collected in Cenla compared to $6.8 million in 2021, a 13% increase.
Since August 2020 when remote sellers tax revenue collection started, $29.5 million in sales tax revenue have been collected from online sales in central Louisiana.
Note: Sales tax revenue collected in May reflects sales activity in April .
Data Source: Louisiana Sales and Use Tax Commission for Remote Sellers. August 2020 – June 2022
Remote seller tax revenue by parish with month-over-month and year-over-year comparisons.
Total online sales tax revenue in Cenla in May 2022 fell -9% from a month earlier, but is up 17% from May 2021. YTD online sales are up 13% in Central Louisiana.
Note: Sales tax revenue collected in April reflects sales activity in March .
Data Source: Louisiana Sales and Use Tax Commission for Remote Sellers. August 2020 – June 2022
Remote sellers tax revenue from online sales in Avoyelles Parish from July 2020 – May 2022.
Note: Sales tax revenue collected in one month reflects sales activity in the prior month .
Data Source: Louisiana Sales and Use Tax Commission for Remote Sellers. August 2020 – June 2022

Remote sellers tax revenue from online sales in Evangeline Parish from July 2020 – May 2022.
July 2020 - May 2022
Note: Sales tax revenue collected in one month reflects sales activity in the prior month.
Data Source: Louisiana Sales and Use Tax Commission for Remote Sellers. August 2020 – June 2022

Remote sellers tax revenue from online sales in Natchitoches Parish from July 2020 – May 2022.
Note: Sales tax revenue collected in one month reflects sales activity in the prior month .
Data Source: Louisiana Sales and Use Tax Commission for Remote Sellers. August 2020 – June 2022

Remote sellers tax revenue from online sales in Rapides Parish from July 2020 – May 2022.
Note: Sales tax revenue collected in one month reflects sales activity in the prior month .
Data Source: Louisiana Sales and Use Tax Commission for Remote Sellers. August 2020 – June 2022

(TR) Louisiana tax revenue from all sources for May with previous month, year, and YTD comparisons.
(BR) Louisiana monthly tax revenue from 2020 to present.
Central Louisiana Economic Dashboard
This chart shows the valuation of permits issued by Rapides Area Planning Commission in Avoyelles Parish in May between 2019-2022 with month-to-month, year-to-year, and year-to-date comparisons.
Data Source: Rapides Area Planning Commission, June 2022.
This chart shows the valuation of permits issued by Rapides Area Planning Commission in Evangeline Parish in May between 2019-2022 with month-to-month, year-to-year, and year-to-date comparisons.
Data Source: Rapides Area Planning Commission, June 2022.
This table below shows the valuation of permits issued by the City of Natchitoches Planning and Zoning Office between 2019 – 2022 with month-to-month, year-to-year, and year-to-date comparisons.
Data Source: City of Natchitoches Planning and Zoning Office, June 2022.
This table and chart shows the valuation of permits issued by Natchitoches Parish Permit Office between 2021 – 2022 with month-to-month, year-to-year, and year-todate comparisons.
Data Source: Natchitoches Parish Permit Office, June 2022.
Natchitoches Parish Permit Valuations Issued
This chart shows the valuation of permits issued by Rapides Area Planning Commission in the City of Pineville in May between 2019-2022 with month-to-month, year-to-year, and year-to-date comparisons.
Data Source: Rapides Area Planning Commission, June 2022.
This charts shows the valuation of permits issued by Rapides Area Planning Commission in Rapides Parish (excluding Alexandria) in May between 20192022 with month-to-month, year-to-year, and year-to-date comparisons.
Data Source: Rapides Area Planning Commission, June 2022.
Central Louisiana Economic Dashboard
The chart represents the Lumber Price Index in the U.S. from January 2020 – May 2022.
Monthly Price Index of Lumber 2020 - 2022
In May 2022, the US Lumber Price Index increased 2.7% from April. April 2022 marked the first decline in the US Lumber Price Index since September 2021 after six consecutive monthly increases. Currently, the Index stands -12.7% below a year ago.
Data Source: Fed Reserve Economic Database, St. Louis Federal Reserve Bank, June 21, 2022.
The count of active listings, median days on the market, average listing price, and median listing price for the Alexandria MSA for May 20192022 with month-to-month and year-over-year comparisons.
The count of active listings, median days on the market, average listing price, and median listing price for the Ft. Polk / Leesville market for May 2019-2022 with month-to-month and year-over-year comparisons.
The count of active listings, median days on the market, average listing price, and median listing price for the Natchitoches market for May 2019-2022 with month-to-month and year-over-year comparisons.
The count of active single-family and condo/townhome listings from 2019-2022 for Alexandria, Fort Polk (Leesville), Natchitoches, and Opelousas.
The median number of days property listings spend on the market from 2019-2022 for Alexandria, Fort Polk (Leesville), Natchitoches, and Opelousas.
Median Days on Market 2019-2022
The median listing price of houses from 2019-2022 for Alexandria, Fort Polk (Leesville), Natchitoches, and Opelousas.
The average listing price of houses from 2019-2022 for Alexandria, Fort Polk (Leesville), Natchitoches, and Opelousas.
Central Louisiana Economic Dashboard
Avoyelles Parish hotel occupancy tax revenue for May with previous month, year, and year-to-date comparisons.
Note: Current tax revenue reflects hotel occupancy activity in the previous month. Hotel occupancy tax revenue is used as a proxy for hotel occupancy rate.
Data Source: Avoyelles Parish School Board. June 2022.
Natchitoches Parish hotel occupancy tax revenue for May with previous month, year, and YTD comparisons.
Note: March tax revenue reflects hotel occupancy activity in February. Hotel occupancy tax revenue is used as a proxy for hotel occupancy rate.
Data Source: Natchitoches Parish Tax Administrator, June 2022.
Alexandria / Pineville hotel occupancy rate for May with previous month, year, and year-to-date comparisons.
Rapides Parish hotel occupancy tax revenue for May with previous month, year, and YTD comparisons.
Note: March tax revenue reflects hotel occupancy activity in February. Hotel occupancy tax revenue is used as a proxy for hotel occupancy rate.
Data Source: Rapides Parish Police Jury Treasurer’s Reports, June 2022.
Vernon Parish hotel, motel, and RV occupancy tax revenue for May with previous month, year, and year-to-date comparisons.
Note:
Data Source: Vernon Parish Sales Tax Department. June 2022.
Nationwide daily percentage of passengers passing through current TSA checkpoints in 2022 expressed as a percentage of traffic in 2019.

U.S. Airport Passenger Throughput Traffic in 2022 as a Percent of Traffic from 2019
Nationally, air passenger traffic in May 2022 increased 2.5% from April.
Compared to May 2019, air passenger traffic was down -10% last month.
U.S. air passenger traffic so far in 2022 was down -14% from 2019.
Data Source: DHS, Transportation Security Administration, https://www.tsa.gov/coronavirus/passenger-throughput, June 8, 2022
Total gasoline sales in gallons in Louisiana in 2020 - 2022.
Data Source: U.S. Energy Information Administration, Prices, Sales Volumes & Stocks by State, June 10, 2022

Weekly retail price of gasoline in the Gulf Coast region for all formulations from 2020 - 2022.
In May 2020, gasoline reached a low of $1.49 a gallon.
May 2022 retail gasoline price in Gulf Coast region average $4.10/gal. compared to $2.73 in 2021, a 50% increase.
Data Source: U.S. Energy Information Administration, Prices, Sales Volumes & Stocks by State, June 22, 2022
 Central Louisiana Economic Dashboard
The chart below represents the weekly number of new businesses applications in Louisiana from 2020-2022


New business applications in Louisiana in May 2022 decreased -10% from April 2022 and are down -39% from May 2021.
Note: Data reflects businesses applications, not necessarily business formations.
Data Source: U.S. Census Bureau, Business Formation Statistics, Retrieved June 9, 2022.
The chart below represents the number of new businesses established each month in Rapides from January 2019 through May 2022.


The number of new businesses established in Rapides in May 2022 fell -36% from April and is -56% below the previous year.
Year-to-date, 190 new businesses have been created in Rapides in 2022, compared to 227 in 2021 151 in 2020.
Note: Data reflects businesses established in the current month.
Data Source: Rapides Parish Sales and Use Tax Department, June 2022.
Rapides Parish occupational license revenue YTD with previous YTD comparisons.
Note: Rapides Parish reflects unincorporated areas. Data reflects licenses paid year-to-date.
Data Source: Rapides Parish Police Jury Treasurer’s Reports, June 2022.
The Coincident Economic Activity Index for Louisiana is set to match the trend in the gross state product and includes four indicators: nonfarm payroll employment, the unemployment rate, average hours worked in manufacturing and wages and salaries. The column graph below represents the percentage change in the index. A positive percentage represents an expanding statewide economy.
In April 2022, the Index was 108.10 compared to 107.81 in March 2022.
The Index is 0.2% below the January 2020 level.
Represents the number of drilling rigs actively exploring for or developing oil or natural gas in Louisiana and the U.S. in 2020-2022.


Rig Count in Louisiana & US 2020-2022
Source: Baker Hughes, https://rigcount.bakerhughes.com/na-rig-count, June 7, 2022
Gaming revenue in Louisiana for April 2022 with previous month and year comparisons.
April 2022
* Note: Year-to-Date percentage reflects calendar year.
Data Source: Louisiana Gaming Control Board, June 7, 2022. http://lgcb.dps.louisiana.gov/revenue_reports.html
The data presented throughout the CENLA Economic Dashboard reflects contributions from the following local organizations.
Also, special thanks to the following partners for distributing the dashboard.
• Rapides Parish Policy Jury Treasurer
• Rapides Sales Tax Administrator
• Avoyelles Parish School Board
• Alexandria International Airport
• Alexandria / Pineville Area CVB
• Rapides Area Planning Commission
• City of Alexandria Planning Division
• Evangeline Parish Sales Tax Commissioner
• Concordia, Catahoula, & La Salle Tax Administrator
• Louisiana Office of Public Health
• St. Landry Parish School Board
• Grant Parish Sheriff’s Office
• Natchitoches Parish Tax Commission
• Natchitoches Parish Planning and Zoning
• City of Natchitoches Planning
• Vernon Parish Sales Tax Department
• LSUA Foundation
• Central Louisiana Regional Chamber of Commerce
• Marksville Chamber of Commerce
• Bunkie Chamber of Commerce
• Evangeline Chamber of Commerce
• Concordia Chamber of Commerce
• St. Landry Chamber of Commerce
• Greater Vernon Chamber of Commerce
• Natchitoches Chamber of Commerce
• Next Issue: Week of July 25, 2022