CENLA ECONOMIC DASHBOARD
May 24, 2022.
Dr.RandallDupont Dean,CollegeofBusinessLouisianaStateUniversityofAlexandria
rdupont@lsua.edu


May 24, 2022.
Dr.RandallDupont Dean,CollegeofBusinessLouisianaStateUniversityofAlexandria
rdupont@lsua.edu
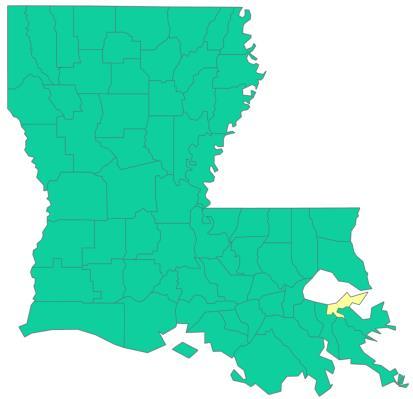
Every parish in Louisiana is at a low level of risk for Covid as of May 22, other than Orleans which is rated at a medium risk level. Cases of Covid in Orleans have begun a new uptrend with the latest variant of the Omicron. Cases in Regions 6 and 7 remain relatively flat for now. Comparison charts between Regions 6 and 7 and Region 1, New Orleans, are included in this month’s Dashboard. For the period from May 5 – 11, New Orleans had a positivity rate of 7.4% compared to 1.7% in Region 6 and 3.0% in Region 7.
Region 6 has 44.6% of the population vaccinated as of mid-May, up from 44.3% in April, while Region 7 has a 44.7% of the population vaccinated as of mid-May, up from 44.5% in March. Rapides andAvoyelles have the highest percentage of completed vaccinations in mid-May in Region 6 at 49.7% and 47.5%, respectively, while Caddo and Bossier have the highest percentage of completed vaccinations in mid-April in Region 7 at 46.5%% and 45.1%, respectively. Natchitoches is ranked third in Region 7 at 44.2%.
TheAlexandria metro area and Natchitoches Parish both set new post-pandemic employment highs. In March 2022, 63,292 were employed in theAlexandria metro area, an increase of 294 from February. Alexandria’s employment level reached a new post-pandemic high for the fifth time since March 2020. The unemployment rate for the Alexandria metro remained unchanged at 2.8% in March. Likewise, employment in Natchitoches hit a 13 year high at 16,257, a level not seen since July 2009.
Central Louisiana’s unemployment rate in March was unchanged from February at 3.5%, compared to 3.8% statewide. The Alexandria labor market grew even tighter in March, with an unemployed-to-job-opening ratio dropping to 0.26, meaning there are nearly four jobs for each unemployed.

May 24, 2022 CENLA Economic Dashboard
Sales tax data are used to measure changes in consumer spending. Sales taxes collected inApril reflect sales activity in March. Consumer spending in March was up in all twelve reporting Cenla jurisdictions, with increases ranging from 18% to 74% over February. Year-to-date all but one jurisdiction shows an increase in spending. March vehicle sales compared favorably to February as measured by sales tax revenue. However, sales in March were less favorable compared to a year ago when the third round of stimulus spurred auto sales. Online shopping in central Louisiana in March jumped 26% from February. So far in 2022, online sales tax totaled $6.2 million compared to $5.5 for the same period in 2021, a 12% increase.
All four parishes reporting hotel occupancy tax, Avoyelles, Natchitoches, Rapides, and Vernon, saw month-overmonth (M/M) increases in March with Natchitoches and Rapides posting gains of 36% and 32%, respectively. YTD
Natchitoches has seen a 35% increased and Rapides a 19% increase.
Nationally, air passenger traffic inApril 2022 increased 3% from March and is up 47% from a year ago. Gasoline sales in Louisiana are up 8% YTD in February and 15% over a year ago. With gasoline sales data availability delayed two months, the impact of higher gas price on sales should be reflected in the June Economic Dashboard.
May 24, 2022 CENLA Economic Dashboard
Because of the volatility of monthly data, year-to-date permit (YTD) valuations present a clearer picture of local construction. Commercial permits year-to-date in 2022 in Alexandria are unchanged from a year ago, while the value of residential permits year-to-date are down -35%. Residential permits inAlexandria YTD totaled $6.7M, down from $10.3M in 2021. YTD permit valuations in Natchitoches are up 49% and City of Natchitoches valuations are up 146%. YTD valuations in Pineville andAvoyelles are up 148% and 132%, respectively.
InApril 2022, the US Lumber Price Index fell -13% from March. This was the first decline after six consecutive monthly increases. Currently, the index stands at the same level as a year ago. Housing data forAlexandria, Natchitoches, and Ft. Polk/Leesville is now included in the Dashboard.
The median listing price of homes jumped in all three cities with Natchitoches seeing a 24% rise in one month compared to 10% inAlexandria. Average listing price increases were muted by comparison. The active listing count was up in all three cities indicating more availability and days on the market increased in two cities.
The number of new businesses established in Rapides in April 2022 decreased -9% from March and is down -3% YTD. Statewide, new business applications inApril 2022 decreased -11% from March and are down -24% from the same period a year ago.
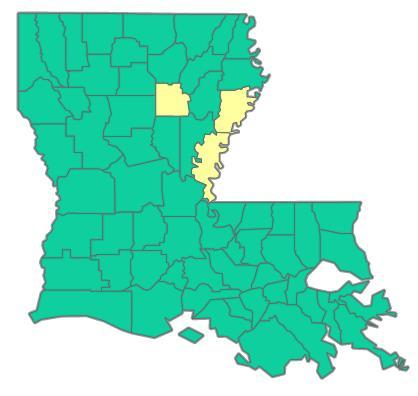
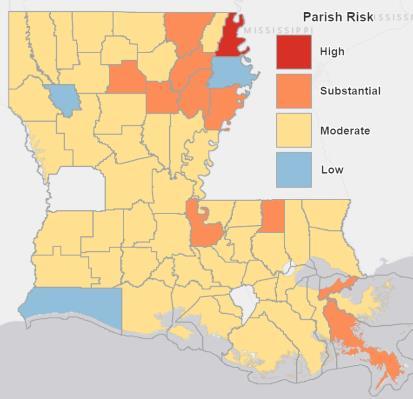
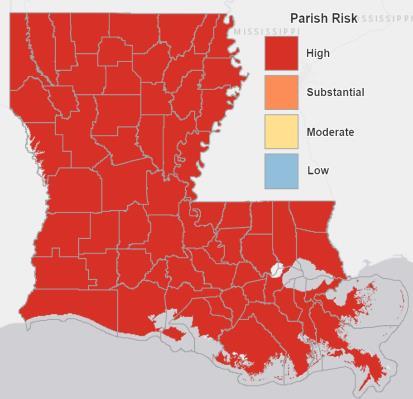
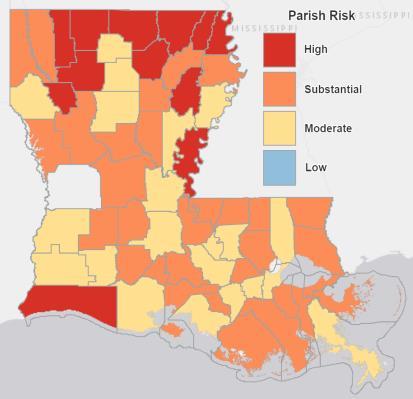
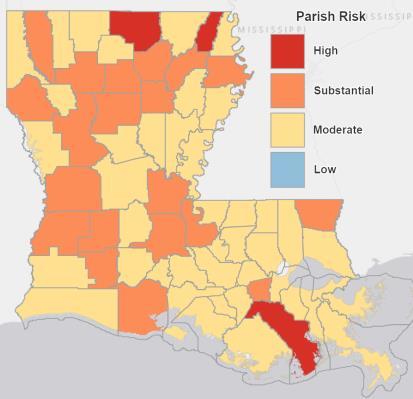
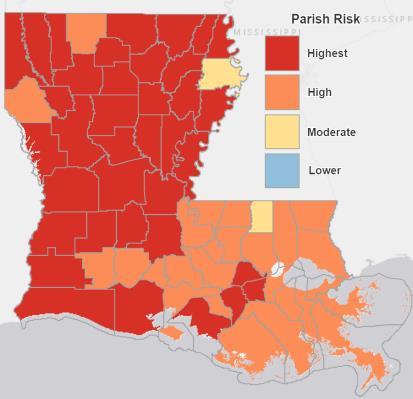
COVID-19 statewide risk by parish over time.
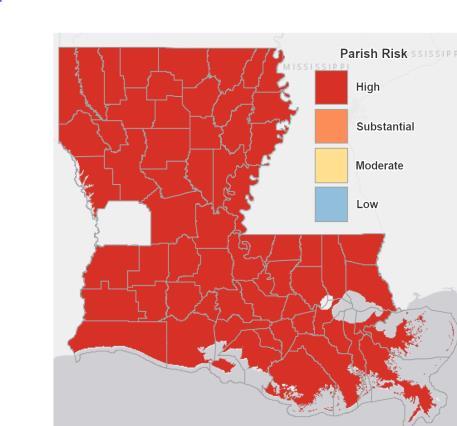
October 17, 2021
November 14, 2021
December 18, 2021
January 17, 2022
February 16, 2022
March 18, 2022
April 16, 2022
May 19, 2022
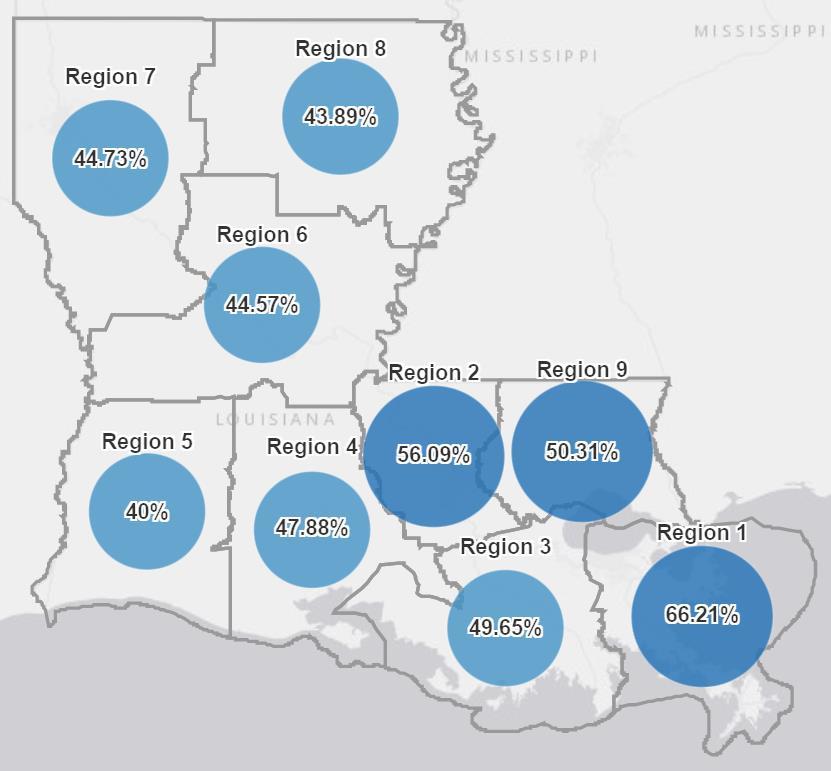
COVID-19 vaccinations as a percent of region population as of May 20, 2022.
✓Region 6 has 44.6% of the population vaccinated as of May 20, up from 44.3% on April 19.
✓Region 7 has a 44.7% of the population vaccinated as of May 20, up from 44.5% on April 16.
Source: Louisiana Office of Public Health, https://ldh.la.gov/covidvaccine, May 20, 2022
COVID-19 vaccinations as a percent of parish population as of May 20, 2022.
Rapides andAvoyelles have the highest percentage of completed vaccinations in mid-May in Region 6 at 49.7% and 47.5%, up from 49.4% and 47.2%, respectively.
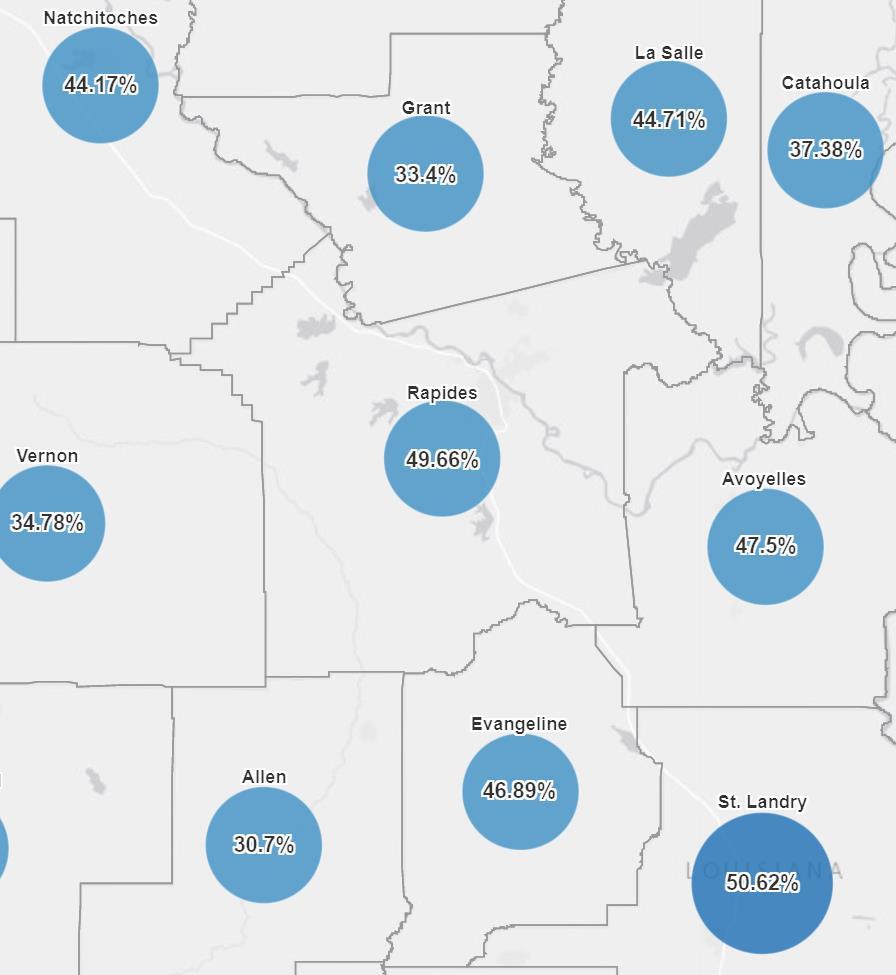
Source: Louisiana Office of Public Health, https://ldh.la.gov/covidvaccine, May 20, 2022
COVID-19 cases by collection date as of May 20, 2022 in Region 6 (Cenla) compared to Region 1 (New Orleans) with a 7-day moving average.
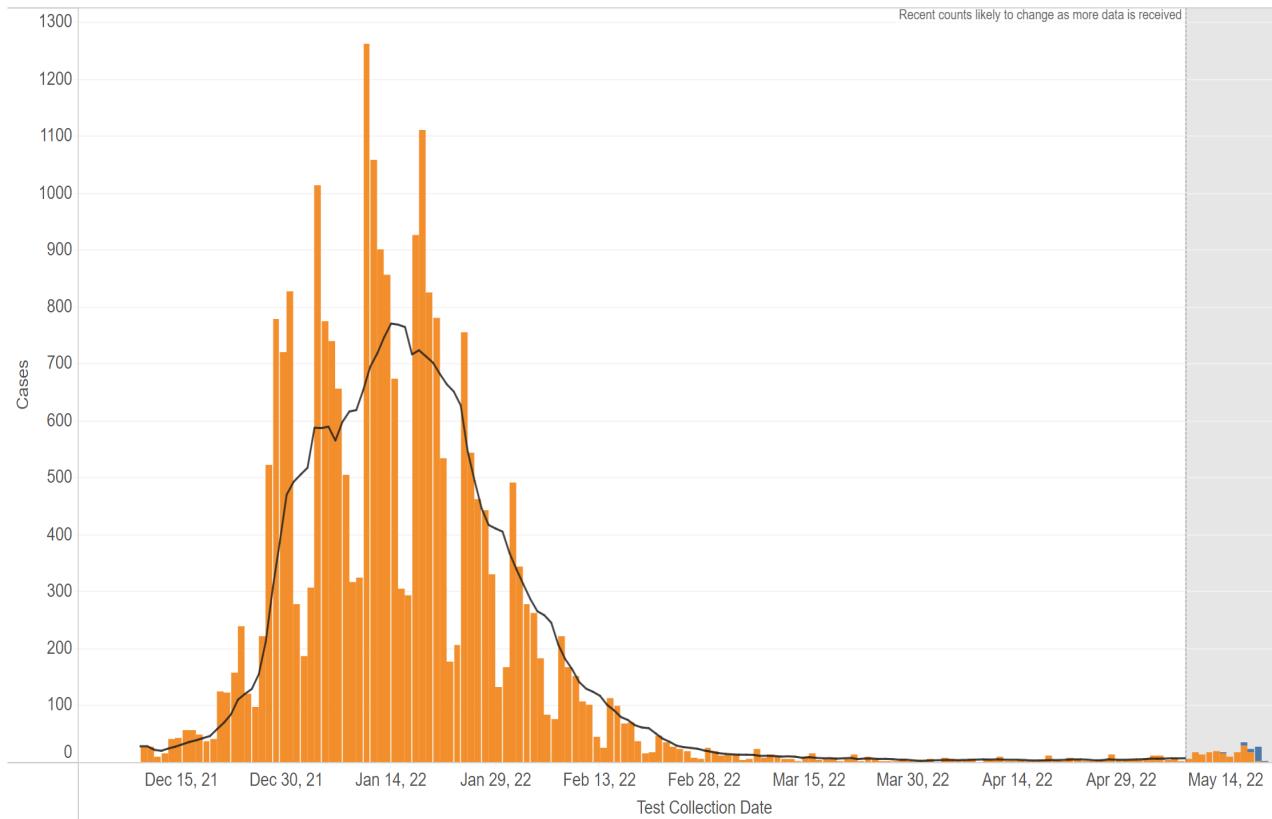
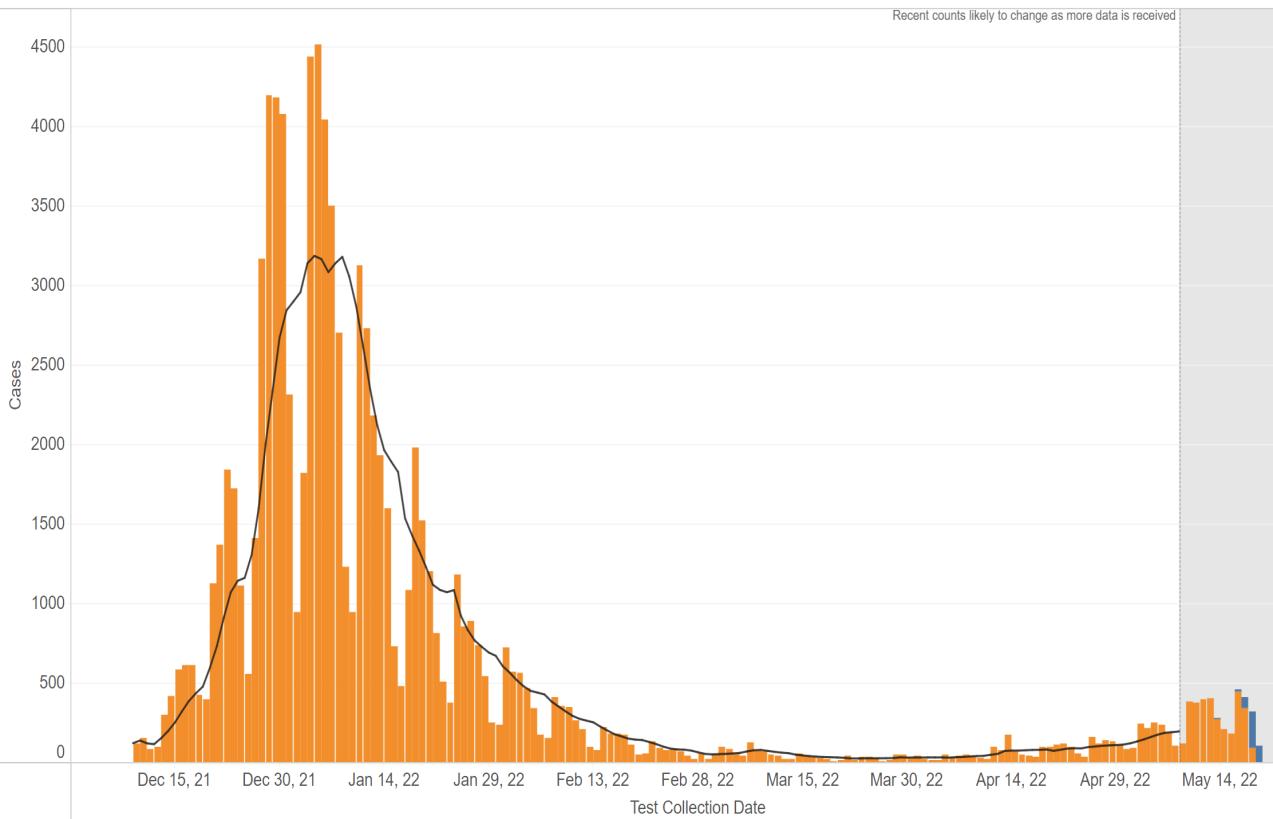
Central Louisiana New Orleans
Source: Louisiana Department of Health, COVID-19 Dashboard, https://ldh.la.gov/, May 20, 2022.
Cases over time by age group in Region 6 (central Louisiana) and Region 7 (New Orleans) from March 1 to May 19, 2022.
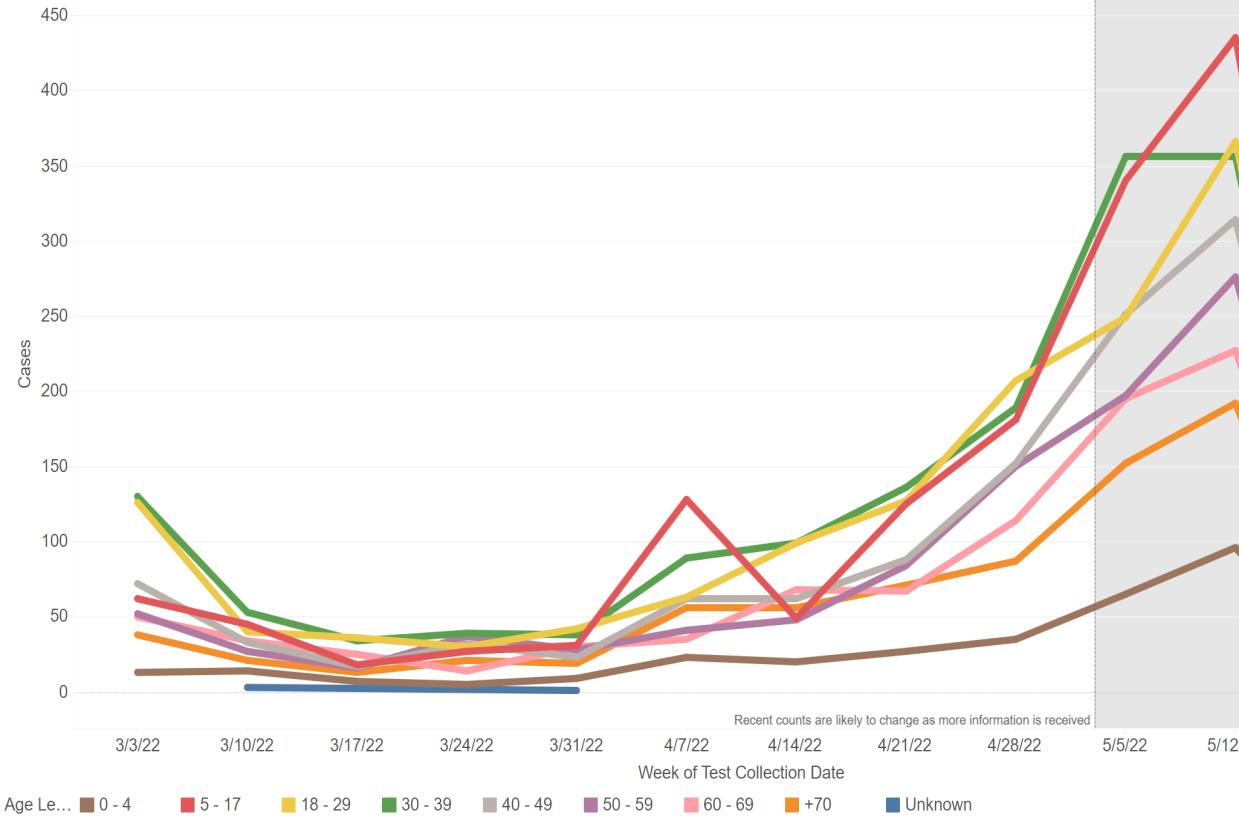
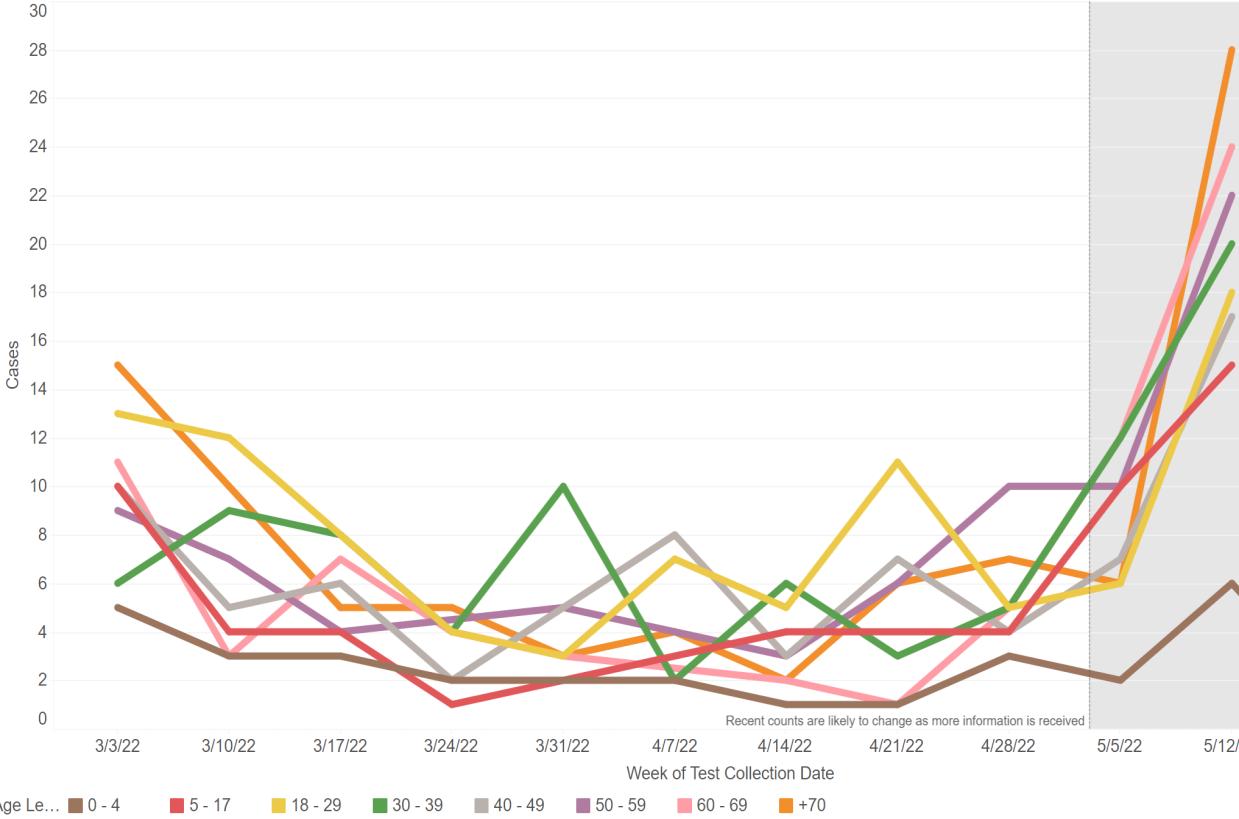
Central Louisiana New Orleans
Source: Louisiana Department of Health, COVID-19 Dashboard, https://ldh.la.gov/, May 20, 2022.
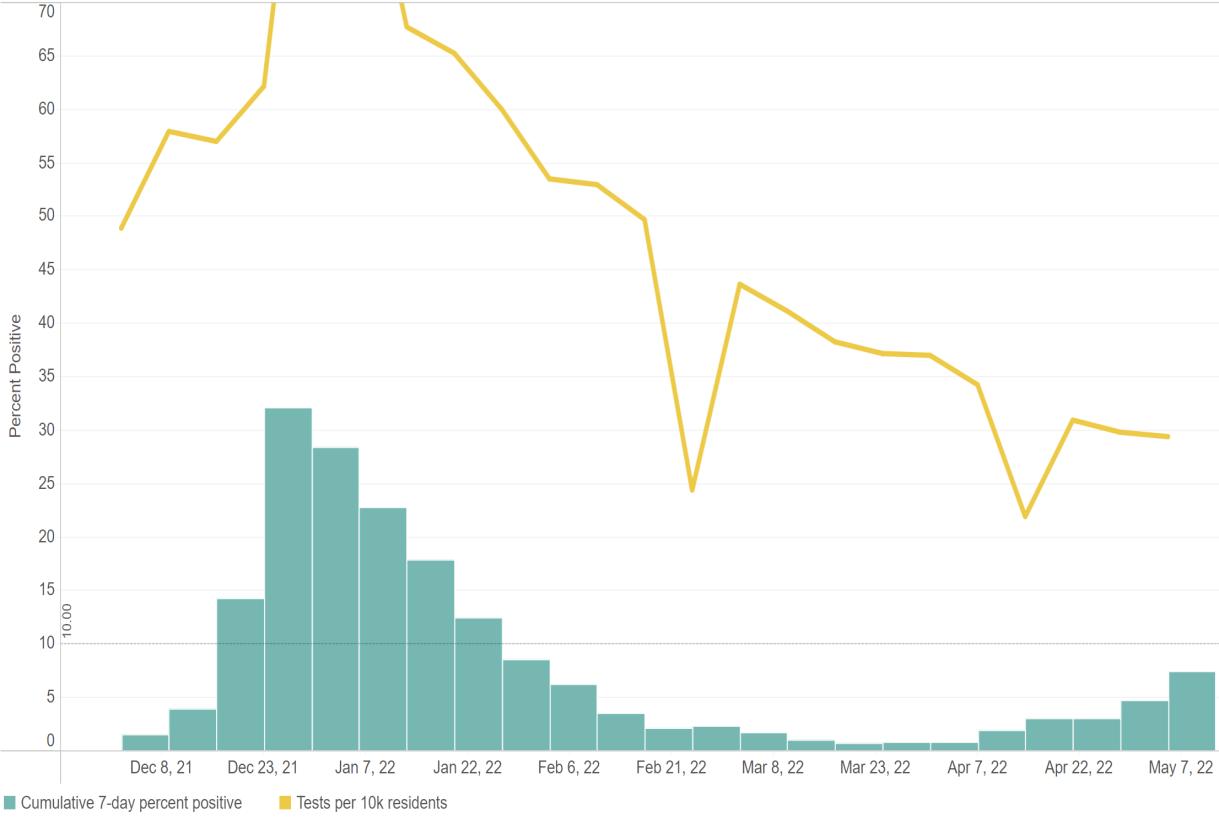
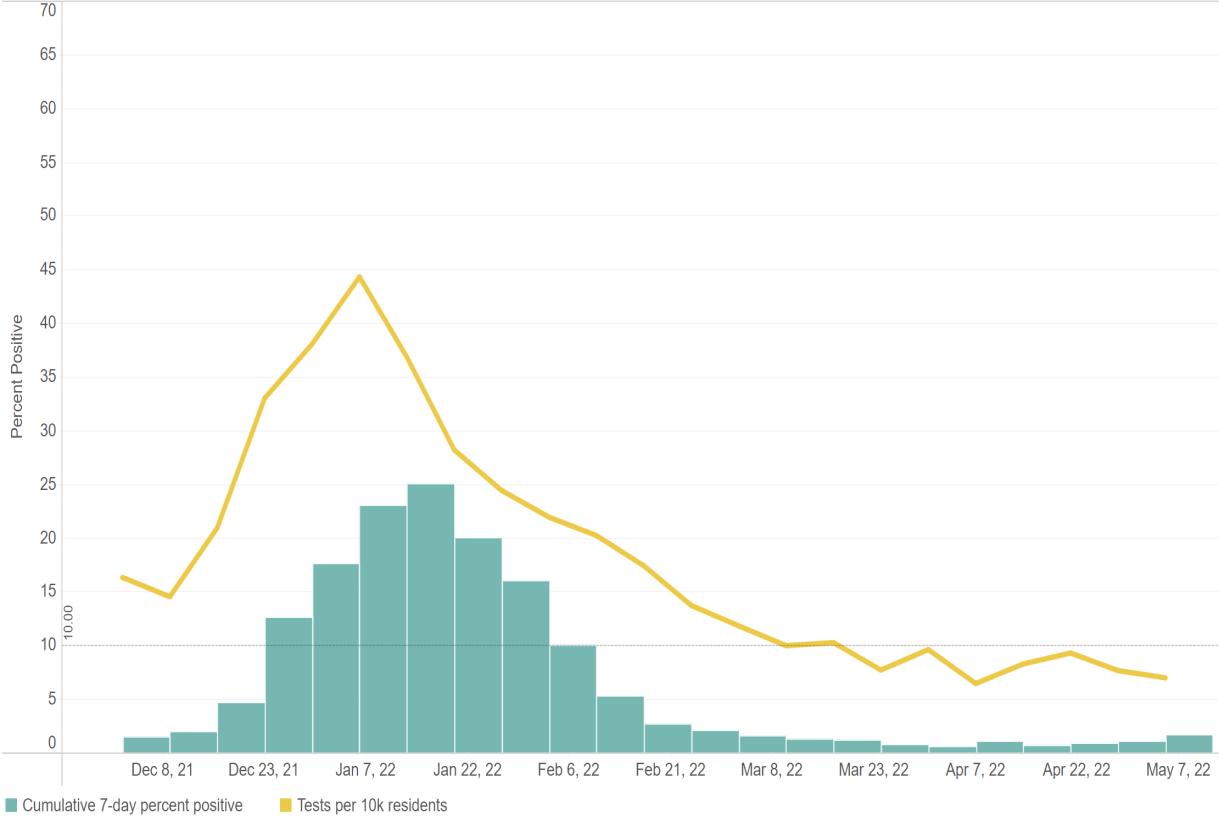
COVID-19 percent positive and test volume in Region 6 (Cenla) and Region 1 (New Orleans) from December 1, 2021 – May 5, 2022.
Central Louisiana New Orleans
Source: Louisiana Department of Health, COVID-19 Dashboard, https://ldh.la.gov/, May 20, 2022.
COVID-19 initial infections (blue) and reinfections (yellow) from March 2 – May 19, 2022.
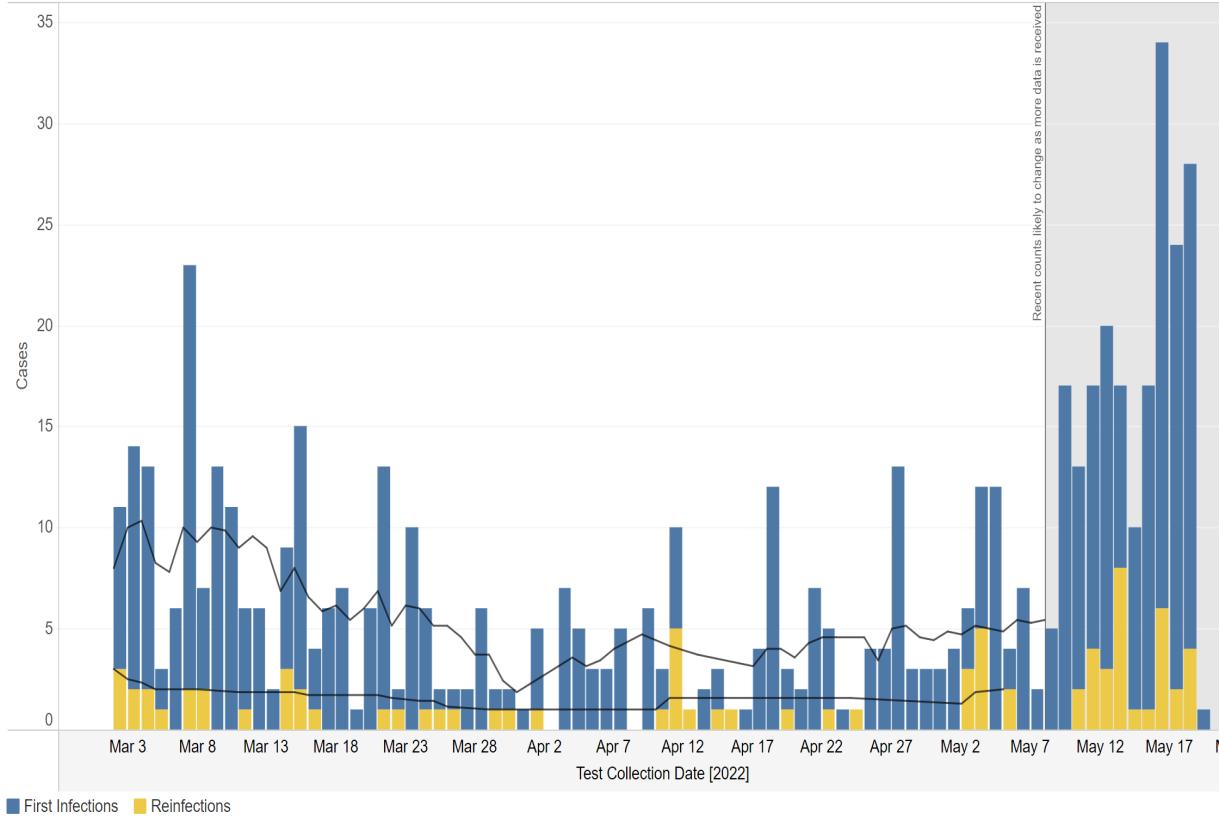
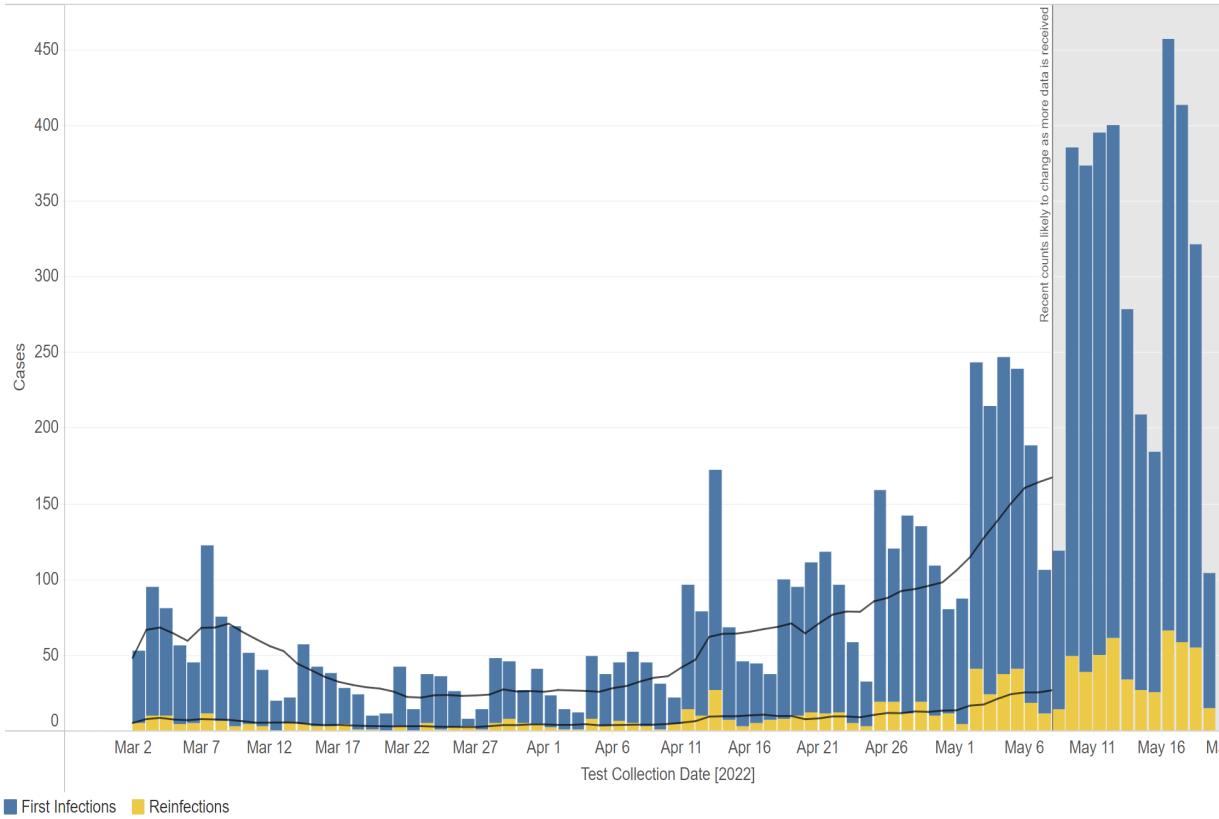
Central Louisiana New Orleans
Source: Louisiana Department of Health, COVID-19 Dashboard, https://ldh.la.gov/, May 20, 2022.
Employed persons in the Alexandria MSA from 2019 – 2022.
Employed Persons in Alexandria, LA MSA
2019 - 2022
✓In March 2022, 63,292 were employed in the Alexandria metro area, an increase of 294 from February. ✓Unemployment in Alexandria MSAwas unchanged from February at 2.8%.
Source: Louisiana Workforce Commission, May 23, 2022
Initial and continued unemployment claims in Louisiana from January 2021 to April 2022.


✓Statewide average weekly initial unemployment claims filed inApril increased 15.8% to 1,686 from 1,456 in March. ✓Statewide average weekly continued unemployment claims filed inApril fell -14.2% to 10,105 from 11,773 a month earlier.
Source: Louisiana Workforce Commission, May 23, 2022
The table below shows March 2022 preliminary unemployment rate, labor force, and employment data for central Louisiana parishes.
✓In March, parishes in central Louisiana had an unemployment rate of 3.5%, unchanged from February.
✓March’s 3.5% unemployment rate for Cenla compared favorably to the state’s 3.8% rate.
✓LaSalle had the lowest unemployment rate in the state in March, with Rapides ranked at 10th and Grant ranked 12th.
Data Source: Louisiana Workforce Commission, May 23, 2022.
The table below shows March 2022 preliminary unemployment rate, labor force, and employment data for Metropolitan Statistical Areas in the state.
✓
At 2.8%, theAlexandria MSAunemployment rate in March was the lowest among the state’s major metro areas.
✓Louisiana’s unemployment rate fell 0.1% in March to 3.8%. The preliminary rate for April 2022 is 3.5%.
Data Source: Louisiana Workforce Commission, May 23, 2022.
March 2022
The table below shows the number of unemployed, number of advertised jobs online, and the ratio of unemployed to advertised job openings online for Metropolitan Statistical Areas in Louisiana in March 2022.
✓
In March 2022, the Alexandria MSAtight labor market worsened from 0.29 unemployed persons per job opening to 0.26, meaning there were nearly four job openings for every unemployed. ✓Every metro area in the state had more job openings than unemployed.
✓The state ratio fell to 0.53 inApril from 0.56 in March.
The tables below shows employers with the highest number of job openings advertised online on May 22, 2022.
An overview of sales, vehicle sales, and hotel occupancy taxes collected in the April 2022 reflecting sales activity in March 2022, unless otherwise noted.
Notes: April tax revenue reflects sales activity in March. * Current month data are not available. N/a = Not available
Data Source noted in detailed reports.


An overview of sales tax revenue collected in other Rapides Parish towns and cities in April 2022 (excluding Alexandria and Pineville).
Note: Current tax revenue reflects sales activity in prior month.
Data Source: Rapides Parish Police Jury Treasurer’s Reports, May 2022.


(TR) Alexandria total sales tax revenue collected in April with previous month, year, and YTD comparisons.
(BR) Alexandria total monthly sales tax revenue from 2020 to present.
Note: Current month sales tax revenue reflects sales activity in previous month.
Data Source: Rapides Parish Police Jury Treasurer’s Reports, May 2022.
Avoyelles Parish total sales tax revenue collected in April with previous month, year, and year-to-date comparisons. Vehicle and hotel tax revenues are excluded. Data Source: Avoyelles Parish School Board. May 2022.
Note: Current sales tax revenue reflects sales activity in the previous month.
Avoyelles Parish vehicle sales tax revenue collected in April with previous month, year, and year-to-date comparisons.
Note: Current sales tax revenue reflects sales activity in the previous month.
Data Source: Avoyelles Parish School Board. April 2022
Catahoula Parish total sales tax revenue collected in April with previous month, year, and year-to-date comparisons.
Note: Current month sales tax revenue reflects sales activity in the previous month.
Data Source: Catahoula Parish Tax Administrator, May 2022
Concordia Parish total sales tax revenue collected in April with previous month, year, and year-to-date comparisons.
Note: Current month sales tax revenue reflects sales activity in the previous month.
Data Source: Concordia Parish Tax Administrator. May 2022
Evangeline Parish total sales tax revenue collected in April with previous month, year and YTD comparisons.
Note: Current sales tax revenue reflects sales activity in previous month. Evangeline implemented a 1% sales tax increase July 1, 2021.
Data Source: Evangeline Parish Sales Tax Commissioner. May 2022
Evangeline Parish vehicle sales tax revenue collected in April with previous month, year and YTD comparisons.
Note: Current sales tax revenue reflects sales activity in previous month. Evangeline implemented a 1% sales tax increase July 1, 2021.
Data Source: Evangeline Parish Sales Tax Commissioner. May 2022
(TR) Grant sales tax revenue collected in April with previous month, year, and YTD comparisons.
(BR) Grant monthly sales tax revenue from 2020 to present.
Note: March sales tax revenue reflects sales activity in February.
Data Source: Grant Parish Sheriff’s Office, May 2022.
La Salle Parish total sales tax revenue collected in April with previous month, year, and year-to-date comparisons.
Note: Current month sales tax revenue reflects sales activity in the previous month.
Data Source: La Salle Parish Tax Administrator, May 2022
(TR) Natchitoches sales tax revenue collected in April with previous month, year, and YTD comparisons.
(BR) Natchitoches monthly sales tax revenue from 2020 to present.
Note: April sales tax revenue reflects sales activity in March.
Data Source: Natchitoches Parish Tax Commission, May 2022.
(TR) Natchitoches vehicle sales tax revenue collected in March with previous month, year, and YTD comparisons.
(BR) Natchitoches monthly vehicle sales tax revenue from 2020 to present.
Note: March sales tax revenue reflects sales activity in February. *April 2022 vehicle sales tax revenue was not available at time of publication.
Data Source: Natchitoches Parish Tax Commission, May 2022.

(TR) Pineville sales tax revenue collected in April with previous month, year, and YTD comparisons.
(BR) Pineville monthly sales tax revenue from 2020 to present.
Note: Current month sales tax revenue reflects sales activity in the prior month.
Data Source: Rapides Parish Police Jury Treasurer’s Reports, May 2022.
(TR) Rapides Parish sales tax revenue collected in April with previous month, year, and YTD comparisons.
(BR) Rapides monthly sales tax revenue from 2020 to present.
Note: Current sales tax revenue reflects sales activity in the prior month.
Data Source: Rapides Parish Police Jury Treasurer’s Reports, May 2022.
Rapides Parish vehicle sales tax revenue collected in April with previous month, year, and YTD comparisons.
Data Source: Rapides Parish Police Jury Treasurer’s Reports, May 2022.
St. Landry Parish sales tax revenue collected in April with previous month, year, and YTD comparisons.
Note: Current sales tax revenue reflects sales activity in prior month.
Data Source: Tax revenue data from St. Landry Parish School Board. May 2022
St. Landry Parish vehicle sales tax revenue collected in April with previous month, year, and YTD comparisons.
Note: Current sales tax revenue reflects sales activity in prior month.
Data Source: Tax revenue data from St. Landry Parish School Board. April 2022
Vernon Parish sales tax revenue collected in April with previous month, year, and year-to-date comparisons.
Data Source: Vernon Parish Sales Tax Department. May 2022.
Vernon Parish vehicle tax revenue collected in April with previous month, year, and year-to-date comparisons.
Data Source: Vernon Parish Sales Tax Department. May 2022.
Remote seller tax revenue is tax revenue from online sales by location of the seller at the time of purchase.
August 2020 - April 2022
✓SinceAugust 2020 when remote sellers tax revenue collection started, $28.0 million in sales tax revenue have been collected from online sales in central Louisiana.
✓In the first four months of 2022, $6.2 million in online sales taxes have been collected in Cenla compared to $5.5 million in 2021, a 12% increase.
Note: Sales tax revenue collected inApril reflects sales activity in March.
Data Source: Louisiana Sales and Use Tax Commission for Remote Sellers.August 2020 –April 2022
Remote seller tax revenue by parish with month-over-month and year-over-year comparisons.
✓Total online sales tax revenue in Cenla in April 2022 grew 26% from a month earlier, but is up only 2% from April 2021.
✓YTD online sales are up 12% in Central Louisiana.
Note: Sales tax revenue collected inApril reflects sales activity in March.
Data Source: Louisiana Sales and Use Tax Commission for Remote Sellers.August 2020 –April 2022
Remote sellers tax revenue from online sales in Avoyelles Parish from July 2020 – April 2022.
Note: Sales tax revenue collected in one month reflects sales activity in the prior month.
Data Source: Louisiana Sales and Use Tax Commission for Remote Sellers.August 2020 –April 2022

Remote sellers tax revenue from online sales in Evangeline Parish from July 2020 – April 2022.
Note: Sales tax revenue collected in one month reflects sales activity in the prior month.
Data Source: Louisiana Sales and Use Tax Commission for Remote Sellers.August 2020 –April 2022

Remote sellers tax revenue from online sales in Natchitoches Parish from July 2020 – April 2022.
Note: Sales tax revenue collected in one month reflects sales activity in the prior month.
Data Source: Louisiana Sales and Use Tax Commission for Remote Sellers.August 2020 –April 2022

Remote sellers tax revenue from online sales in Rapides Parish from July 2020 – April 2022.
Note: Sales tax revenue collected in one month reflects sales activity in the prior month.
Data Source: Louisiana Sales and Use Tax Commission for Remote Sellers.August 2020 –April 2022

(TR) Louisiana tax revenue from all sources for April with previous month, year, and YTD comparisons.
(BR) Louisiana monthly tax revenue from 2020 to present.
The valuation (estimated development cost) of new commercial construction permits issued by the City of Alexandria in April 2022 with previous month, year, and YTD comparisons.
The valuation (estimated development cost) of new residential construction permits issued by the City of Alexandria in April 2022 with previous month, year, and YTD comparisons.
This chart shows the valuation of permits issued by Rapides Area Planning Commission in Avoyelles Parish in April between 2019-2022 with month-to-month, year-to-year, and year-to-date comparisons.
Data Source: RapidesArea Planning Commission, May 2022.
This chart shows the valuation of permits issued by Rapides Area Planning Commission in Evangeline Parish in April between 2019-2022 with month-to-month, year-to-year, and year-to-date comparisons.
Data Source: RapidesArea Planning Commission, May 2022.
This table below shows the valuation of permits issued by the City of Natchitoches Planning and Zoning Office between 2019 – 2022 with month-to-month, year-to-year, and year-to-date comparisons.
Data Source: City of Natchitoches Planning and Zoning Office, May 2022.
This table and chart shows the valuation of permits issued by Natchitoches Parish Permit Office between 2021 – 2022 with month-to-month, year-to-year, and year-todate comparisons.
Data Source: Natchitoches Parish Permit Office, May 2022.
This chart shows the valuation of permits issued by Rapides Area Planning Commission in the City of Pineville in April between 2019-2022 with month-to-month, year-to-year, and year-to-date comparisons.
Data Source: RapidesArea Planning Commission, May 2022.
This charts shows the valuation of permits issued by Rapides Area Planning Commission in Rapides Parish (excluding Alexandria) in April between 20192022 with month-to-month, year-to-year, and year-to-date comparisons.
Data Source: RapidesArea Planning Commission, May 2022.
The chart represents the Lumber Price Index in the U.S. from January 2020 – April 2022.
▪ InApril 2022, the US Lumber Price Index decreased -13.4% from March.
April 2022 marked the first decline in the US Lumber Price Index since September 2021 after six consecutive monthly increases. Currently, it stands -0.6% below a year ago.
Data Source: Fed Reserve Economic Database, St. Louis Federal Reserve Bank, May 14, 2022.
The count of active listings, median days on the market, average listing price, and median listing price for the Alexandria MSA for April 20192022 with month-to-month and year-over-year comparisons.
The count of active listings, median days on the market, average listing price, and median listing price for the Ft. Polk / Leesville market for April 2019-2022 with month-to-month and year-over-year comparisons.
The count of active listings, median days on the market, average listing price, and median listing price for the Natchitoches market for April 2019-2022 with month-to-month and year-over-year comparisons.
The count of active single-family and condo/townhome listings from 2019-2022 for Alexandria, Fort Polk (Leesville), Natchitoches, and Opelousas.
The median number of days property listings spend on the market from 2019-2022 for Alexandria, Fort Polk (Leesville), Natchitoches, and Opelousas.
The median listing price of houses from 2019-2022 for Alexandria, Fort Polk (Leesville), Natchitoches, and Opelousas.
Median Listing Price 2019-2022
The average listing price of houses from 2019-2022 for Alexandria, Fort Polk (Leesville), Natchitoches, and Opelousas.
Average Listing Price 2019-2022
Avoyelles Parish hotel occupancy tax revenue for April with previous month, year, and year-to-date comparisons.
Note: Current tax revenue reflects hotel occupancy activity in the previous month. Hotel occupancy tax revenue is used as a proxy for hotel occupancy rate.
Data Source: Avoyelles Parish School Board. May 2022.
Natchitoches Parish hotel occupancy tax revenue for April with previous month, year, and YTD comparisons.
Note: March tax revenue reflects hotel occupancy activity in February. Hotel occupancy tax revenue is used as a proxy for hotel occupancy rate.
Data Source: Natchitoches Parish Tax Administrator, May 2022.
Rapides Parish hotel occupancy tax revenue for April with previous month, year, and YTD comparisons.
Note: March tax revenue reflects hotel occupancy activity in February. Hotel occupancy tax revenue is used as a proxy for hotel occupancy rate.
Data Source: Rapides Parish Police Jury Treasurer’s Reports, May 2022.
Vernon Parish hotel, motel, and RV occupancy tax revenue for April with previous month, year, and year-to-date comparisons.
Note:
Data Source: Vernon Parish Sales Tax Department. May 2022.
Nationwide daily percentage of passengers passing through current TSA checkpoints in 2022 expressed as a percentage of traffic in 2019.
✓Nationally, air passenger traffic inApril 2022 increased 3% from March 2022.
U.S. air passenger traffic inApril 2022 was up 47% from a year ago.
Passenger Throughput Traffic in 2022 as a Percent of Traffic from 2019

Data Source: DHS, Transportation Security Administration, https://www.tsa.gov/coronavirus/passenger-throughput, May 10, 2022
Total gasoline sales in gallons in Louisiana in 2020 - 2022.
Data Source: U.S. Energy Information Administration, Prices, Sales Volumes & Stocks by State, May 10, 2022


The chart below represents the weekly number of new businesses applications in Louisiana from 2020-2022
New business applications inApril 2022 decreased -11% from March 2022 and are down -24% fromApril 2021.
Note: Data reflects businesses applications, not necessarily business formations.
Data Source: U.S. Census Bureau, Business Formation Statistics, Retrieved May 9, 2022.
The chart below represents the number of new businesses established each month in Rapides from January 2019 through April 2022.


✓The number of new businesses established in Rapides inApril 2022 fell -9% from March.
Year-to-date, 165 new businesses have been created in Rapides in 2022, compared to 170 in 2021 and 131 in 2020.
Note: Data reflects businesses established in the current month.
Data Source: Rapides Parish Sales and Use Tax Department, May 2022.
Rapides Parish occupational license revenue YTD with previous YTD comparisons.
Note: Rapides Parish reflects unincorporated areas. Data reflects licenses paid year-to-date.
Data Source: Rapides Parish Police Jury Treasurer’s Reports, May 2022.
The Coincident Economic Activity Index for Louisiana is set to match the trend in the gross state product and includes four indicators: nonfarm payroll employment, the unemployment rate, average hours worked in manufacturing and wages and salaries. The column graph below represents the percentage change in the index. A positive percentage represents an expanding statewide economy.
2020 - 2022
In March 2022, the Index was 107.72 compared to 107.48 in February 2022. ✓The Index is 0.6% below the January 2020 level.
Note: In March 2022, the Index was adjusted downward for the past two years.
Data Source: FRED Economic Data, Federal Reserve Bank of St. Louis, May 10, 2022. https://fred.stlouisfed.org/series/LAPHCI
Represents the number of drilling rigs actively exploring for or developing oil or natural gas in Louisiana and the U.S. in 2020-2022.


Gaming revenue in Louisiana for March 2022 with previous month and year comparisons.
March 2022
* Note: Year-to-Date percentage reflects calendar year.
Data Source: Louisiana Gaming Control Board, May 7, 2022. http://lgcb.dps.louisiana.gov/revenue_reports.html
The data presented throughout the CENLA Economic Dashboard reflects contributions from the following local organizations.
Also, special thanks to the following partners for distributing the dashboard.
• Rapides Parish Policy Jury Treasurer
• Rapides Sales TaxAdministrator
• Avoyelles Parish School Board
• Alexandria International Airport
• Alexandria / Pineville Area CVB
• RapidesArea Planning Commission
• City ofAlexandria Planning Division
• Evangeline Parish Sales Tax Commissioner
• Concordia, Catahoula, & La Salle Tax Administrator
• Louisiana Office of Public Health
• St. Landry Parish School Board
• Grant Parish Sheriff’s Office
• Natchitoches Parish Tax Commission
• Natchitoches Parish Planning and Zoning
• City of Natchitoches Planning
• Vernon Parish Sales Tax Department
• LSUAFoundation
• Central Louisiana Regional Chamber of Commerce
• Marksville Chamber of Commerce
• Bunkie Chamber of Commerce
• Evangeline Chamber of Commerce
• Concordia Chamber of Commerce
• St. Landry Chamber of Commerce
• Greater Vernon Chamber of Commerce
• Natchitoches Chamber of Commerce
• Next Issue: Week of June 20, 2022