CENLA ECONOMIC DASHBOARD
March 21, 2022.
Dr.RandallDupont Dean,CollegeofBusinessLouisianaStateUniversityofAlexandria
rdupont@lsua.edu


March 21, 2022.
Dr.RandallDupont Dean,CollegeofBusinessLouisianaStateUniversityofAlexandria
rdupont@lsua.edu
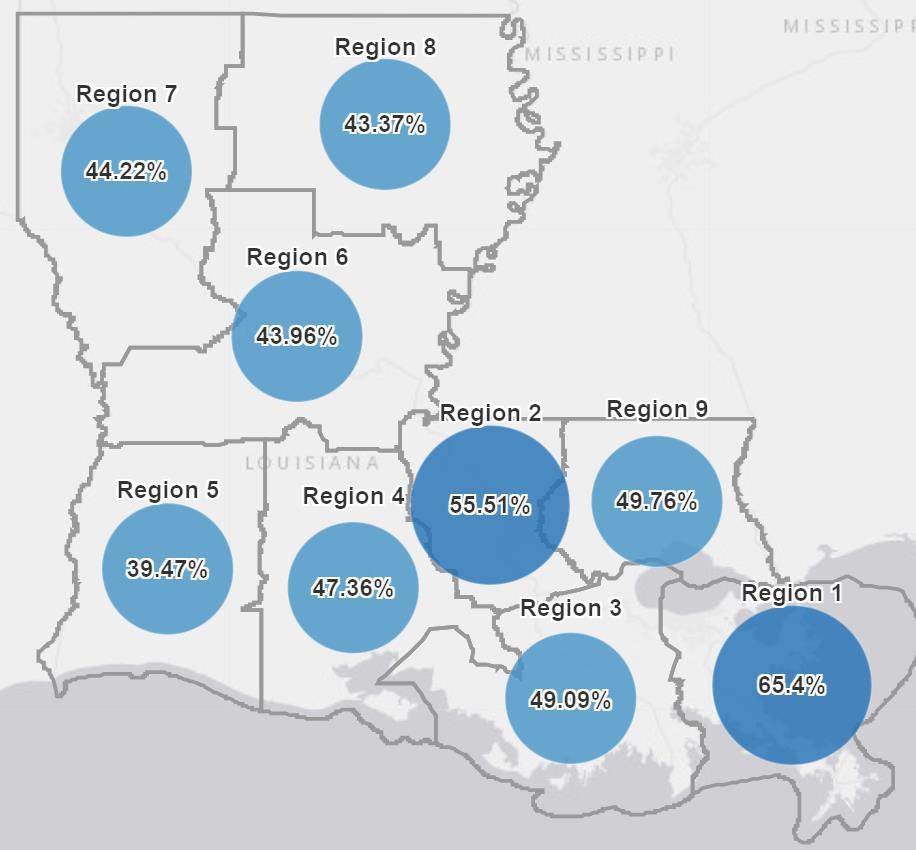
Region 6 has 43.9% of the population vaccinated as of mid-March, up from 43.3% in February, while Region 7 has a 44.2% of the population vaccinated as of mid-March, up from 43.7% in February. Rapides andAvoyelles have the highest percentage of completed vaccinations in mid-March in Region 6 at 48.9% and 46.9%, while Caddo and Bossier have the highest percentage of completed vaccinations in mid-February in Region 7 at 45.9%% and 44.5%, respectively. Natchitoches is ranked third in Region 7 at 43.7%.
Relatively speaking, the 5th wave which started in December is practically over. However, risk of new variants remains. The Dashboard will monitor case counts, percent testing positive, and other relevant data for changes in trend.
In January 2022, 62,125 were employed in theAlexandria metro area, a decrease of 150 since December. However, December’s preliminary employment count was revised upward from 61,224 to 62,125, an increase of 901.
Unemployment inAlexandria MSAreached a multi-year low of 2.6% in December before climbing to 3.1% in January. Central Louisiana’s unemployment rate was up 0.5% in January to 3.9%, compared to 4.3% statewide. Rapides and Grant had the 11th and 15th lowest unemployment rate in the state, respectively. Natchitoches ranked 24th.
TheAlexandria labor market remains tight with 6,389 openings for 2,015 unemployed. It’s unemployed-to-jobopening ratio of .32 means there are more than three jobs for each unemployed.

Changes in consumer spending are measured by changes in sales tax revenue. Sales taxes collected in February reflects sales activity in January. Consumer spending in January was down in all eleven jurisdictions reporting, ranging from -18% to -38% over the previous month. However, nearly all jurisdictions still reported year-to-date gains, with the exception of Catahoula andAlexandria. Natchitoches has the highest year-to-date gain in the region at 29%.
Vehicle sales were down across four of the five parishes that reported vehicle sales tax revenue. Only Evangeline reported an increase.
Online shopping in central Louisiana in January fell significantly from the record breaking 2021 holiday season (November and December). January sales which is reflected in February sales tax collection, fell -30% from December 2021 to $1.3 million. Every parish saw a decline in January online sales activity, ranging from -25% in Rapides to -38% in Grant.
Only Rapides posted an increase in hotel occupancy sales tax revenue in January. Avoyelles and Natchitoches posted -64% and -51% declines, respectively, compared to the previous month. Hotel occupancy rate data are now available for the Alexandria/Pineville area. February’s occupancy rate was 55.0% compared to 50.9% in January.
Nationally, air passenger traffic in February 2022 increased 17% from January. In addition, U.S. air passenger traffic in February was up 98% from a year ago. Pre-pandemic comparison data for air passenger traffic among Louisiana’s airports will not available until June. 2019 is used as the base year for measuring the full return of passenger traffic.
Because of the volatility of monthly data, year-to-date permit valuations presents a clearer picture of local construction. Commercial permits year-to-date in 2022 inAlexandria are up 13% while the value of residential permits year-to-date are down -29%. Commercial permits inAlexandria totaled $12M YTD compared to $10.6M in 2021. Residential permits in Alexandria YTD totaled $2.4 million down from $3.3M in 2021.Avoyelles had a significant increase in permits in February, $36.3M compared to $5.2M in January, bringing its YTD increase to 216%. Other notable YTD increases were Pineville 521%, Evangeline 328%, Natchitoches 90%, and the City of Natchitoches 56%.
The US Lumber Price Index in January increased for the fifth consecutive month. In February 2022, the US Lumber Price Index increased 3.7% from January. Currently, the Index stands 23% above a year ago.
Monthly housing market data are not available this issue. Instead, homeownership rates in select parishes are included. As of 2020, Grant andAvoyelles have homeownership rates of 77% and 72%, respectively, while Evangeline and Natchitoches have rates of 64% and 55%, respectively.
The number of new businesses established in Rapides in February 2022 decreased -34% from January but was 11% higher year-to-date than the first two months of 2021. Statewide, new business applications in February 2022 increased 2.5% from January 2022, but were down 3.5% from February 2021.
COVID-19 vaccinations as a percent of region population as of March 14, 2022.
✓Region 6 has 43.9% of the population vaccinated as of March 19, up from 43.3% on Feb. 16.
✓Region 7 has a 44.2% of the population vaccinated as of March 19, up from 43.7% on Feb. 16.
Source: Louisiana Office of Public Health, https://ldh.la.gov/covidvaccine, March 19, 2022
COVID-19 vaccinations as a percent of parish population as of March 14, 2022.
Rapides andAvoyelles have the highest percentage of completed vaccinations in mid-March in Region 6 at 48.9% and 46.9%, up from 48.3% and 46.3%, respectively.
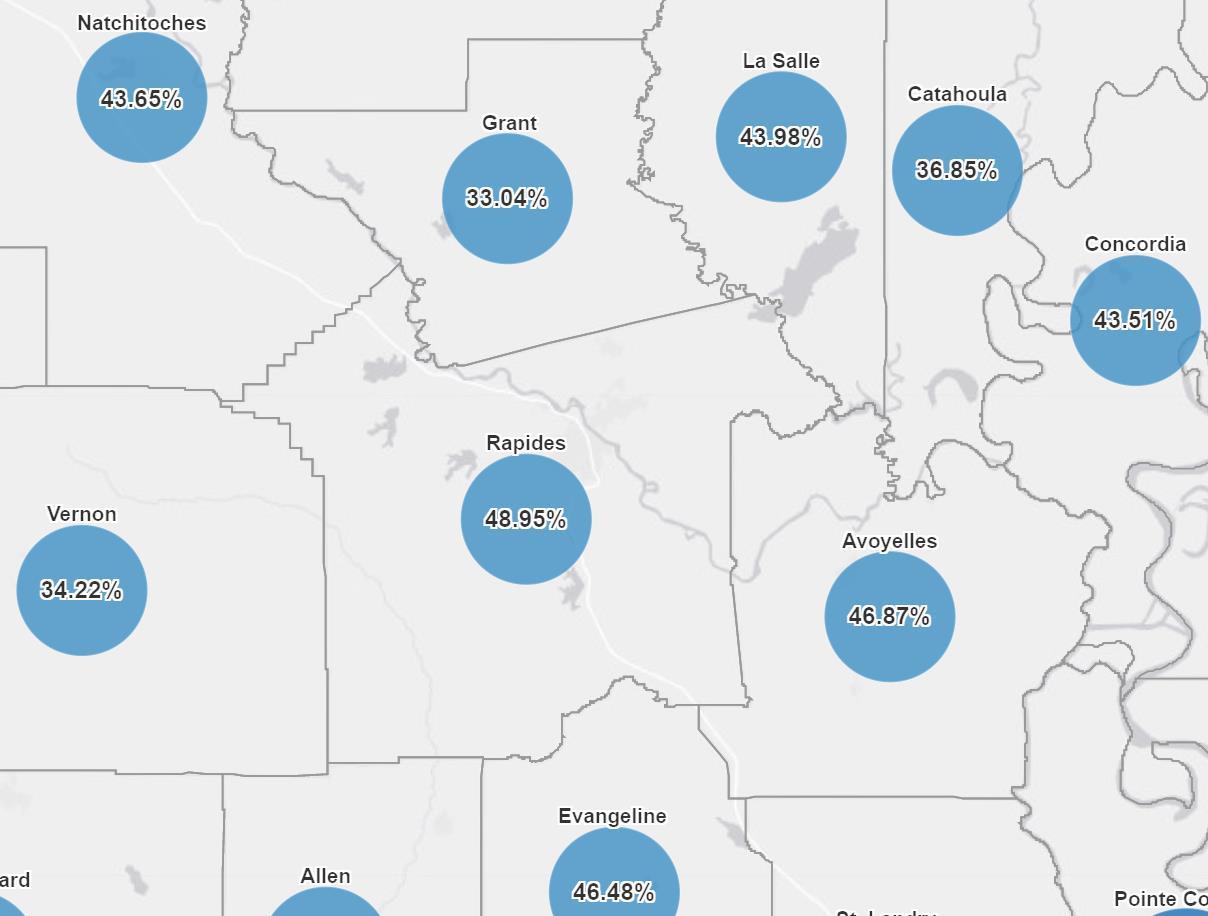
Source: Louisiana Office of Public Health, https://ldh.la.gov/covidvaccine, March 14, 2022
COVID-19 cases by collection date as of March 14, 2022 in Louisiana with a 7-day moving average.
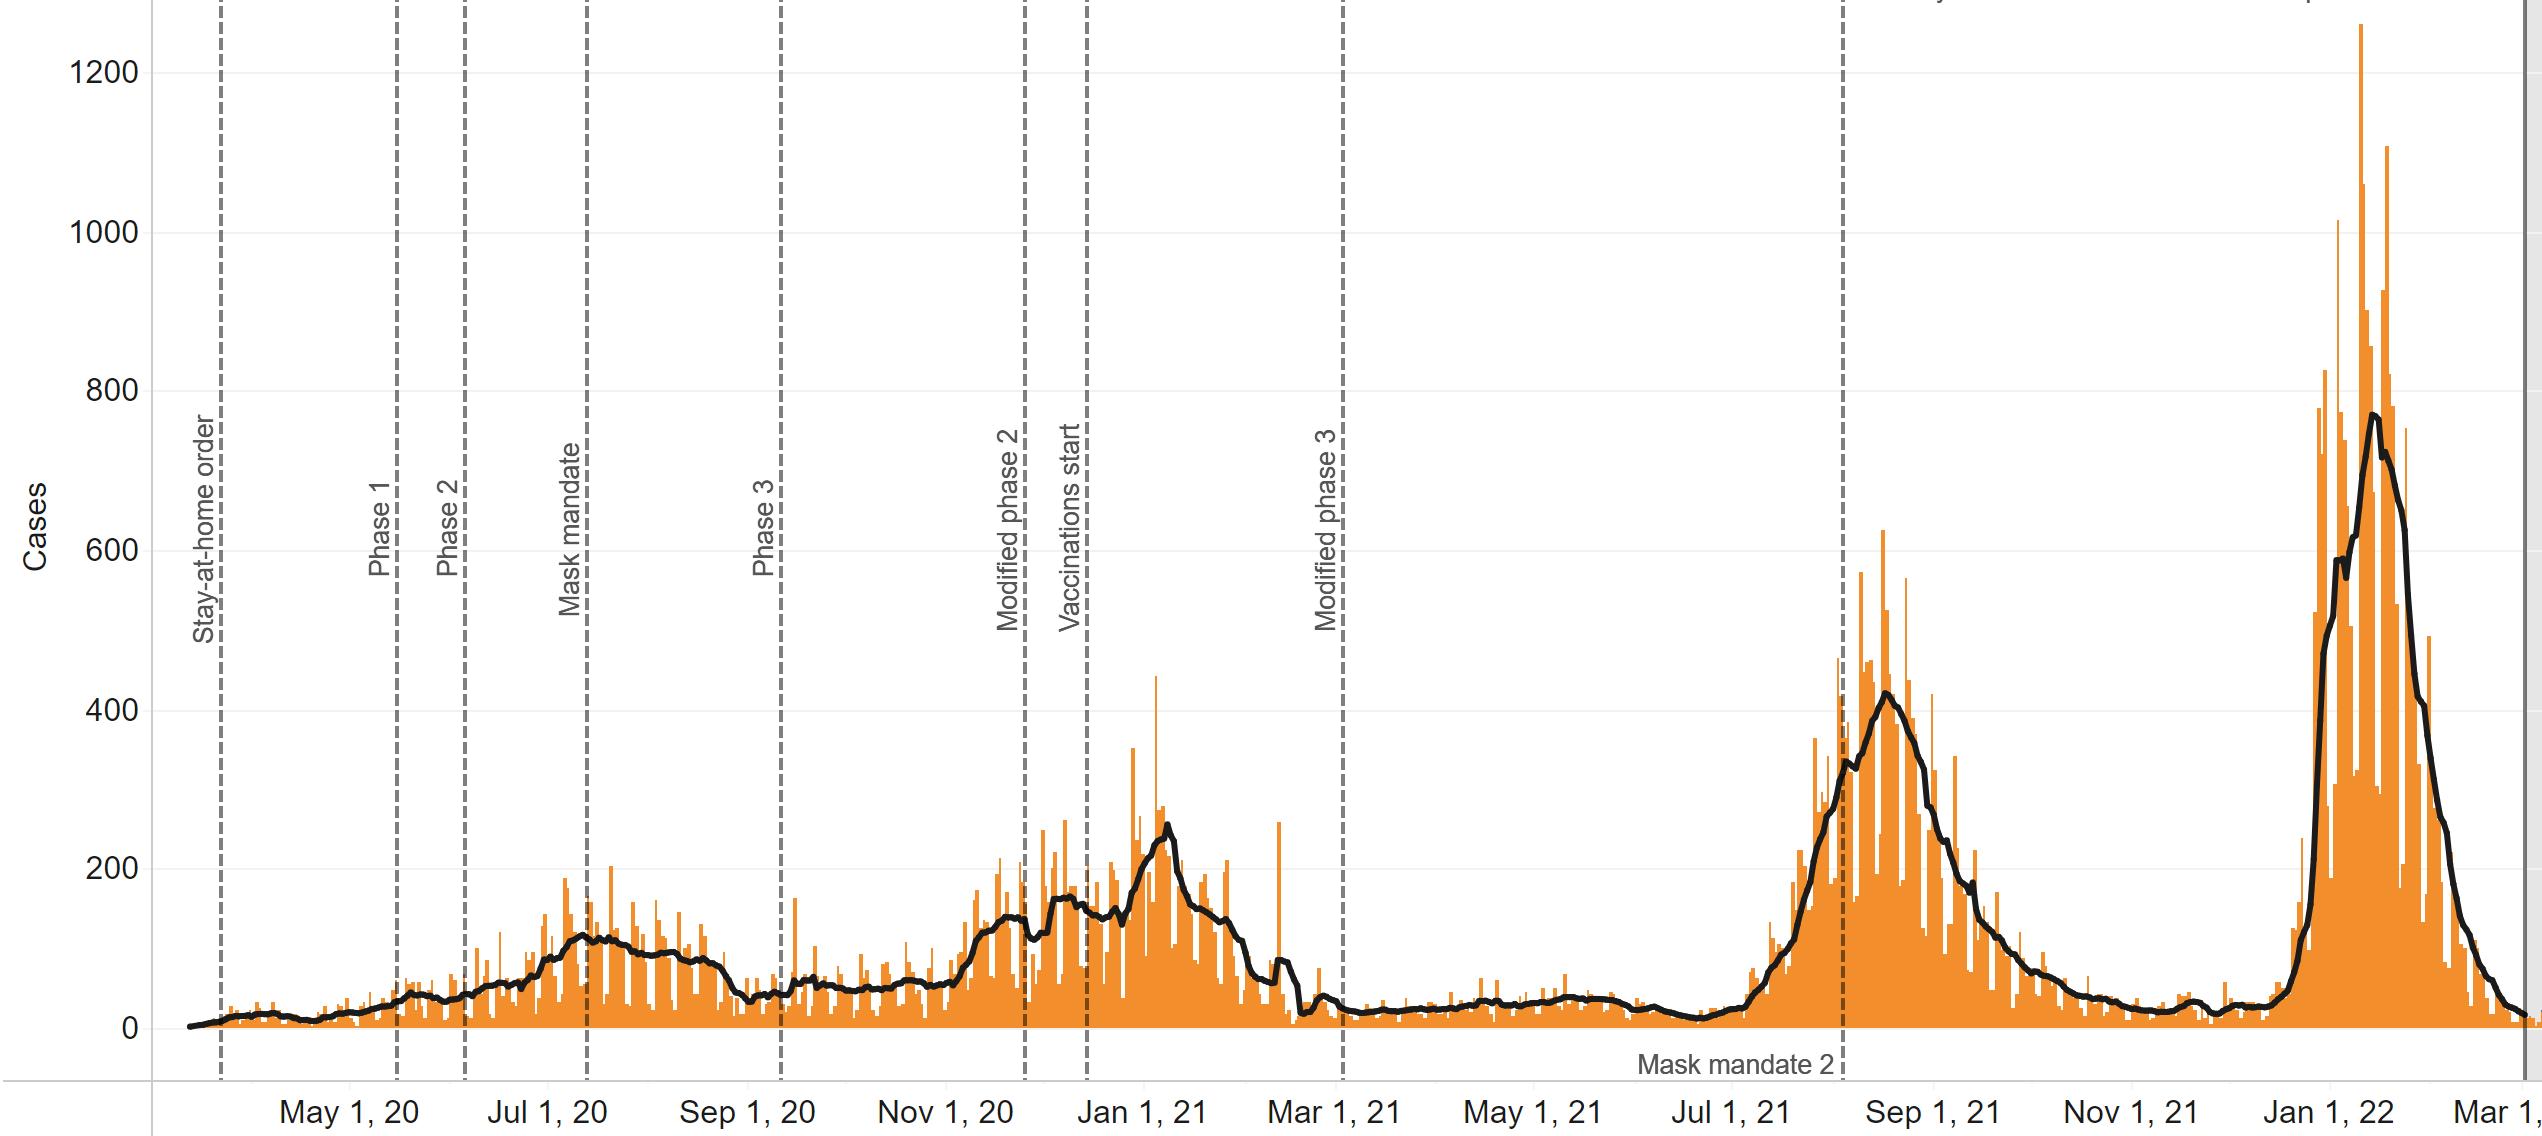
Source: Louisiana Office of Public Health, Region 6 (Central Louisiana), March 14, 2022.
Cases over time by age group in Louisiana through March 14, 2022.
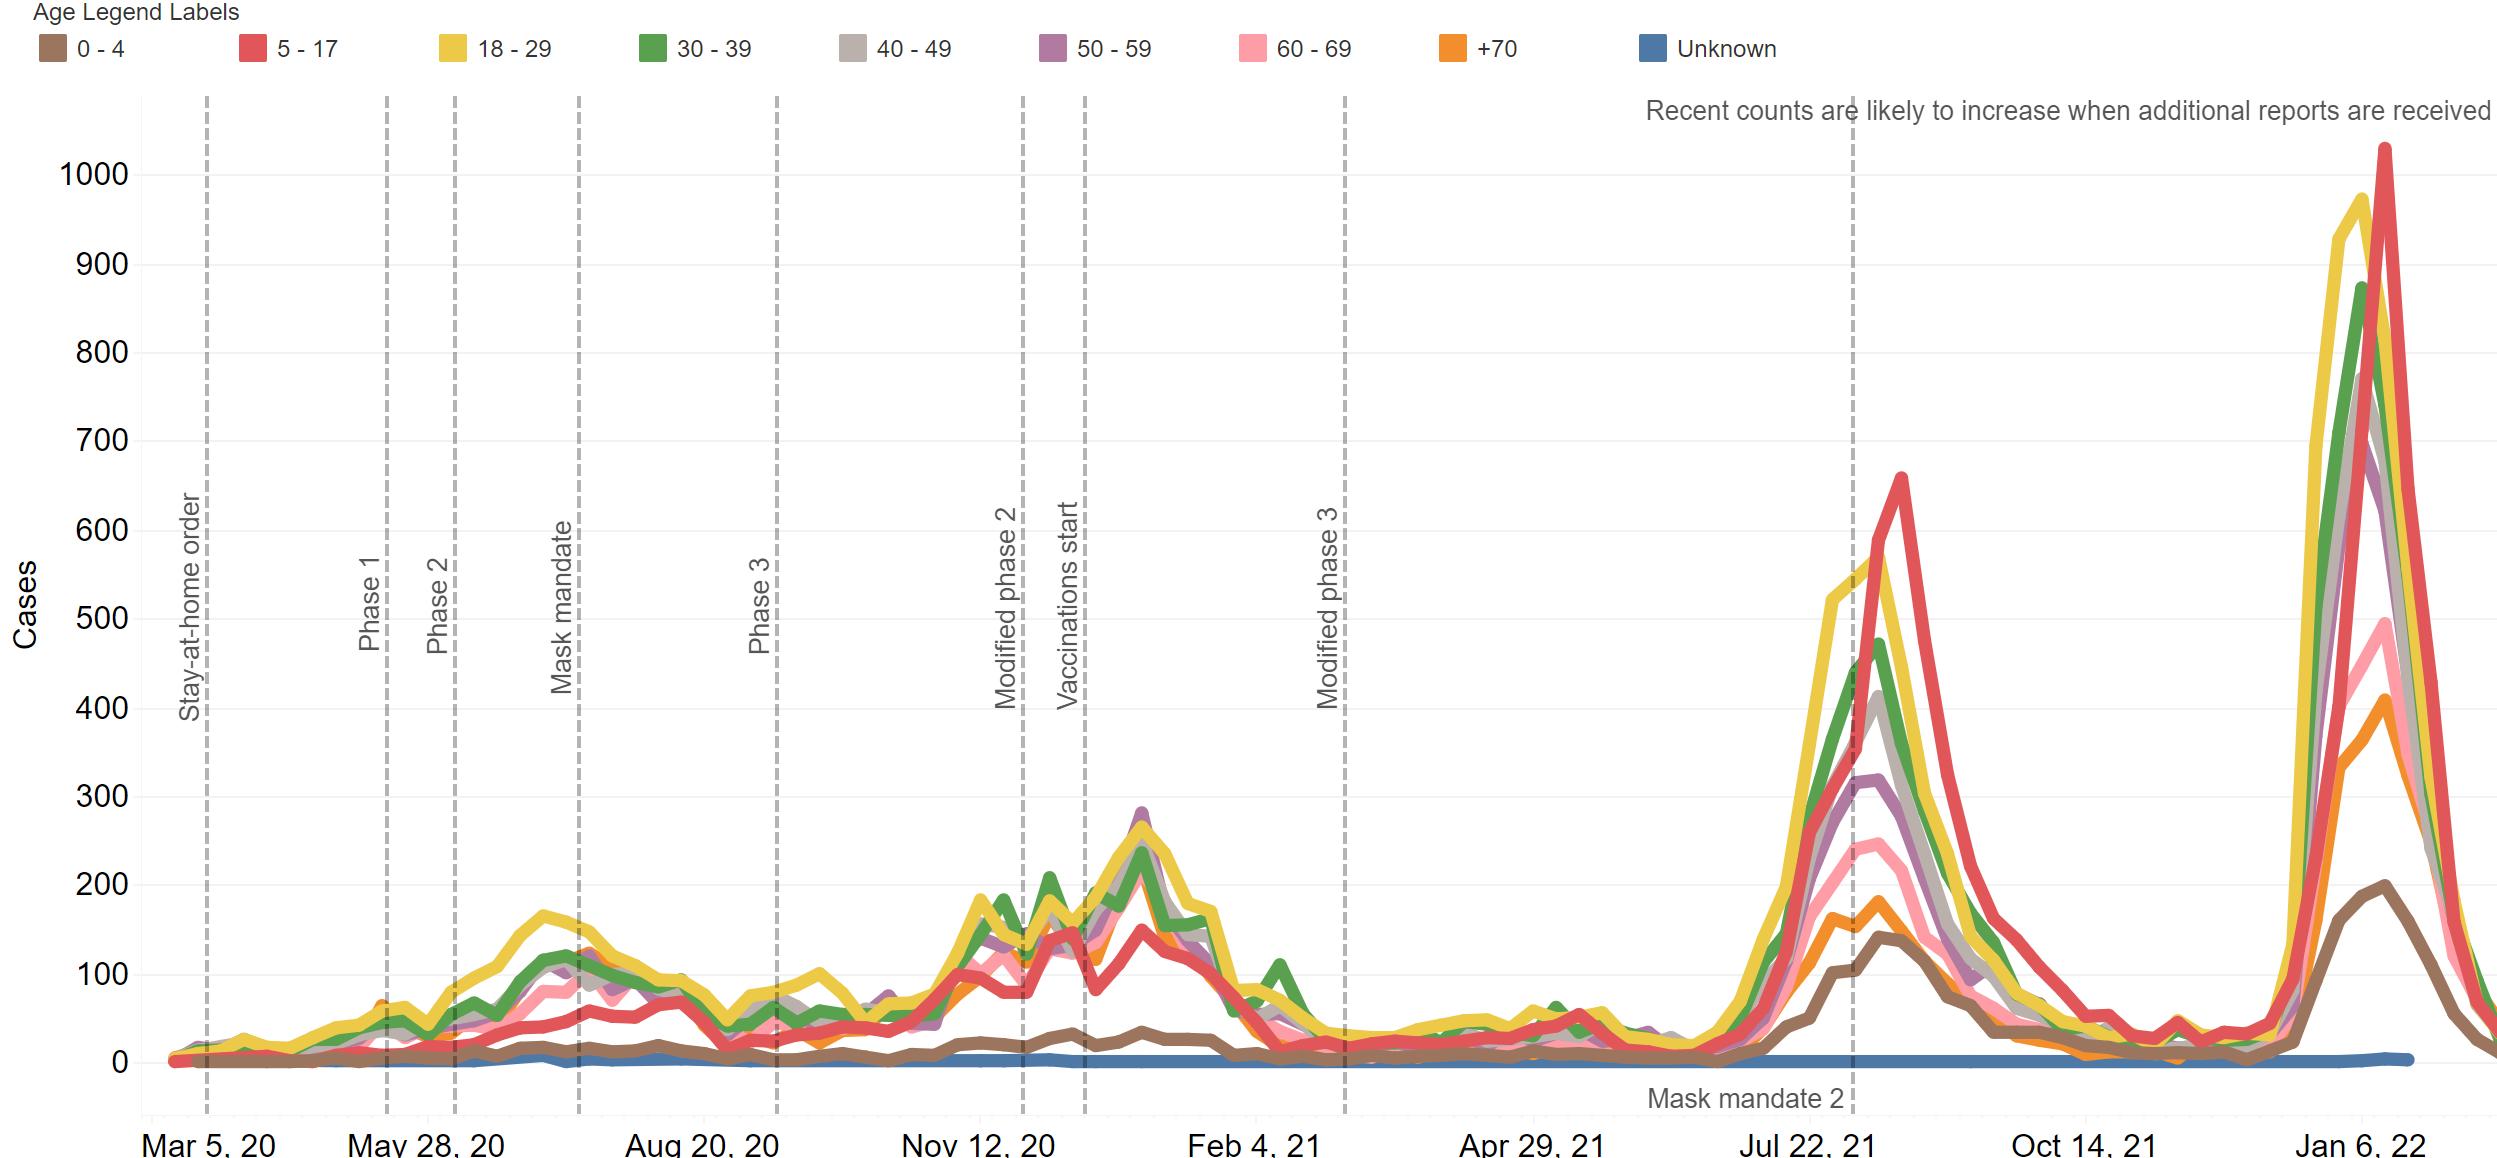
Source: Louisiana Office of Public Health, Region 6 (Central Louisiana), March 14, 2022.
COVID-19 percent positive and test volume in Region 6 as of March 14, 2022.
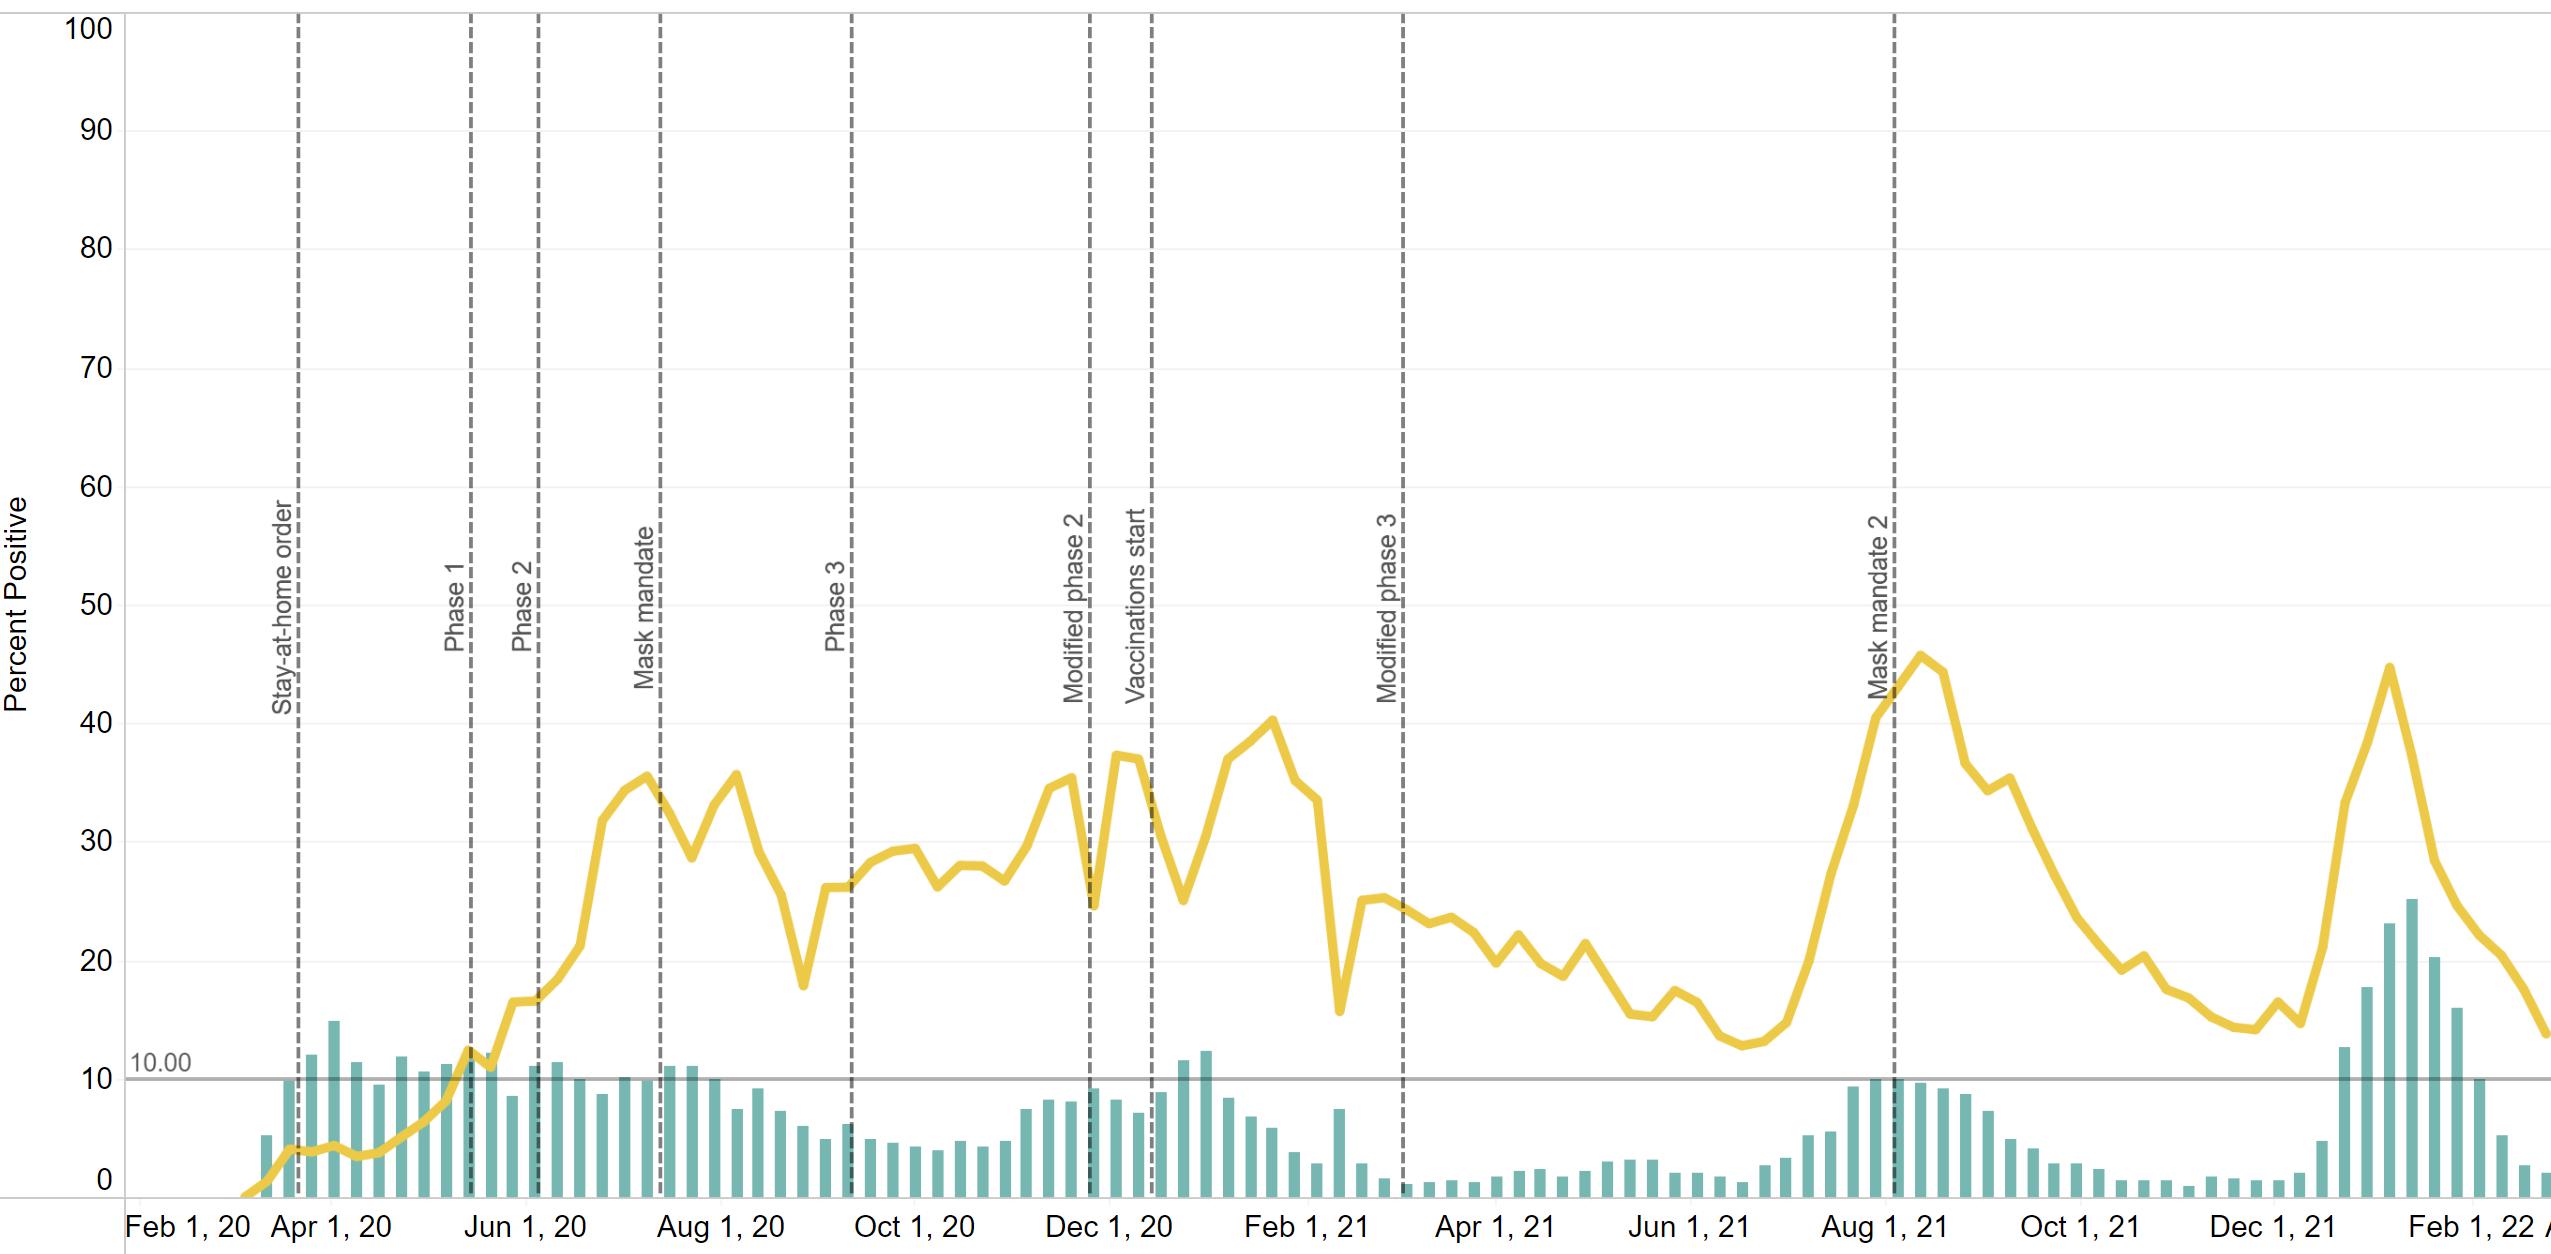
Source: Louisiana Office of Public Health, Region 6 (Central Louisiana), March 14, 2022..
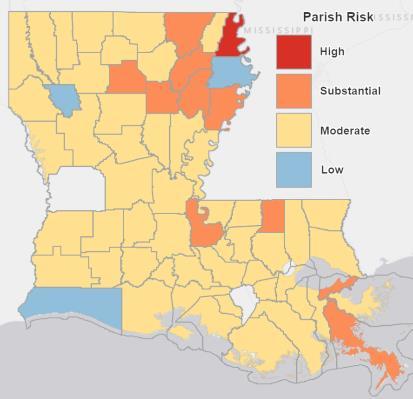
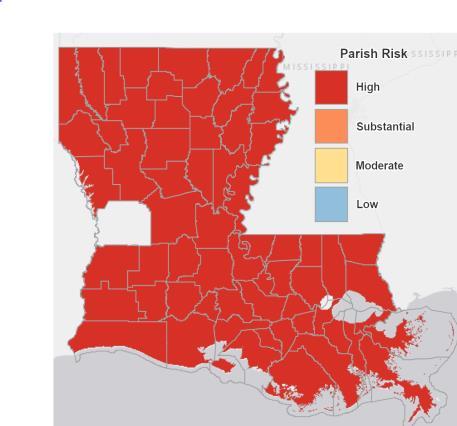
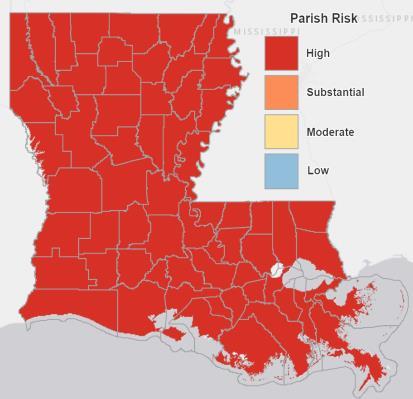
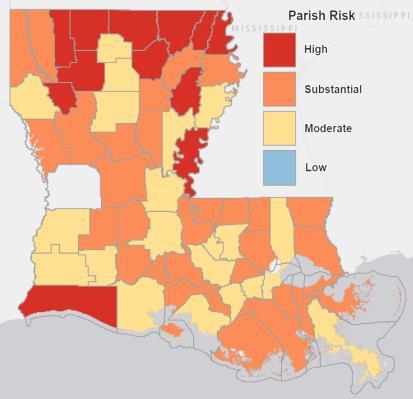
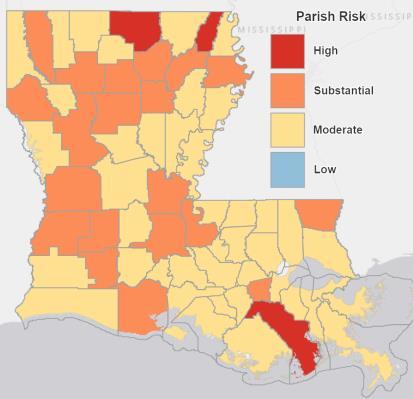
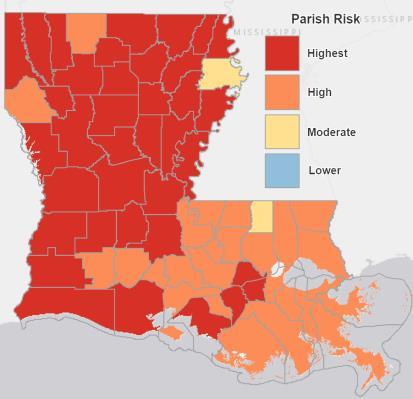
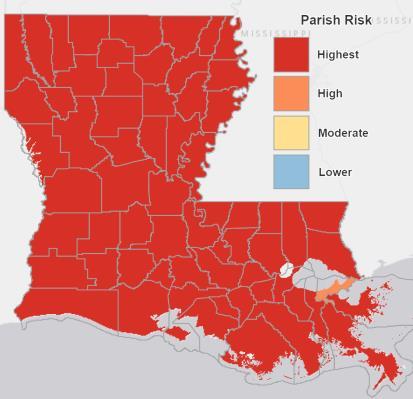
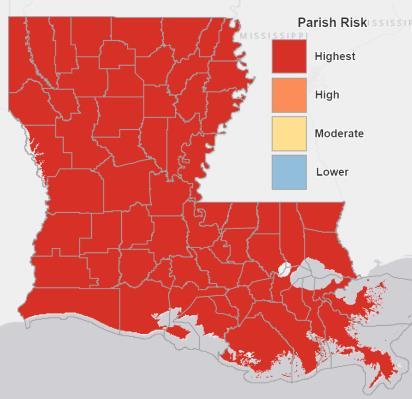
COVID-19 statewide risk by parish over time.
August 18, 2021
September 18, 2021
October 17, 2021
November 14, 2021
December 18, 2021
January 17, 2022
February 16, 2022
March 18, 2022
Source: Louisiana Office of Public Health, March 18, 2022.
Number of cases hospitalized (green line) and ventilated (yellow line) in Region 6 as of March 14, 2022.
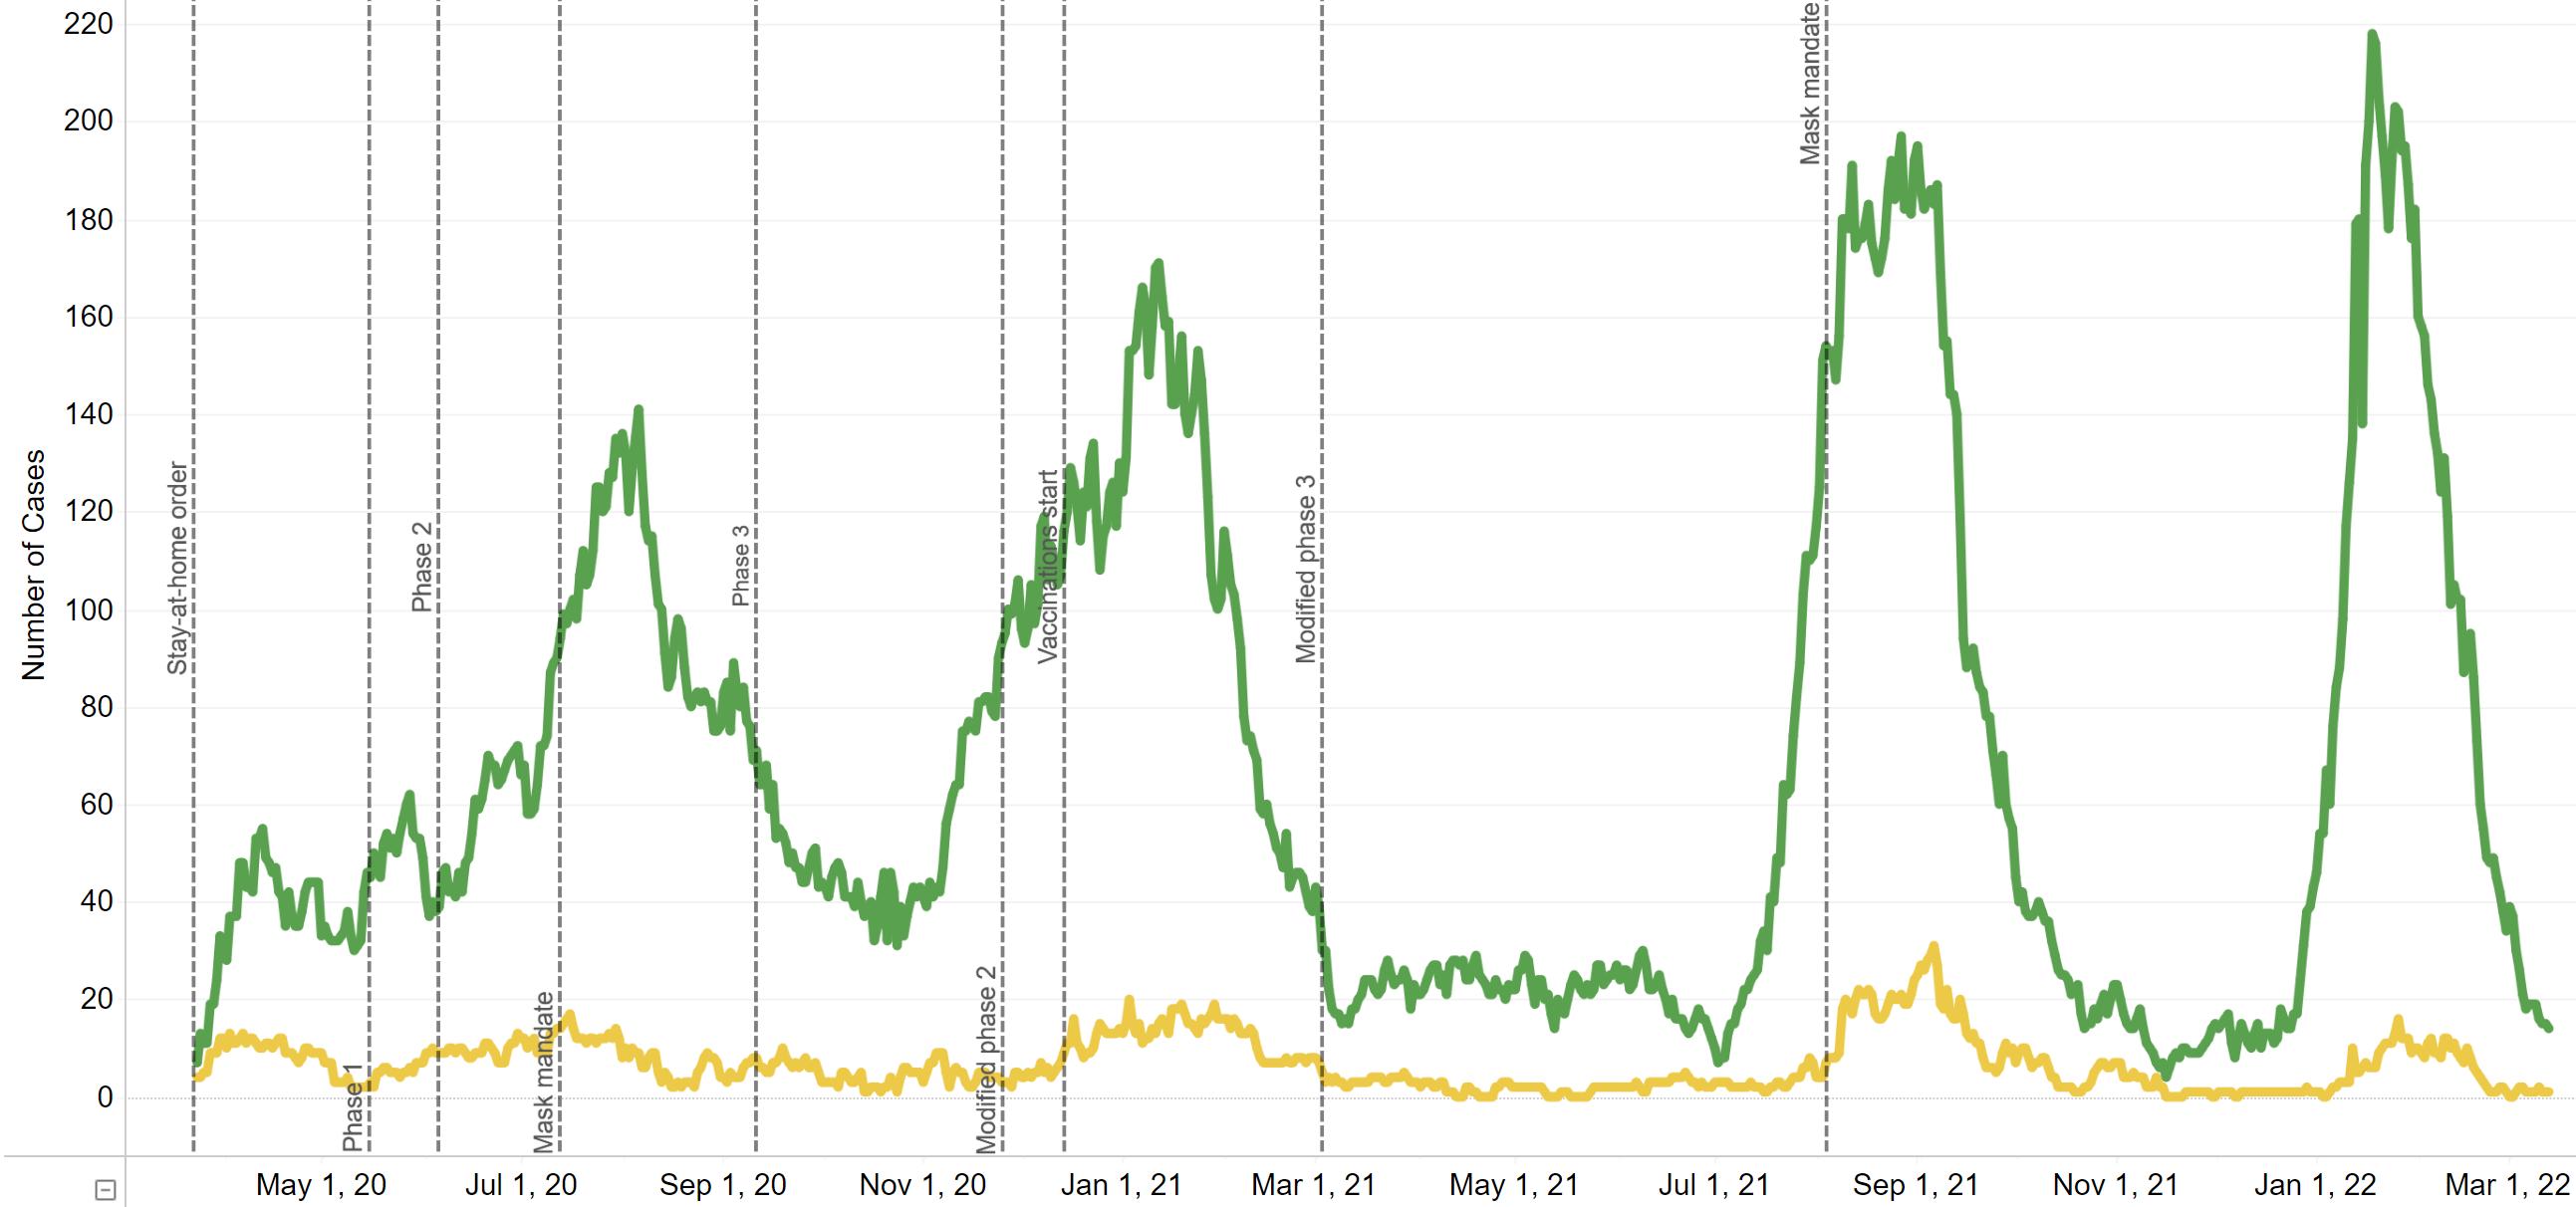
Source: Louisiana Office of Public Health, Region 6 (Central Louisiana), March 14, 2022.
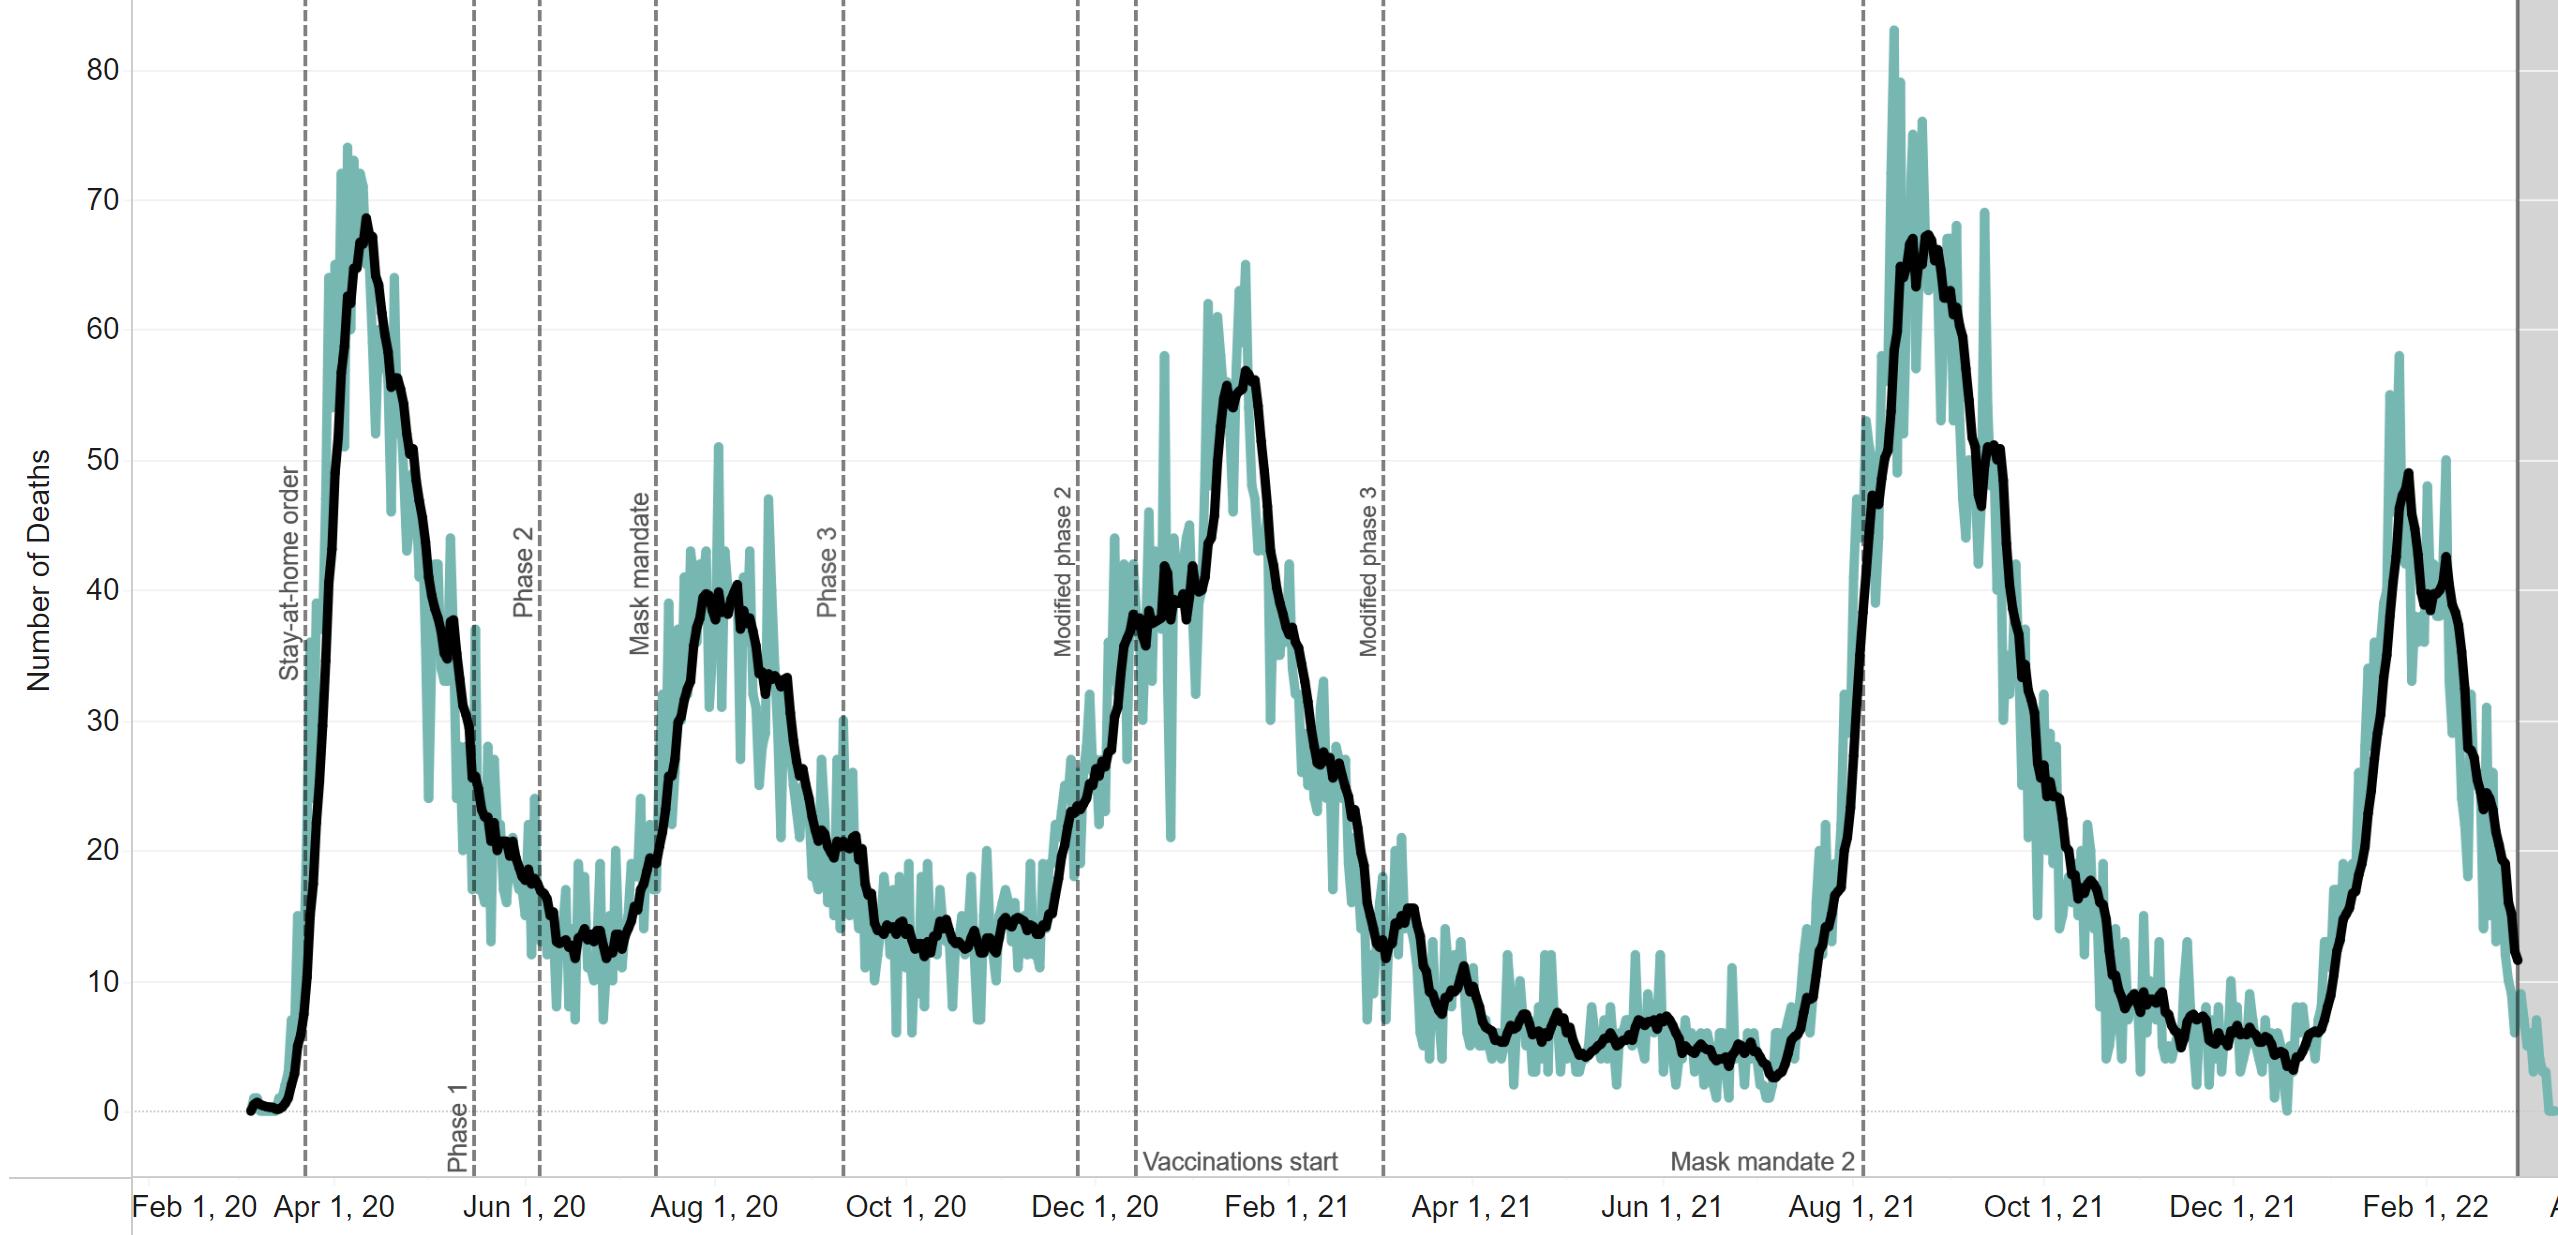
COVID-19 deaths by date of death statewide as of March 14, 2022.
Source: Louisiana Office of Public Health, Region 6 (Central Louisiana), March 14, 2022.
Employed persons in the Alexandria MSA from 2019 – 2022.
Employed Persons in Alexandria MSA 2019 - 2022
✓In January 2022, 62,125 were employed in the Alexandria metro area, a decrease of 150 from December.
✓Unemployment in Alexandria MSArose to 3.1% in January from 2.6% in December.
Source: Louisiana Workforce Commission, March 19, 2022
In December 2021,the unemployment rate for Alexandria MSAhit 2.6%, breaking record lows of 3.2% set in February 2006 and 3.8% December 1999.
The unemployment rate in Alexandria has been in a downtrend channel since April 2011.
Unemployment rate in the Alexandria MSA from 1990 – 2022. Source: Louisiana Workforce Commission, March 19, 2022
Unemployment Rate in Alexandria MSA 1990-2022
Initial and continued unemployment claims in Louisiana from January 2021 to February 2022.


✓Statewide average weekly initial unemployment claims filed in February fell to 1,517 from 2,178 in January, a decrease of -30%. ✓Statewide average weekly continued unemployment claims filed in February fell to 14,240 from 16,368 in January, a decrease of -13%.
Source: Louisiana Workforce Commission, March 14, 2022
Unemployment Claims in Louisiana 2021 - 2022
The table below shows January 2022 preliminary unemployment rate, labor force, and employment data for central Louisiana parishes.
In January, parishes in central Louisiana had an unemployment rate of 3.9%, compared to 3.4% in December.
January’s 3.9% unemployment rate for Cenla compared favorably to the state’s 4.3% rate.
LaSalle had the lowest unemployment rate in the state in January, with Rapides ranked 11th , Grant ranked 15th, and Natchitoches ranked 24th .
Data Source: Louisiana Workforce Commission, March 19, 2022.
The table below shows January 2022 preliminary unemployment rate, labor force, and employment data for Metropolitan Statistical Areas and the state.
✓At 3.1%, the Alexandria MSAhad the lowest unemployment rate among the state’s major metro areas for the 21th straight month.
▪ Louisiana’s unemployment rate rose 0.6% in January to 4.3% from 3.7% in December.
Data Source: Louisiana Workforce Commission, March 19, 2022.
The table below shows the number of unemployed, number of advertised jobs online, and the ratio of unemployed to advertised job openings online for Metropolitan Statistical Areas in Louisiana in January 2022.
✓
In January 2022, the Alexandria MSAhad the tightest labor market in the state with only 0.32 unemployed persons per job opening, meaning there were three job openings for every unemployed.
✓Every metro area in the state had more job openings than unemployed. However, rising unemployment may be the beginning of a trend reversal.
The tables below shows employers with the highest number of job openings advertised online on March 13, 2022.
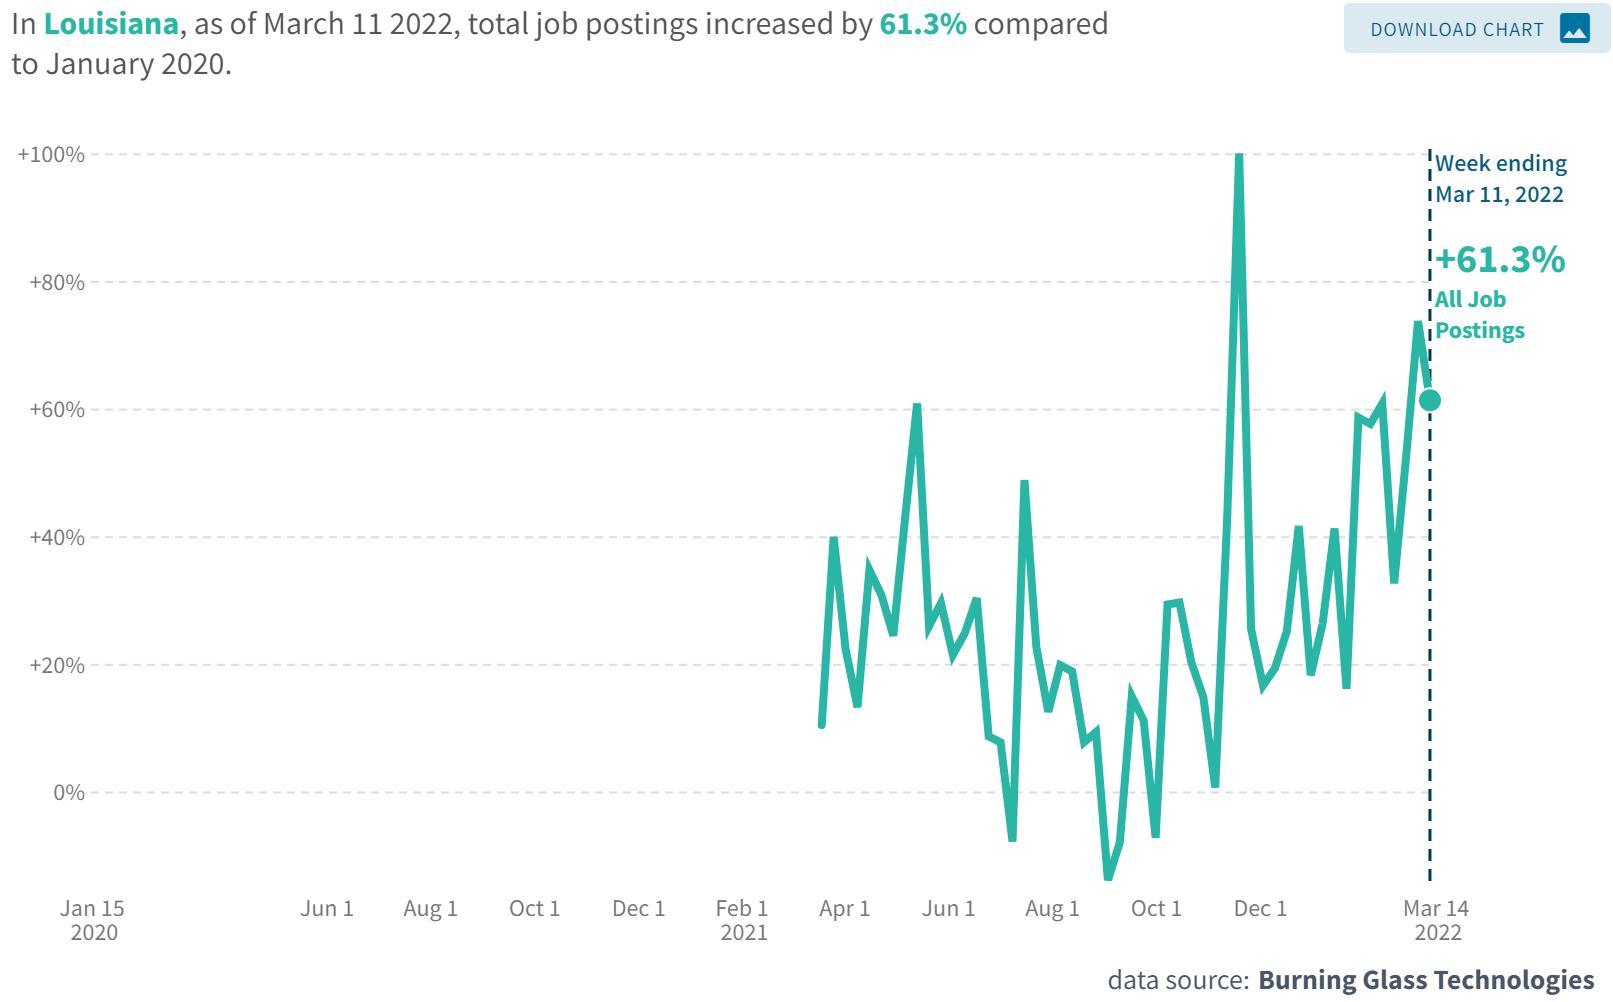
The chart below represents the percent change in job posting by industry in Louisiana as of March 11, 2022 with January 2020 as the baseline.
An overview of sales, vehicle sales, and hotel occupancy taxes collected in the February 2022 reflecting sales activity in January 2022.
February 2022
Notes: February tax revenue reflects sales activity in January. * Current month data are not available. N/a = Not available
Data Source noted in detailed reports.


An overview of sales tax revenue in other Rapides Parish towns and cities in February 2022 (excluding Alexandria and Pineville).
Note: Current tax revenue reflects sales activity in prior month.
Data Source: Rapides Parish Police Jury Treasurer’s Reports, March 2022.


(TR) Alexandria total sales tax revenue for February with previous month, year, and YTD comparisons.
(BR) Alexandria total monthly sales tax revenue from 2020 to present.
Note: February sales tax revenue reflects sales activity in January.
Data Source: Rapides Parish Police Jury Treasurer’s Reports, March 2022.
Avoyelles Parish total sales tax revenue for February with previous month, year, and year-to-date comparisons. Vehicle and hotel tax revenues are excluded.
Note: February sales tax revenue reflects sales activity in January.
Data Source: Avoyelles Parish School Board. March 2022.
Avoyelles Parish vehicle sales tax revenue for February with previous month, year, and year-to-date comparisons.
Note: February sales tax revenue reflects sales activity in January.
Data Source: Avoyelles Parish School Board. March 2022
Catahoula Parish total sales tax revenue for February with previous month, year, and year-todate comparisons.
Note: February sales tax revenue reflects sales activity in January.
Data Source: Catahoula Parish Tax Administrator, March 2022
Concordia Parish total sales tax revenue for February with previous month, year, and year-to-date comparisons.
Note: February sales tax revenue reflects sales activity in January.
Data Source: Concordia Parish Tax Administrator. March 2022
Evangeline Parish total sales tax revenue for February with previous month, year and YTD comparisons.
Note: February sales tax revenue reflects sales activity in January. Evangeline implemented a 1% sales tax increase July 1,
Data Source: Evangeline Parish Sales Tax Commissioner. March 2022
Evangeline Parish vehicle sales tax revenue for February with previous month, year and YTD comparisons.
Note: February sales tax revenue reflects sales activity in January. Evangeline implemented a 1% sales tax increase July 1, 2021.
Data Source: Evangeline Parish Sales Tax Commissioner. March 2022
(TR) Grant sales tax revenue for February with previous month, year, and YTD comparisons.
(BR) Grant monthly sales tax revenue from 2020 to present.
Note: February sales tax revenue reflects sales activity in January.
Data Source: Grant Parish Sheriff’s Office, March 2022.
La Salle Parish total sales tax revenue for February with previous month, year, and year-to-date comparisons.
Note: February sales tax revenue reflects sales activity in January.
Data Source: La Salle Parish Tax Administrator, March 2022
(TR) Natchitoches sales tax revenue for February with previous month, year, and YTD comparisons.
(BR) Natchitoches monthly sales tax revenue from 2020 to present.
Note: February sales tax revenue reflects sales activity in January.
Data Source: Natchitoches Parish Tax Commission, March 2022.
(TR) Natchitoches vehicle sales tax revenue for January with previous month, year, and YTD comparisons.
(BR) Natchitoches monthly vehicle sales tax revenue from 2020 to present.
Note: January sales tax revenue reflects sales activity in December. *February 2022 vehicle sales tax revenue was not available at time of publication.
Data Source: Natchitoches Parish Tax Commission, March 2022.

(TR) Pineville sales tax revenue for February with previous month, year, and YTD comparisons.
(BR) Pineville monthly sales tax revenue from 2020 to present.
Note: Current sales tax revenue reflects sales activity in the prior month.
(TR) Rapides Parish sales tax revenue for February with previous month, year, and YTD comparisons.
(BR) Rapides monthly sales tax revenue from 2020 to present.
Note: Current sales tax revenue reflects sales activity in the prior month.
Data Source: Rapides Parish Police Jury Treasurer’s Reports, March 2022.
Rapides Parish vehicle sales tax revenue for February with previous month, year, and YTD comparisons.
Data Source: Rapides Parish Police Jury Treasurer’s Reports, March 2022.
St. Landry Parish sales tax revenue for February with previous month, year, and YTD comparisons.
Note: February sales tax revenue reflects sales activity in January.
Data Source: Tax revenue data from St. Landry Parish School Board. March 2022
St. Landry Parish vehicle sales tax revenue for February with previous month, year, and YTD comparisons.
Note: February sales tax revenue reflects sales activity in January.
Data Source: Tax revenue data from St. Landry Parish School Board. March 2022
Remote seller tax revenue is tax revenue from online sales by location of the seller at the time of purchase.
August 2020 - February 2022
✓SinceAugust 2020 when remote sellers tax revenue collection started, $25 million in sales tax revenue have been collected from online sales in central Louisiana.
✓In the first two months of 2022, $3.18 million in online sales taxes have been collected compared to $2.83 million in 2021.
Note: Sales tax revenue collected in February reflects sales activity in January.
Data Source: Louisiana Sales and Use Tax Commission for Remote Sellers.August 2020 – February 2022
Remote seller tax revenue by parish with month-over-month and year-over-year comparisons.
✓Total online sales tax revenue in Cenla in February 2022 fell -30% from a month earlier but is up 3% from February 2021 and is up 12% year-todate.
Note: Sales tax revenue collected in February reflects sales activity in January.
Data Source: Louisiana Sales and Use Tax Commission for Remote Sellers.August 2020 – February 2022
Remote sellers tax revenue from online sales in Rapides Parish from July 2020 – January 2022.
Note: Sales tax revenue collected in one month reflects sales activity in the prior month.
Data Source: Louisiana Sales and Use Tax Commission for Remote Sellers.August 2020 – February 2022

(TR) Louisiana tax revenue from all sources for February with previous month, year, and YTD comparisons.
(BR) Louisiana monthly tax revenue from 2020 to present. Data
The valuation (estimated development cost) of new commercial construction permits issued by the City of Alexandria in February 2022 with previous month, year, and YTD comparisons.
The valuation (estimated development cost) of new residential construction permits issued by the City of Alexandria in February 2022 with previous month, year, and YTD comparisons.
This chart shows the valuation of permits issued by Rapides Area Planning Commission in Allen Parish in February between 2019-2022 with monthto-month, year-to-year, and year-to-date comparisons.
Data Source: RapidesArea Planning Commission, March 2022
This chart shows the valuation of permits issued by Rapides Area Planning Commission in Avoyelles Parish in February between 2019-2022 with month-to-month, year-to-year, and year-to-date comparisons.
Data Source: RapidesArea Planning Commission, March 2022.
This chart shows the valuation of permits issued by Rapides Area Planning Commission in Evangeline Parish in February between 2019-2022 with month-tomonth, year-to-year, and year-to-date comparisons.
Data Source: RapidesArea Planning Commission, March 2022.
This table and chart shows the valuation of permits issued by Natchitoches Parish Permit Office between 2021 – 2022 with month-to-month, year-to-year, and year-todate comparisons.
Data Source: Natchitoches Parish Permit Office, March 2022.
This table below shows the valuation of permits issued by the City of Natchitoches Planning and Zoning Office between 2019 – 2022 with month-to-month, year-to-year, and year-to-date comparisons.
Data Source: City of Natchitoches Planning and Zoning Office, March 2022.
This chart shows the valuation of permits issued by Rapides Area Planning Commission in the City of Pineville in February between 2019-2022 with month-to-month, year-to-year, and year-to-date comparisons.
Data Source: RapidesArea Planning Commission, March 2022.
This charts shows the valuation of permits issued by Rapides Area Planning Commission in Rapides Parish (excluding Alexandria) in February between 2019-2022 with month-to-month, year-to-year, and year-to-date comparisons.
Data Source: RapidesArea Planning Commission, March 2022.
The chart represents the Lumber Price Index in the U.S. from January 2020 – February 2022.
▪ In February 2022, the US Lumber Price Index increased 3.7% from January.
▪ The US Lumber Price Index has climbed for five consecutive months and stands 23% above a year ago.
Data Source: Fed Reserve Economic Database, St. Louis Federal Reserve Bank, March 19, 2022.
The chart represents the homeownership rate in five central Louisiana parishes from 2009-2020. The homeownership rate is computed by dividing estimated total population in owner-occupied units by the ACS 5-year estimated total population.
Alexandria / Pineville hotel occupancy rate expressed as a percentage for February with previous month, year, and year-to-date comparisons.
Avoyelles Parish hotel occupancy tax revenue for February with previous month, year, and year-to-date comparisons.
Note: February tax revenue reflects hotel occupancy activity in January. Hotel occupancy tax revenue is used as a proxy for hotel occupancy rate.
Data Source: Avoyelles Parish School Board. March 2022.
Natchitoches Parish hotel occupancy tax revenue for February with previous month, year, and YTD comparisons.
Note: February tax revenue reflects hotel occupancy activity in January. Hotel occupancy tax revenue is used as a proxy for hotel occupancy rate.
Data Source: Natchitoches Parish Tax Administrator, March 2022.
Rapides Parish hotel occupancy tax revenue for February with previous month, year, and YTD comparisons.
Note: February tax revenue reflects hotel occupancy activity in January. Hotel occupancy tax revenue is used as a proxy for hotel occupancy rate.
Data Source: Rapides Parish Police Jury Treasurer’s Reports, March 2022.

✓Nationally, air passenger traffic in February 2022 increased 17% from January 2022.
U.S. air passenger traffic in February 2022 was up 98.5% from a year ago.
Nationwide daily percentage of passengers passing through current TSA checkpoints in 2021-2022 expressed as a percentage of traffic in 2019. Data
U.S. Airport Passenger Throughput Traffic in 2021-22 as a Percent of Traffic from 2019
This data shows seated diners at restaurants on the OpenTable network in Louisiana in 2021-2022 compared with the same day of the week in 2019, the baseline. OpenTable reservations are mostly from southeast Louisiana restaurants.
OpenTable Reservations in Lousiana
Percent Change from 2019
✓ In February 2022 reservations were down -7% compared to February 2019. A year ago, reservations were down -45% compared to the baseline.
Source: OpenTable, https://www.opentable.com/state-of-industry, March 6, 2022
Total gasoline sales in gallons in Louisiana in 2019 - 2021.


✓December 2021 gasoline sales fell -3.4% from November but are up 7.1% from a year ago.
✓Gasoline sales YTD in December are 5.5% above the same period in 2020, but -0.8% below 2019.
Data Source: U.S. Energy Information Administration, Prices, Sales Volumes & Stocks by State, March 6, 2022
Weekly retail price of gasoline in the Gulf Coast region for all formulations from 2020 - 2022.
February retail gasoline price in Gulf Coast region average $3.21/gal. compared to 2.21 a year ago, a 45% increase.
Data Source: U.S. Energy Information Administration, Prices, Sales Volumes & Stocks by State, March 14, 2022


The chart below represents the weekly number of new businesses applications in Louisiana from 2020-2022
New business applications in February 2022 increased 2.5% from January 2022, but were down 3.5% from February 2021.
Note: Data reflects businesses applications, not necessarily business formations.
Data Source: U.S. Census Bureau, Business Formation Statistics, Retrieved March 12, 2022.
The chart below represents the number of new businesses established each month in Rapides from January 2019 through February 2022.


The number of new businesses established in Rapides in February 2022 decreased -34% from January.
Year-to-date, 83 new businesses have been created in Rapides in 2022 compared to 75 in 2021 and 82 in 2020.
Note: Data reflects businesses established in the current month.
Data Source: Rapides Parish Sales and Use Tax Department, March 8 2022.
Rapides Parish occupational license revenue YTD with previous YTD comparisons.
Note: Rapides Parish reflects unincorporated areas. Data reflects licenses paid year-to-date.
Data Source: Rapides Parish Police Jury Treasurer’s Reports, March 2022.
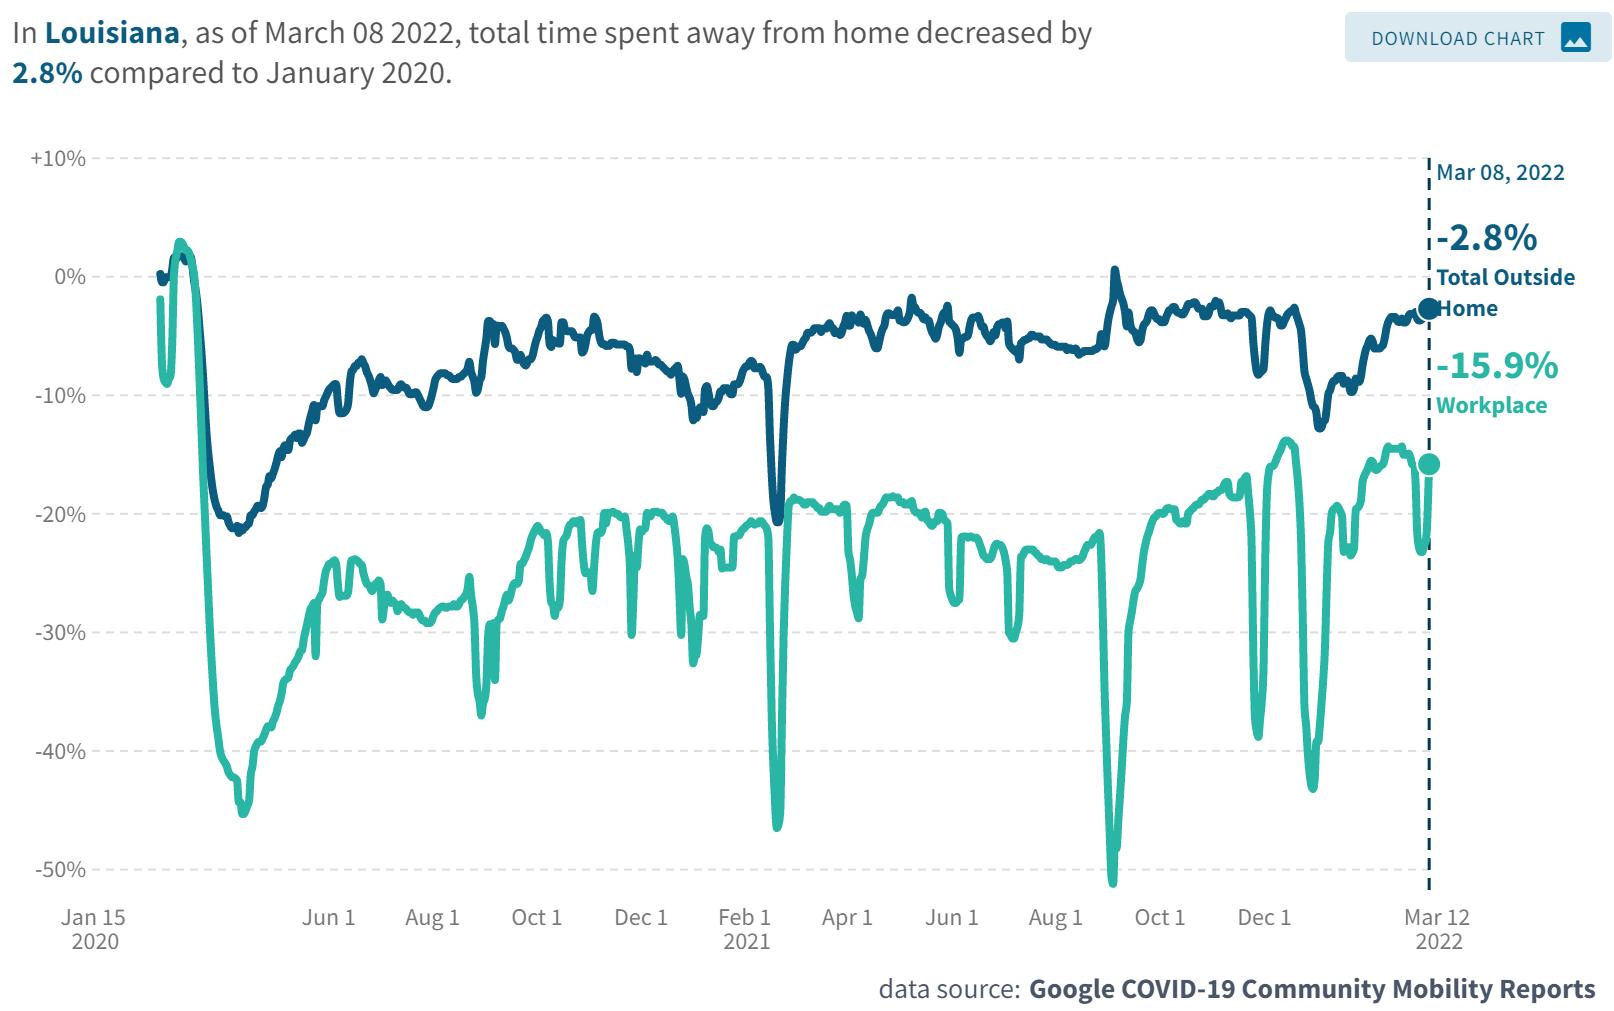
The chart represents the percent of time employees in Cenla and statewide spent at work as of March 8, 2022 with January 2020 as the baseline.
Represents the number of drilling rigs actively exploring for or developing oil or natural gas in Louisiana and the U.S. in 2020-2022.


✓Rig count in Louisiana decreased by 1 rig February from January.
✓Nationwide, the rig count is up 60% from a year ago.
Source: Baker Hughes, https://rigcount.bakerhughes.com/na-rig-count, March 6, 2022
Gaming revenue in Louisiana for January 2022 with previous month and year comparisons.
* Note: Year-to-Date percentage reflects
Data Source: Louisiana Gaming Control Board, March 6, 2022. http://lgcb.dps.louisiana.gov/revenue_reports.html
The data presented throughout the CENLA Economic Dashboard reflects contributions from the following local organizations.
Also, special thanks to the following partners for distributing the dashboard.
• LSUAFoundation
• Rapides Parish Policy Jury Treasurer
• Rapides Sales TaxAdministrator
• Avoyelles Parish School Board
• Alexandria International Airport
• Alexandria / Pineville Area CVB
• RapidesArea Planning Commission
• City ofAlexandria Planning Division
• Evangeline Parish Sales Tax Commissioner
• Concordia, Catahoula, & La Salle TaxAdministrator
• Louisiana Office of Public Health, Region 6
• St. Landry Parish School Board
• Grant Parish Sheriff’s Office
• Natchitoches Parish Tax Commission
• Natchitoches Parish Planning and Zoning
• City of Natchitoches Planning
• Central Louisiana Regional Chamber of Commerce
• Marksville Chamber of Commerce
• Bunkie Chamber of Commerce
• Evangeline Chamber of Commerce
• Concordia Chamber of Commerce
• St. Landry Chamber of Commerce
• Greater Vernon Chamber of Commerce
• Natchitoches Chamber of Commerce
• Next Issue: Week of April 18, 2022
Current and past issues of the CENLAEconomic Dashboard can be found at http://www.lsua.edu/coronavirus/cenla-economic-dashboard/