CENLA ECONOMIC DASHBOARD
February 18, 2022.
Dr.RandallDupont Dean,CollegeofBusinessLouisianaStateUniversityofAlexandria
rdupont@lsua.edu

Legislative Day at the Capitol will be April 13, 2022.


February 18, 2022.
Dr.RandallDupont Dean,CollegeofBusinessLouisianaStateUniversityofAlexandria
rdupont@lsua.edu
Legislative Day at the Capitol will be April 13, 2022.
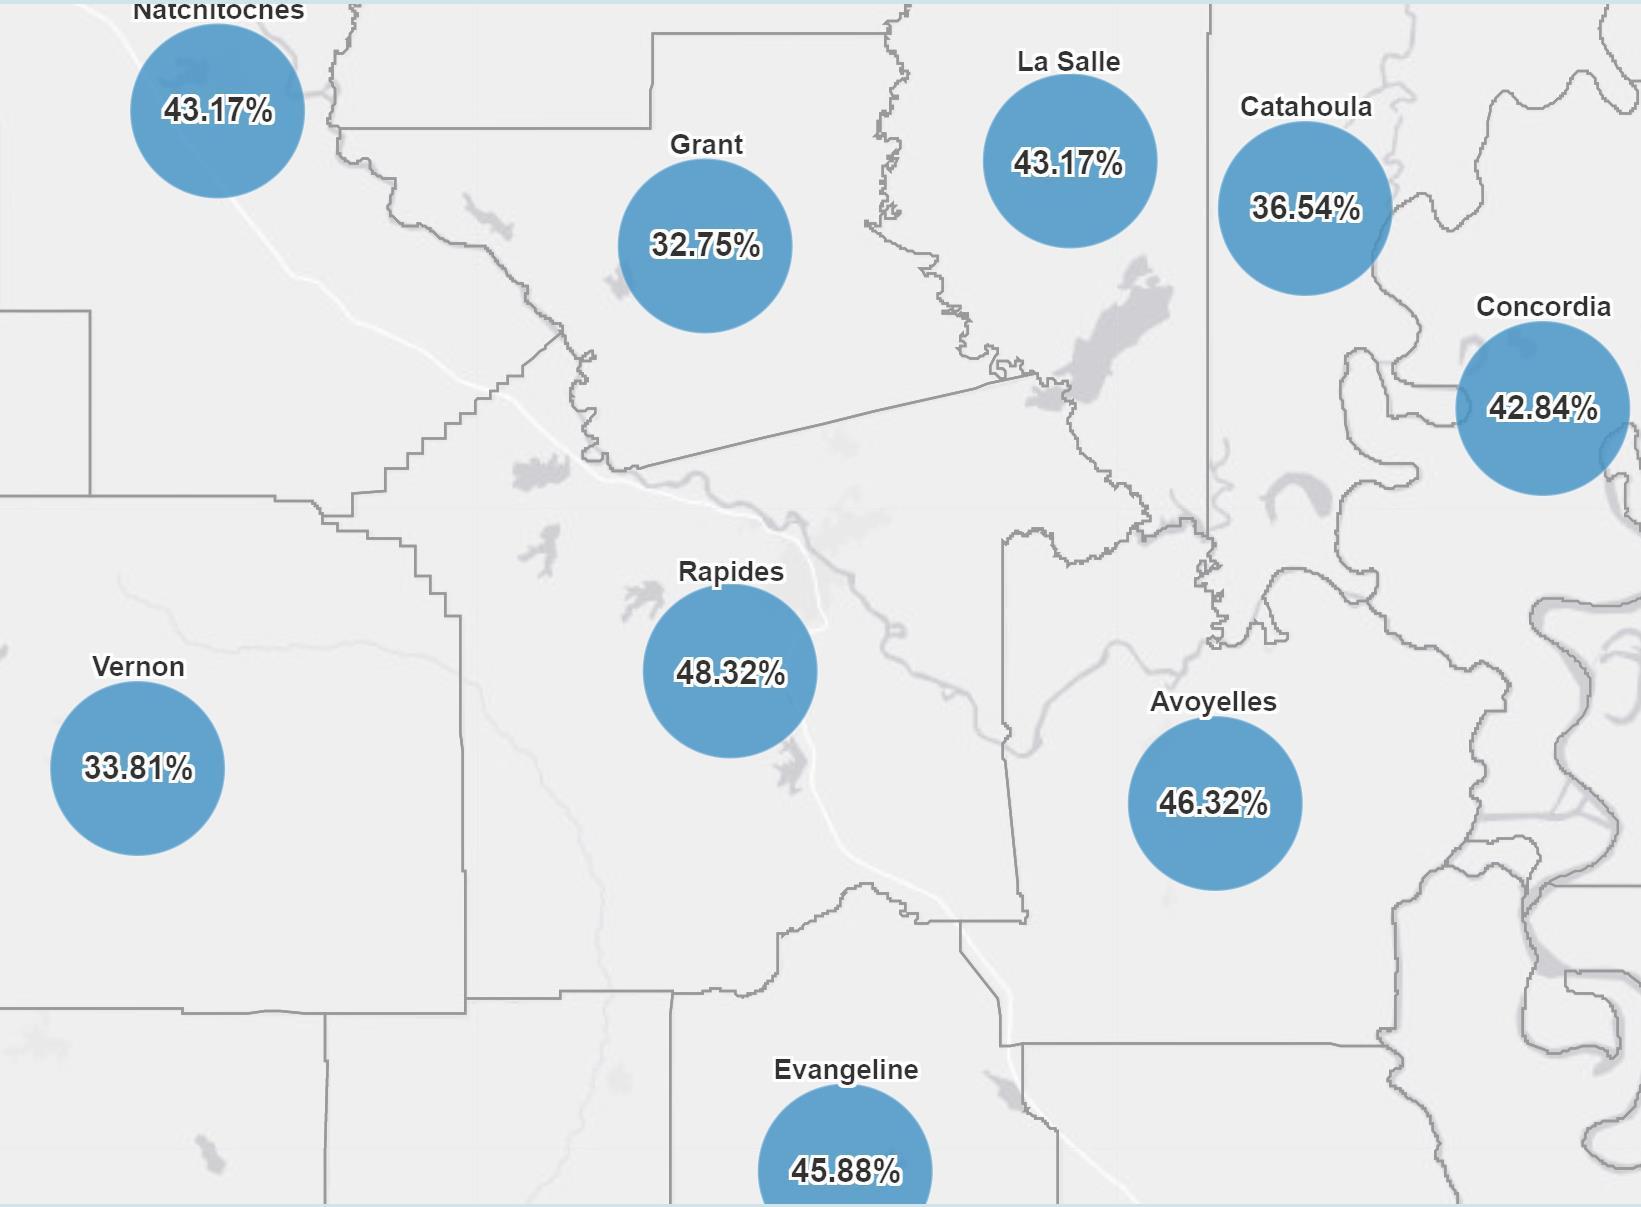
Region 6 has 43.3% of the population vaccinated as of mid-February, up from 42.4% in January, while Region 7 has a 43.7% of the population vaccinated as of mid-February, up from 42.8% in January. Rapides andAvoyelles have the highest percentage of completed vaccinations in mid-February in Region 6 at 48.3% and 46.3%, while Caddo and Bossier have the highest percentage of completed vaccinations in mid-February in Region 7 at 45.3%% and 44.0%, respectively. Natchitoches is ranked third in Region 7 at 43.2%.
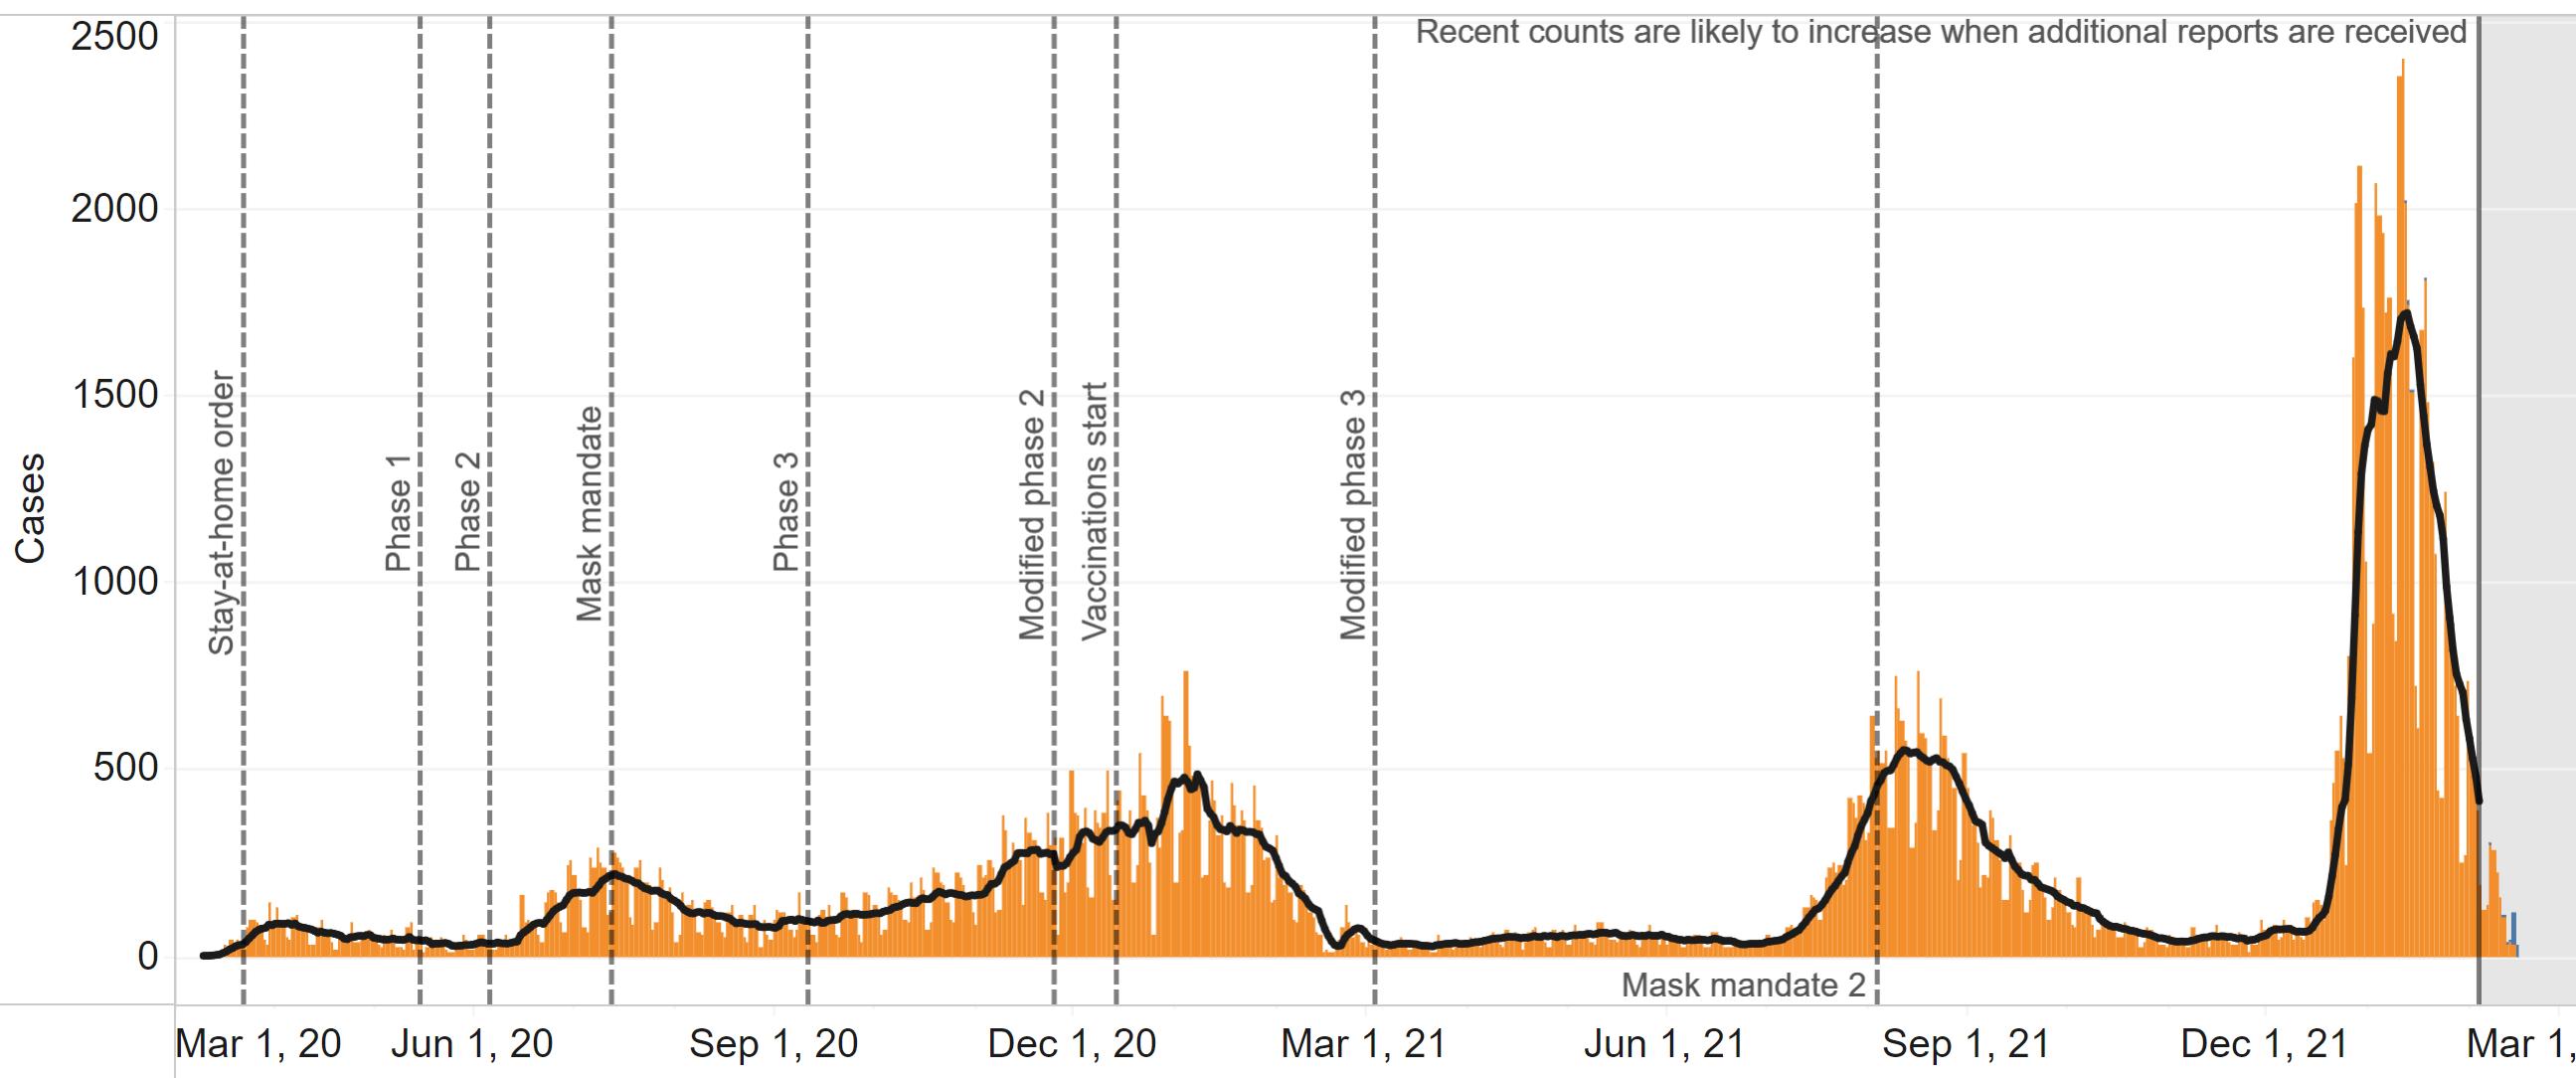
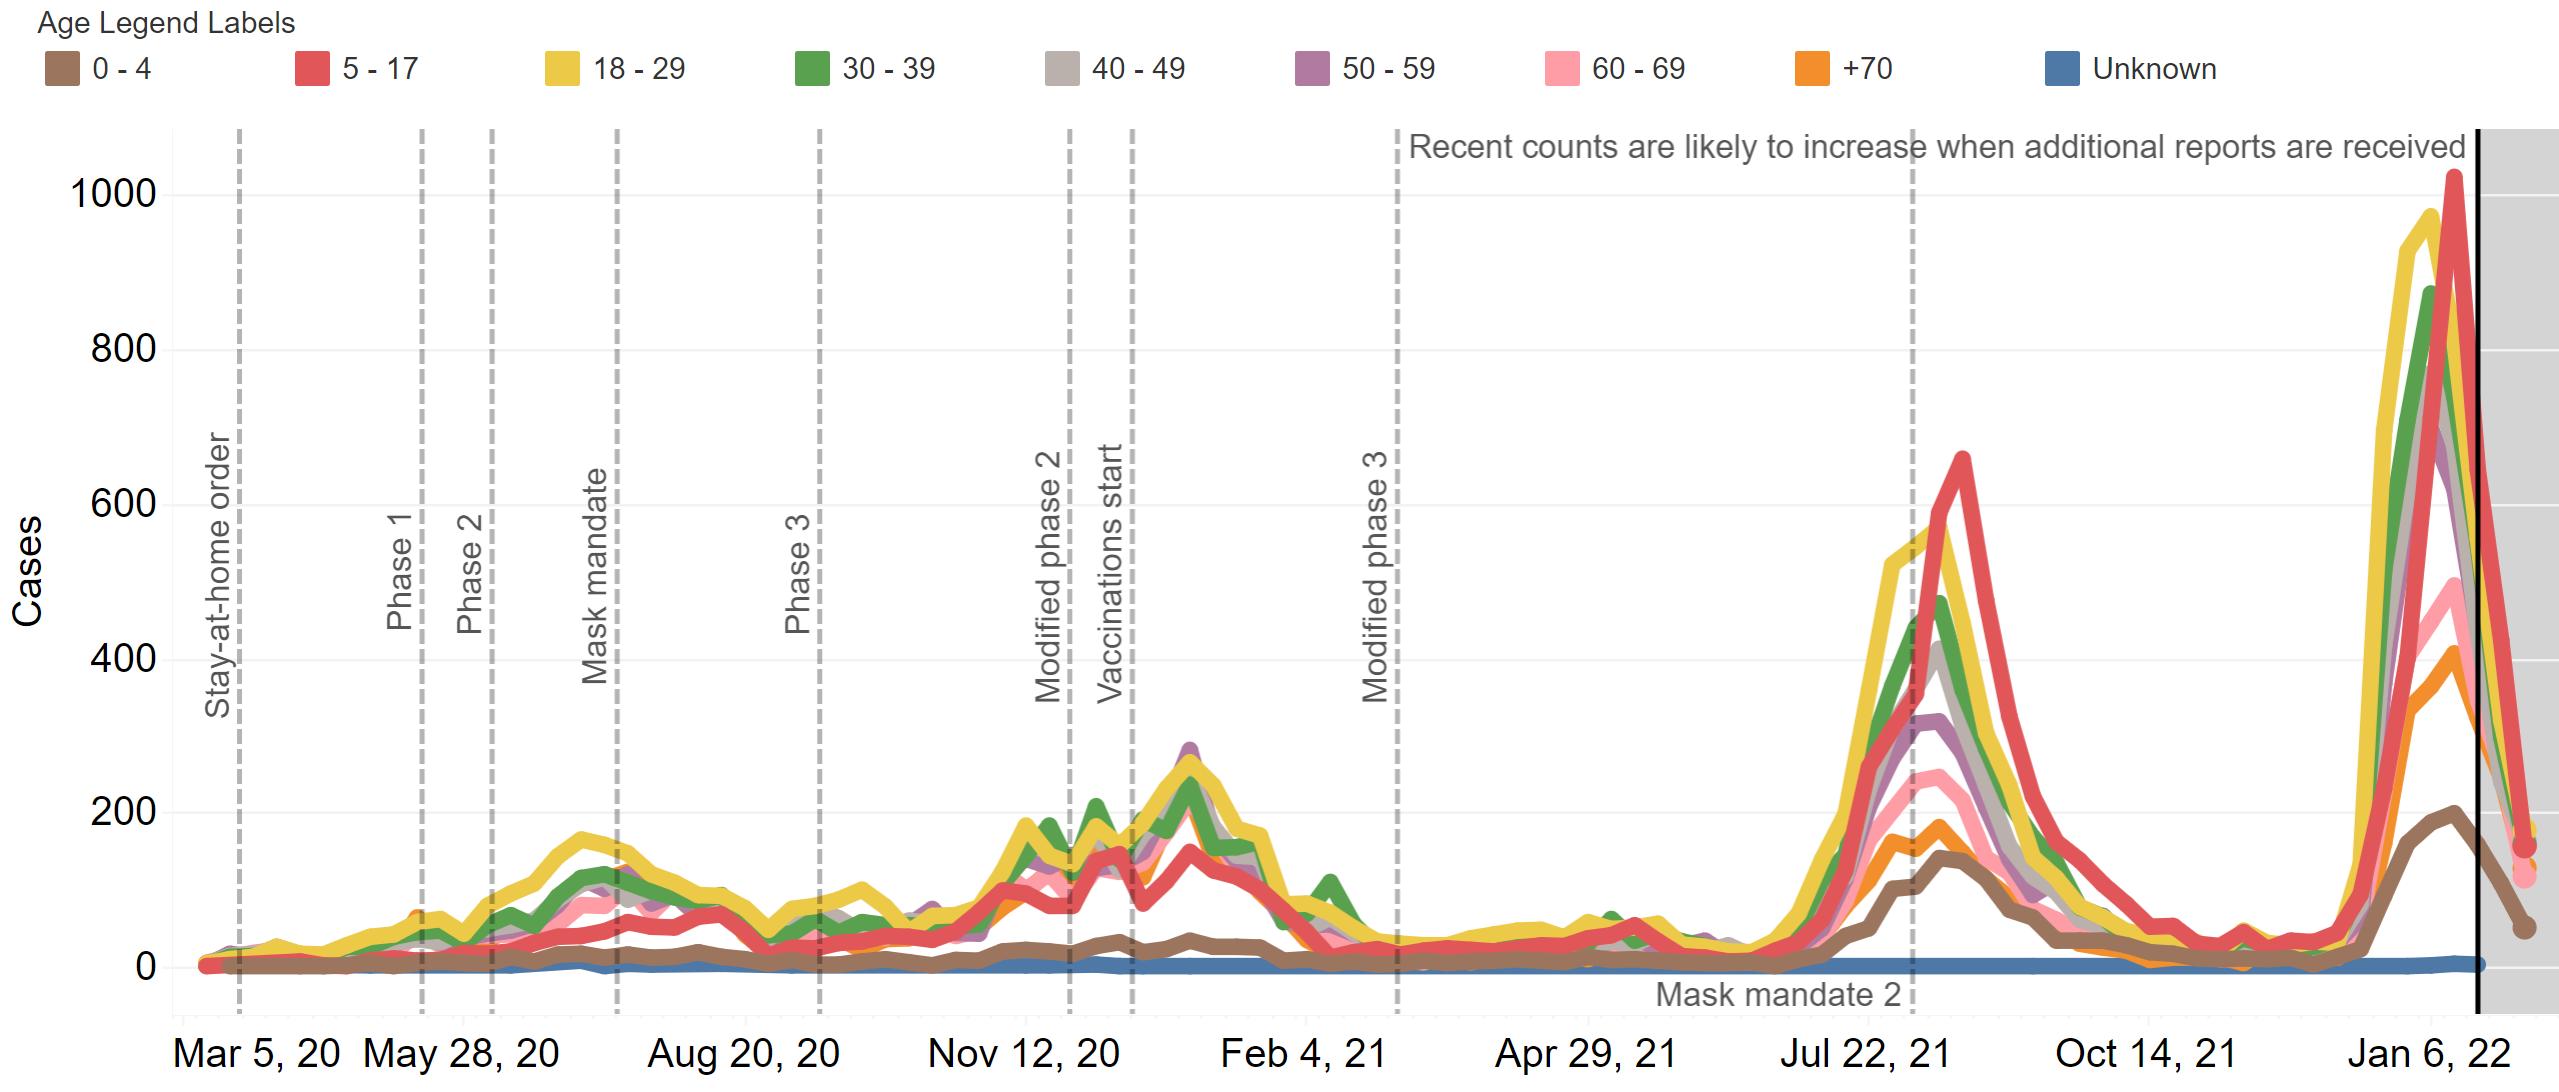
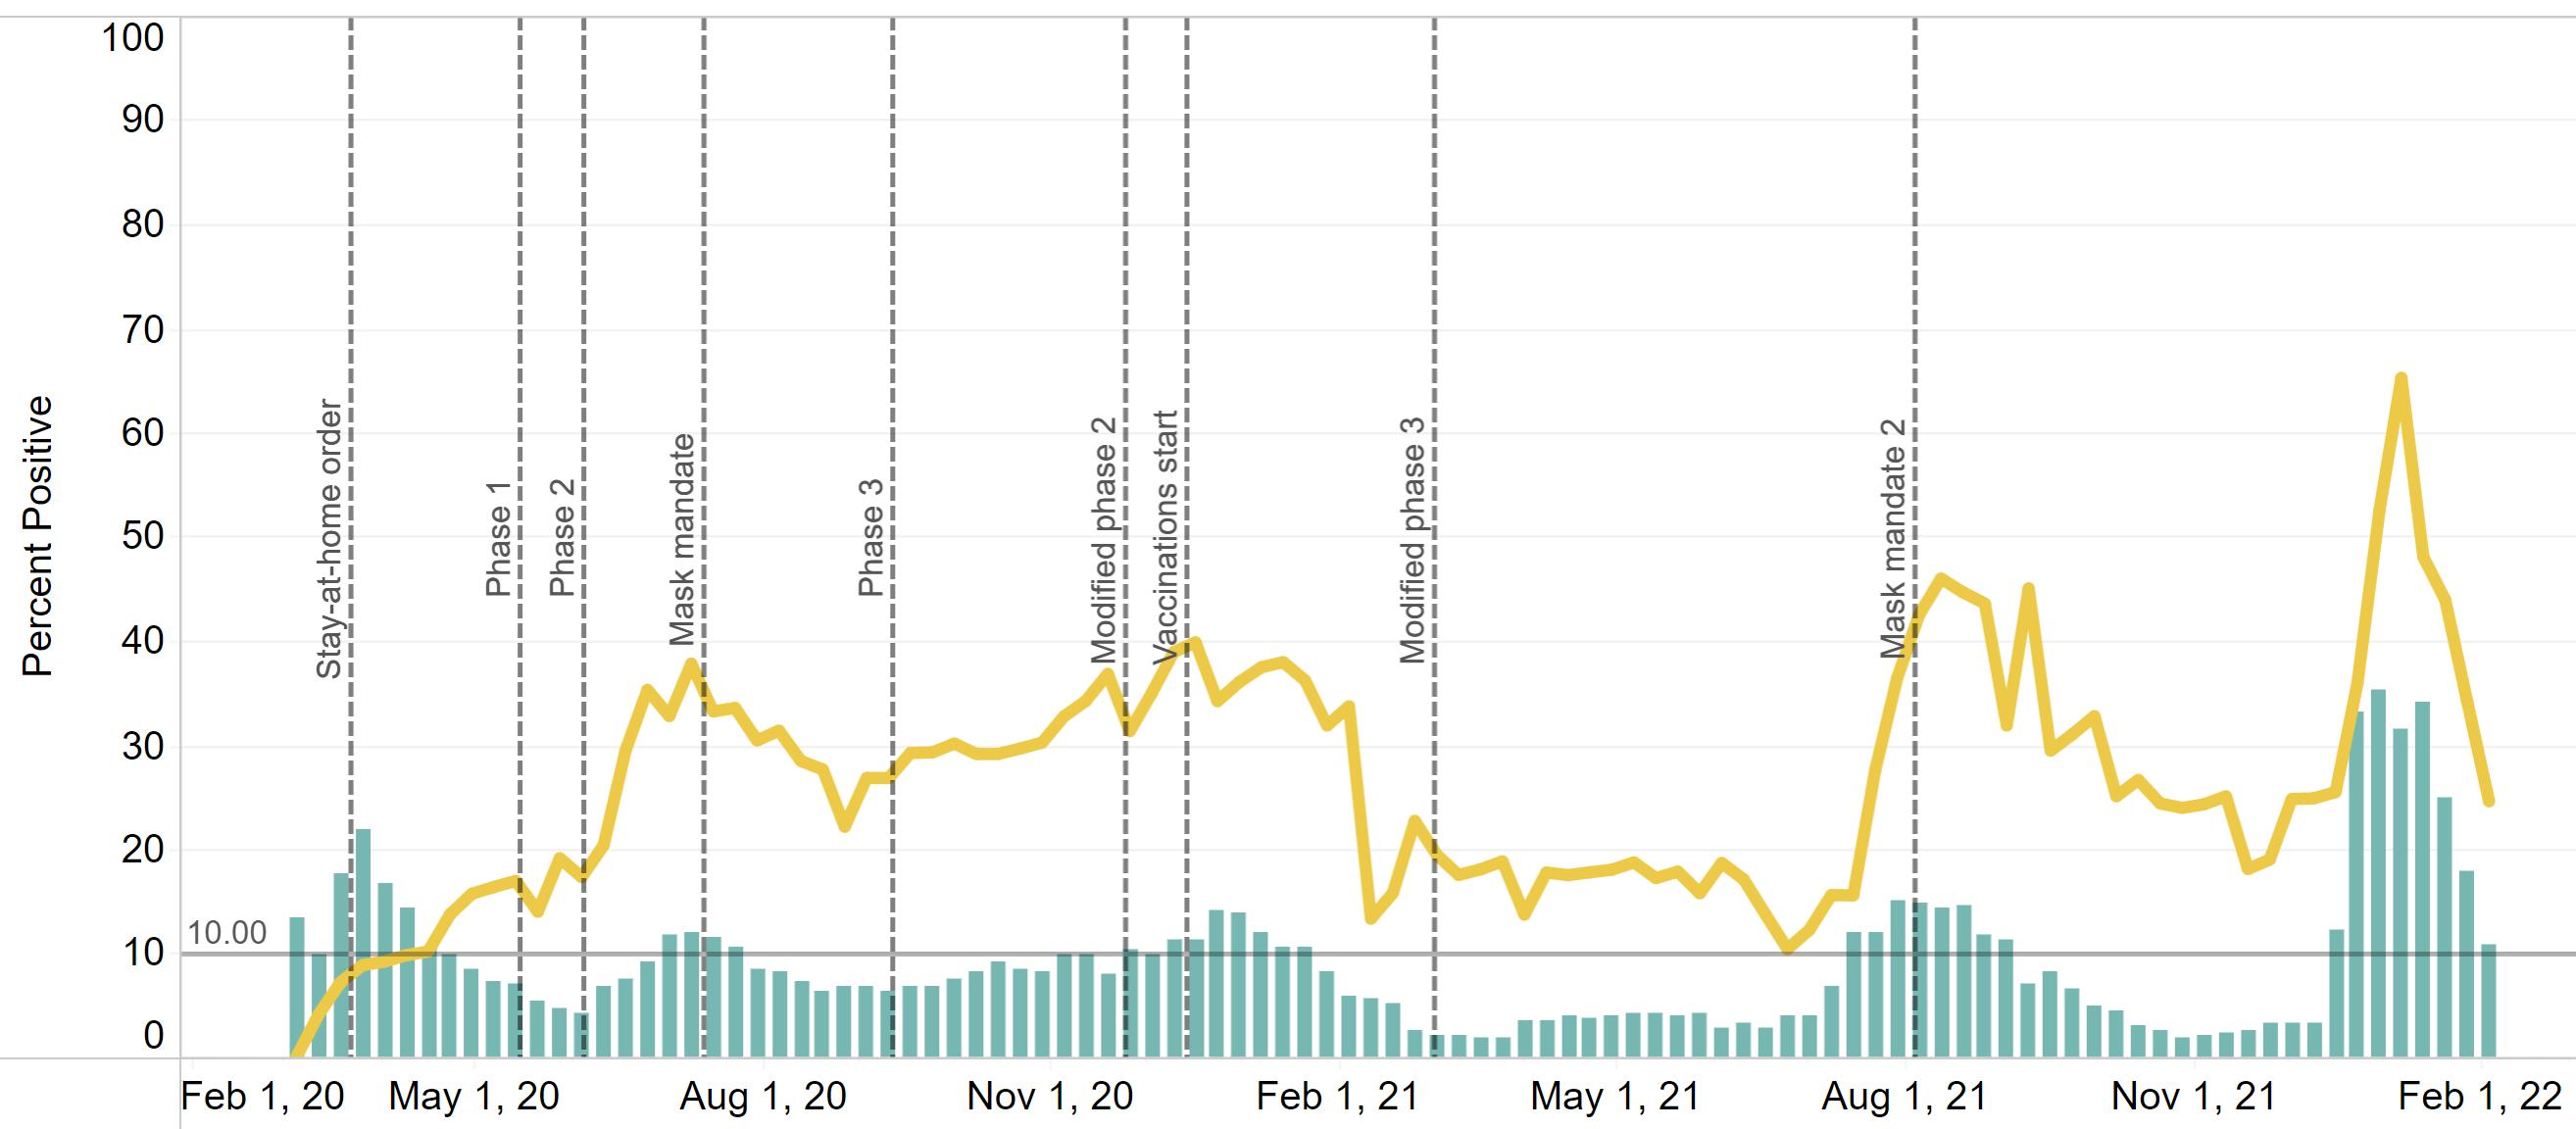
The number of cases in the 5th wave which started in December has rapidly decreased since the last update. The decrease is seen across all age groups. Testing in both regions remain near 10% positivity with all parishes still considered at high risk.
In December 2021, 61,224 were employed in the Alexandria metro area, a decrease of 116 since November. Unemployment inAlexandria MSAfell to 2.8% in December from 3.0% in November. The central Louisiana region had an average unemployment rate of 3.4% compared to 3.7% statewide. Grant and Rapides had the 13th and 17th lowest unemployment rate in the state, respectively. Natchitoches ranked 26th.
TheAlexandria labor market remains tight with 6,035 openings for 1,737 unemployed. It’s unemployed-to-jobopening ratio of .29 means there are more than three jobs for each unemployed. Every metro area in the state had more job openings than unemployed. The unemployment rate in Cenla fell to 3.4% in December compared to 3.7% in statewide.

Changes in consumer spending are measured by changes in sales tax revenue. Sales taxes collected in January reflected activity in December. Consumer spending in December was up in all eleven jurisdictions reporting, ranging from 12% to 49% over the previous month. Likewise, all jurisdictions reported year-to-date gains, ranging from 2% for Pineville and Concordia to 31% for Catahoula. Vehicle sales were up across four of the five parishes that reported vehicle sales tax revenue.
Online shopping in central Louisiana during the 2021 holiday season (November and December) increased 40% from 2020. Online shoppers in Cenla shopped early this holiday season, with November accounting for the larger share of the spending. November online sales tax revenues stood at $2.10 million compared to $1.87 million in December.
Nationally, air passenger traffic in January 2022 declined -22% from December 2021. However, U.S. air passenger traffic in January 2022 was up 96% from a year ago, but still -25% below January 2019.
Natchitoches posted a 23% increase in hotel occupancy in December compared to -12% and -21% decreases in Rapides andAvoyelles, respectively. November 2021 gasoline sales in Louisiana increased 2.6% from October and are up 10% from a year ago. Gasoline sales YTD through November 2021 are 5.3% above the same period in 2020, but -0.9% below 2019.
Because of the volatility of monthly data, year-to-date permit valuations presents a clearer picture of local construction. Commercial permits in 2022 inAlexandria are down -73% while the value of residential permits are down -34%. Residential permits inAlexandria totaled $1.4 million in January down from $2.1 million in December. In the first month of the year, permit valuations issued are down -63% inAllen, -10% inAvoyelles, and -19% in Evangeline. Permit valuations in Rapides and Pineville are up 35% and 5055%, respectively, for the year.
The US Lumber Price Index in January increased for the fourth consecutive month. In January 2022, the US Lumber Price Index increased 17% from December, recording a 33% increase over the past two months. Currently, the Index stands 26% above a year ago.
Housing market data in the Dashboard has been revamped recently. While data on the Alexandria housing market remains, data for Natchitoches, Fort Polk (Leesville), and Opelousas have been included to give a broader representation of the central Louisiana housing market from 2019 forward.
The number of new businesses established in Rapides in January 2022 increased 85% from December and was 16% higher than January 2021. Statewide, new business applications in January 2022 remain unchanged from December 2021, but are down 20% from January 2021.
COVID-19 vaccinations as a percent of region population as of February 16, 2022.
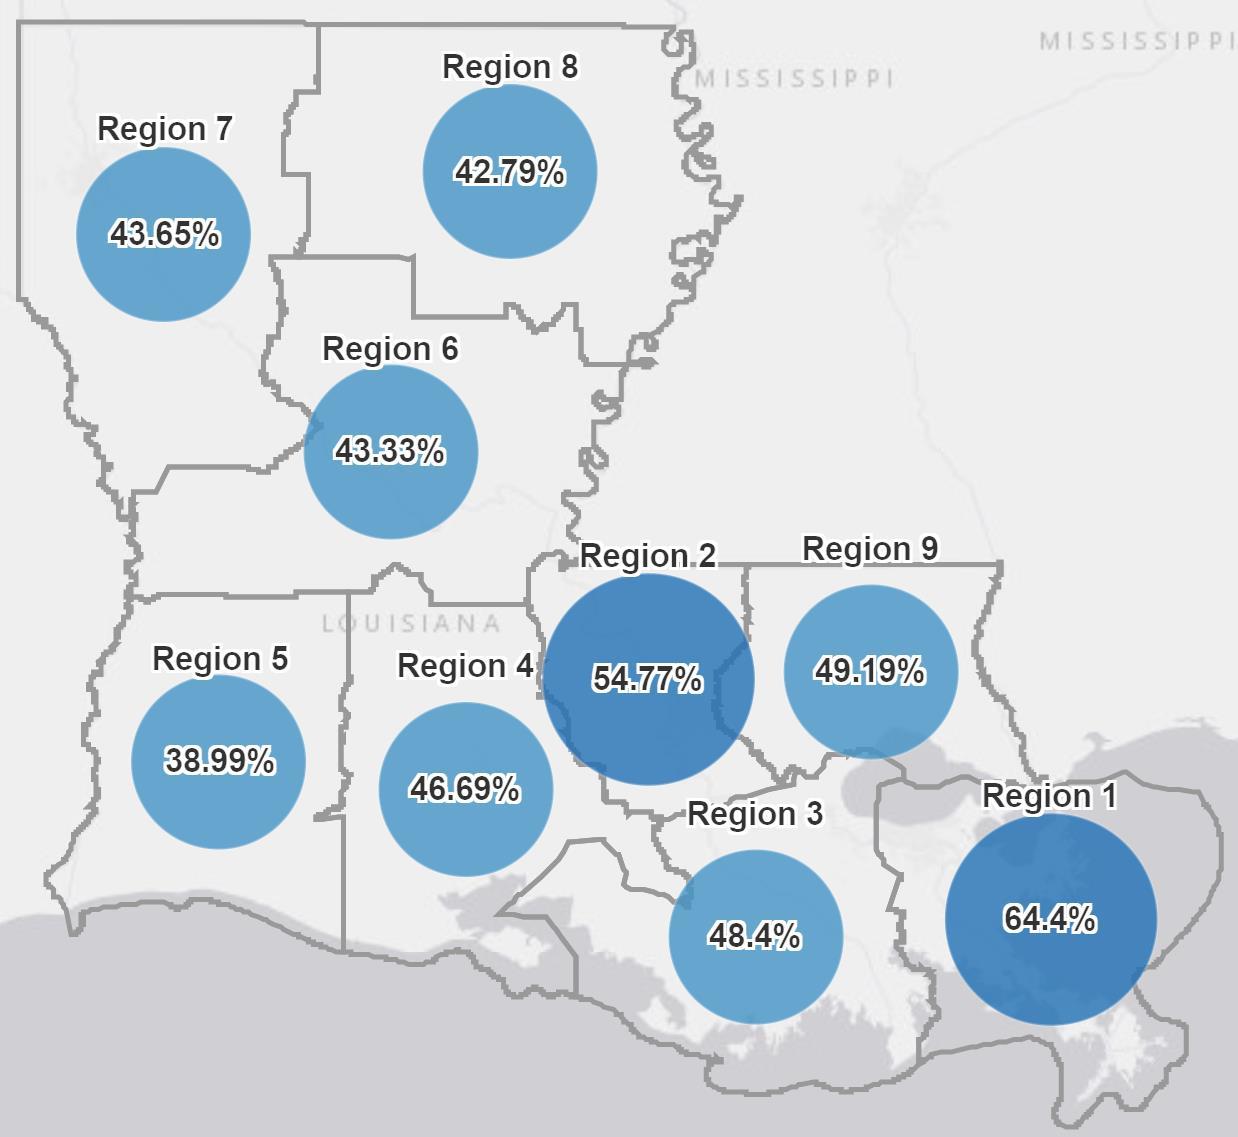
✓Region 6 has 43.3% of the population vaccinated as of mid-February, up from 42.4% in January.
✓Region 7 has a 43.7% of the population vaccinated as of mid-February, up from 42.8% in January.
Source: Louisiana Office of Public Health, https://ldh.la.gov/covidvaccine, February 16, 2022
COVID-19 vaccinations as a percent of parish population as of February 16, 2022.
Rapides andAvoyelles have the highest percentage of completed vaccinations in mid-February in Region 6 at 48.3% and 46.3%, up from 47.4% and 45.5%, respectively.
Source: Louisiana Office of Public Health, https://ldh.la.gov/covidvaccine, February 16, 2022
COVID-19 vaccinations as a percent of parish population as of February 16, 2022.
Caddo and Bossier have the highest percentage of completed vaccinations in mid-February in Region 7 at 45.3%% and 44.0%, respectively.
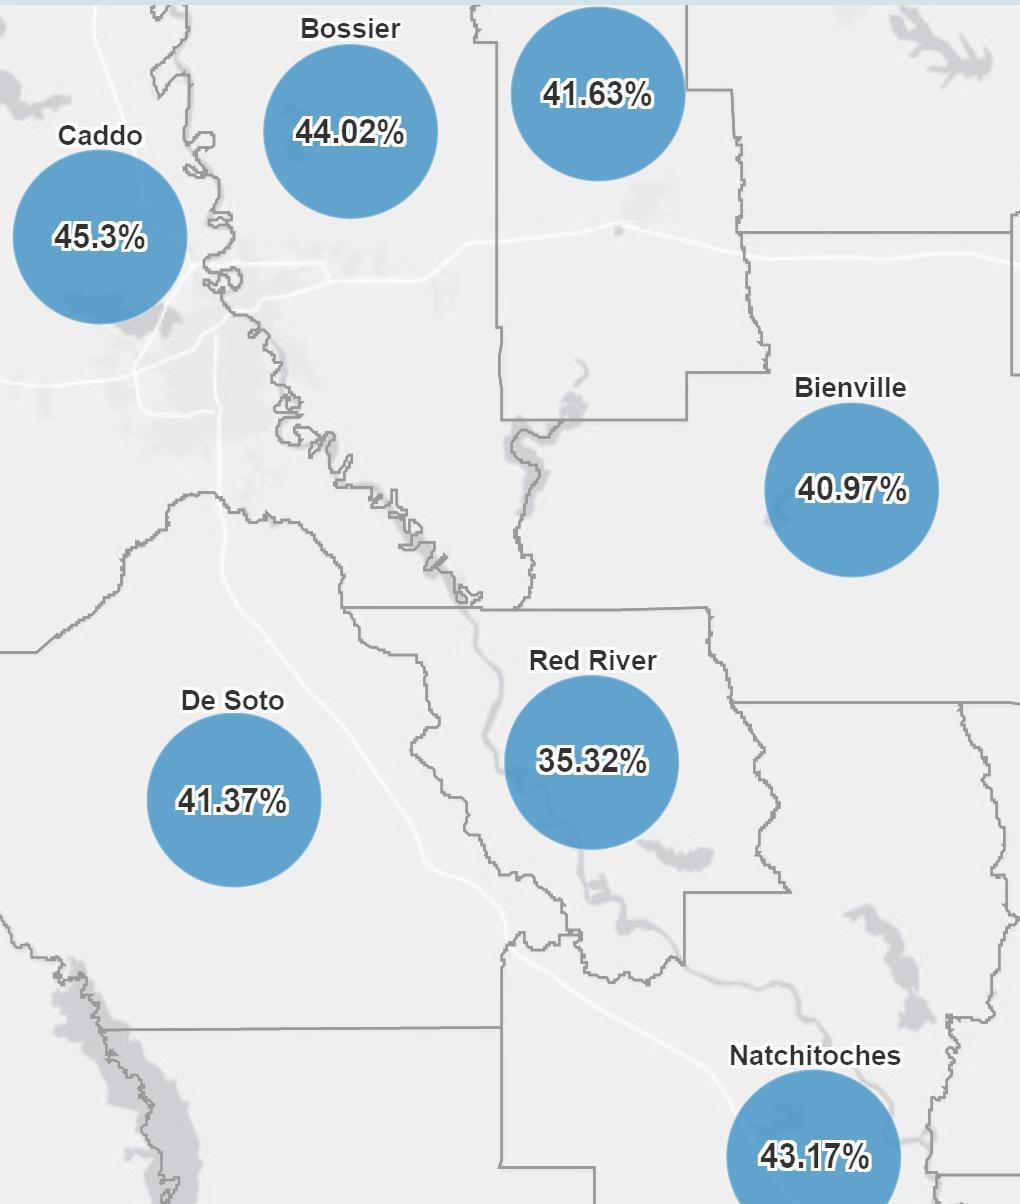
Natchitoches is ranked third at 43.2%.
Source: Louisiana Office of Public Health, https://ldh.la.gov/covidvaccine, February 16, 2022
COVID-19 cases by collection date as of February 17, 2022 in Louisiana with a 7-day moving average.
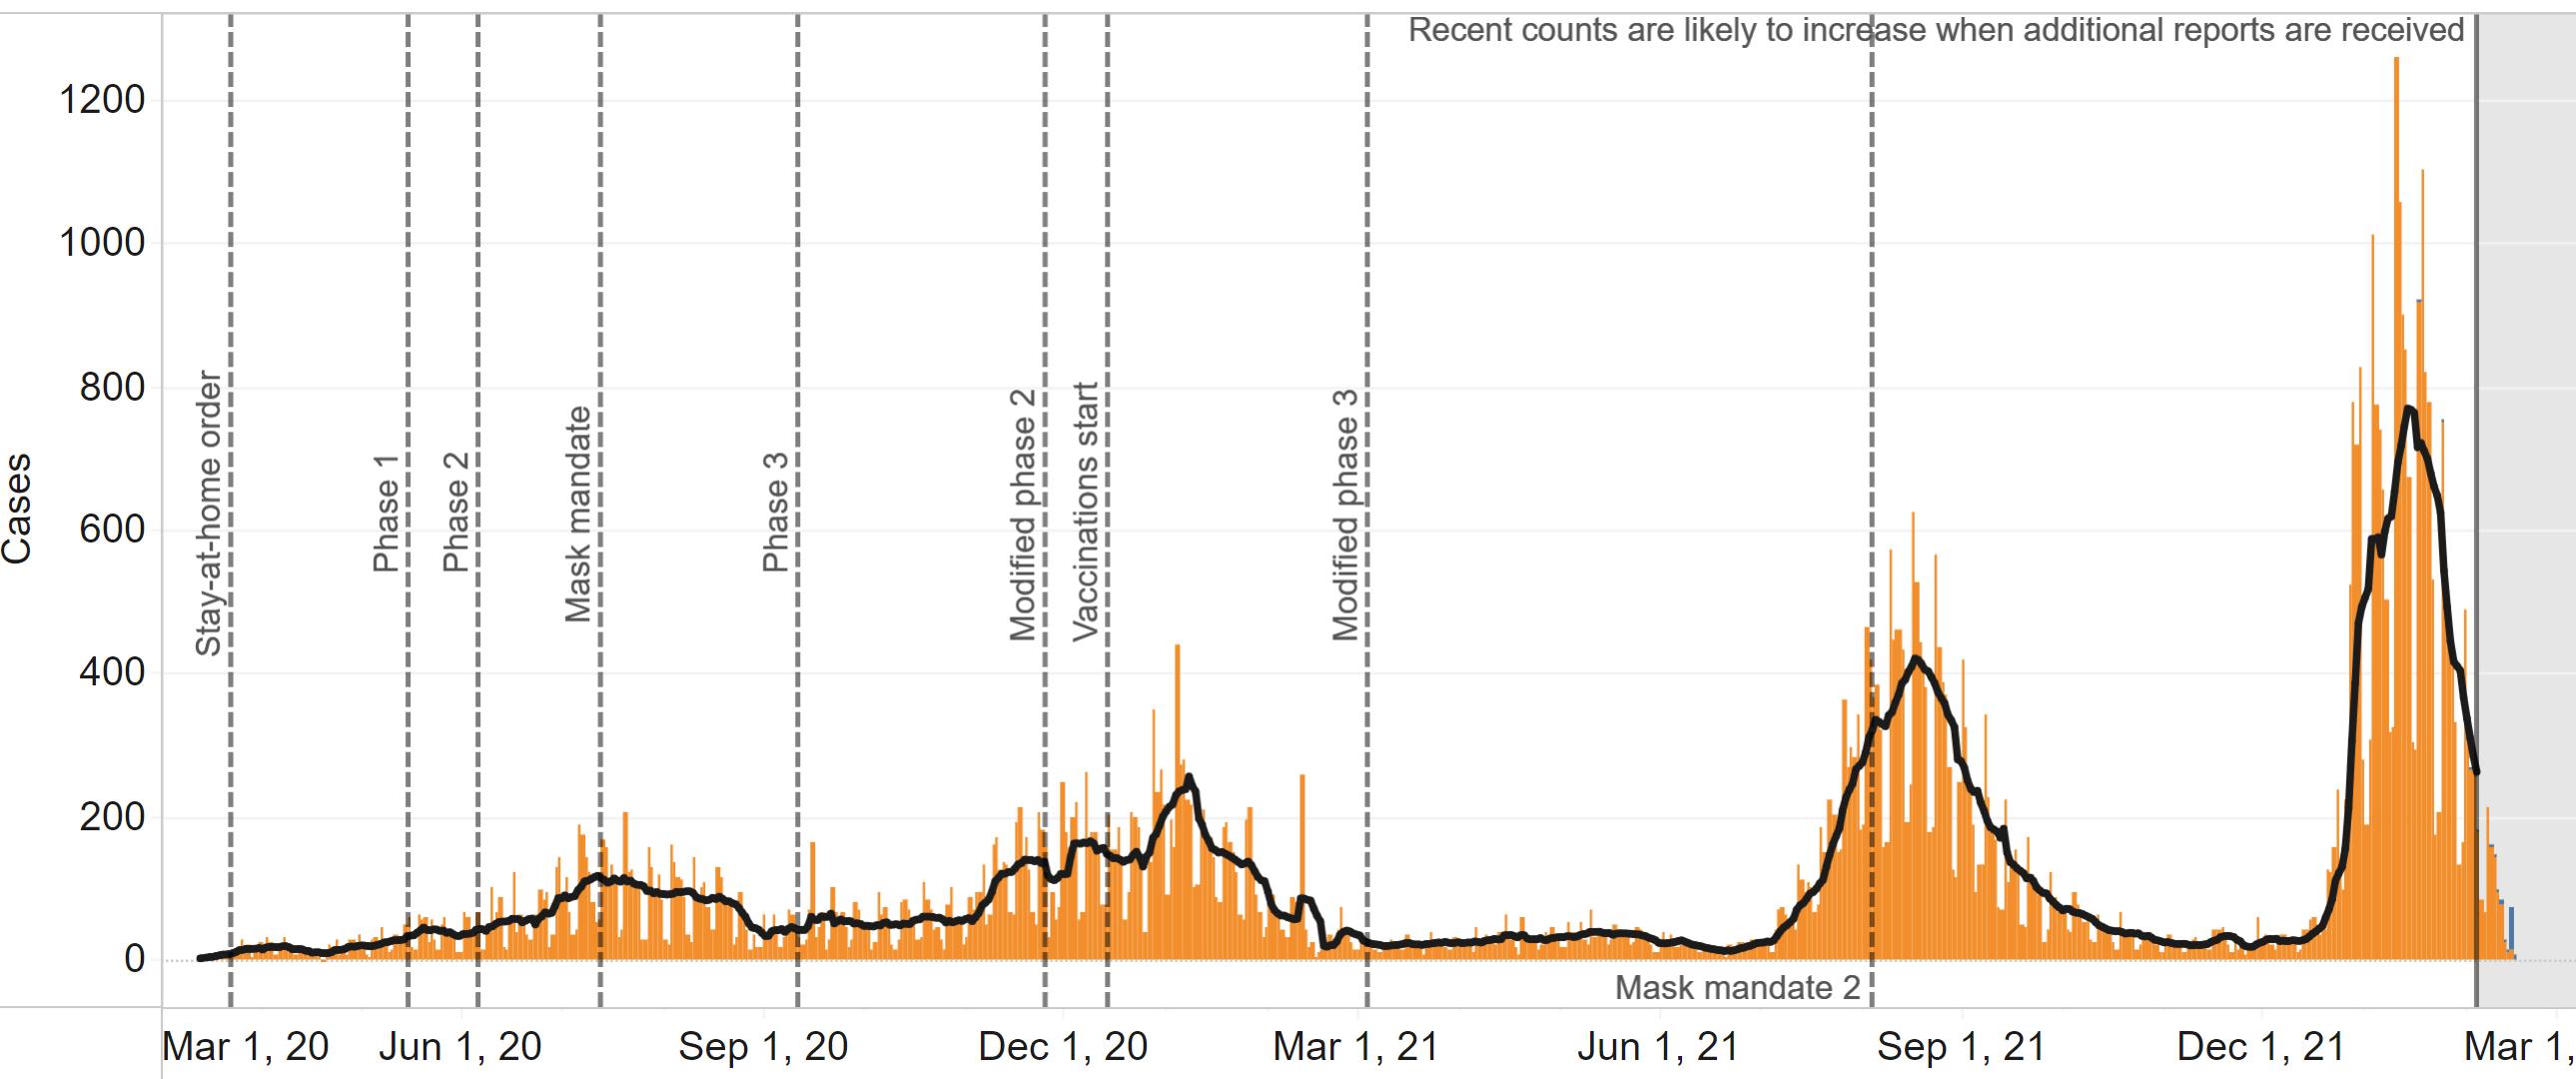
Source: Louisiana Office of Public Health, Region 6 (Central Louisiana), February 17, 2022.
COVID-19 cases by collection date as of February 16, 2022 in Louisiana with a 7-day moving average.
Source: Louisiana Office of Public Health, Region 6 (Central Louisiana), February 17, 2022.
Cases over time by age group in Louisiana through February 16, 2022.
Source: Louisiana Office of Public Health, Region 6 (Central Louisiana), February 16, 2022.
Cases over time by age group in Louisiana through February 17, 2022.
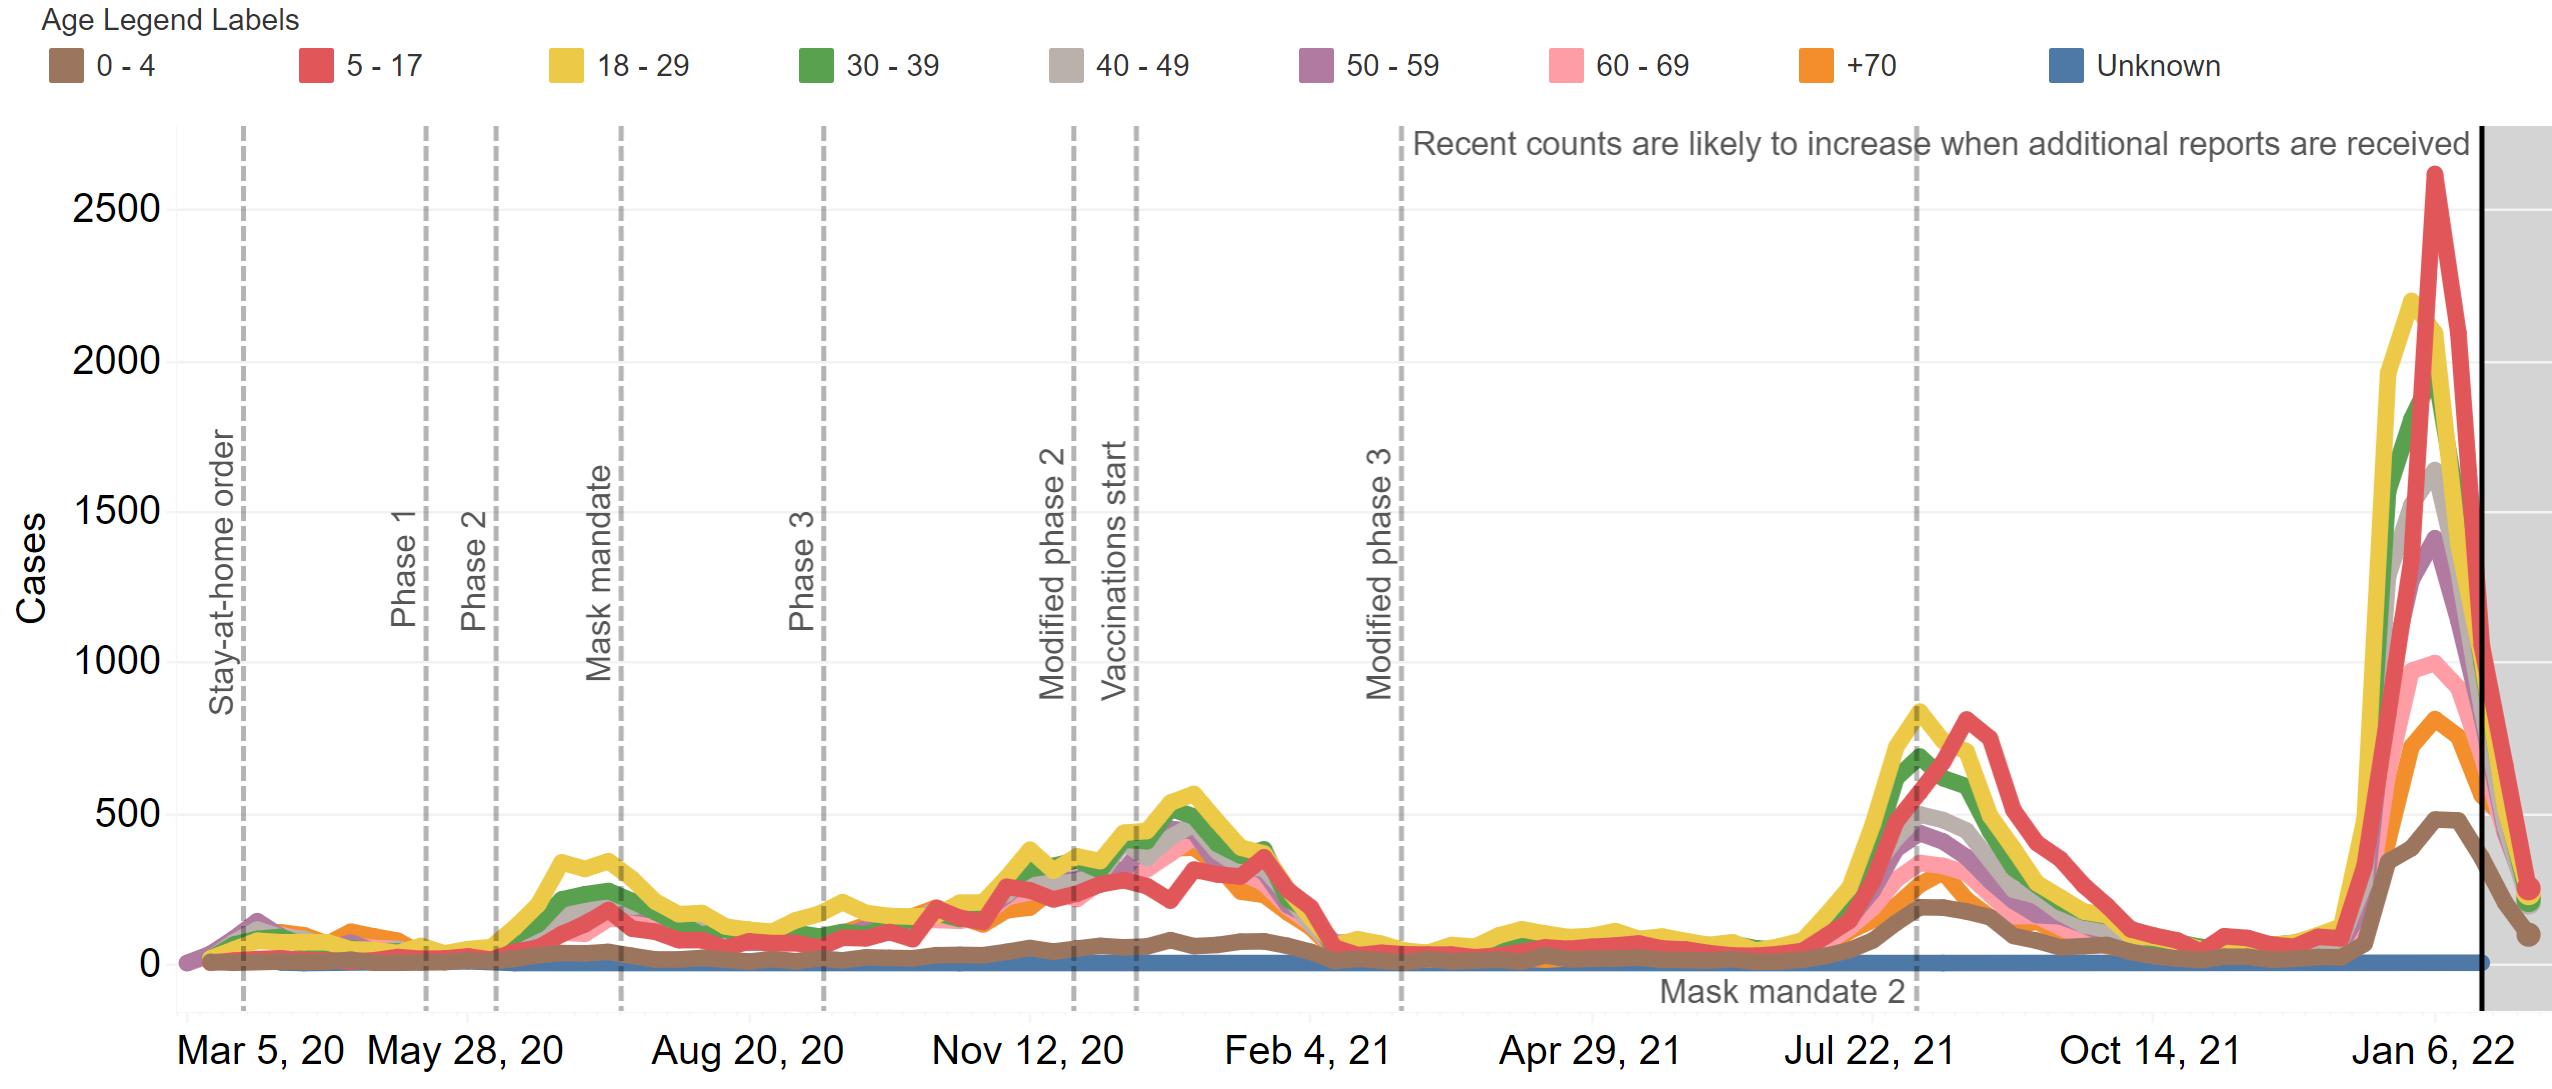
Source: Louisiana Office of Public Health, Region 6 (Central Louisiana), February 17, 2022.
COVID-19 percent positive and test volume in Region 6 as of February 16, 2022.
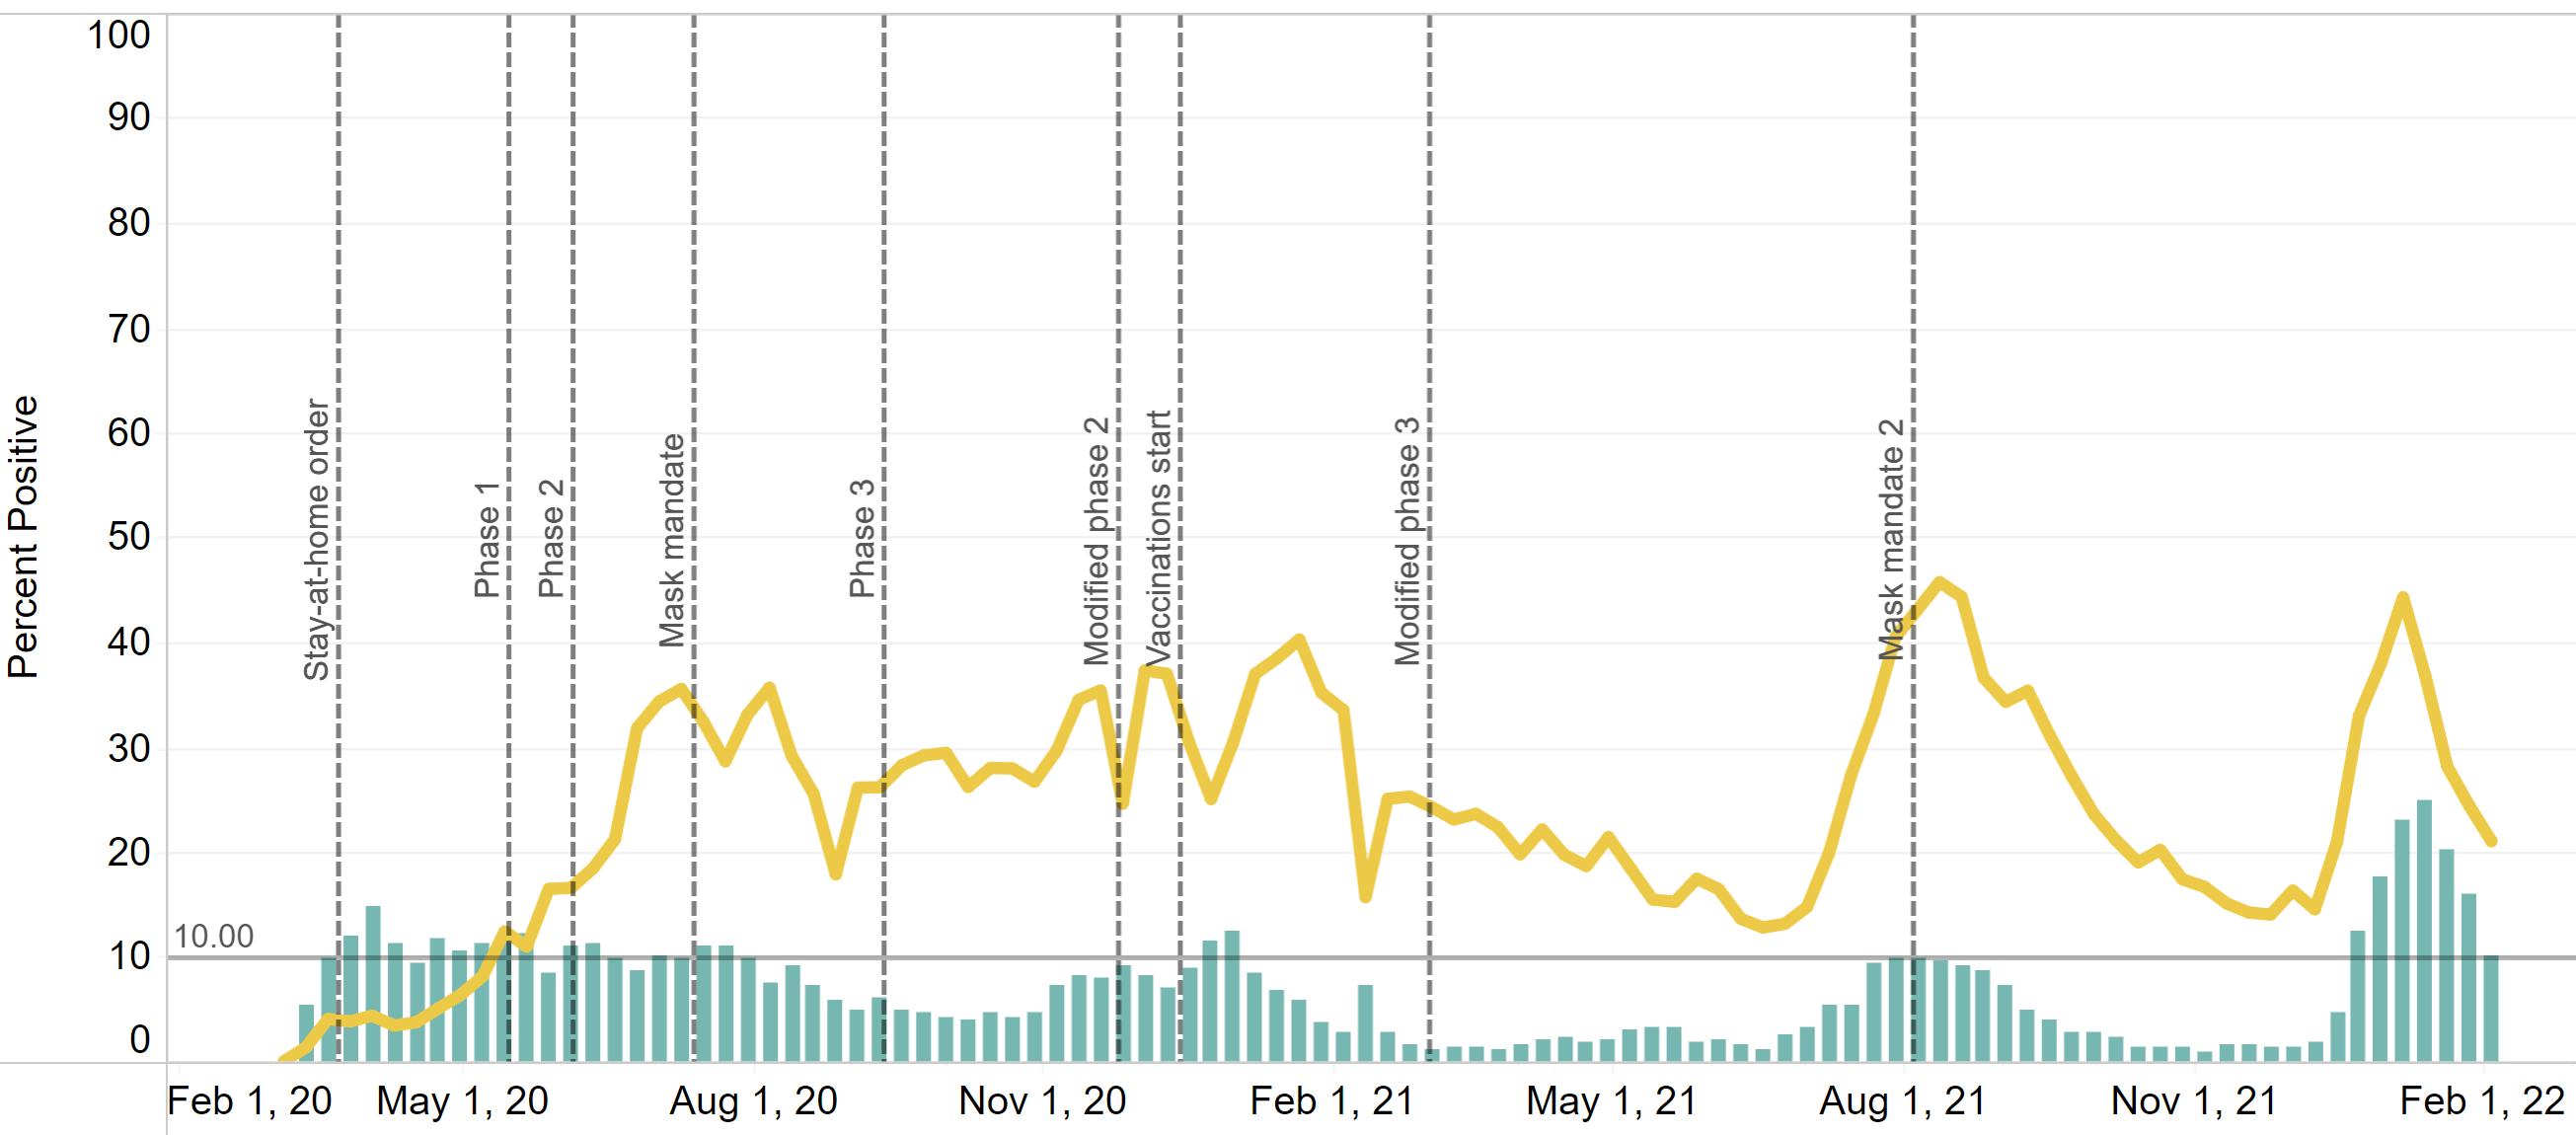
Source: Louisiana Office of Public Health, Region 6 (Central Louisiana), February 16, 2022..
COVID-19 percent positive and test volume in Region 6 as of February 16, 2022.
Source: Louisiana Office of Public Health, Region 6 (Central Louisiana), February 16, 2022..
COVID-19 statewide risk by parish over time.
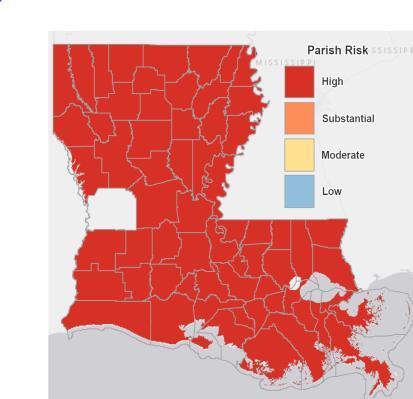
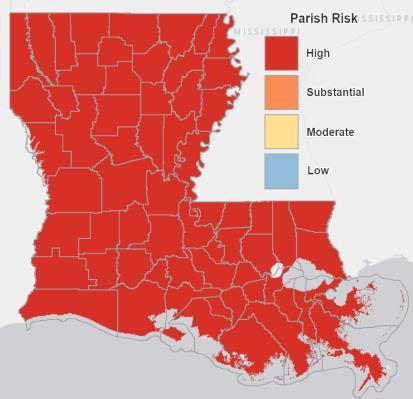
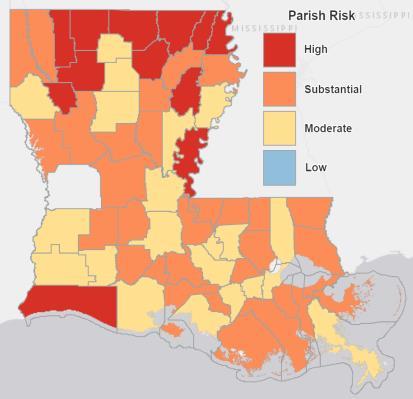
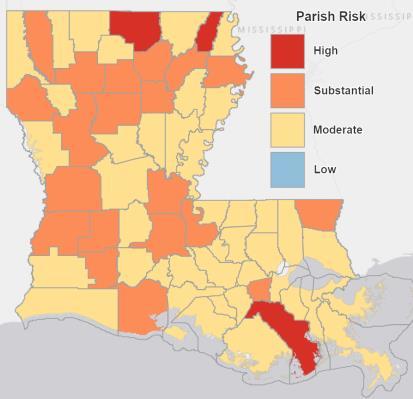
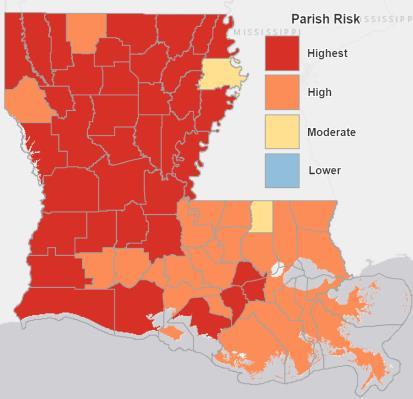
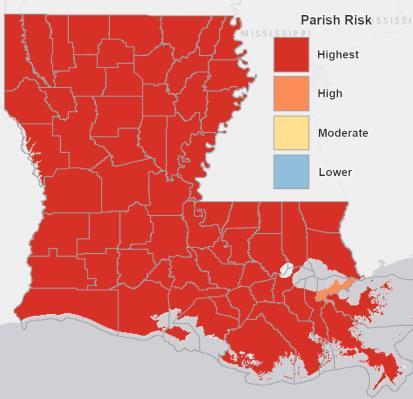
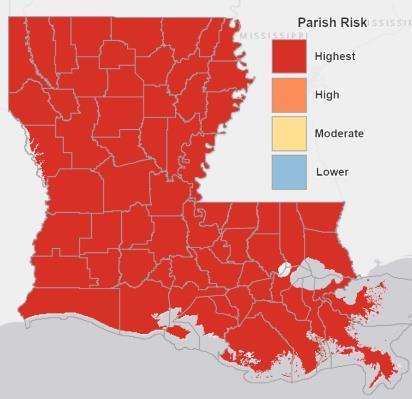
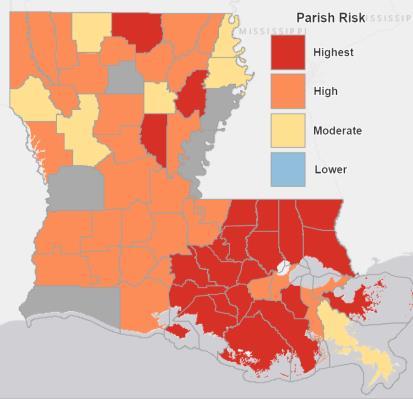
July 15, 2021
August 18, 2021
September 18, 2021
October 17, 2021
November 14, 2021
December 18, 2021
January 17, 2022
February 16, 2022
Source: Louisiana Office of Public Health, February 17, 2022.
Number of cases hospitalized (green line) and ventilated (yellow line) in Region 6 as of February 16, 2022.
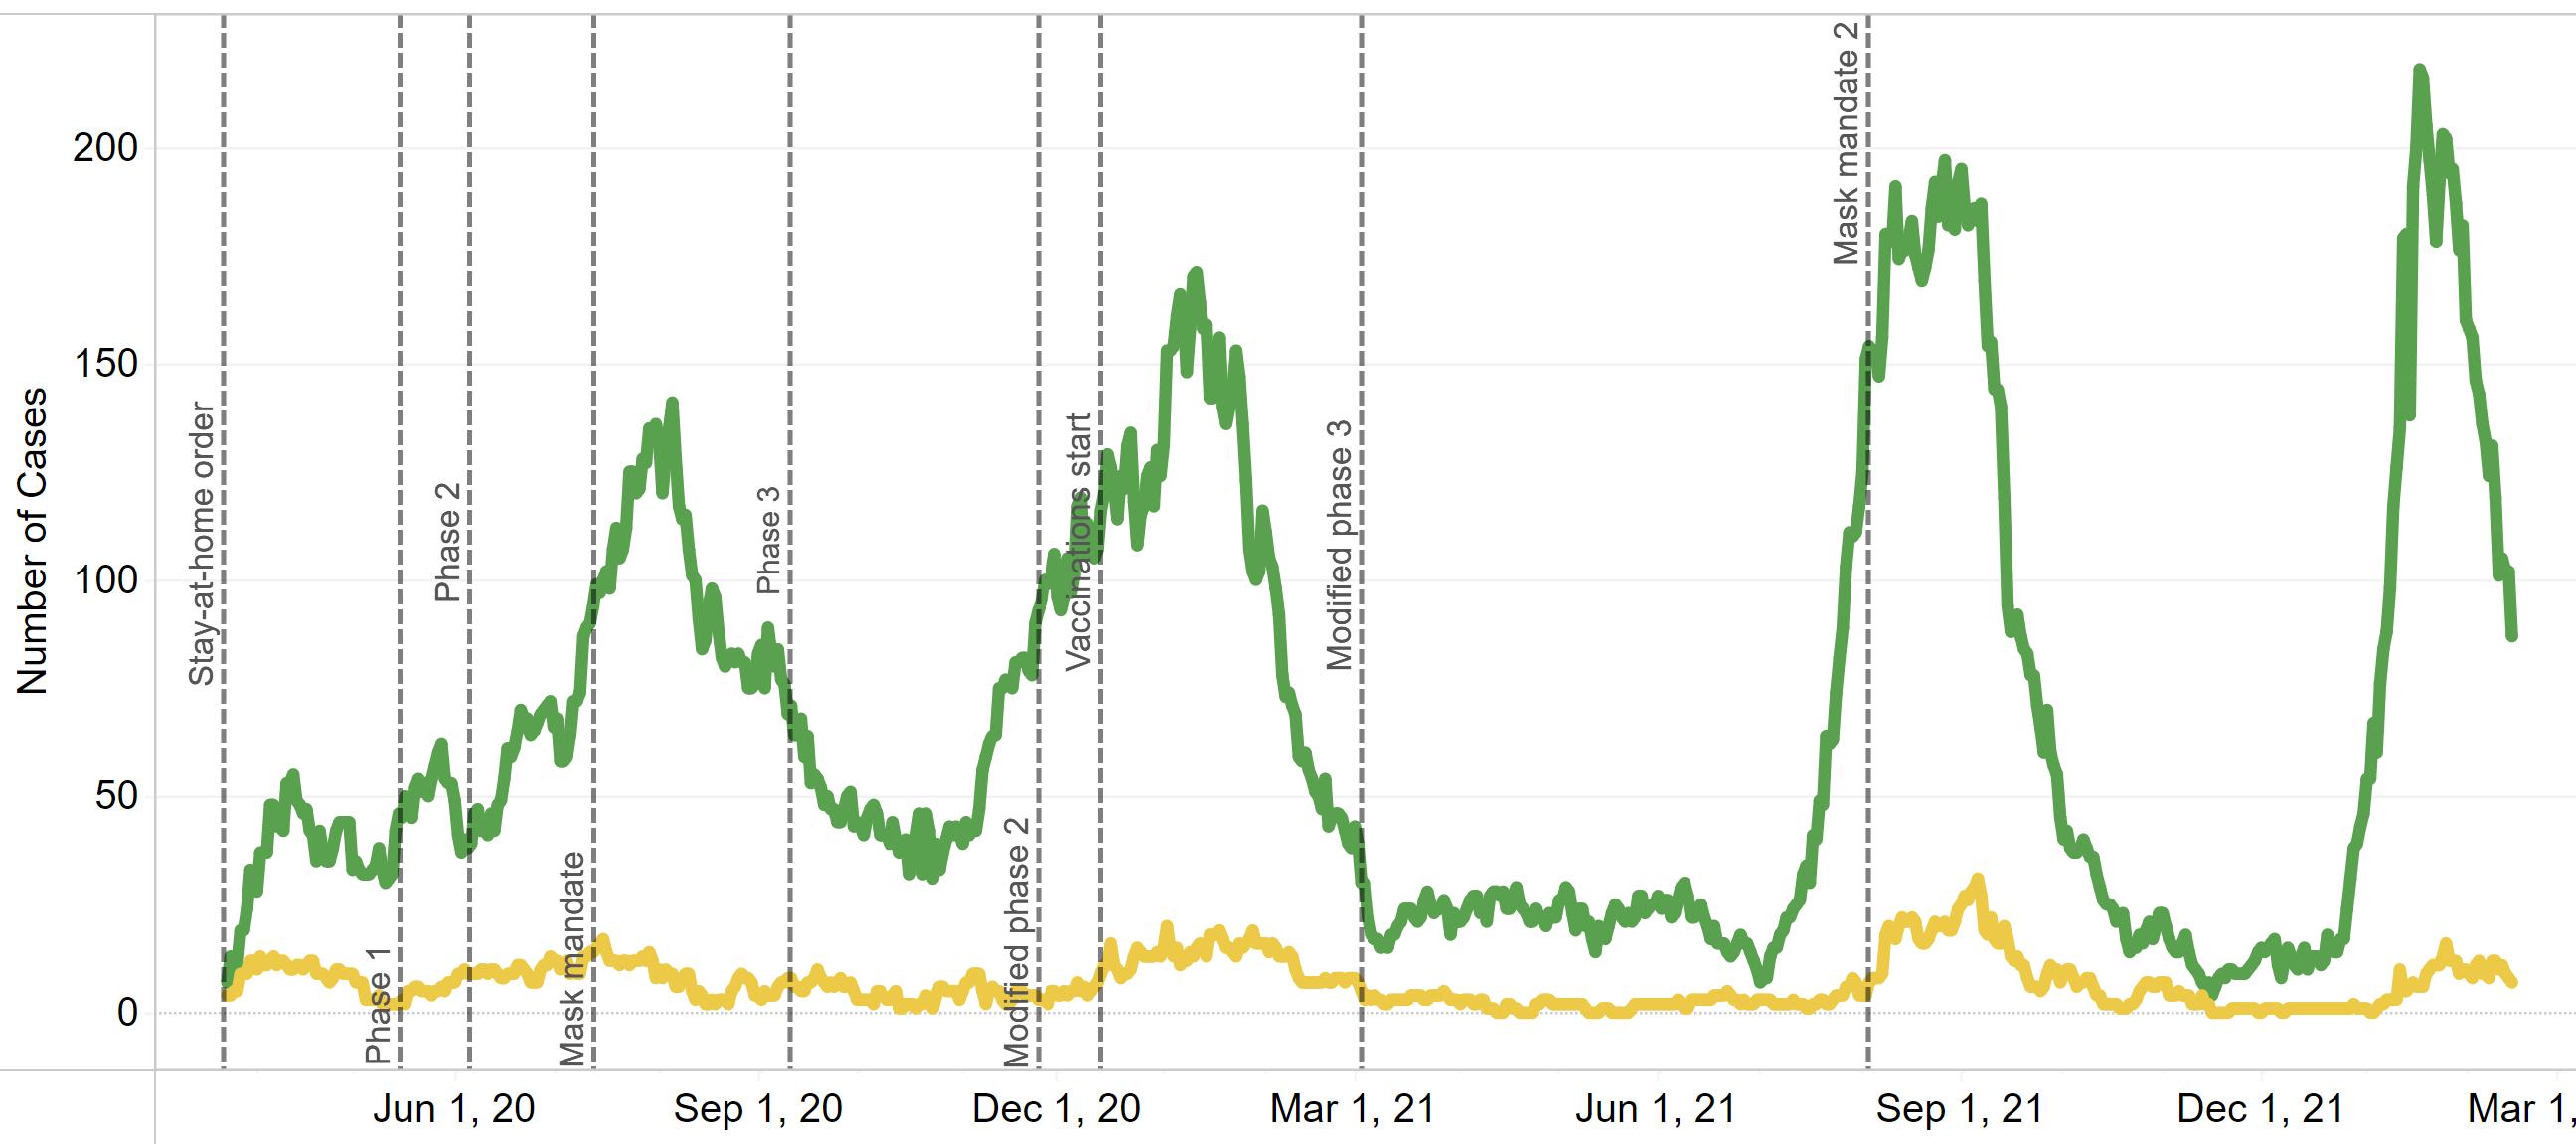
Source: Louisiana Office of Public Health, Region 6 (Central Louisiana), February 16, 2022.
Number of cases hospitalized (green line) and ventilated (yellow line) in Region 7 as of February 16, 2022.
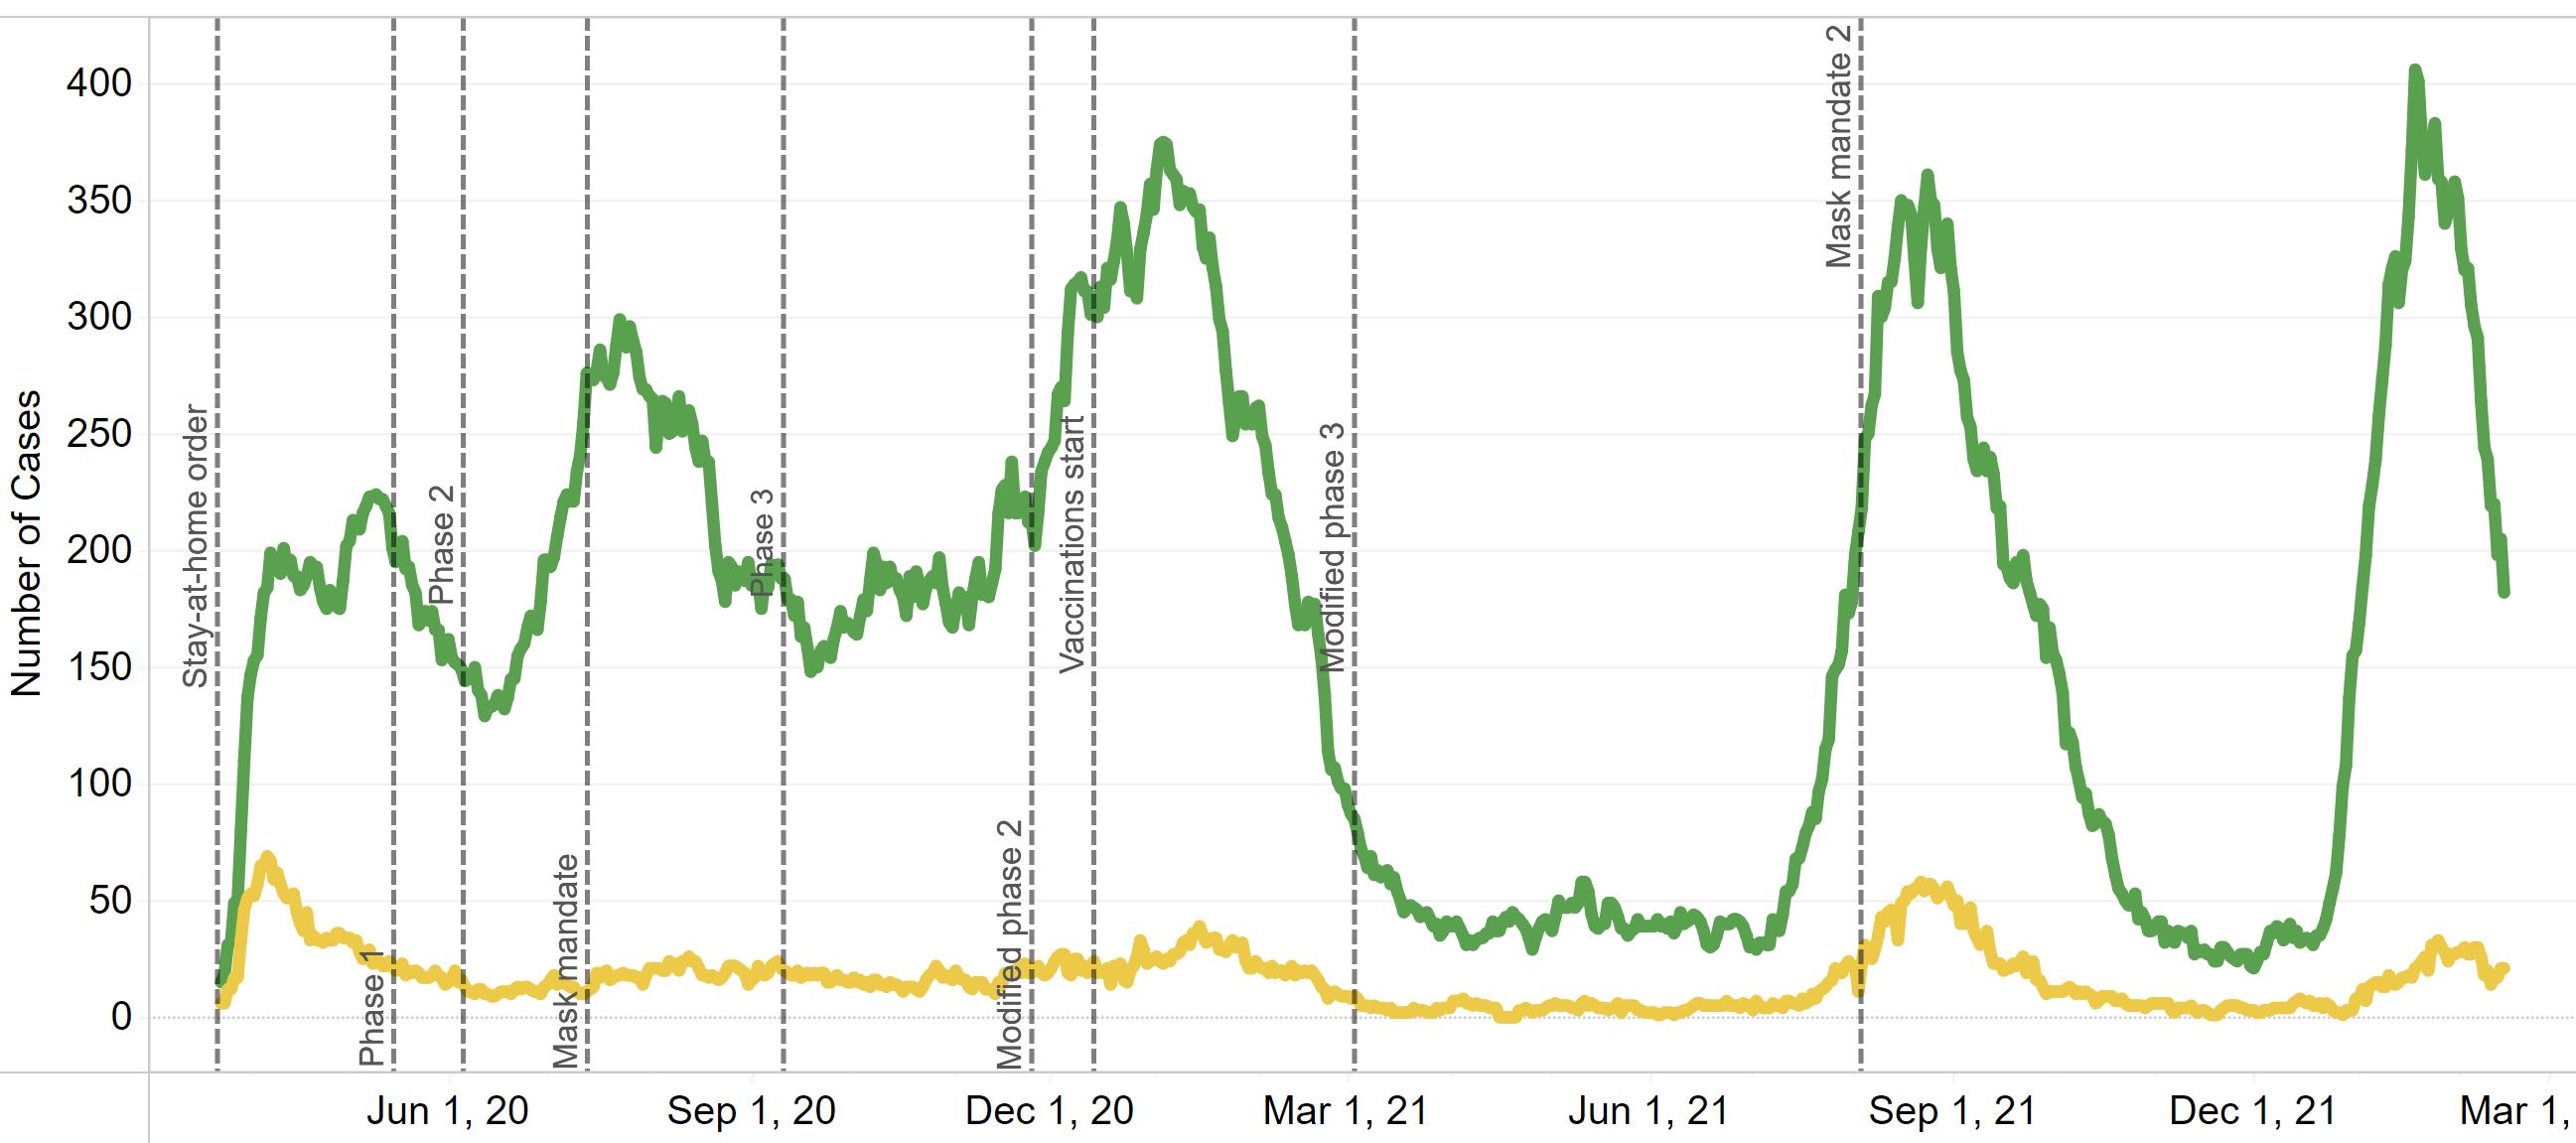
Source: Louisiana Office of Public Health, Region 6 (Central Louisiana), February 16, 2022.
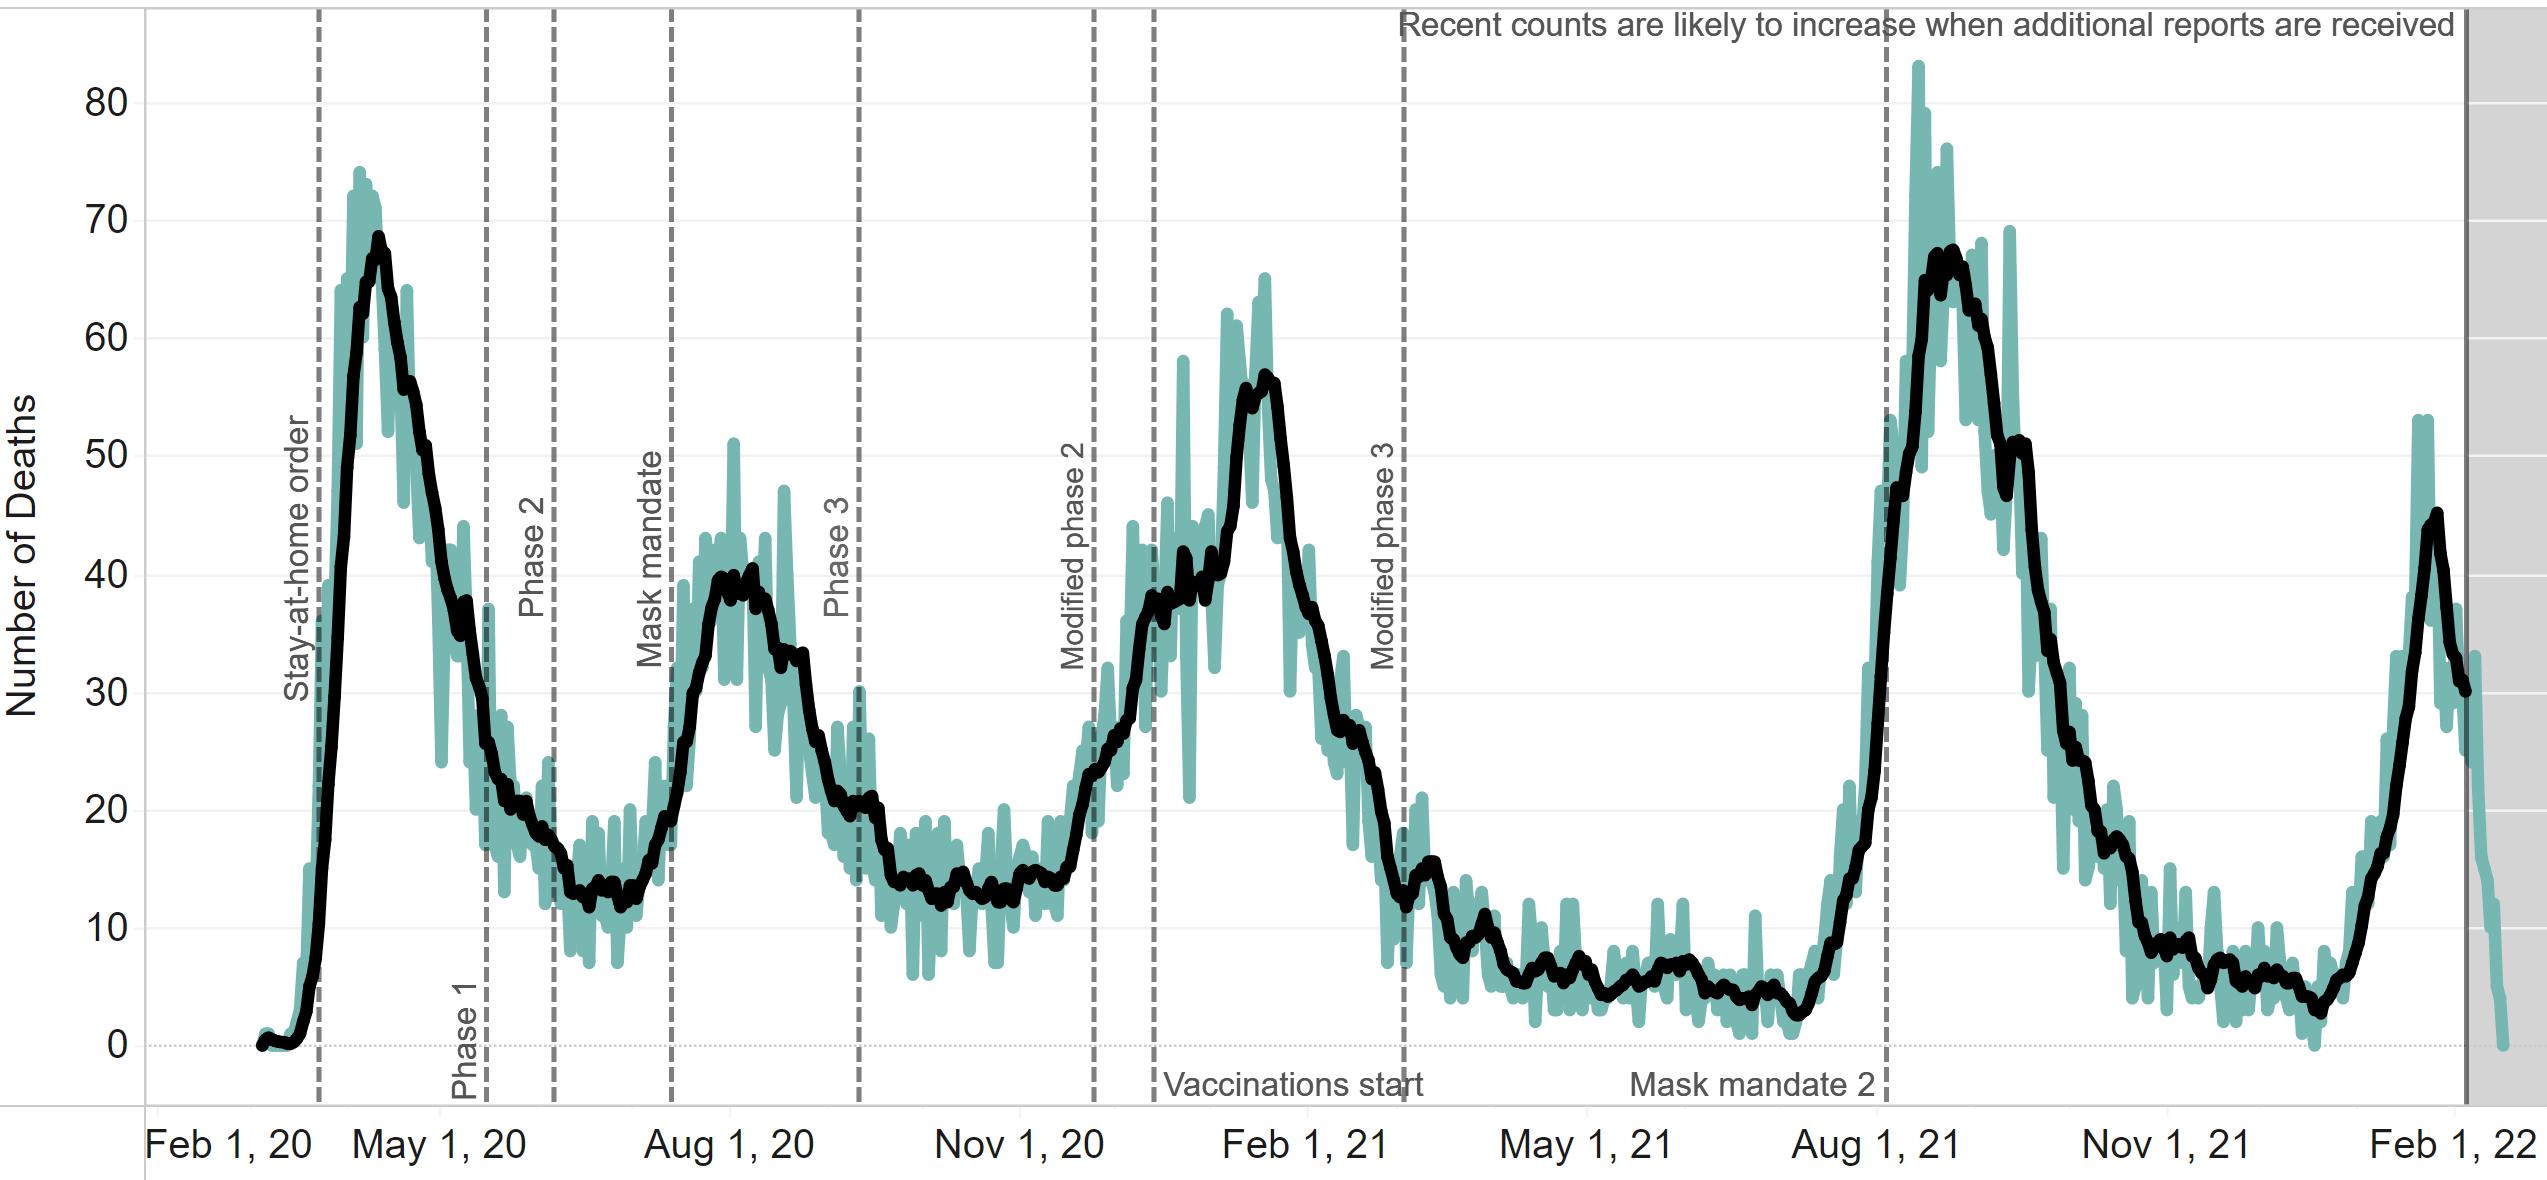
COVID-19 deaths by date of death statewide as of February16, 2022.
Source: Louisiana Office of Public Health, Region 6 (Central Louisiana), February 16, 2022.
Employed persons in the Alexandria MSA from 2019 – 2021.
Employed Persons in Alexandria, LA MSA 2019 - 2021
✓In December 2021, 61,224 were employed in theAlexandria metro area, an decrease of 116 from November.
✓Unemployment in Alexandria MSAfell to 2.8% in December from 3.0% in November.
Source: Louisiana Workforce Commission, February 16, 2022
Initial and continued unemployment claims in Louisiana from January 2021 to January 2022.


Unemployment Claims in Louisiana 2021 - 2022
✓Statewide average weekly initial unemployment claims filed in January rose to 2,178 from 1,893 in December, an increase of 15%. ✓Statewide average weekly continued unemployment claims filed in January declined to 16,368 from 17,939 in December, a decrease of 9%.
Source: Louisiana Workforce Commission, February 16, 2022
The table below shows December 2021 preliminary unemployment rate, labor force, and employment data for central Louisiana parishes.
✓In December, parishes in central Louisiana had an average unemployment rate of 3.4% compared to 3.7% statewide.
✓At 2.2%, La Salle Parish had the lowest unemployment rate in the state, a record it has held throughout the pandemic.
✓Grant and Rapides had the 13th and 17th lowest unemployment rate in the state, respectively. Natchitoches ranked 26th .
Data Source: Louisiana Workforce Commission, February 16, 2022.
The table below shows December 2021 preliminary unemployment rate, labor force, and employment data for Metropolitan Statistical Areas in Louisiana.
✓At 2.8%, the Alexandria MSAhad the lowest unemployment rate among the state’s major metro areas for the 20th straight month.
✓Louisiana’s unemployment rate fell 0.4% in December to 3.7% from 4.1% in November.
Data Source: Louisiana Workforce Commission, February 17, 2022.
The table below shows the number of unemployed, number of advertised jobs online, and the ratio of unemployed to advertised job openings online for Metropolitan Statistical Areas in Louisiana in December 2021.
In December 2021, the Alexandria MSAhad the tightest labor market in the state once again with only 0.29 unemployed persons per job opening, meaning there were more than three job opening for every unemployed.✓Every metro area in the state had more job openings than unemployed.
The tables below shows employers with the highest number of job openings advertised online on February 16, 2022.
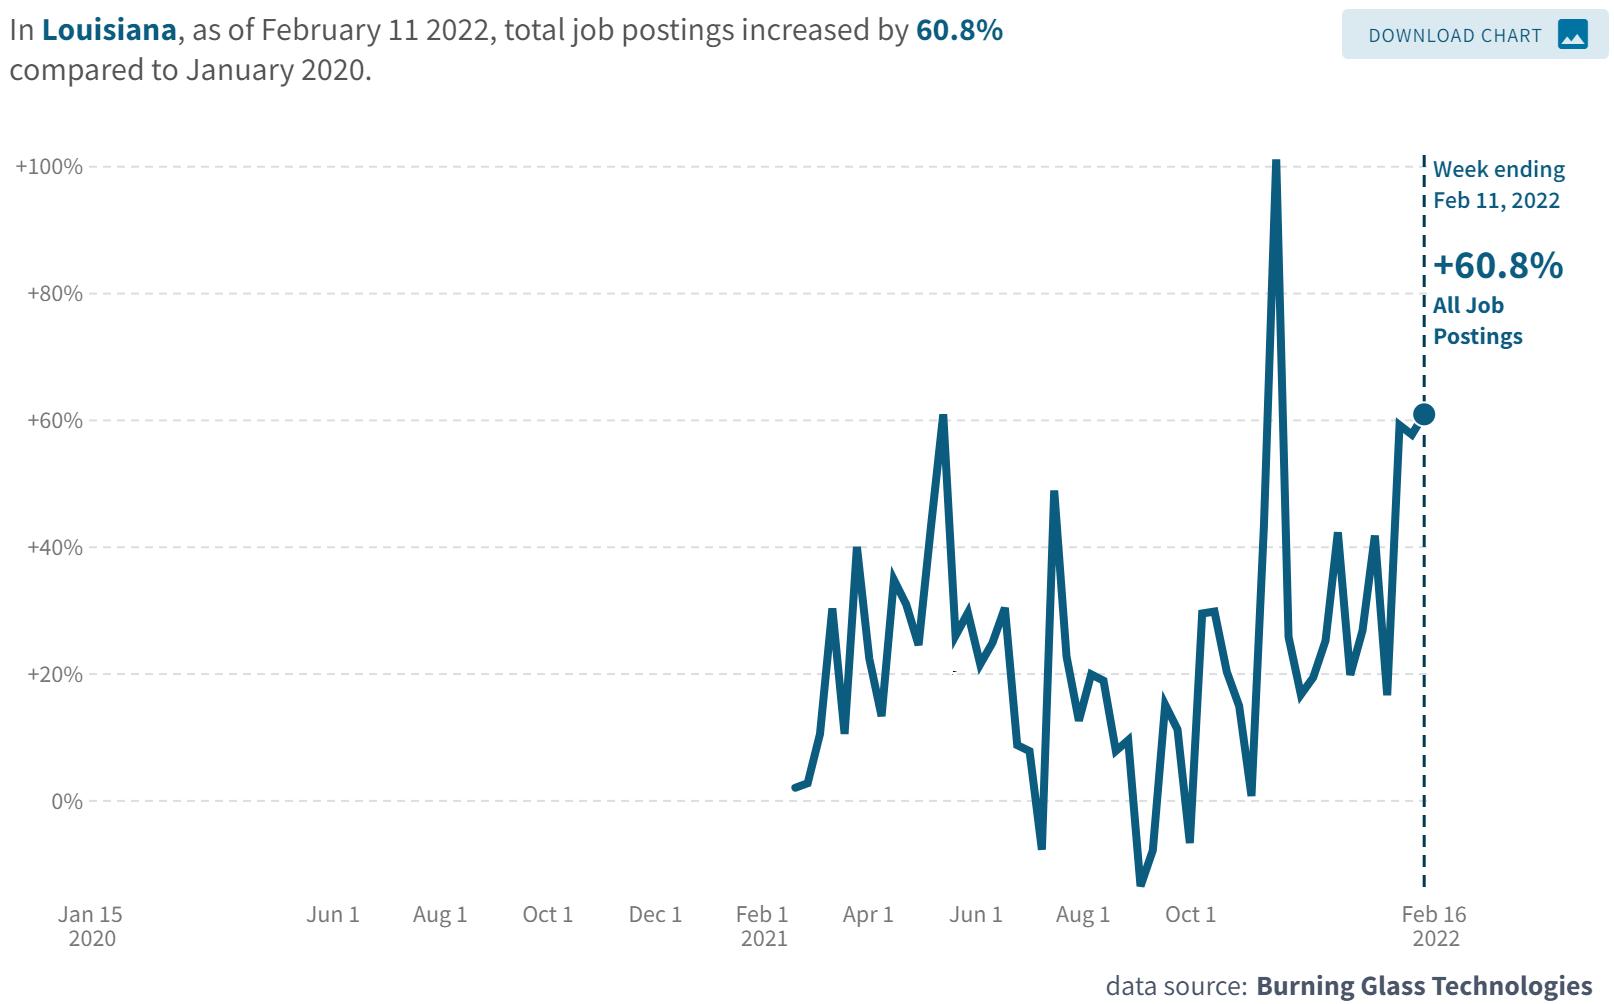
The chart below represents the percent change in job posting by industry in Louisiana as of February 11, 2022 with January 2020 as the baseline.
An overview of sales, vehicle sales, and hotel occupancy taxes collected in the January 2022 reflecting sales activity in December 2021.
January 2022
Notes: January tax revenue reflects sales activity in December. * Current month data are not available. N/a = Not available
Data Source noted in detailed reports.


An overview of sales tax revenue in Rapides Parish other towns and cities in January 2022 (excluding Alexandria and Pineville).
Note: Current tax revenue reflects sales activity in prior month.


(TR) Alexandria total sales tax revenue for January with previous month, year, and YTD comparisons.
(BR) Alexandria total monthly sales tax revenue from 2020 to present.
Note: January sales tax revenue reflects sales activity in December.
Data Source: Rapides Parish Police Jury Treasurer’s Reports, February 2022.
Avoyelles Parish total sales tax revenue for January with previous month, year, and year-to-date comparisons. Vehicle and hotel tax revenues are excluded.
Note: January sales tax revenue reflects sales activity in December.
Data Source: Avoyelles Parish School Board. February 2022.
Avoyelles Parish vehicle sales tax revenue for January with previous month, year, and year-to-date comparisons.
Note: January sales tax revenue reflects sales activity in December.
Data Source: Avoyelles Parish School Board. February 2022
Catahoula Parish total sales tax revenue for January with previous month, year, and year-to-date comparisons.
Note: January sales tax revenue reflects sales activity in December.
Data Source: Catahoula Parish Tax Administrator, February 2022
Concordia Parish total sales tax revenue for January with previous month, year, and year-to-date comparisons.
Note: January sales tax revenue reflects sales activity in December.
Data Source: Concordia Parish Tax Administrator. February 2022
Evangeline Parish total sales tax revenue for January with previous month, year and YTD comparisons.
Note: Janaury sales tax revenue reflects sales activity in December. Evangeline implemented a 1% sales tax increase
Data Source: Evangeline Parish Sales Tax Commissioner. February 2022
Evangeline Parish vehicle sales tax revenue for January with previous month, year and YTD comparisons.
Note: January sales tax revenue reflects sales activity in December. Evangeline implemented a 1% sales tax increase July 1, 2021.
Data Source: Evangeline Parish Sales Tax Commissioner. February 2022
(TR) Grant sales tax revenue for January with previous month, year, and YTD comparisons.
(BR) Grant monthly sales tax revenue from 2020 to present.
Note: January sales tax revenue reflects sales activity in December.
Data Source: Grant Parish Sheriff’s Office, February 2022.
La Salle Parish total sales tax revenue for January with previous month, year, and year-to-date comparisons.
Note: January sales tax revenue reflects sales activity in December.
Data Source: La Salle Parish Tax Administrator, February 2022
(TR) Natchitoches sales tax revenue for January with previous month, year, and YTD comparisons.
(BR) Natchitoches monthly sales tax revenue from 2020 to present.
Note: January sales tax revenue reflects sales activity in December.
Data Source: Natchitoches Parish Tax Commission, February 2022.
(TR) Natchitoches vehicle sales tax revenue for December with previous month, year, and YTD comparisons.
(BR) Natchitoches monthly vehicle sales tax revenue from 2019 to present.
Note: December sales tax revenue reflects sales activity in November. *January 2022 vehicle sales tax revenue was not available at time of publication.
Data Source: Natchitoches Parish Tax Commission, February 2022.

(TR) Pineville sales tax revenue for January with previous month, year, and YTD comparisons.
(BR) Pineville monthly sales tax revenue from 2020 to present.
Note: Current sales tax revenue reflects sales activity in the prior month.
(TR) Rapides Parish sales tax revenue for January with previous month, year, and YTD comparisons.
(BR) Rapides monthly sales tax revenue from 2020 to present.
Note: Current sales tax revenue reflects sales activity in the prior month.
Data Source: Rapides Parish Police Jury Treasurer’s Reports, February 2022.
Rapides Parish vehicle sales tax revenue for January with previous month, year, and YTD comparisons.
*Data for December 2019 and 2020 included November sales and is evenly divided between the months.
Data Source: Rapides Parish Police Jury Treasurer’s Reports, February 2022.
St. Landry Parish sales tax revenue for January with previous month, year, and YTD comparisons.
Note: January sales tax revenue reflects sales activity in December.
Data Source: Tax revenue data from St. Landry Parish School Board. February 2022
St. Landry Parish vehicle sales tax revenue for January with previous month, year, and YTD comparisons.
Note: January sales tax revenue reflects sales activity in December.
Data Source: Tax revenue data from St. Landry Parish School Board. February 2022
Remote seller tax revenue is tax revenue from online sales by location of the seller at the time of purchase.
Remote Sellers Sales Tax Collection in Cenla
August 2020 - January 2022
✓
SinceAugust 2020 when remote sellers tax revenue collection started, $23.7 million in sales tax revenue have been collected from online sales in central Louisiana.
✓Online shopping in central Louisiana during the 2021 holiday season (November and December) increased 40% from 2020.
Note: Sales tax revenue collected in January reflects sales activity in December.
Data Source: Louisiana Sales and Use Tax Commission for Remote Sellers.August 2020 – January 2022
Remote seller tax revenue by parish with month-over-month and year-over-year comparisons.
✓Total online sales tax revenue in Cenla in January 2022 fell -11% from a month earlier but is up 20% from January 2021.
Note: Sales tax revenue collected in January reflects sales activity in December.
Data Source: Louisiana Sales and Use Tax Commission for Remote Sellers.August 2020 – January 2022
Remote sellers tax revenue from online sales in Natchitoches Parish from July 2020 – January 2022.
Note: Sales tax revenue collected in one month reflects sales activity in the prior month.
Data Source: Louisiana Sales and Use Tax Commission for Remote Sellers.August 2020 – January 2022


Remote sellers tax revenue from online sales in Rapides Parish from July 2020 – January 2022.
Note: Sales tax revenue collected in one month reflects sales activity in the prior month.
Data Source: Louisiana Sales and Use Tax Commission for Remote Sellers.August 2020 – January 2022

(TR) Louisiana tax revenue from all sources for January with previous month, year, and YTD comparisons.
(BR) Louisiana monthly tax revenue from 2020 to present. Data Source: Louisiana Department of Revenue, February 2022.
The valuation (estimated development cost) of new commercial construction permits issued by the City of Alexandria in January 2022 with previous month, year, and YTD comparisons.
The valuation (estimated development cost) of new residential construction permits issued by the City of Alexandria in January 2021 with previous month, year, and YTD comparisons.
This chart shows the valuation of permits issued by Rapides Area Planning Commission in Allen Parish in January between 2019-2022 with month-tomonth, year-to-year, and year-to-date comparisons.
Data Source: RapidesArea Planning Commission, February 2022
This chart shows the valuation of permits issued by Rapides Area Planning Commission in Avoyelles Parish in January between 2019-2022 with month-to-month, year-to-year, and year-to-date comparisons.
Data Source: RapidesArea Planning Commission, February 2022.
This chart shows the valuation of permits issued by Rapides Area Planning Commission in Evangeline Parish in January between 2019-2022 with month-tomonth, year-to-year, and year-to-date comparisons.
Data Source: RapidesArea Planning Commission, February 2022.
This chart shows the valuation of permits issued by Rapides Area Planning Commission in the City of Pineville in January between 2019-2022 with month-to-month, year-to-year, and year-to-date comparisons.
Data Source: RapidesArea Planning Commission, February 2022.
This charts shows the valuation of permits issued by Rapides Area Planning Commission in Rapides Parish (excluding Alexandria) in January between 2019-2022 with month-to-month, year-to-year, and year-to-date comparisons.
Data Source: RapidesArea Planning Commission, February 2022.
The chart represents the Lumber Price Index in the U.S. from January 2020 – January 2022.
Monthly Price Index of Lumber 2020 - 2022
▪ In January 2022, the US Lumber Price Index increased 17% from December.
In the past two month, the Lumber Price Index has jumped 33%. ▪ The US Lumber Price Index in January stood 26% above a year ago.
Data Source: Fed Reserve Economic Database, St. Louis Federal Reserve Bank, February 15, 2022.
The count of active listings, median days on the market, average listing price, and median listing price for the Alexandria MSA for January 20192022 with month-to-month and year-over-year comparisons.
The count of active single-family and condo/townhome listings from 2019-2022 for Alexandria, Fort Polk (Leesville), Natchitoches, and Opelousas.
The median number of days property listings spend on the market from 2019-2022 for Alexandria, Fort Polk (Leesville), Natchitoches, and Opelousas.
The median listing price of houses from 2019-2022 for Alexandria, Fort Polk (Leesville), Natchitoches, and Opelousas.
Median Listing Price 2019-2022
The average listing price of houses from 2019-2022 for Alexandria, Fort Polk (Leesville), Natchitoches, and Opelousas.
Average Listing Price 2019-2022
Avoyelles Parish hotel occupancy tax revenue for January with previous month, year, and year-to-date comparisons.
Note: January tax revenue reflects hotel occupancy activity in December. Hotel occupancy tax revenue is used as a proxy for hotel occupancy rate.
Data Source: Avoyelles Parish School Board. February 2022.
Natchitoches Parish hotel occupancy tax revenue for January with previous month, year, and YTD comparisons.
Note: January tax revenue reflects hotel occupancy activity in December. Hotel occupancy tax revenue is used as a proxy for hotel occupancy rate.
Data Source: Natchitoches Parish Tax Administrator, February 2022.
Rapides Parish hotel occupancy tax revenue for January with previous month, year, and YTD comparisons.
Note: January tax revenue reflects hotel occupancy activity in December. Hotel occupancy tax revenue is used as a proxy for hotel occupancy rate.
Data Source: Rapides Parish Police Jury Treasurer’s Reports, February 2022.
Nationwide daily percentage of passengers passing through current TSA checkpoints in 2021-2022 expressed as a percentage of traffic two years earlier.
▪ Nationally, air passenger traffic in January 2022 declined -22% from December 2021.
U.S. air passenger traffic in January 2022 was up 96% from a year ago, but still -25% below January 2019.
Traffic in 2021-22 as a Percent of Traffic Two Years Earlier

This data shows seated diners at restaurants on the OpenTable network in Louisiana in 2021-2022 compared with the same day of the week two years earlier. OpenTable reservations are mostly from southeast Louisiana restaurants.
▪ Compared to January 2020, reservations were down -25% in January 2022.
Source: OpenTable, https://www.opentable.com/state-of-industry, February 6, 2022
OpenTable Reservations in Lousiana
Percent Change from 2 Years Earlier
Total gasoline sales in gallons in Louisiana in 2019 - 2021.


✓November 2021 gasoline sales increased 2.6% from October and are up 10% from a year ago. ✓Gasoline sales YTD in November are 5.3% above the same period in 2020, but -0.9% below 2019.
Data Source: U.S. Energy Information Administration, Prices, Sales Volumes & Stocks by State, February 6, 2022


The chart below represents the weekly number of new businesses applications in Louisiana from 2020-2022
New business applications in January 2022 remain unchanged from December 2021, but are down 20% from January 2021.
Note: Data reflects businesses applications, not necessarily business formations.
Data Source: U.S. Census Bureau, Business Formation Statistics, Retrieved February 15, 2022.
The chart below represents the number of new businesses established each month in Rapides from January 2019 through January 2022.


The number of new businesses established in Rapides in January 2022 increased 85% from December and was 16% higher than January 2021. ✓Year-to-date, 50 new businesses have been created in Rapides in 2022 compared to 43 in 2021 and 50 in 2020.
Note: Data reflects businesses established in the current month.
Data Source: Rapides Parish Sales and Use Tax Department, February 2022.
Rapides Parish occupational license revenue YTD with previous YTD comparisons.
Note: Rapides Parish reflects unincorporated areas. Data reflects licenses paid in previous month.
Data Source: Rapides Parish Police Jury Treasurer’s Reports, February 2022.
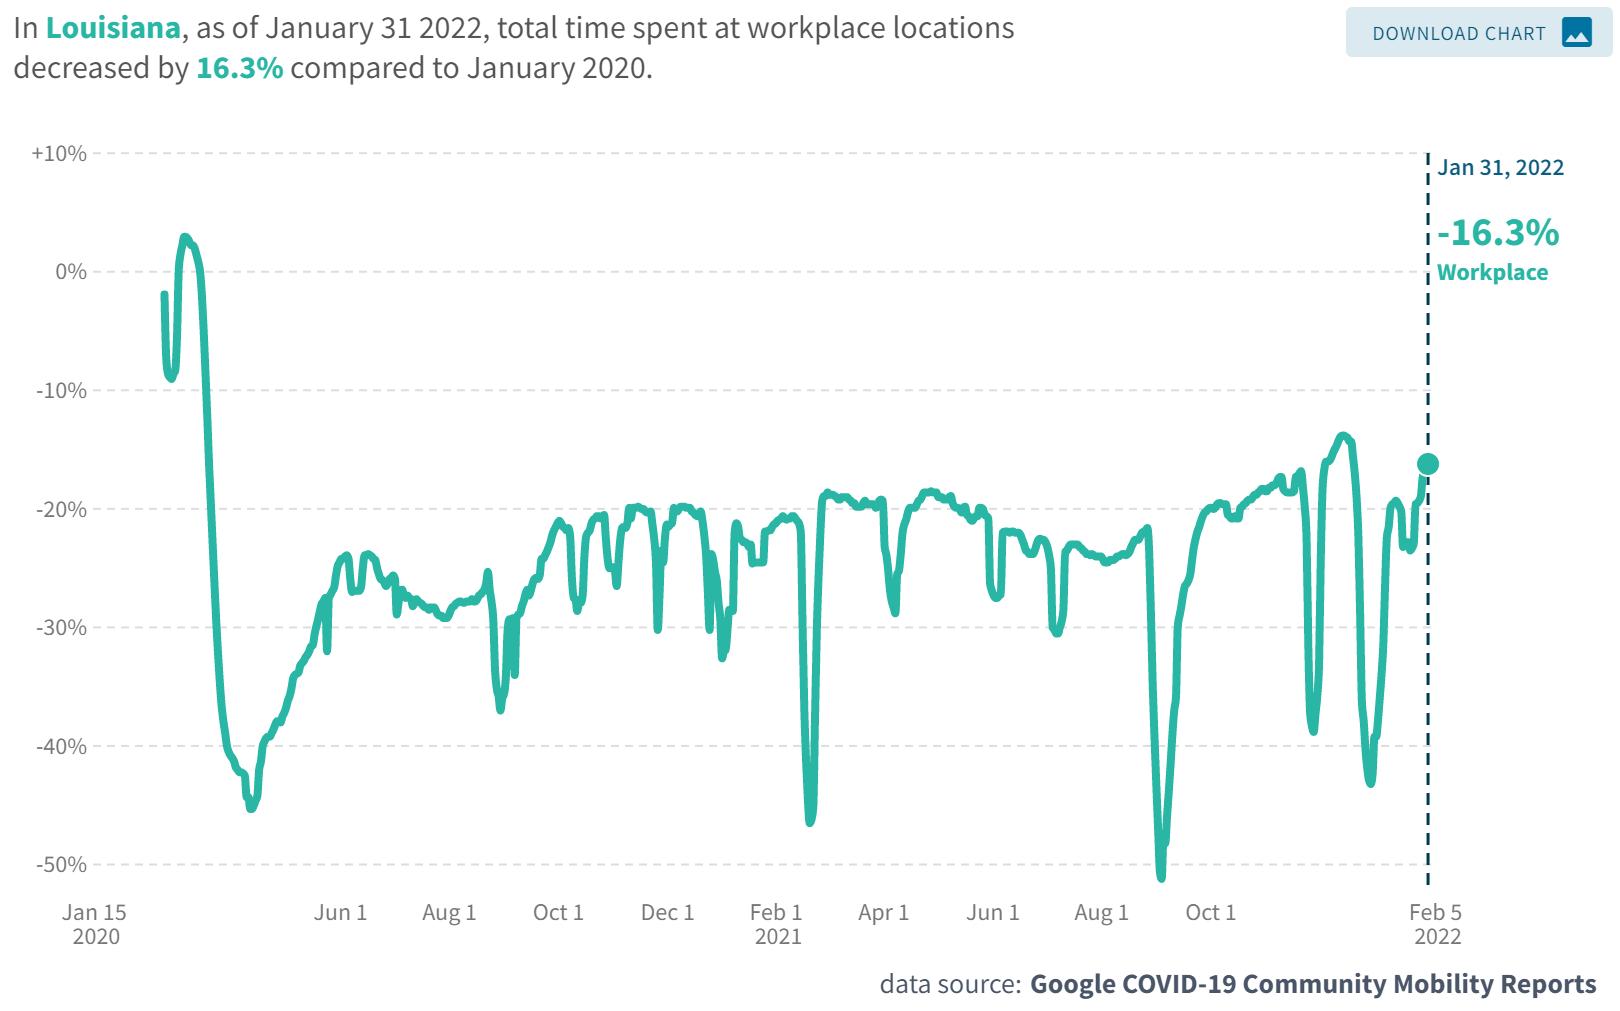
The chart represents the percent of time employees in Cenla and statewide spent at work as of January 31, 2022 with January 2020 as the baseline.
The Coincident Economic Activity Index for Louisiana is set to match the trend in the gross state product and includes four indicators: nonfarm payroll employment, the unemployment rate, average hours worked in manufacturing and wages and salaries. The column graph below represents the percentage change in the index. A positive percentage represents an expanding statewide economy.
Represents the number of drilling rigs actively exploring for or developing oil or natural gas in Louisiana and the U.S. in 2020-2021.
US 369


✓Rig count in Louisiana increased by 7 rigs or 15% in January from December.
✓Total rig count in LAhas reached January 2020 levels.
✓Nationwide, the rig count is up 63% from a year ago.
Source: Baker Hughes, https://rigcount.bakerhughes.com/na-rig-count, February 6, 2022
Gaming revenue in Louisiana for December 2021 with previous month and year comparisons.
* Note: Year-to-Date percentage reflects Louisiana’s fiscal year July 2021 – June 2022.
Data Source: Louisiana Gaming Control Board, February 6, 2022. http://lgcb.dps.louisiana.gov/revenue_reports.html
The data presented throughout the CENLA Economic Dashboard reflects contributions from the following local organizations.
Also, special thanks to the following partners for distributing the dashboard.
• LSUAFoundation
• Rapides Parish Policy Jury Treasurer
• Rapides Sales TaxAdministrator
• Avoyelles Parish School Board
• Alexandria International Airport
• RapidesArea Planning Commission
• City ofAlexandria Planning Division
• Evangeline Parish Sales Tax Commissioner
• Concordia, Catahoula, & La Salle TaxAdministrator
• Louisiana Office of Public Health, Region 6
• St. Landry Parish School Board
• Grant Parish Sheriff’s Office
• Natchitoches Parish Tax Commission
• Natchitoches Parish Planning and Zoning
• City of Natchitoches Planning
• Central Louisiana Regional Chamber of Commerce
• Marksville Chamber of Commerce
• Bunkie Chamber of Commerce
• Evangeline Chamber of Commerce
• Concordia Chamber of Commerce
• St. Landry Chamber of Commerce
• Greater Vernon Chamber of Commerce
• Natchitoches Chamber of Commerce
• Next Issue: Week of March 21, 2022
Current and past issues of the CENLAEconomic Dashboard can be found at http://www.lsua.edu/coronavirus/cenla-economic-dashboard/