CENLA ECONOMIC DASHBOARD
December 21, 2021.
Dr.RandallDupont Dean,CollegeofBusinessLouisianaStateUniversityofAlexandria
rdupont@lsua.edu


December 21, 2021.
Dr.RandallDupont Dean,CollegeofBusinessLouisianaStateUniversityofAlexandria
rdupont@lsua.edu
Region 6 (central Louisiana) has 41.2% of the population fully vaccinated, up from 39.7% in mid-November. Rapides andAvoyelles continue to have the highest percentage of completed vaccinations in Region 6 at 46.2% and 44.5%, respectively. While the number of cases from the 4th wave steadily declined through September, October, and November that trend appears to be reversing in December. Early reports from the Louisiana Department of Health are predicting a new uptrend. Young adults, those 18-29, appear to be leading the coming 5th wave much as they did in the previous waves. Hospitalization have not been significantly impacted to date.

After reaching a multi-year employment peak of 61,950 in July 2021, employment in theAlexandria MSAdeclined to 61,104 in October. Employment remains well above the metro area’s three-year historical average of 60,219. The Alexandria labor market remains tight with 6,239 openings for 2,032 unemployed. It’s unemployed-to-job-opening ratio of .33 means there are three jobs for each unemployed. Every metro area in the state had more job openings than unemployed except Houma-Thibodaux. The unemployment rate in Cenla fell to 3.8% in October compared to 3.2% in Alexandria and 4.1% in statewide.
Statewide, the average weekly initial unemployment claims filed in November fell to 1,812 from 2,845 in October, a -36% decrease, while the average weekly continued unemployment claims filed in November fell to 21,360 from 31,908 in October, a -33% decrease.
Changes in consumer spending are measured by changes in sales tax revenue. Sales taxes collected in November reflected activity in October. Consumer spending in October was lower in all ten jurisdictions reporting, ranging from -6% to -13% below the previous month. On the other hand, all jurisdictions are still reporting year-to-date gains, ranging from 8% to 49%.Alexandria and Pineville saw an -11% and -10% decline over the previous month, but were up 15% and 8%, respectively, for the year. Vehicle sales were down -15% inAvoyelles and -12% in Rapides, while Evangeline and St. Landry saw gains of 3% and 12%, respectively. Year-to-date vehicle sales remain very positive ranging from 17% to 41%. Since the first of the year, $14.8 million in sales tax revenue has been collected from online sales in central Louisiana with Rapides collecting the most at $4.5 million, followed by St. Landry at $2.8 million, and Vernon at $1.8 million. Avoyelles has collected $1.0 million since January 2021 and $1.4 million since remote sales tax collection started in July 2020. Consumer spending in Rapides in mid-November was 37% above January 2020 compared to 31% for the state, according to Opportunity Insights.
The adverse impact on travel from the 4th wave has disappeared and we are now waiting to see the impact of the Omnicron variant. Passenger throughput at AEX in November was 88% of the 2019 level compared to 80% nationwide and 77% for the state. Dining reservations are in a new uptrend since September 1, according to OpenTable. Compared to October last year, hotel occupancy inAvoyelles and Rapides were down -9% and -21%, respectively. Year-to-date, occupancy is up 20% in both parishes. Likewise, year-to-date gasoline sales in gallons in Louisiana are up 5% for the year through September.
Because of the volatility of monthly data, year-to-date permit data presents a clearer picture of local construction. Commercial permits inAlexandria are up 39% for the year while the value of residential permits are up 59%. Residential permits in Alexandria were $1.8 million in November, down -38% from October but up 78% from a year ago. So far this year, permit valuations issued inAvoyelles are up 45%, Evangeline 143%, and Rapides 895% Permits in Pineville are down -41% for the year.
The US Lumber Price Index in November increased for the second consecutive month. The 3.1% increase in November follows a 5.5% increase in October, but still puts the index -7% below the January 2021 level. Nationwide residential sales were unchanged, while new residential construction increased 12% in November. Active listings in theAlexandria MSA were down -8% in November, with median days on the market increasing from 67 to 69 days. The average and median listing price increased 5% and 6%, respectively.
Through November 2021, 93,139 new business applications were filed in Louisiana compared to 78,485 during the period in 2020 and 49,658 in 2019, representing increases of 19% over 2020 and 88% over 2019. The number of new businesses established in Rapides in November 2021 fell -15% from October but was 21% higher than November 2020. Year-to-date, 491 new businesses have been created in Rapides in 2021 compared to 383 in 2020, a 27% increase.
COVID-19 vaccinations as a percent of region population as of December 18, 2021.
✓Region 6 now has 41.24% of the population vaccinated as of mid- December, up from 40% in November, 38% in October, 35% in September, 30% inAugust and 27% in July.
✓Region 6 (Alexandria) moved ahead of Region 8 (Monroe) in percentage of total population vaccinated. ✓Region 1 (New Orleans) and Region 2 (Baton Rouge) have the highest rates of vaccination at 61% and 53%, respectively.
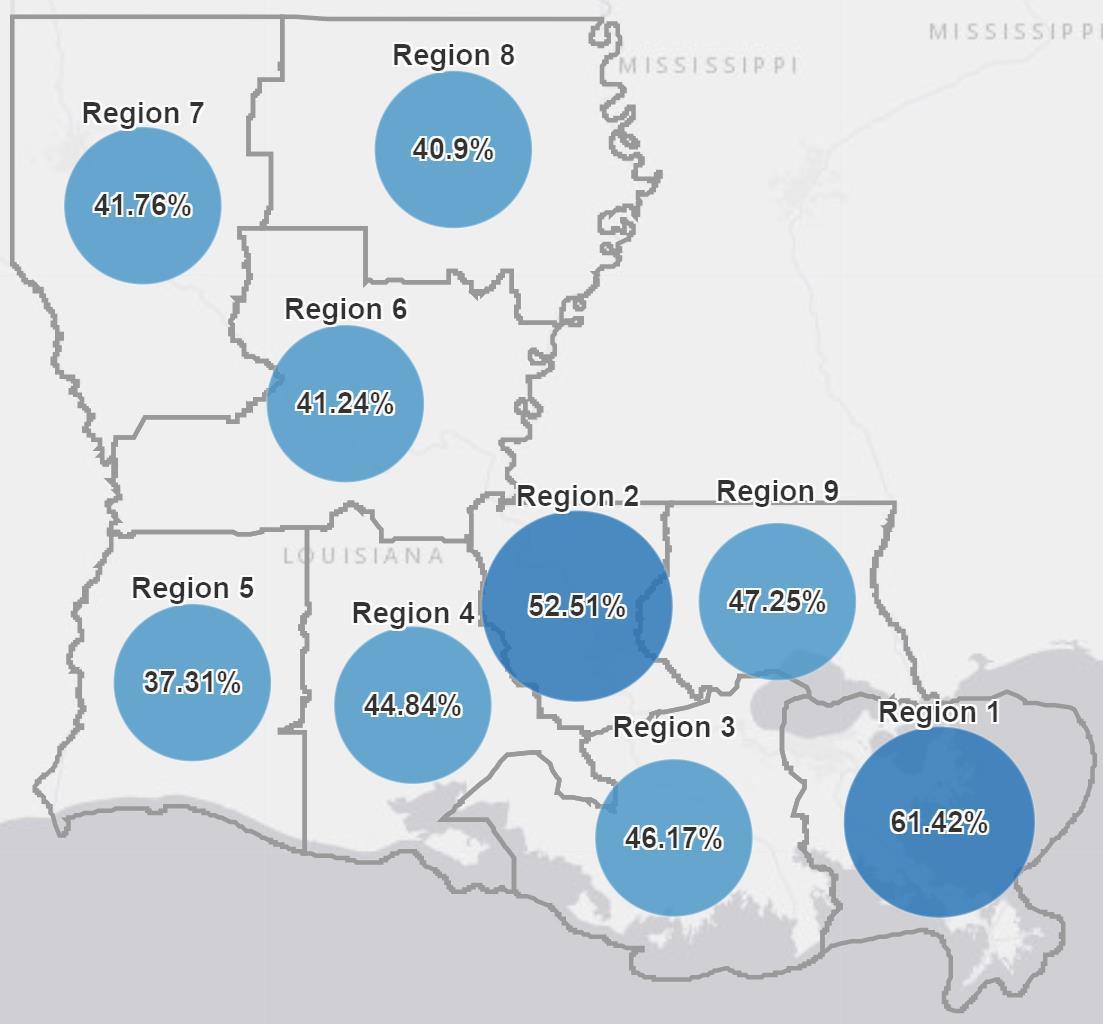
Source: Louisiana Office of Public Health, https://ldh.la.gov/covidvaccine, December 18, 2021
COVID-19 vaccinations as a percent of parish population as of December 18, 2021.
Rapides andAvoyelles have the highest percentage of completed vaccinations in December in Region 6 at 46.2% and 44.5%, up from 44.6% and 43.0%, respectively.
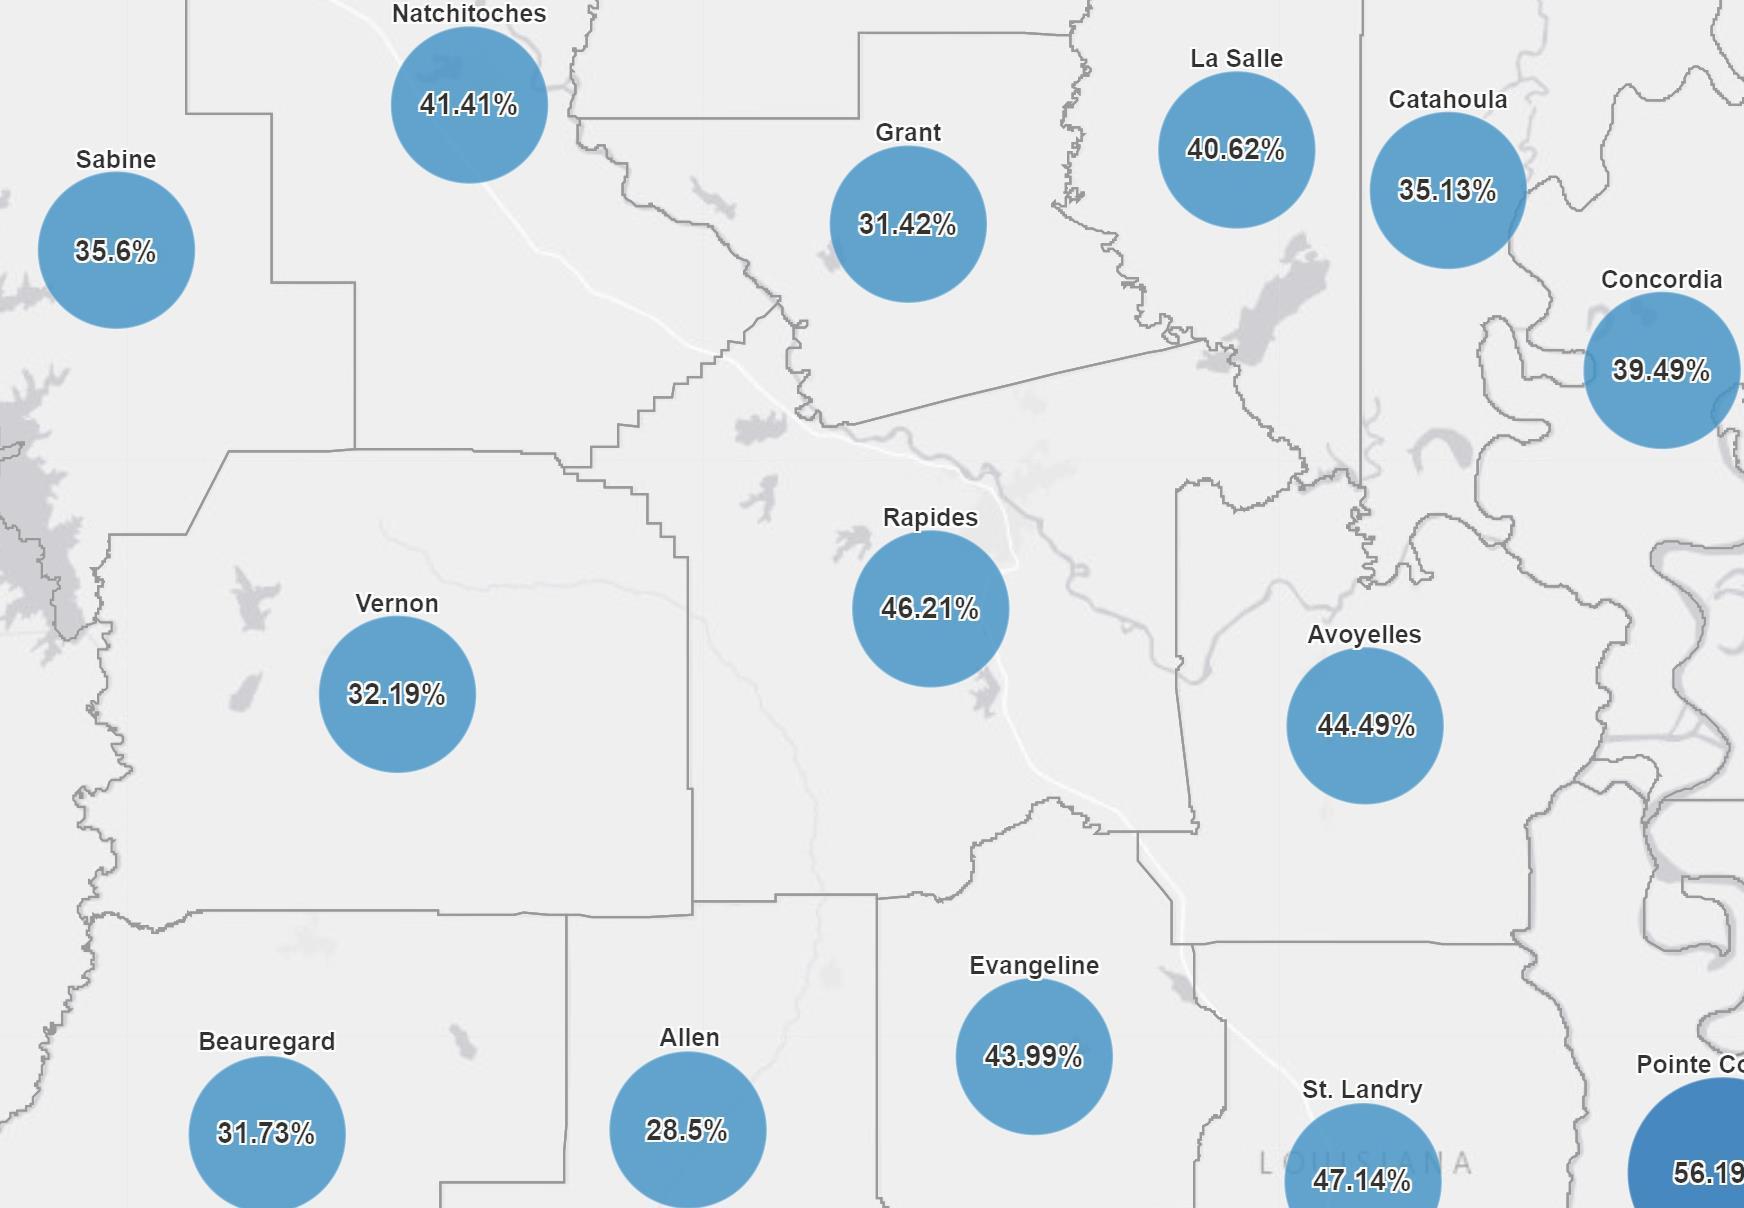
Source: Louisiana Office of Public Health, https://ldh.la.gov/covidvaccine, December 18, 2021
COVID-19 cases by collection date as of December 20, 2021 in Louisiana with a 7-day moving average.
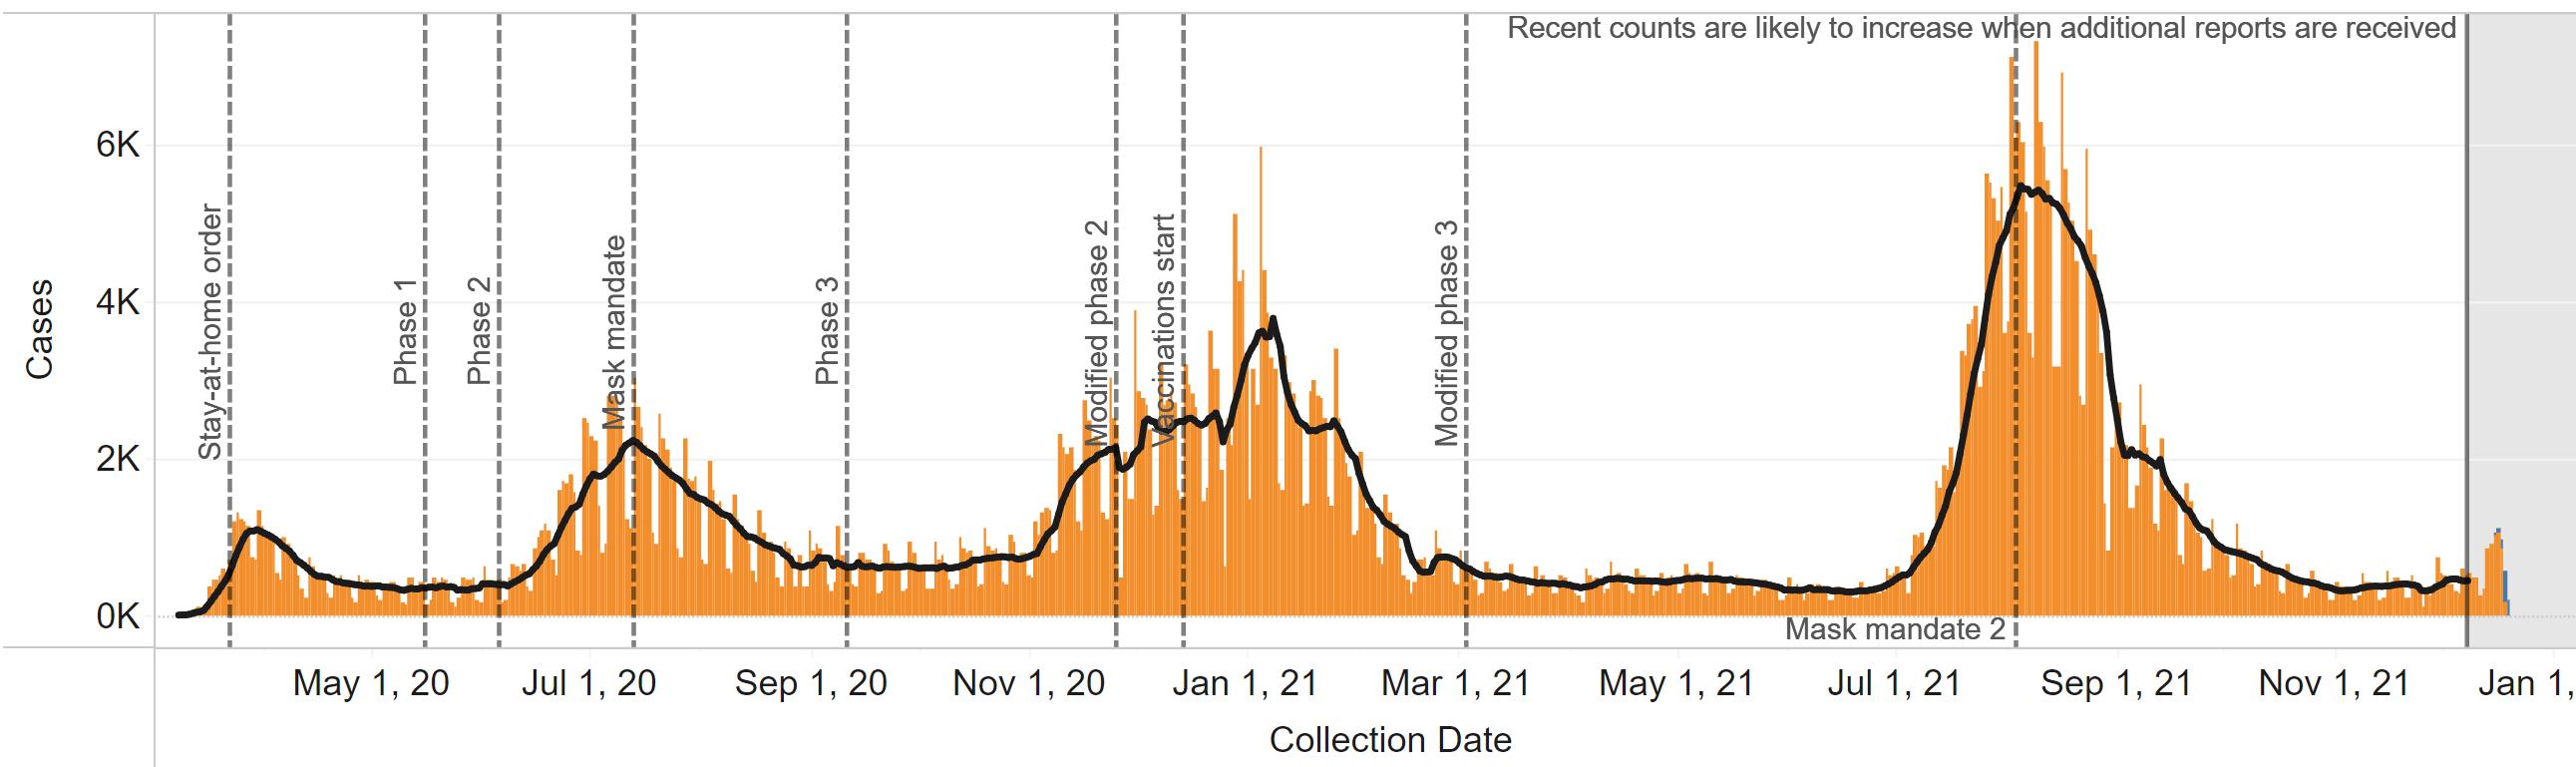
Source: Louisiana Office of Public Health, Region 6 (Central Louisiana), December 20, 2021.
Cases over time by age group in Louisiana through December 20, 2021.
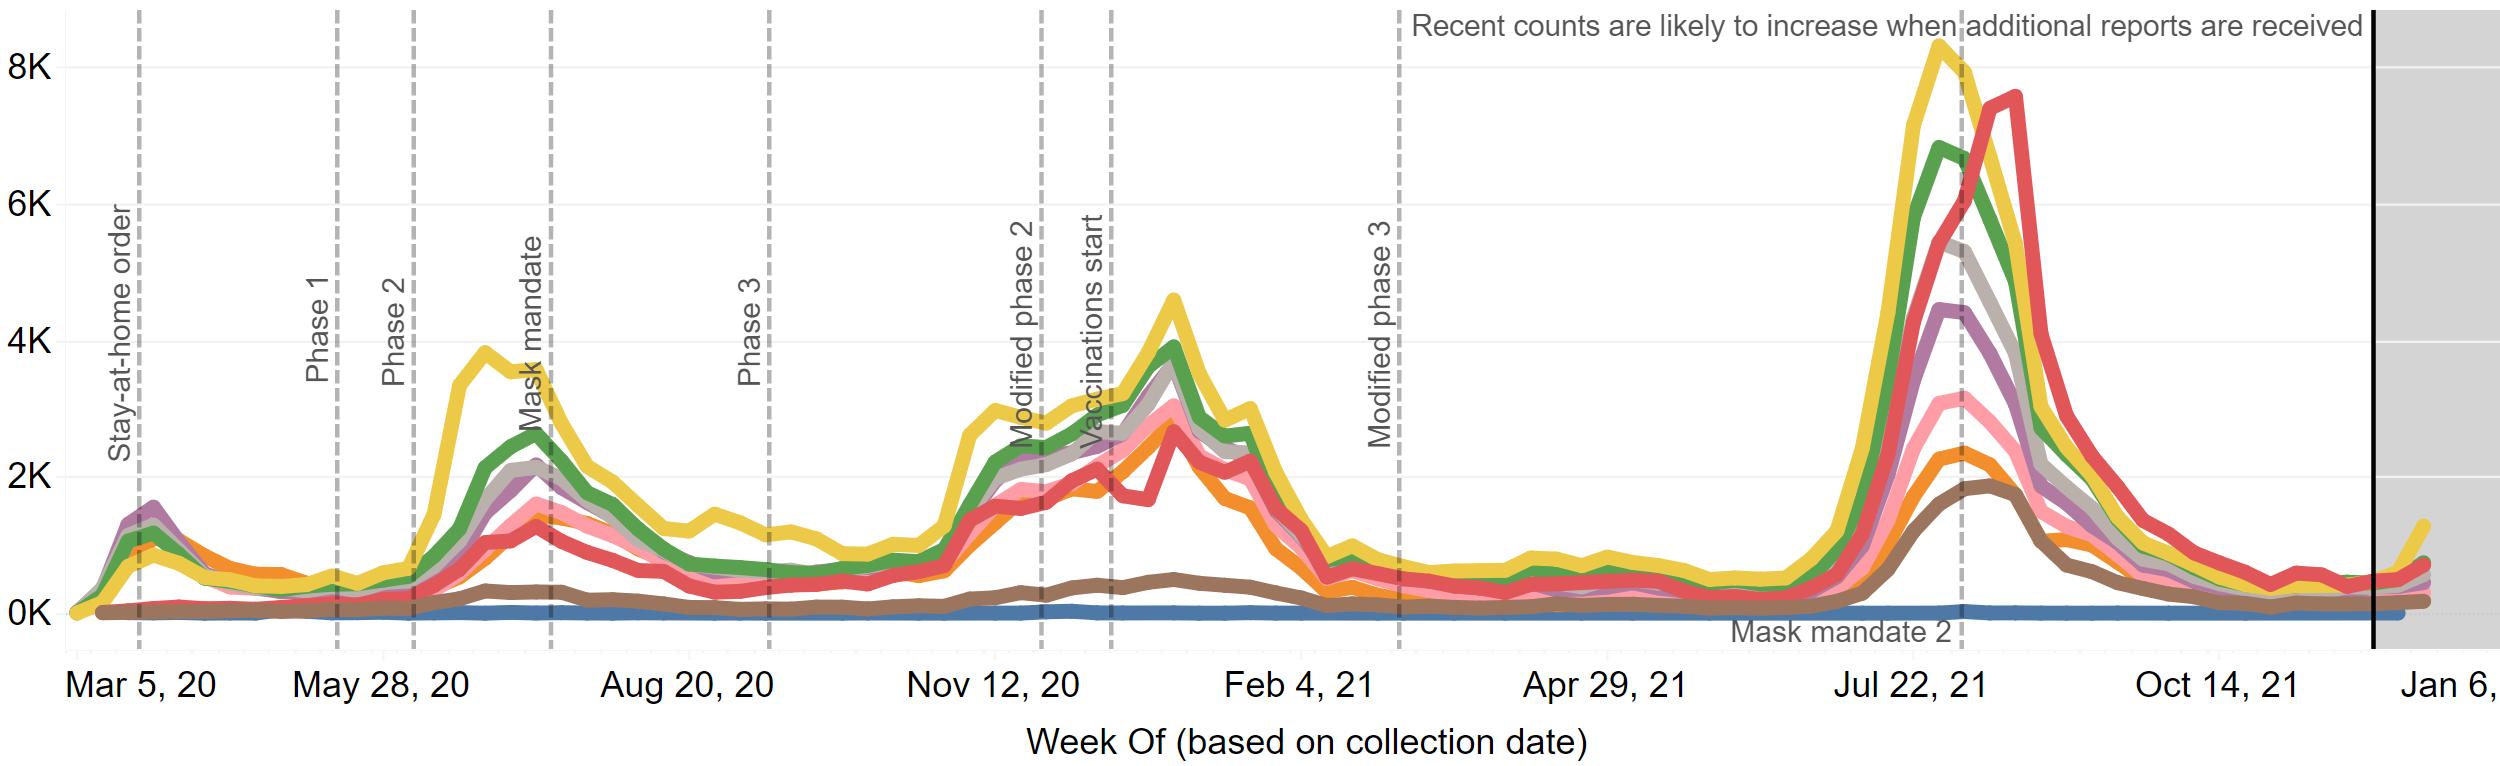
Source: Louisiana Office of Public Health, Region 6 (Central Louisiana), December 20, 2021.
COVID-19 percent positive and test volume in Region 6 as of December 18, 2021.
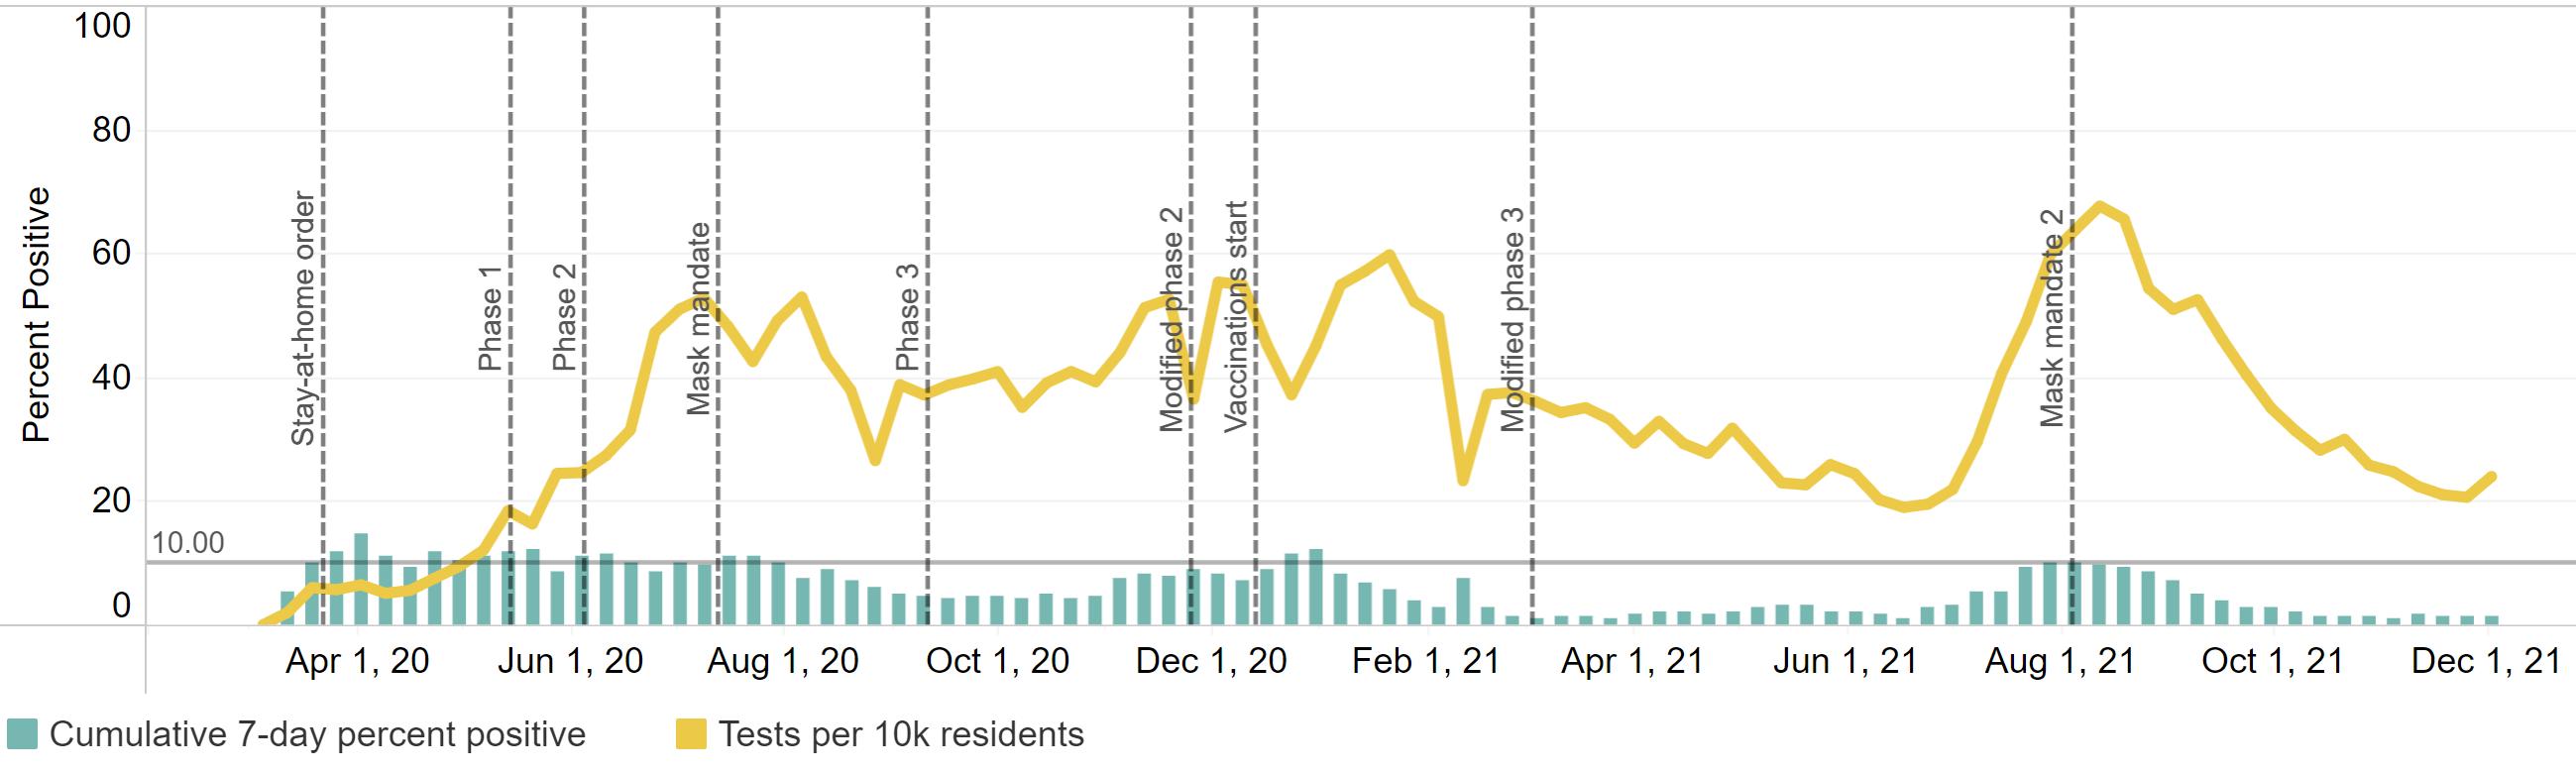
Source: Louisiana Office of Public Health, Region 6 (Central Louisiana), December 18, 2021..
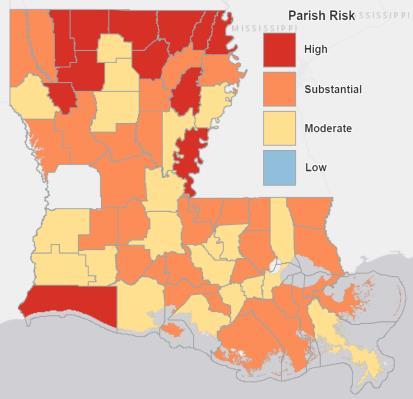
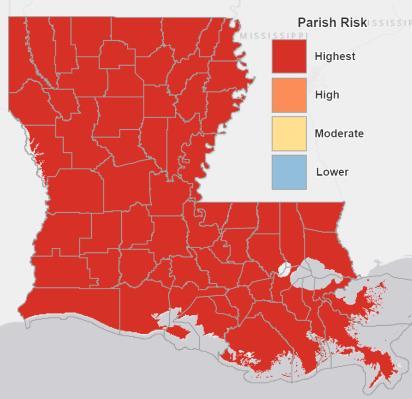
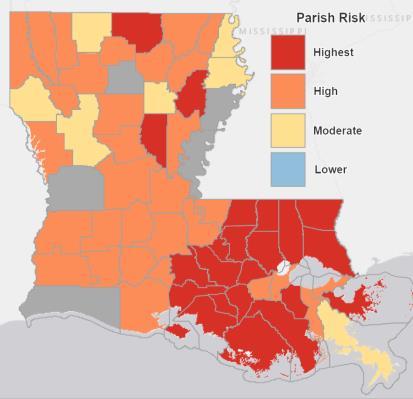
COVID-19 statewide risk by parish.
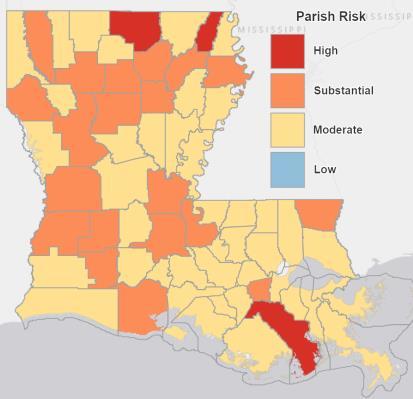
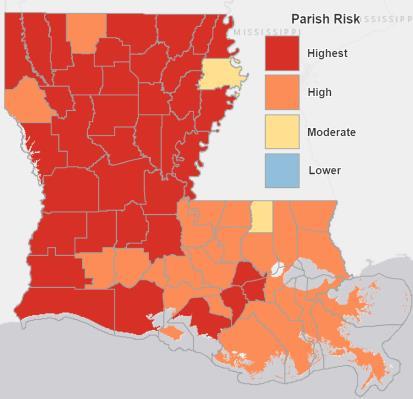
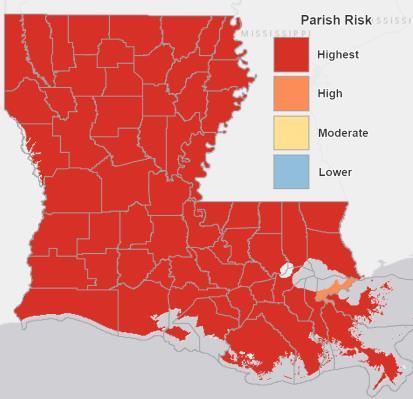
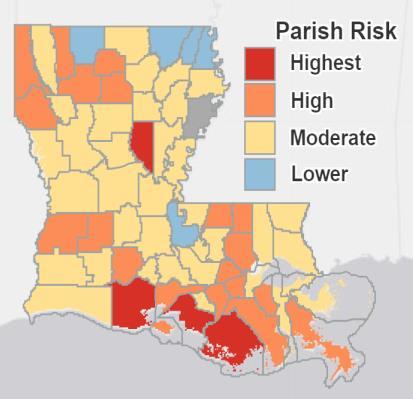
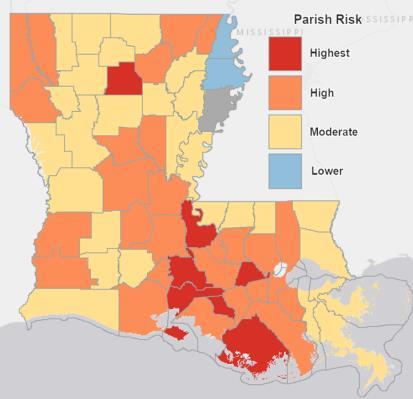
May 13, 2021
June 11, 2021
July 15, 2021
August 18, 2021
September 18, 2021
October 17, 2021
November 14, 2021
December 18, 2021
Source: Louisiana Office of Public Health, December 18, 2021.
Number of cases hospitalized (green line) and ventilated (yellow line) in Region 6 as of December 18, 2021.
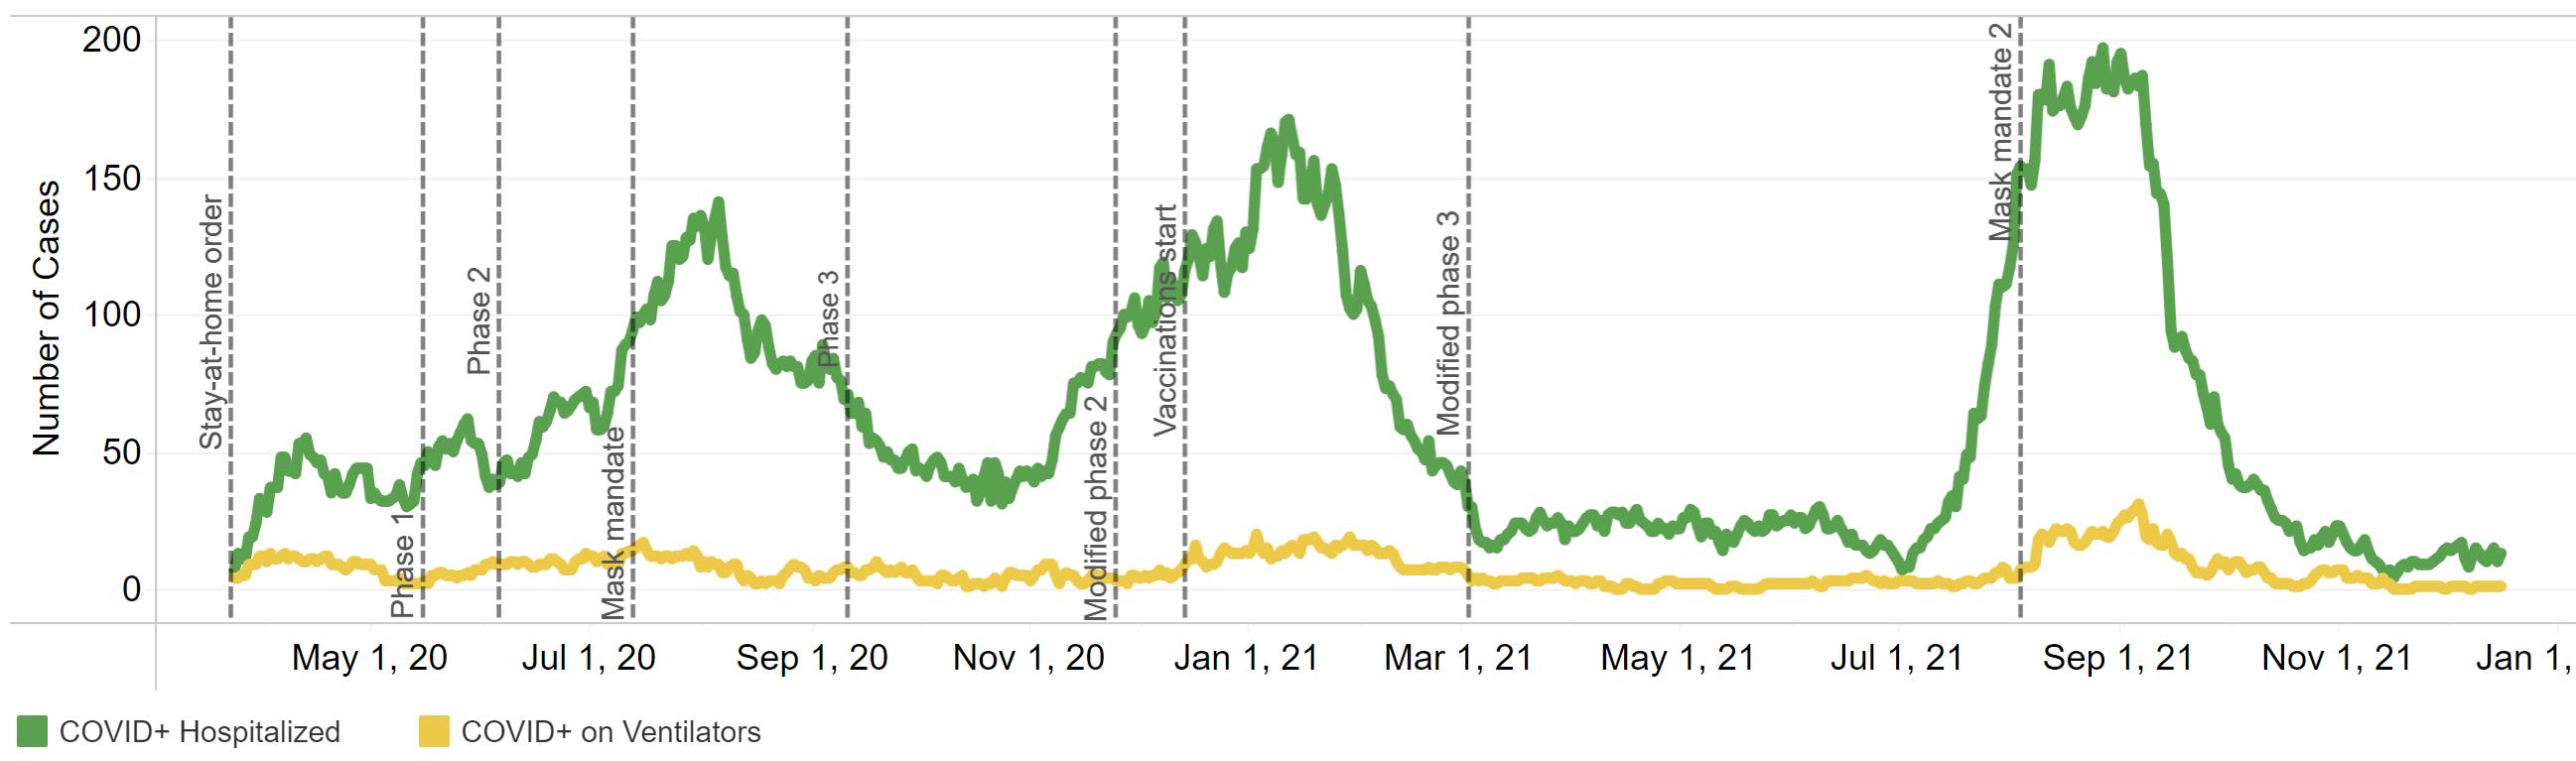
Source: Louisiana Office of Public Health, Region 6 (Central Louisiana), December 18, 2021.
COVID-19 deaths by date of death statewide as of December 18, 2021.
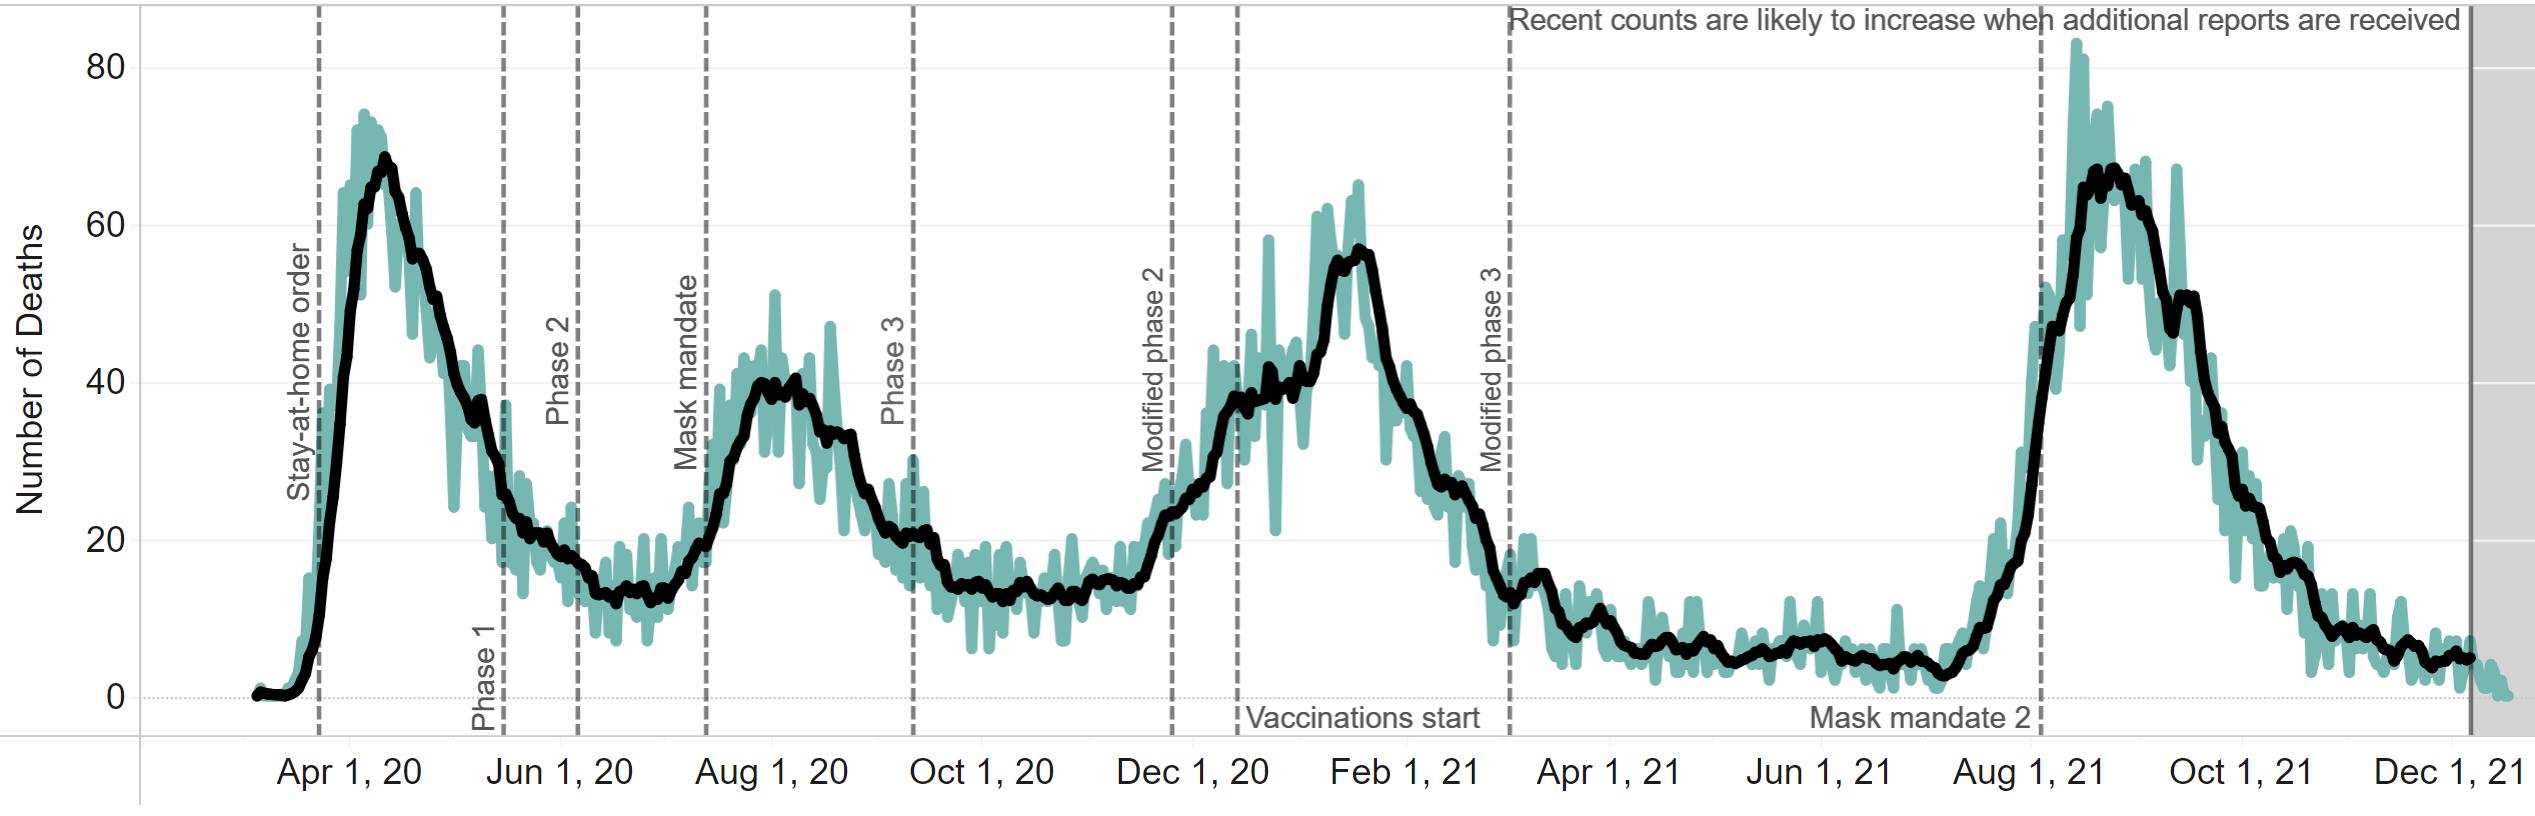
Source: Louisiana Office of Public Health, Region 6 (Central Louisiana), December 18, 2021.
COVID-19 cases (left) and deaths (right) statewide by age group as of December 18, 2021.
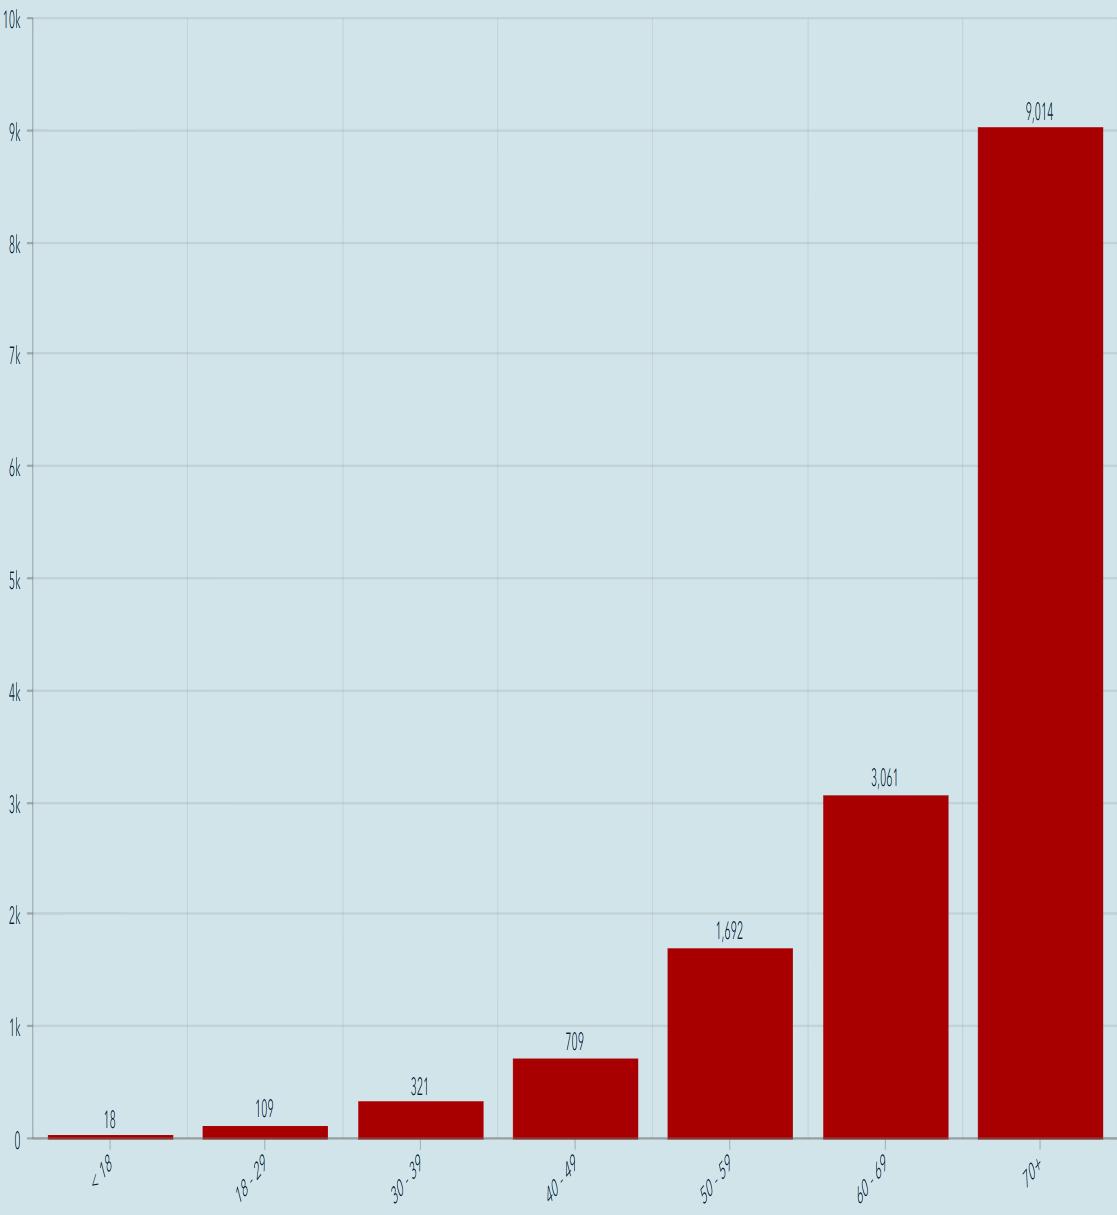
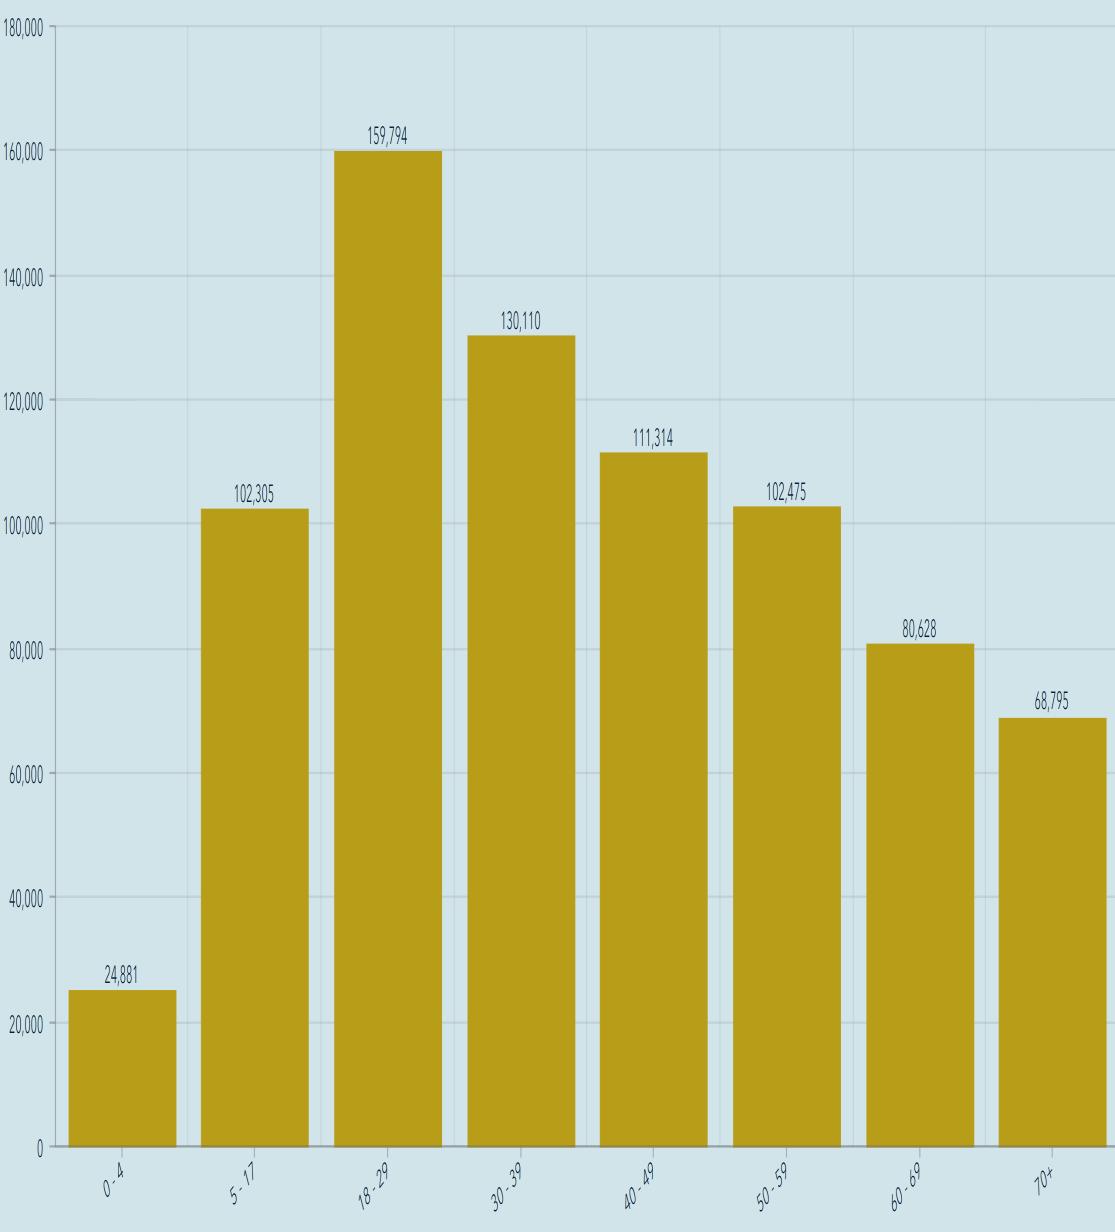
Source: Louisiana Office of Public Health, Region 6 (Central Louisiana), December 18, 2021.
Employed persons in the Alexandria MSA from 2019 – 2021.
Employed Persons in Alexandria, LA MSA 2019 - 2021
✓In October 2021, 61,104 were employed in the Alexandria metro area, a decrease of 543 from September and 144 from October 2020.
✓Unemployment in Alexandria MSAfell to 3.2% in October from 3.4% in September.
Source: Louisiana Workforce Commission, December 21, 2021
The table below shows October 2021 preliminary unemployment rate, labor force, and employment data for central Louisiana parishes.
✓In October, parishes in central Louisiana had an average unemployment rate of 3.8% compared to 4.3% statewide.
✓At 2.6%, La Salle Parish had the lowest unemployment rate in the state, a record it has held throughout the pandemic.
✓Grant and Rapides had the 8th and 12th lowest unemployment rate in the state, respectively. Natchitoches ranked 19th .
Data Source: Louisiana Workforce Commission, December 21, 2021.
Initial and continued unemployment claims in Louisiana from January to November 2021.


✓Statewide average weekly initial unemployment claims filed in November fell to 1,812 from 2,845 in October, a -36% decrease.
Statewide average weekly continued unemployment claims filed in November fell to 21,360 from 31,908 in October, a -33% decrease.
Source: Louisiana Workforce Commission, December 21, 2021
Unemployment Claims in Louisiana
January 1 - November 27, 2021
The table below shows October 2021 preliminary unemployment rate, labor force, and employment data for Metropolitan Statistical Areas in Louisiana.
✓At 3.2%, the Alexandria MSAhad the lowest unemployment rate among the state’s major metro areas for the 18th straight month.
✓Louisiana’s unemployment rate fell 0.2% in November to 4.1% from 4.3% in October.
Data Source: Louisiana Workforce Commission, December 21, 2021.
The table below shows the number of unemployed, number of advertised jobs online, and the ratio of unemployed to advertised job openings online for Metropolitan Statistical Areas in Louisiana in October 2021.
✓In October, the Alexandria MSAhad the tightest labor market in the state with only 0.33 unemployed persons per job opening, meaning there were three job opening for every unemployed. ✓Every metro area in the state had more job openings than unemployed except Houma-Thibodaux.
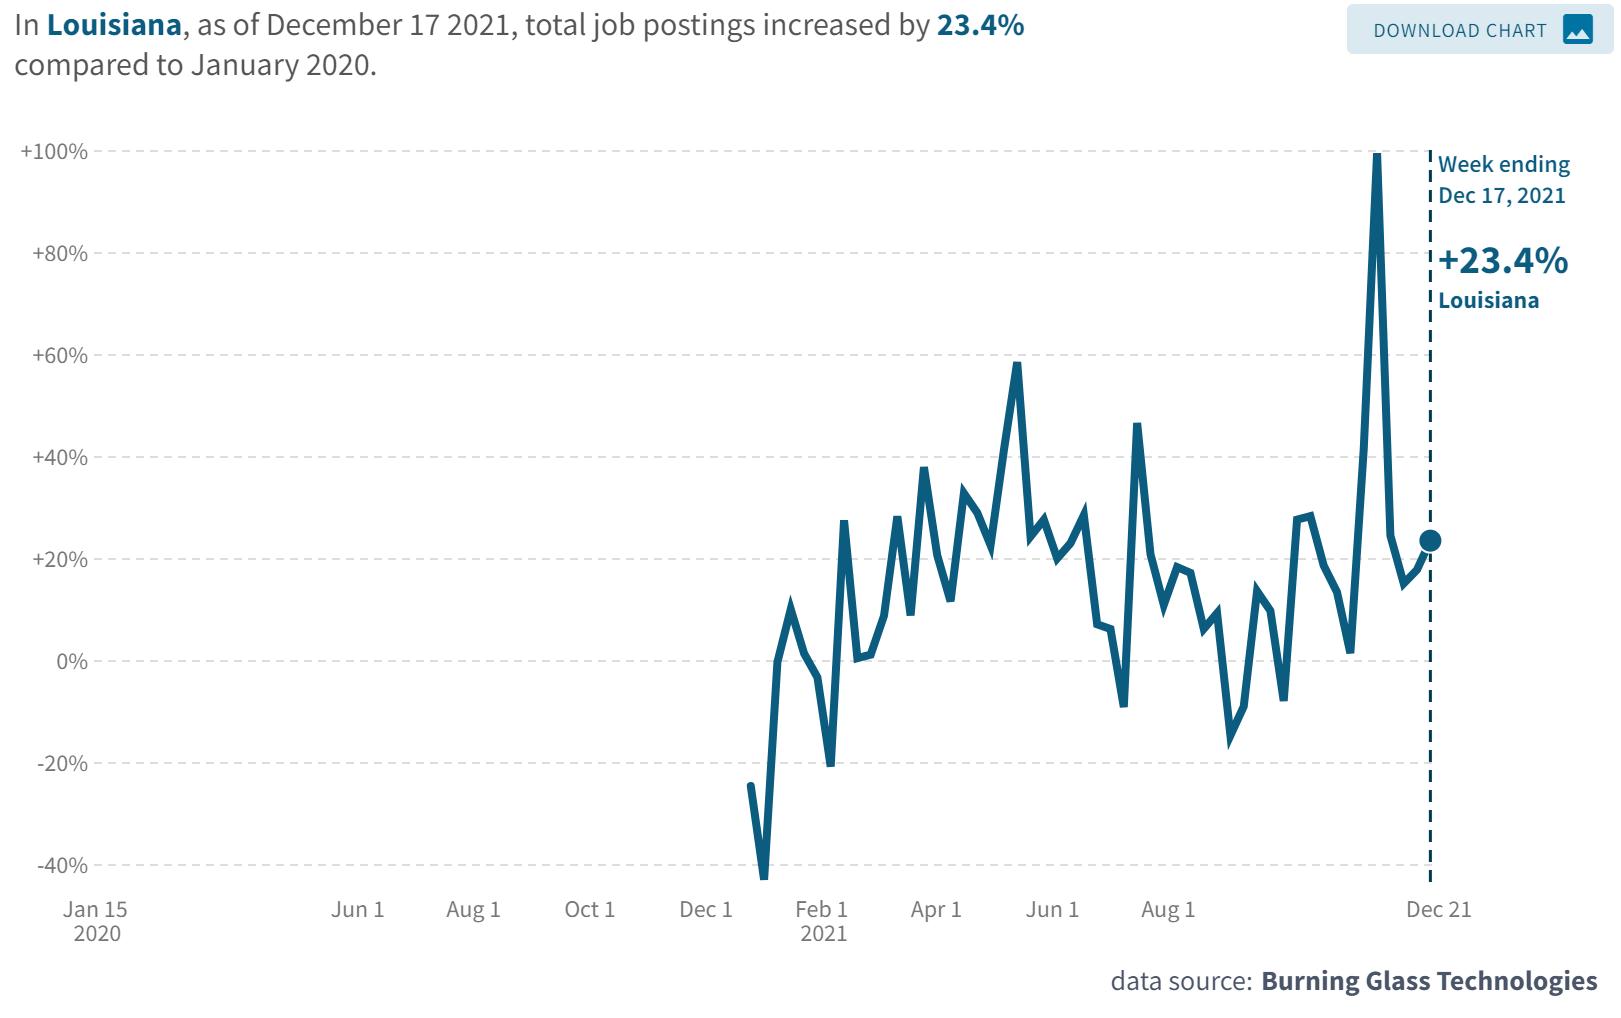
The chart below represents the percent change in job posting by industry in Louisiana as of December 17, 2021 with January 2020 as the baseline.
An overview of sales, vehicle sales, and hotel occupancy taxes collected in the November 2021 reflecting sales activity in October 2021.
Note: November tax revenue reflects sales activity in October. N/a = Not available
Data Source noted in detailed reports.


An overview of sales tax revenue in Rapides Parish other towns and cities in November 2021 (excluding Alexandria and Pineville).
Note: Current tax revenue reflects sales activity in prior month.


(TR) Alexandria total sales tax revenue for November with previous month, year, and YTD comparisons.
(BR) Alexandria total monthly sales tax revenue from 2019 to present.
Note: November sales tax revenue reflects sales activity in October.
Data Source: Rapides Parish Police Jury Treasurer’s Reports, December 2021.
Avoyelles Parish total sales tax revenue for November with previous month, year, and year-to-date comparisons. Vehicle and hotel tax revenues are excluded.
Note: November sales tax revenue reflects sales activity in October.
Data Source: Avoyelles Parish School Board. December 2021.
Avoyelles Parish vehicle sales tax revenue for November with previous month, year, and year-to-date comparisons.
Note: November sales tax revenue reflects sales activity in October.
Data Source: Avoyelles Parish School Board. December 2021
Catahoula Parish total sales tax revenue for November with previous month, year, and year-todate comparisons.
Note: November sales tax revenue reflects sales activity in October.
Data Source: Catahoula Parish Tax Administrator, December 2021
Concordia Parish total sales tax revenue for November with previous month, year, and year-todate comparisons.
Note: November sales tax revenue reflects sales activity in October.
Data Source: Concordia Parish Tax Administrator. December 2021
Evangeline Parish total sales tax revenue for November with previous month, year and YTD comparisons.
Note: November sales tax revenue reflects sales activity in October. Evangeline implemented a 1% sales tax increase
Data Source: Evangeline Parish Sales Tax Commissioner. December 2021
Evangeline Parish vehicle sales tax revenue for November with previous month, year and YTD comparisons.
Note: November sales tax revenue reflects sales activity in October. Evangeline implemented a 1% sales tax increase July 1, 2021.
Data Source: Evangeline Parish Sales Tax Commissioner. December 2021
(TR) Grant sales tax revenue for November with previous month, year, and YTD comparisons.
(BR) Grant monthly sales tax revenue from 2019 to present.
Note: November sales tax revenue reflects sales activity in October.
Data Source: Grant Parish Sheriff’s Office, December 2021.
La Salle Parish total sales tax revenue for November with previous month, year, and year-todate comparisons.
Note: November sales tax revenue reflects sales activity in October.
Data Source: La Salle Parish Tax Administrator, December 2021

(TR) Pineville sales tax revenue for November with previous month, year, and YTD comparisons.
(BR) Pineville monthly sales tax revenue from 2019 to present.
Note: Current sales tax revenue reflects sales activity in the prior month. Data Source: Rapides Parish Police
(TR) Rapides Parish sales tax revenue for November with previous month, year, and YTD comparisons.
(BR) Rapides monthly sales tax revenue from 2019 to present.
Note: Current sales tax revenue reflects sales activity in the prior month.
Data Source: Rapides Parish Police Jury Treasurer’s Reports, December 2021.
Rapides Parish vehicle sales tax revenue for November with previous month, year, and YTD comparisons.
*November 2020 data is not available.
Data Source: Rapides Parish Police Jury Treasurer’s Reports, December 2021.
St. Landry Parish sales tax revenue for November with previous month, year, and YTD comparisons.
Note: November sales tax revenue reflects sales activity in October.
Data Source: Tax revenue data from St. Landry Parish School Board. December 2021
St. Landry Parish vehicle sales tax revenue for November with previous month, year, and YTD comparisons.
Note: November sales tax revenue reflects sales activity in October.
Data Source: Tax revenue data from St. Landry Parish School Board. December 2021
Remote seller tax revenue is tax revenue from online sales by location of the seller at the time of purchase.
August 2020 - November 2021
SinceAugust 2020 when remote sellers tax revenue collection started, $19.7 million in sales tax revenue have been collected from online sales in central Louisiana with Rapides collecting $5.9 million.
Online sales tax revenue in Cenla fell -7% in November from October.
Note: Sales tax revenue collected in Novmeber reflects sales activity in October.
Data Source: Louisiana Sales and Use Tax Commission for Remote Sellers.August 2020 – November 2021
Remote seller tax revenue by parish with month-over-month and year-over-year comparisons.
✓Total online sales tax revenue in Cenla in November fell -7% from October but increased 16% from a year earlier.
Note: Sales tax revenue collected in October reflects sales activity in September.
Data Source: Louisiana Sales and Use Tax Commission for Remote Sellers.August 2020 – November 2021
Remote sellers tax revenue from online sales in Rapides Parish from July 2020 – November 2021.
Note: Sales tax revenue collected in one month reflects sales activity in the prior month.
Data Source: Louisiana Sales and Use Tax Commission for Remote Sellers.August 2020 – November 2021

(TR) Louisiana tax revenue from all sources for November with previous month, year, and YTD comparisons.
(BR) Louisiana monthly tax revenue from 2019 to present.
The valuation (estimated development cost) of new commercial construction permits issued by the City of Alexandria in November 2021 with previous month, year, and YTD comparisons.
The valuation (estimated development cost) of new residential construction permits issued by the City of Alexandria in November 2021 with previous month, year, and YTD comparisons.
This chart shows the valuation of permits issued by Rapides Area Planning Commission in Allen Parish in November between 2018-2021 with monthto-month, year-to-year, and year-to-date comparisons.
Data Source: RapidesArea Planning Commission, December 2021
This chart shows the valuation of permits issued by Rapides Area Planning Commission in Avoyelles Parish in November between 2019-2021 with month-tomonth, year-to-year, and year-to-date comparisons.
Data Source: RapidesArea Planning Commission, December 2021.
This chart shows the valuation of permits issued by Rapides Area Planning Commission in Evangeline Parish in November between 2018-2021 with month-tomonth, year-to-year, and year-to-date comparisons.
Data Source: RapidesArea Planning Commission, December 2021.
This chart shows the valuation of permits issued by Rapides Area Planning Commission in the City of Pineville in November between 2018-2021 with month-to-month, year-to-year, and year-to-date comparisons.
Data Source: RapidesArea Planning Commission, December 2021.
This charts shows the valuation of permits issued by Rapides Area Planning Commission in Rapides Parish (excluding Alexandria) in November between 2018-2021 with month-to-month, year-to-year, and year-to-date comparisons.
Data Source: RapidesArea Planning Commission, December 2021.
The chart represents the Lumber Price Index in the U.S. from January 2020 – November 2021.
▪ In November 2021, the US Lumber Price Index increased 3.2% from the previous month. ▪ The US Lumber Price Index in November was -7% below the January 2021 level, but 13% above a year ago.
Data Source: Fed Reserve Economic Database, St. Louis Federal Reserve Bank, December 17, 2021.

The count of active single-family and condo/townhome listings for Alexandria MSA (excludes pending listings) for November 2018-2021 with month-to-month and year-over-year comparisons.
✓Active listings in November decreased -8% over the previous month and remain -27% below a year ago.

The count of pending single-family and condo/townhome listings for Alexandria MSA for November 2018-2021 with month-tomonth and year-over-year comparisons.

The median number of days property listings spend on the market in Alexandria MSA for November 2018-2021 with month-to-month and year-over-year comparisons.
Median days on the market rose 2% in November from previous month and was -18% below a year ago.
✓Homes took an average of 69 days on the market to sell in November, down from 83 days the same month in 2020 and 92 in 2019.

The median listing price of houses in Alexandria MSA for November 2018-2021 with month-to-month and year-over-year comparisons.
The median listing price in November rose 6% to $185,000 from the previous month of $174,500 and still remains -17% below a year ago.

The average listing price of houses in Alexandria MSA for November 2018-2021 with month-to-month and year-over-year comparisons.
The average listing price rose 5% to $234,339 this month from $ 222,244 last month, but remains -13% below a year ago.
The chart illustrates the number of website visits to LouisianaTravel.com from 2018 to 2021.
✓Website visits in October 2021 were 537,577, the highest level in four years and 77% over October 2020.
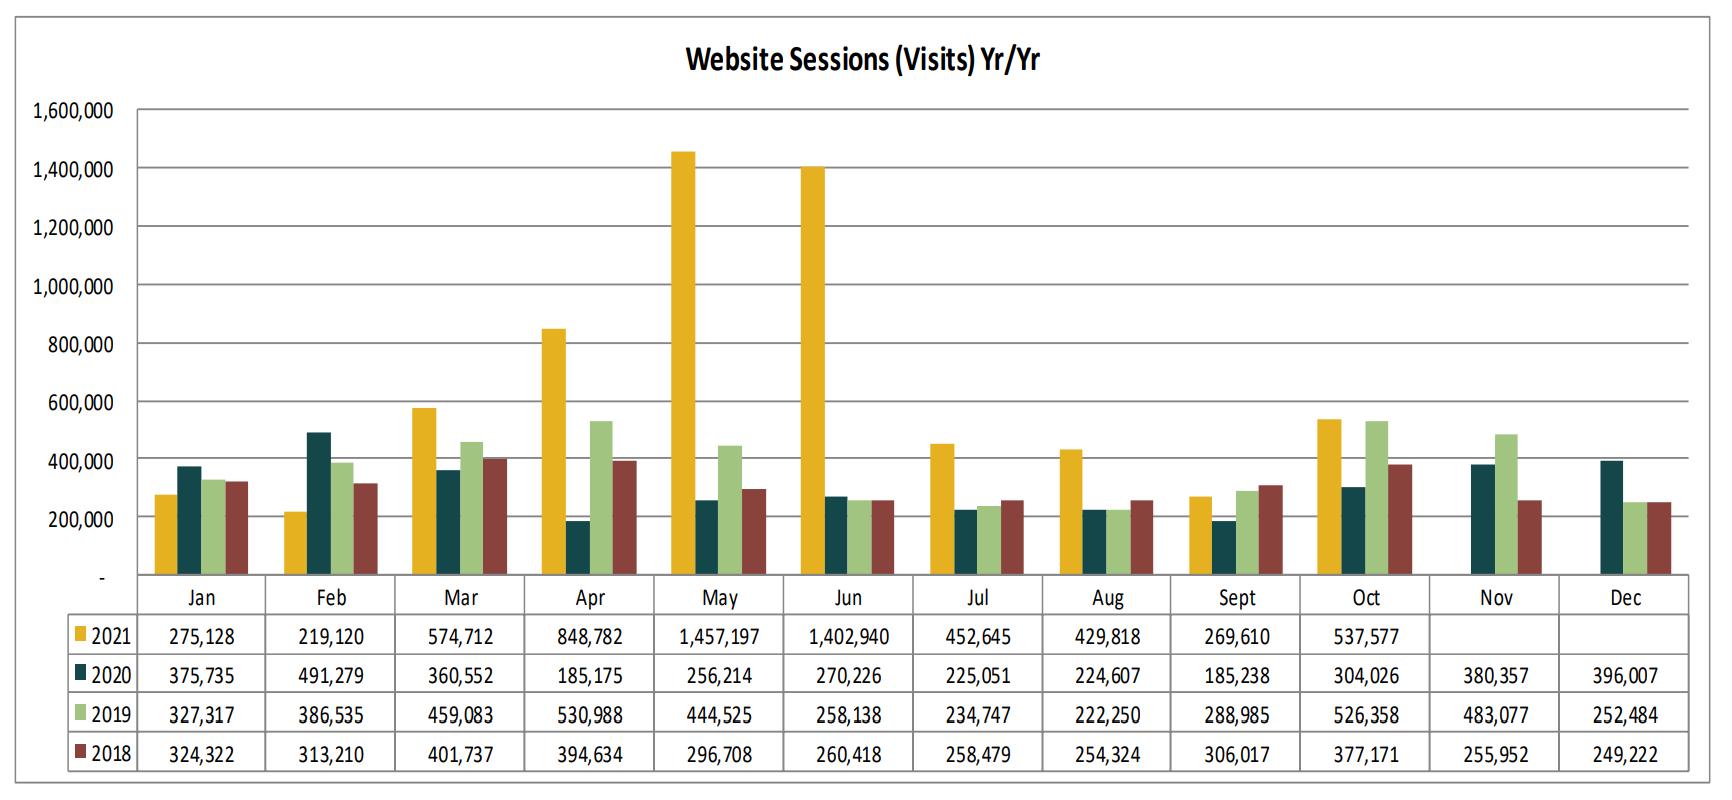
✓In October, Louisiana welcome center visits doubled from September.
Data Source: Louisiana Department of Culture, Recreation, & Tourism, December 16, 2021
Avoyelles Parish hotel occupancy tax revenue for November with previous month, year, and year-to-date comparisons.
Note: November tax revenue reflects hotel occupancy activity in October. Hotel occupancy tax revenue is used as a proxy for hotel occupancy rate.
Data Source: Avoyelles Parish School Board. December 2021.
Rapides Parish hotel occupancy tax revenue for November with previous month, year, and YTD comparisons.
Note: November tax revenue reflects hotel occupancy activity in October. Hotel occupancy tax revenue is used as a proxy for hotel occupancy rate.
Data Source: Rapides Parish Police Jury Treasurer’s Reports, December 2021.
This chart shows total passenger throughput at AEX and other Louisiana airports in November 2021 as a percent of traffic in 2019. AEX is the solid black line.
Passenger Throughput at AEX as a Percent 2019 Traffic (November 2021)

Last month,AEX had 88%of the passenger throughput of November 2019.
Statewide passenger throughput in November was -23% below November 2019.

Nationwide daily percentage of passengers passing through current TSA checkpoints in 2021 expressed as a percentage of 2019 traffic.
U.S. Airport Passenger Throughput Traffic in 2021 as a Percent of 2019 Traffic
Nationally, air passenger traffic in November leveled off, posting only a 0.8% gain over October. ✓Year-over-year, November 2021 traffic was 127% above the same month in 2020, but still -16% below November 2019.
This data shows seated diners at restaurants on the OpenTable network in Louisiana in 2021 compared with the same day of the week for 2019. OpenTable reservations are mostly from southeast Louisiana restaurants.
• Reservations in Louisiana have begun a new uptrend from the low reached following Hurricane Ida.
• Compared to November 2019, reservations were down -9% in November 2021.
Source: OpenTable, https://www.opentable.com/state-of-industry, December 16, 2021
OpenTable Reservations in
Percent Change in 2021 vs 2019
Hurricane Ida
Total gasoline sales in gallons in Louisiana in 2019 - 2021.


✓September 2021 gasoline sales increased 1.8% from August and is up 3.8% from a year ago.
✓Gasoline sales YTD in September are 5.2% above the same period in 2020, but -1.6% below 2019.
Data Source: U.S. Energy Information Administration, Prices, Sales Volumes & Stocks by State, December 16, 2021


The chart below represents the weekly number of new businesses applications in Louisiana from 2019-2021
✓Through November 2021, 93,139 new business applications were filed in Louisiana compared to 78,485 during the period in 2020 and 49,658 in 2019, representing increases of 19% over 2020 and 88% over 2019.
Note: Data reflects businesses applications, not necessarily business formations.
Data Source: U.S. Census Bureau, Business Formation Statistics, Retrieved December, 2021.
The chart below represents the number of new businesses established each month in Rapides from January 2019 through November 2021.


The number of new businesses established in Rapides in November 2021 fell -15% from October but was 21% higher than November 2020.
Year-to-date, 491 new businesses have been created in Rapides in 2021 compared to 383 in 2020, a 27% increase.
Note: Data reflects businesses established in the current month.
Data Source: Rapides Parish Sales and Use Tax Department, December 2021.
Rapides Parish occupational license revenue YTD with previous YTD comparisons.
Note: Rapides Parish reflects unincorporated areas.
Data Source: Rapides Parish Police Jury Treasurer’s Reports, December 2021.
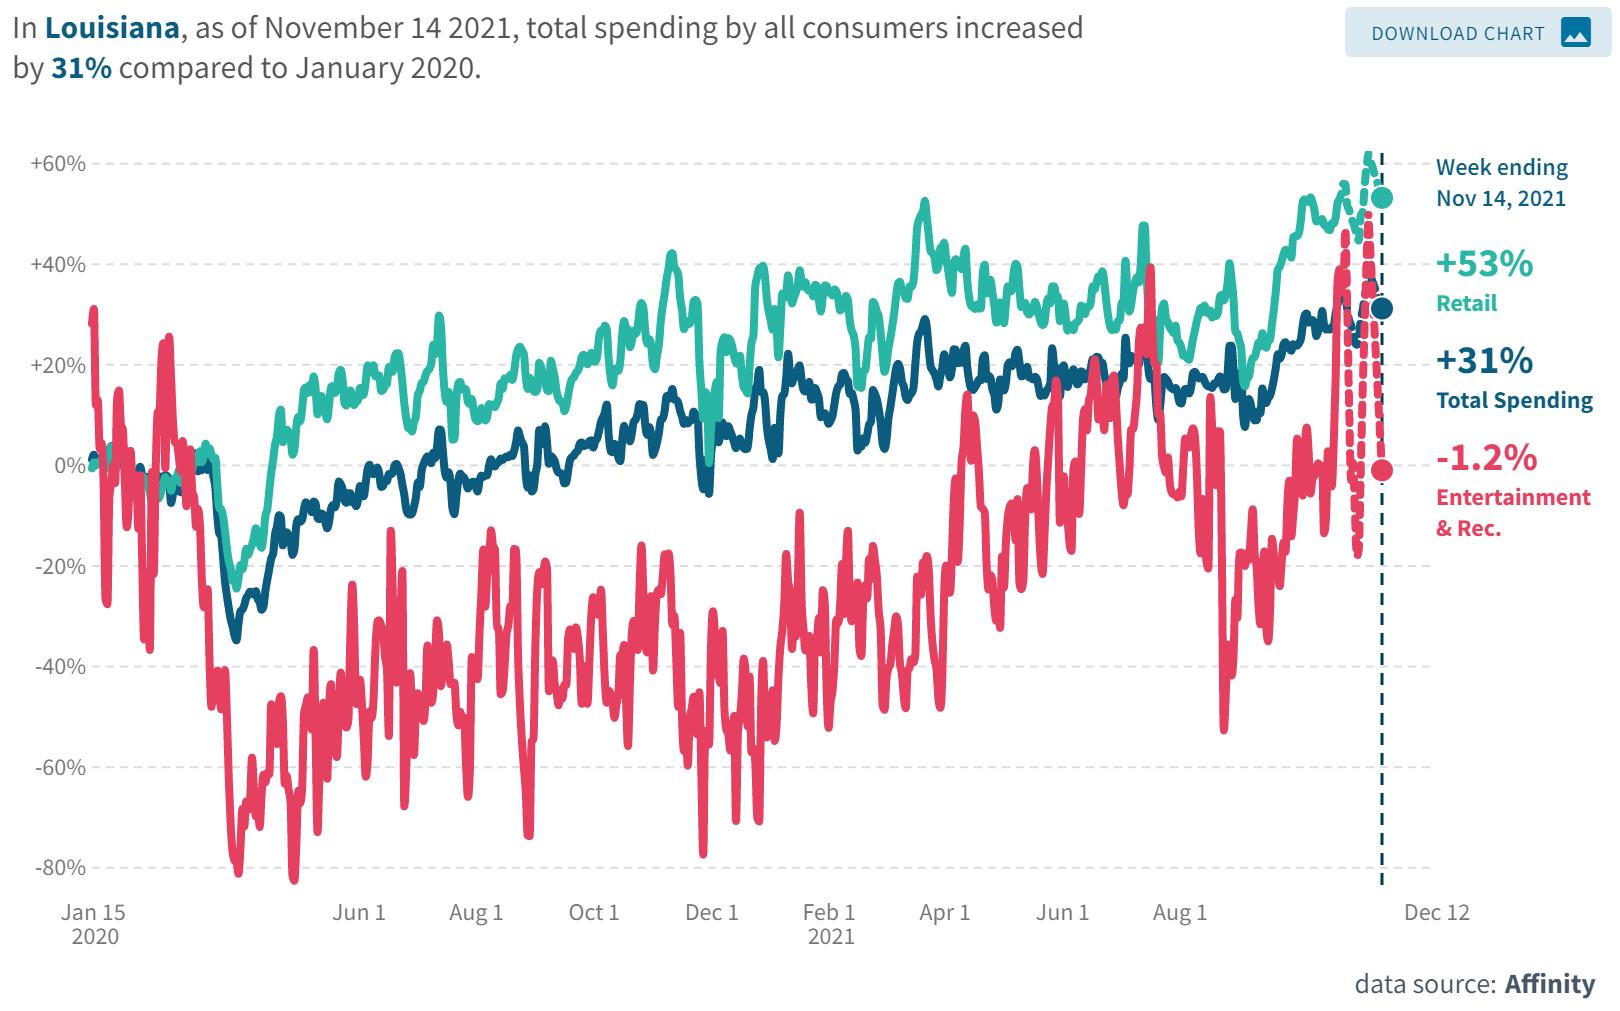
This graph represents the percent change in average consumer credit and debit card spending in Louisiana as of November 14, 2021 with January 2020 as the baseline.
Total consumer spending in Louisiana was 31% above the January 2020 baseline.
From mid-October to November, retail spending increased from 47% to 54% above the baseline. Restaurant spending increased from 21% to 26%, grocery spending increased from 11% to 13%.
• Compared to the January 2020 baseline, total consumer spending on November 14, 2021 in Louisiana was up 31%, with entertainment spending turning negative in mid-November at -1%. Healthcare spending in November rose to 24% from 12% a month earlier.
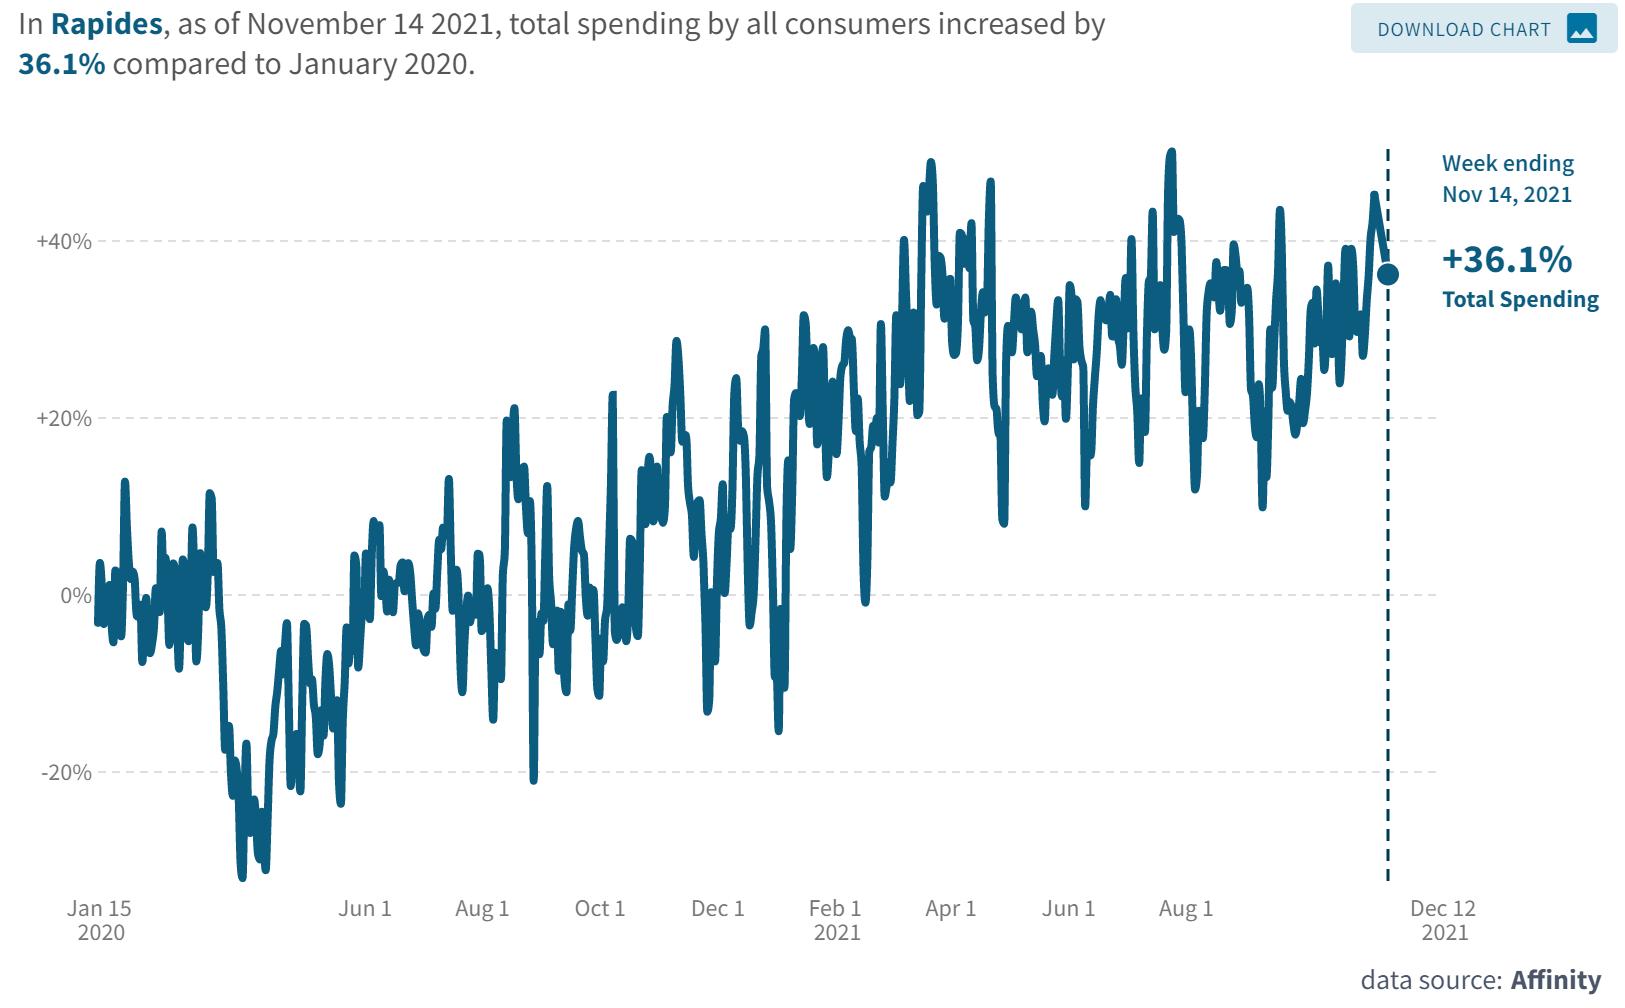
The table and chart represents the percent change in average consumer credit and debit card spending in Cenla as of November 14, 2021 with January 2020 as the baseline, while the chart represents Rapides.
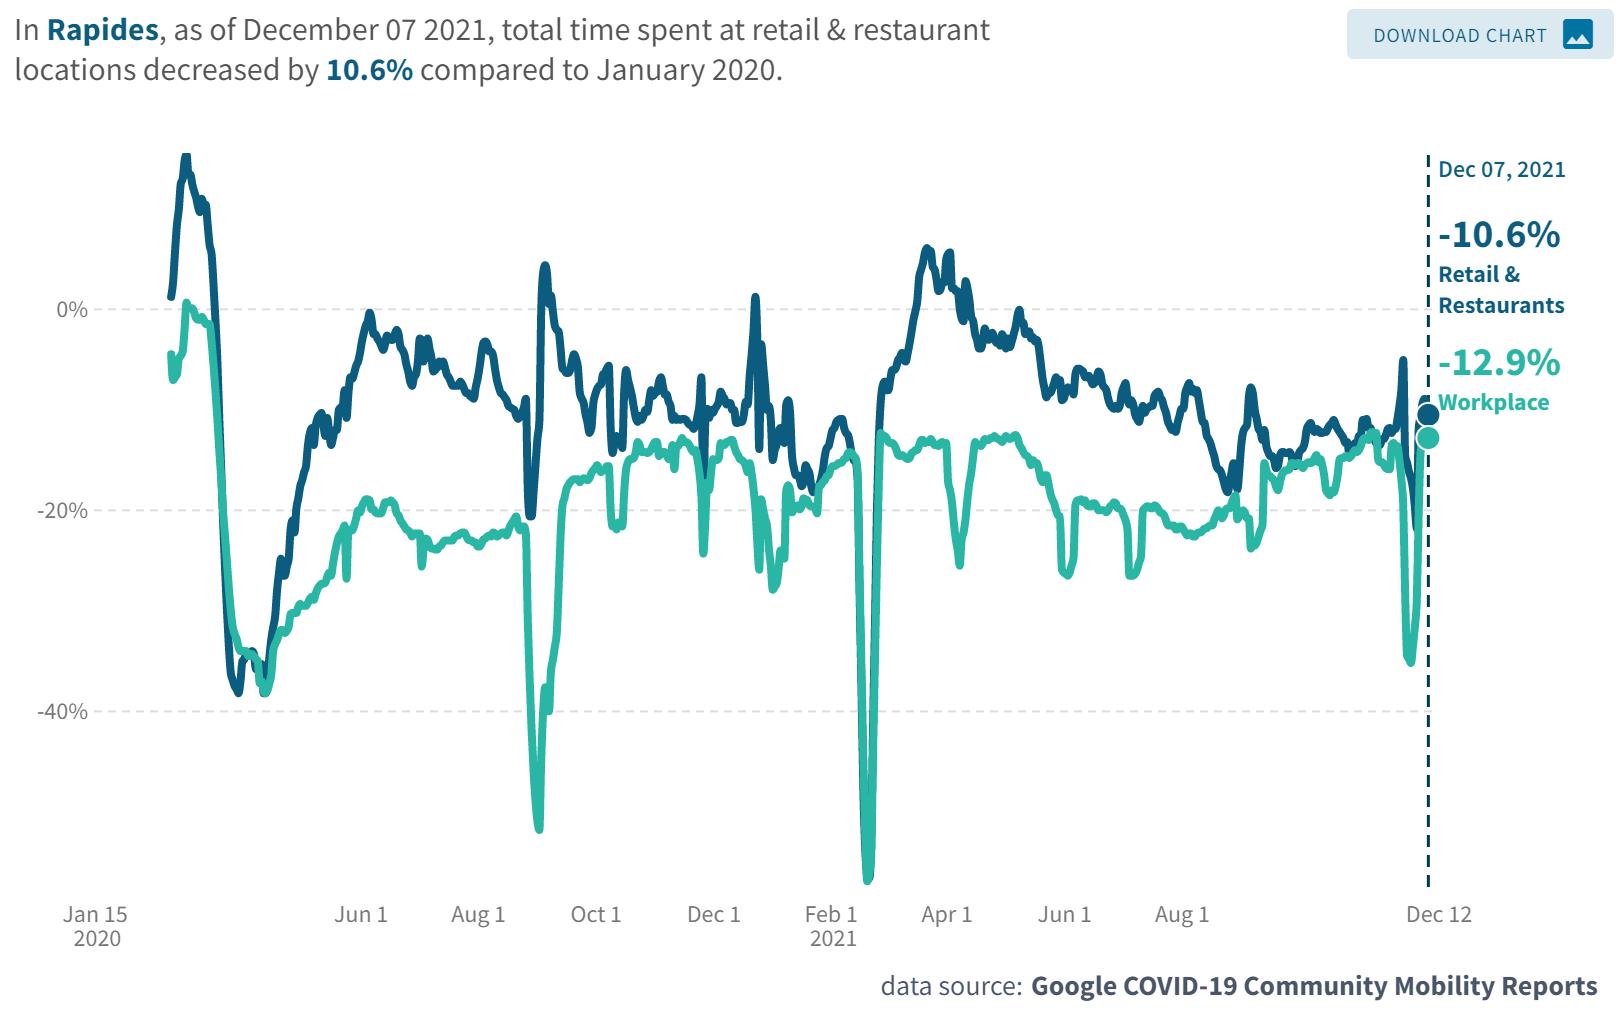
The chart represents the percent of time employees in Cenla and statewide spent at work as of December 7, 2021 with January 2020 as the baseline.
The Coincident Economic Activity Index for Louisiana is set to match the trend in the gross state product and includes four indicators: nonfarm payroll employment, the unemployment rate, average hours worked in manufacturing and wages and salaries. The column graph below represents the percentage change in the index. A positive percentage represents an expanding statewide economy.
✓The Index for October 2021 increased 1.06% from September, the largest increase since November 2020, and reached the highest level since the pandemic’s start.
✓Preliminary data for September showed the first decrease in the index since May 2020. However, that figure has been revised upward to 0.31%.
Represents the number of drilling rigs actively exploring for or developing oil or natural gas in Louisiana and the U.S. in 2021


11 11 13
38 47 49 TOTAL US 311
560 ✓Rig count in Louisiana increased by 2 rigs or 4% in November from October. regaining all of the decline from Hurricane Ida.
✓Nationwide, the rig count is up 80% from a year ago.
Source: Baker Hughes, https://rigcount.bakerhughes.com/na-rig-count, December 12, 2021
Gaming revenue in Louisiana for October 2021 with previous month and year comparisons.
Data Source: Louisiana Gaming Control Board, December 12, 2021. http://lgcb.dps.louisiana.gov/revenue_reports.html
Monthly U.S. economic indicators for October 2021 with select (*) indicators for November.
* Indicates the current month is November and previous month is October.
Data Source: U.S. Census, https://www.census.gov/economic-indicators/ December 20, 2021.
The data presented throughout the CENLA Economic Dashboard reflects contributions from the following local organizations.
• Rapides Parish Policy Jury Treasurer
• Rapides Sales TaxAdministrator
• Avoyelles Parish School Board
• Alexandria International Airport
• RapidesArea Planning Commission
• City ofAlexandria Planning Division
• Evangeline Parish Sales Tax Commissioner
• Concordia, Catahoula, & La Salle TaxAdministrator
• Louisiana Office of Public Health, Region 6
• St. Landry Parish School Board
• Grant Parish Sheriff’s Office
Also, special thanks to the following partners for distributing the dashboard.
Next Issue: Week of Jan. 17th
• LSUAFoundation
• Central Louisiana Regional Chamber of Commerce
• Marksville Chamber of Commerce
• Bunkie Chamber of Commerce
• Evangeline Chamber of Commerce
• Concordia Chamber of Commerce
• St. Landry Chamber of Commerce
• Greater Vernon Chamber of Commerce
Current and past issues of the CENLAEconomic Dashboard can be found at http://www.lsua.edu/coronavirus/cenla-economic-dashboard/