CENLA ECONOMIC DASHBOARD
November 19, 2021.
Dr.RandallDupont Dean,CollegeofBusinessLouisianaStateUniversityofAlexandria
rdupont@lsua.edu


November 19, 2021.
Dr.RandallDupont Dean,CollegeofBusinessLouisianaStateUniversityofAlexandria
rdupont@lsua.edu
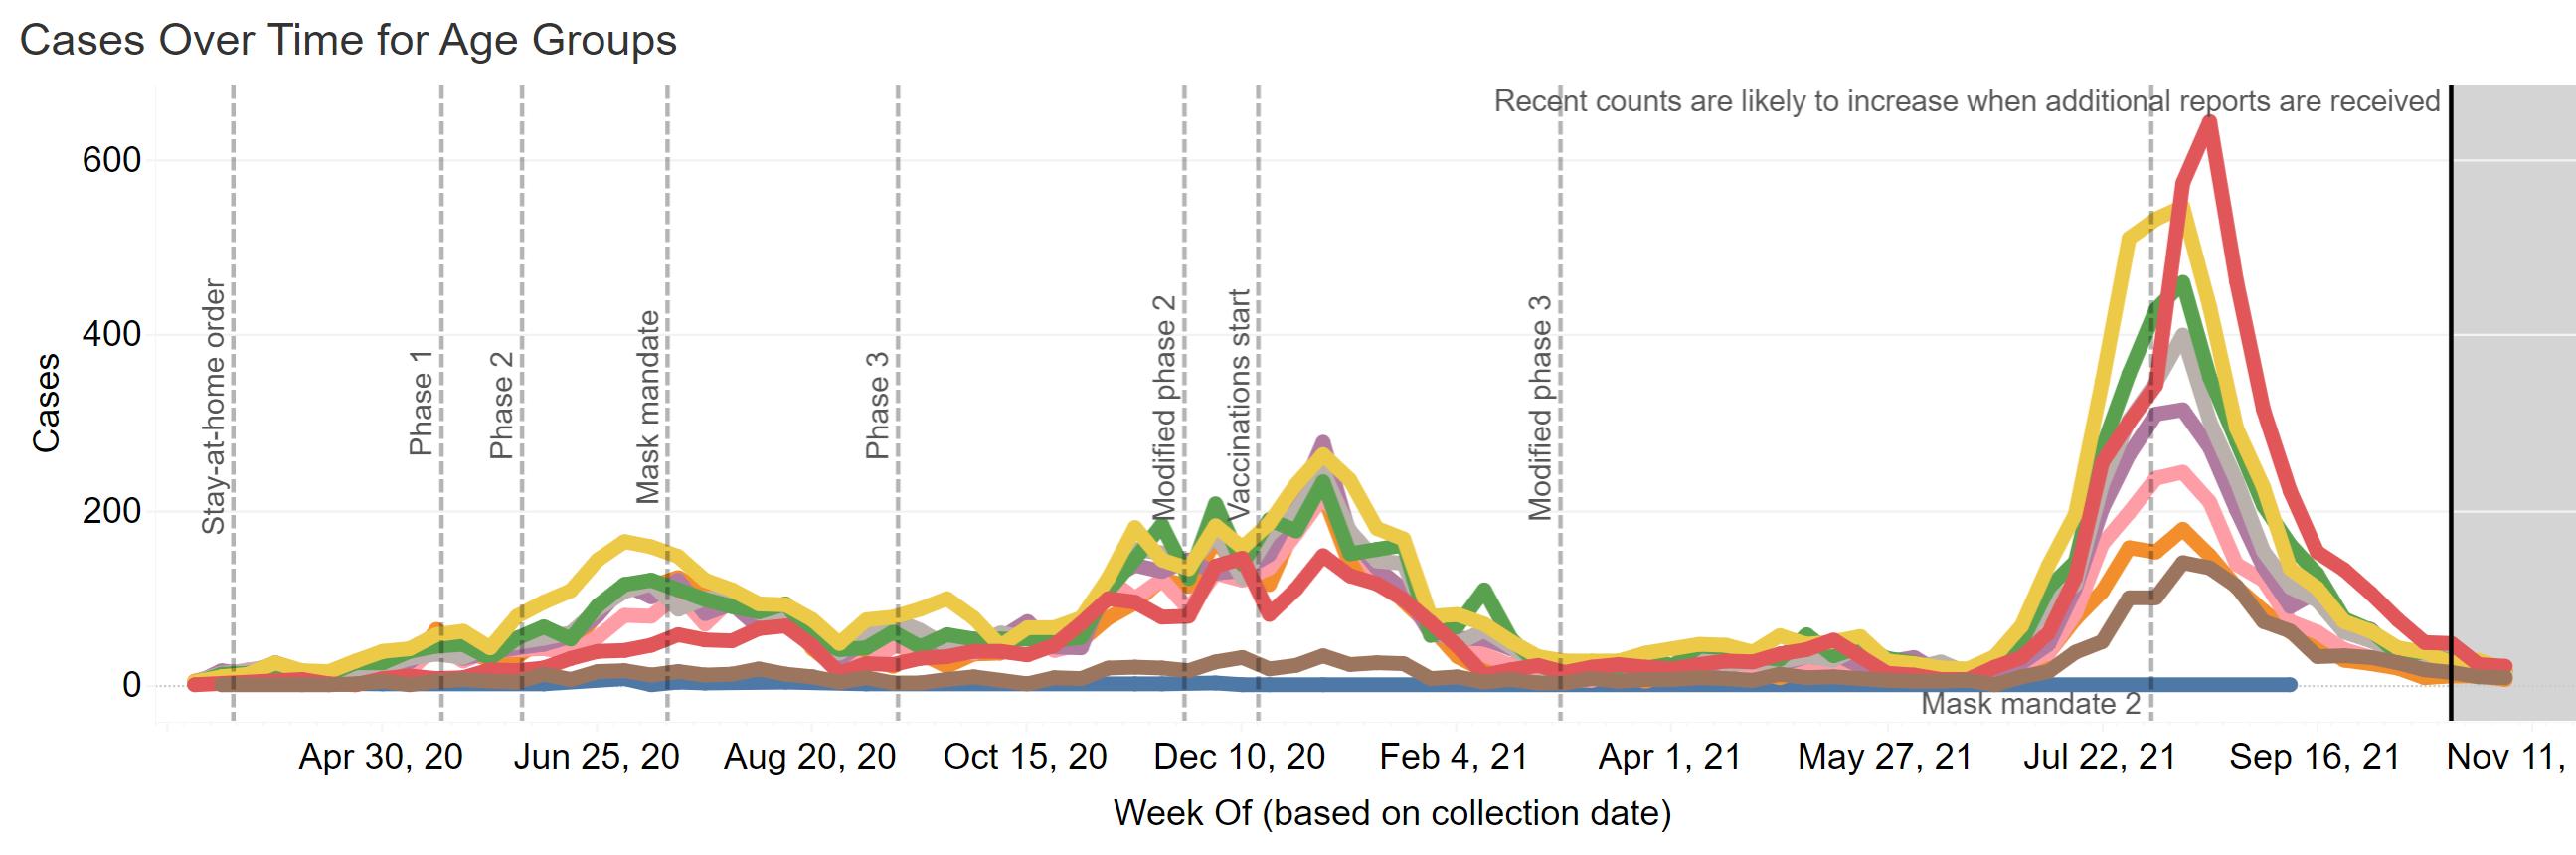
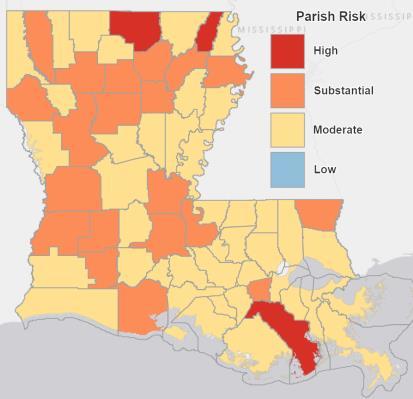
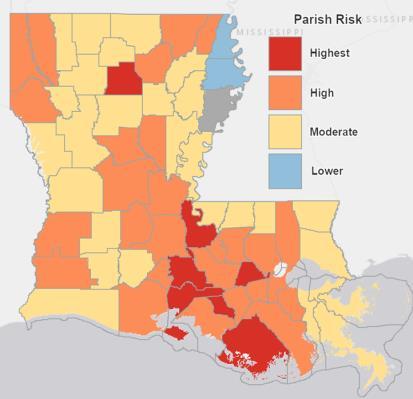
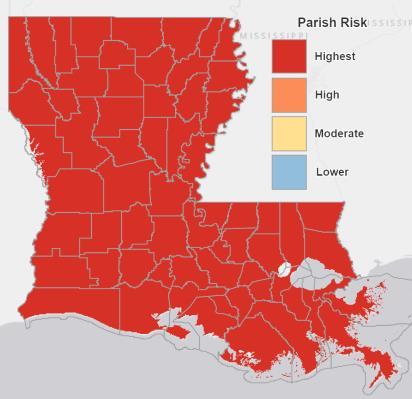
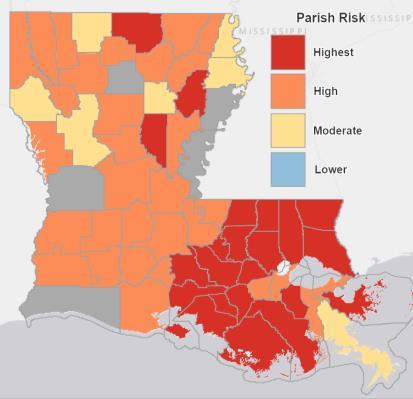
Region 6 (central Louisiana) has moved from second lowest vaccinated region in the state to the third lowest with 39.7% of the population fully vaccinated as of mid-November, up from 38% in mid-September. Rapides andAvoyelles have the highest percentage of completed vaccinations in Region 6 at 44.6% and 43.0%, respectively. The number of cases continues to decline, nearing the levels from Spring and early Summer. Young adults led the 4th wave of the pandemic with 5-17 year olds reporting the highest number of cases. However, all age groups have fallen equally. All parishes in Cenla are at a moderate risk level, except forAvoyelles, Natchitoches, St. Landry, and Vernon which are rated at substantial risk. Hospitalizations for Covid in Region 6 continue to decline and are at pre-4th wave levels.
The Louisiana Workforce Commission’s Louisiana Occupational Information System database been down in recent weeks. Therefore, the usual employment and unemployment data is not available except for unemployment insurance claims. Instead, education attainment inAlexandria and statewide are presented.
High school graduates inAlexandria earned $33,122 in 2019 compared to $50,899 for 4-year college graduates, a 54% advantage for the latter group. Only 17.5% of the population in theAlexandria MSA has a four-year degree or higher, making it the second lowest percentage of college graduates among the state’s metro areas. The statewide average weekly initial unemployment claims filed in October fell to 2,845 from 8,714 in September, a -67% decrease, while the average weekly continued unemployment claims in fell to 31,908 from 39,327 in September, a -19% decrease.

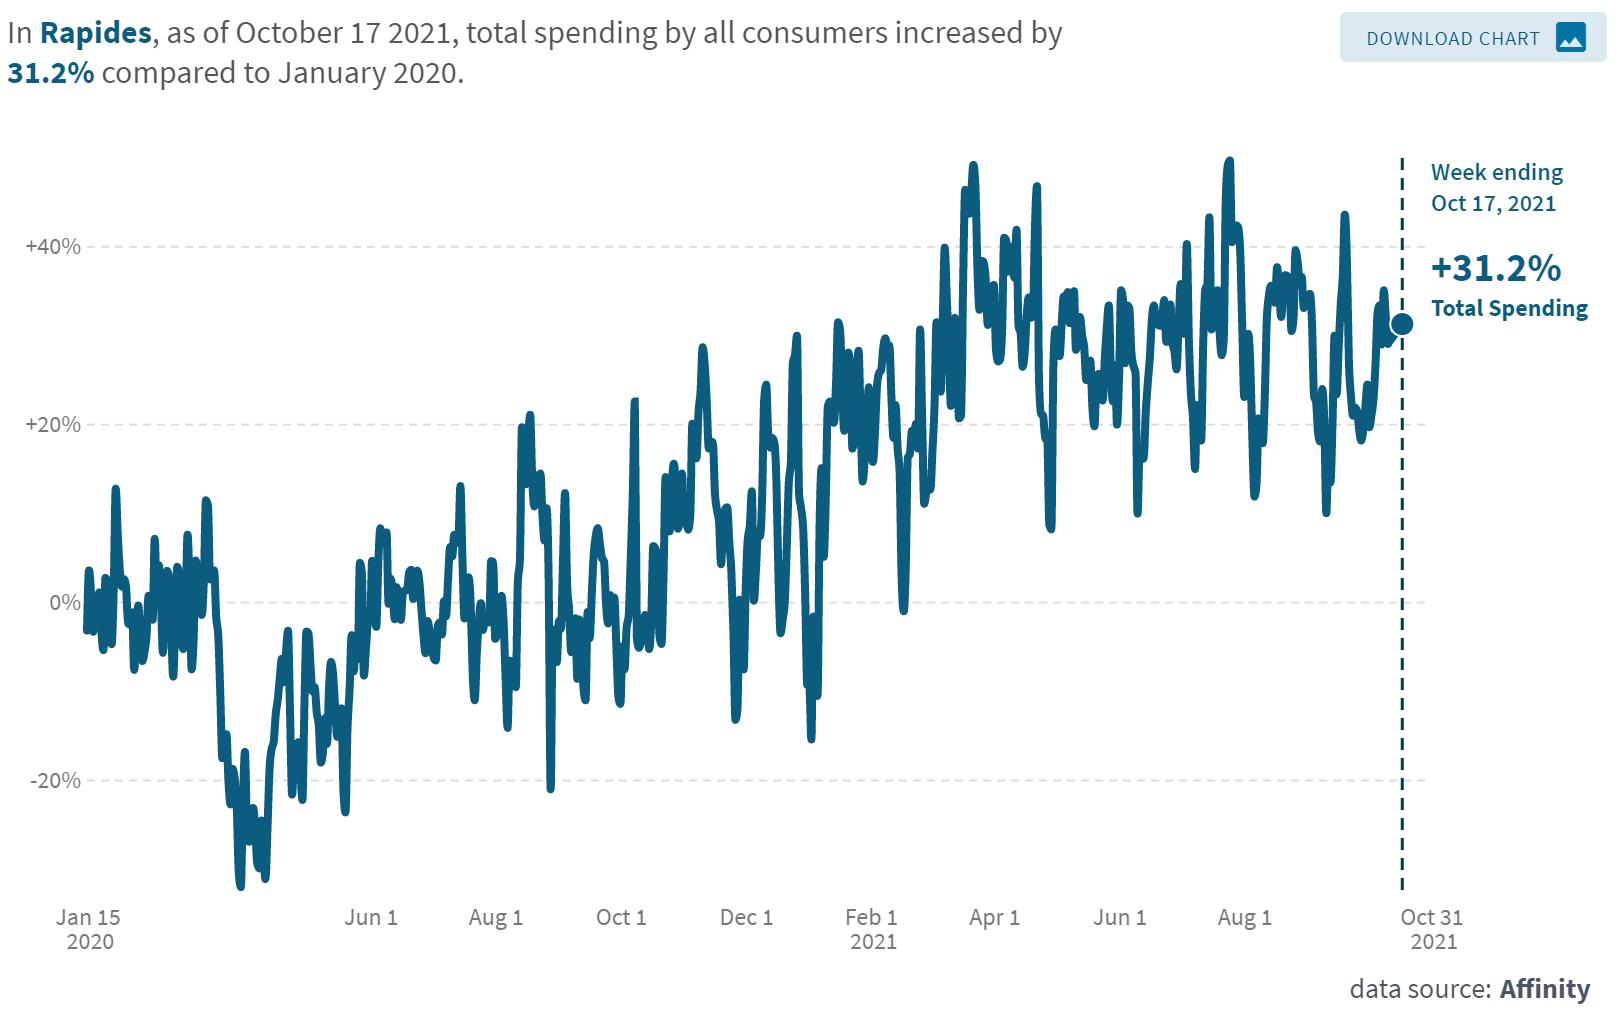
Changes in consumer spending are measured by changes in sales tax revenue. Sales taxes collected in October reflect activity in September. Spending in September was higher in 9 of the ten jurisdictions reporting and ranged from 4% in Avoyelles to 30% higher in Grant. Rapides experienced an 11% increase. Vehicle sales were up 110% in Avoyelles, and 10% and 8% in Evangeline and Rapides, respectively. Year-to-date comparisons of consumer spending and vehicle sales remain very positive across all categories. Since the first of the year, $13.6 million in sales tax revenue have been collected from online sales in central Louisiana with Rapides collecting the most at $4.1 million, followed by St. Landry at $2.6 million, and Vernon at $1.6 million. Grant has collected $508,000 since January and $698,000 since remote sales tax collection started in July 2020. Consumer spending in Rapides in mid-October was 31% above January 2020 compared to 27% for the state, according to Opportunity Insights.
The adverse impact on travel from the 4th wave is disappearing. Nationwide, air passenger throughput is up 12% in October over September. Passenger throughput at AEX was 80% of the 2019 level compared to 66% for the state.
Dining reservations are in a new uptrend since September 1, according to OpenTable. Hotel occupancy in September was up 24% in Avoyelles and 34% in Rapides overAugust. Year-to-date, occupancy is up 23% inAvoyelles and 28% in Rapides. Likewise, year-to-date gasoline sales in Louisiana are up 5% for the year throughAugust.
Because of the volatility of monthly data, year-to-date permit data presents a clearer picture of local construction. Commercial permits inAlexandria are up 44% for the year while the value of residential permits are up 58%. Residential permits in Alexandria were $2.9 in October, up 144% from the previous month. So far this year, permit valuations issued in Avoyelles are up 57%, Evangeline 160%, and Rapides 965% Permits in Pineville declined 13% in October from September and are down -41% so far this year. Residential construction permits in the RAPC jurisdiction are up 217% over October 2020.
The US Lumber Price Index in October increased for the first time in five months. The 5.5% increase in October still puts the index 10% below the January 2021 level. Nationwide residential sales increased 14% in September. Active listings in the Alexandria MSA were down -5% in October, with median days on the market increasing 31% from 51 to 67 days, while the average and median listing price increased 1% and 2%, respectively.
Through October, 85,563 of new business applications were filed in Louisiana compared to 70,927 in 2020 and 45,195 in 2019, representing increases of 21% over 2020 and 89% over 2019. The number of new businesses established in Rapides in October 2021 rose 46% from September and was 37% higher than October 2020. Year-to-date new businesses in Rapides are up 29% over 2020.
COVID-19 vaccinations as a percent of region population as of November 14, 2021.
✓Region 6 now has the third lowest vaccination rate in the state with 39.7% of the population vaccinated by mid- November, up from 38% in October, 35% in September, 30% inAugust and 27% in July.
✓Region 6 (Alexandria) moved ahead of Region 8 (Monroe) in percentage of total population vaccinated. ✓Region 1 (New Orleans) and Region 2 (Baton Rouge) have the highest rates of vaccination at 59% and 51%, respectively.
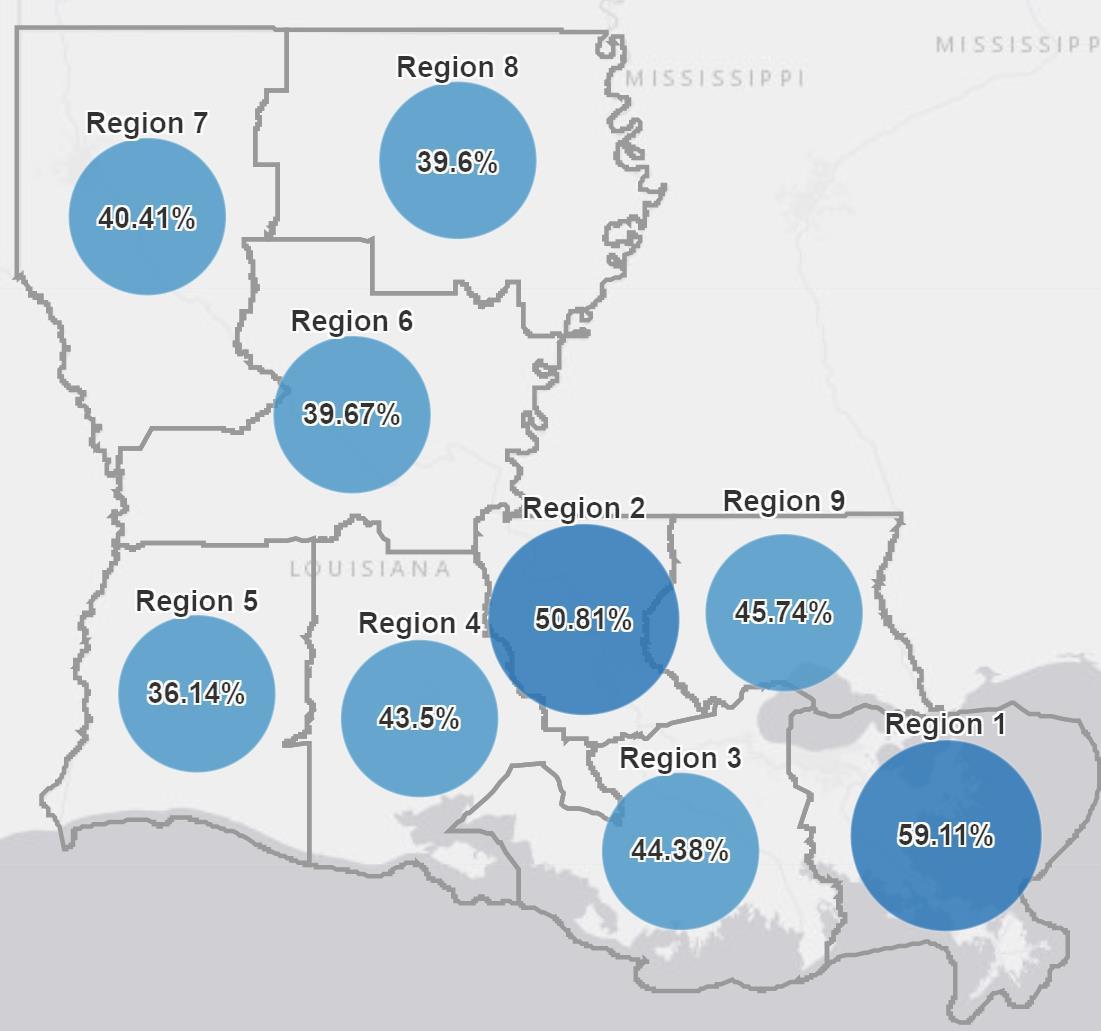
Source: Louisiana Office of Public Health, https://ldh.la.gov/covidvaccine, November 14, 2021
COVID-19 vaccinations as a percent of parish population as of November 14, 2021.
Rapides andAvoyelles have the highest percentage of completed vaccinations in Region 6 at 44.6% and 43.0%, up from 42.8% and 41.2% respectively.
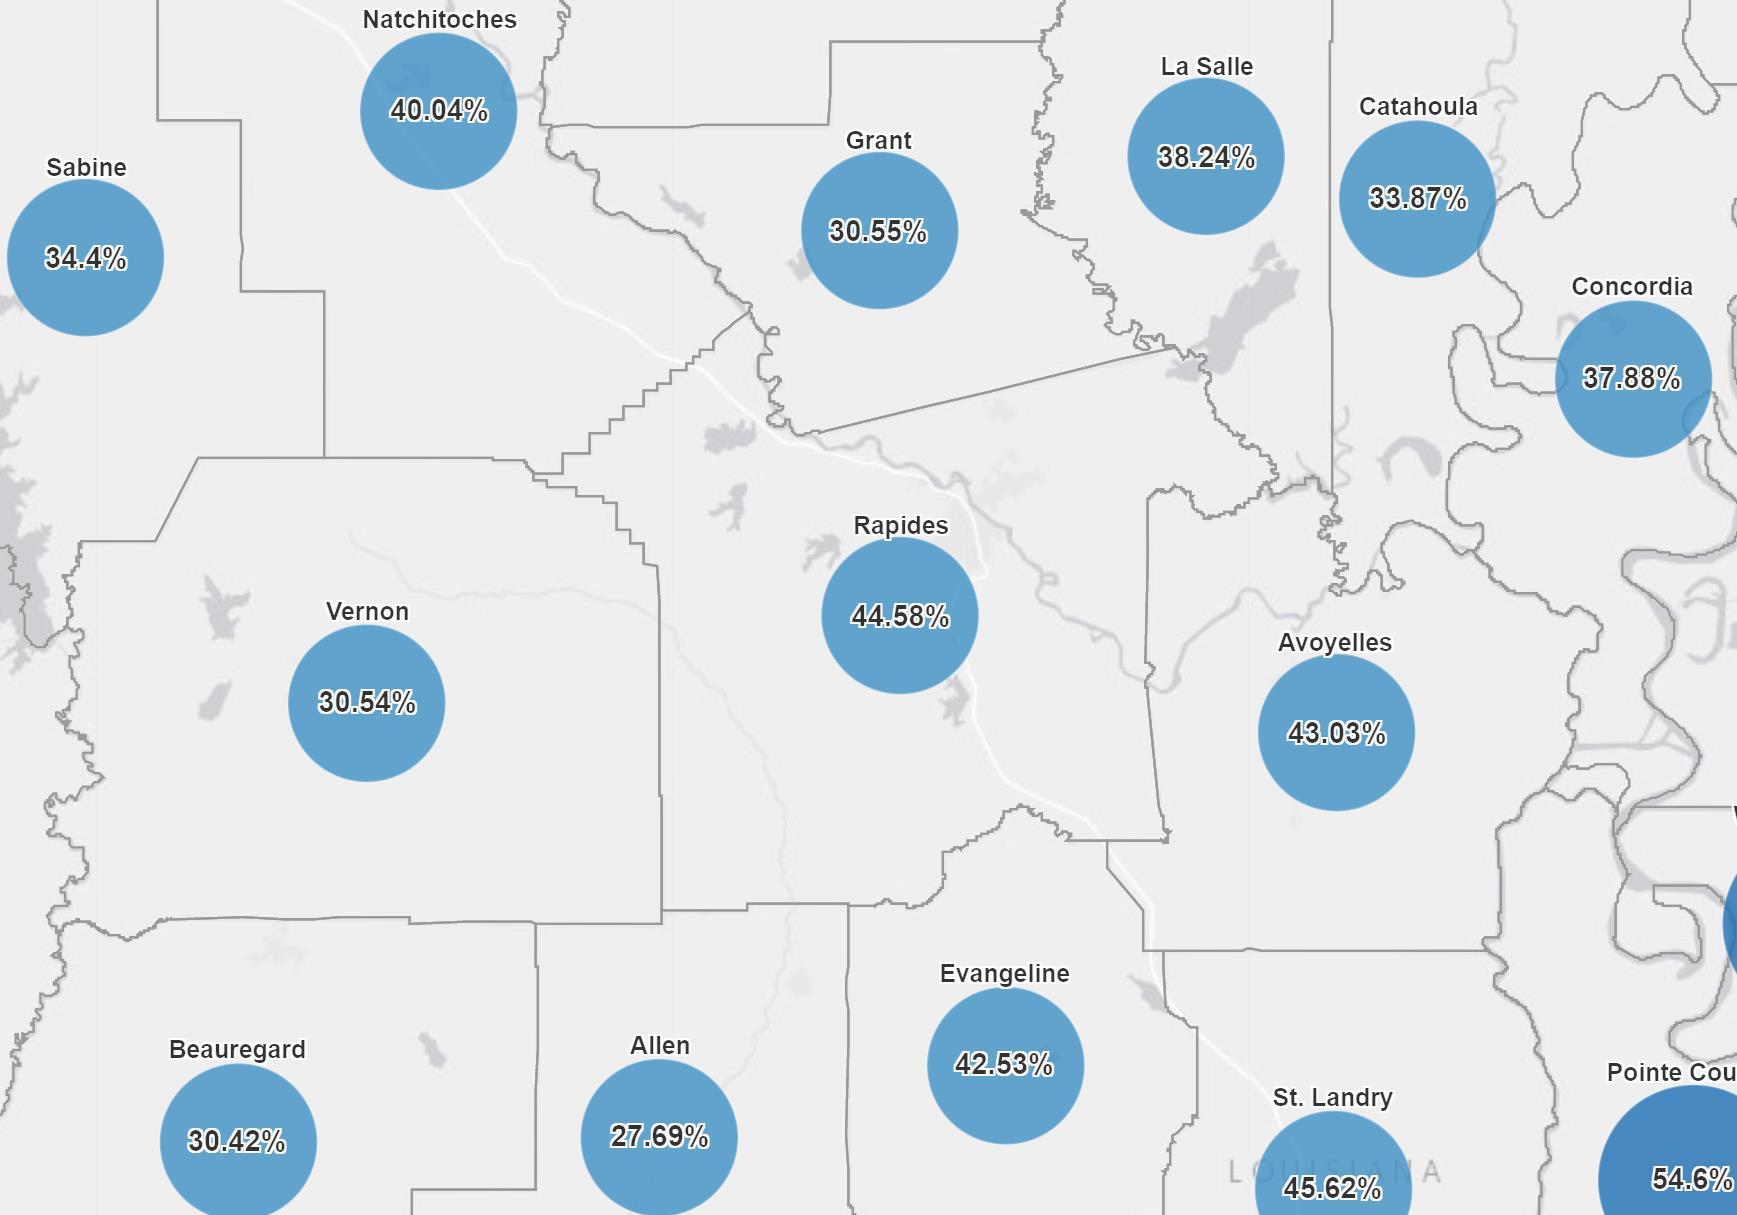
Source: Louisiana Office of Public Health, https://ldh.la.gov/covidvaccine, November 14, 2021
COVID-19 cases by collection date as of November 14, 2021 in Region 6 with a 7day moving average.
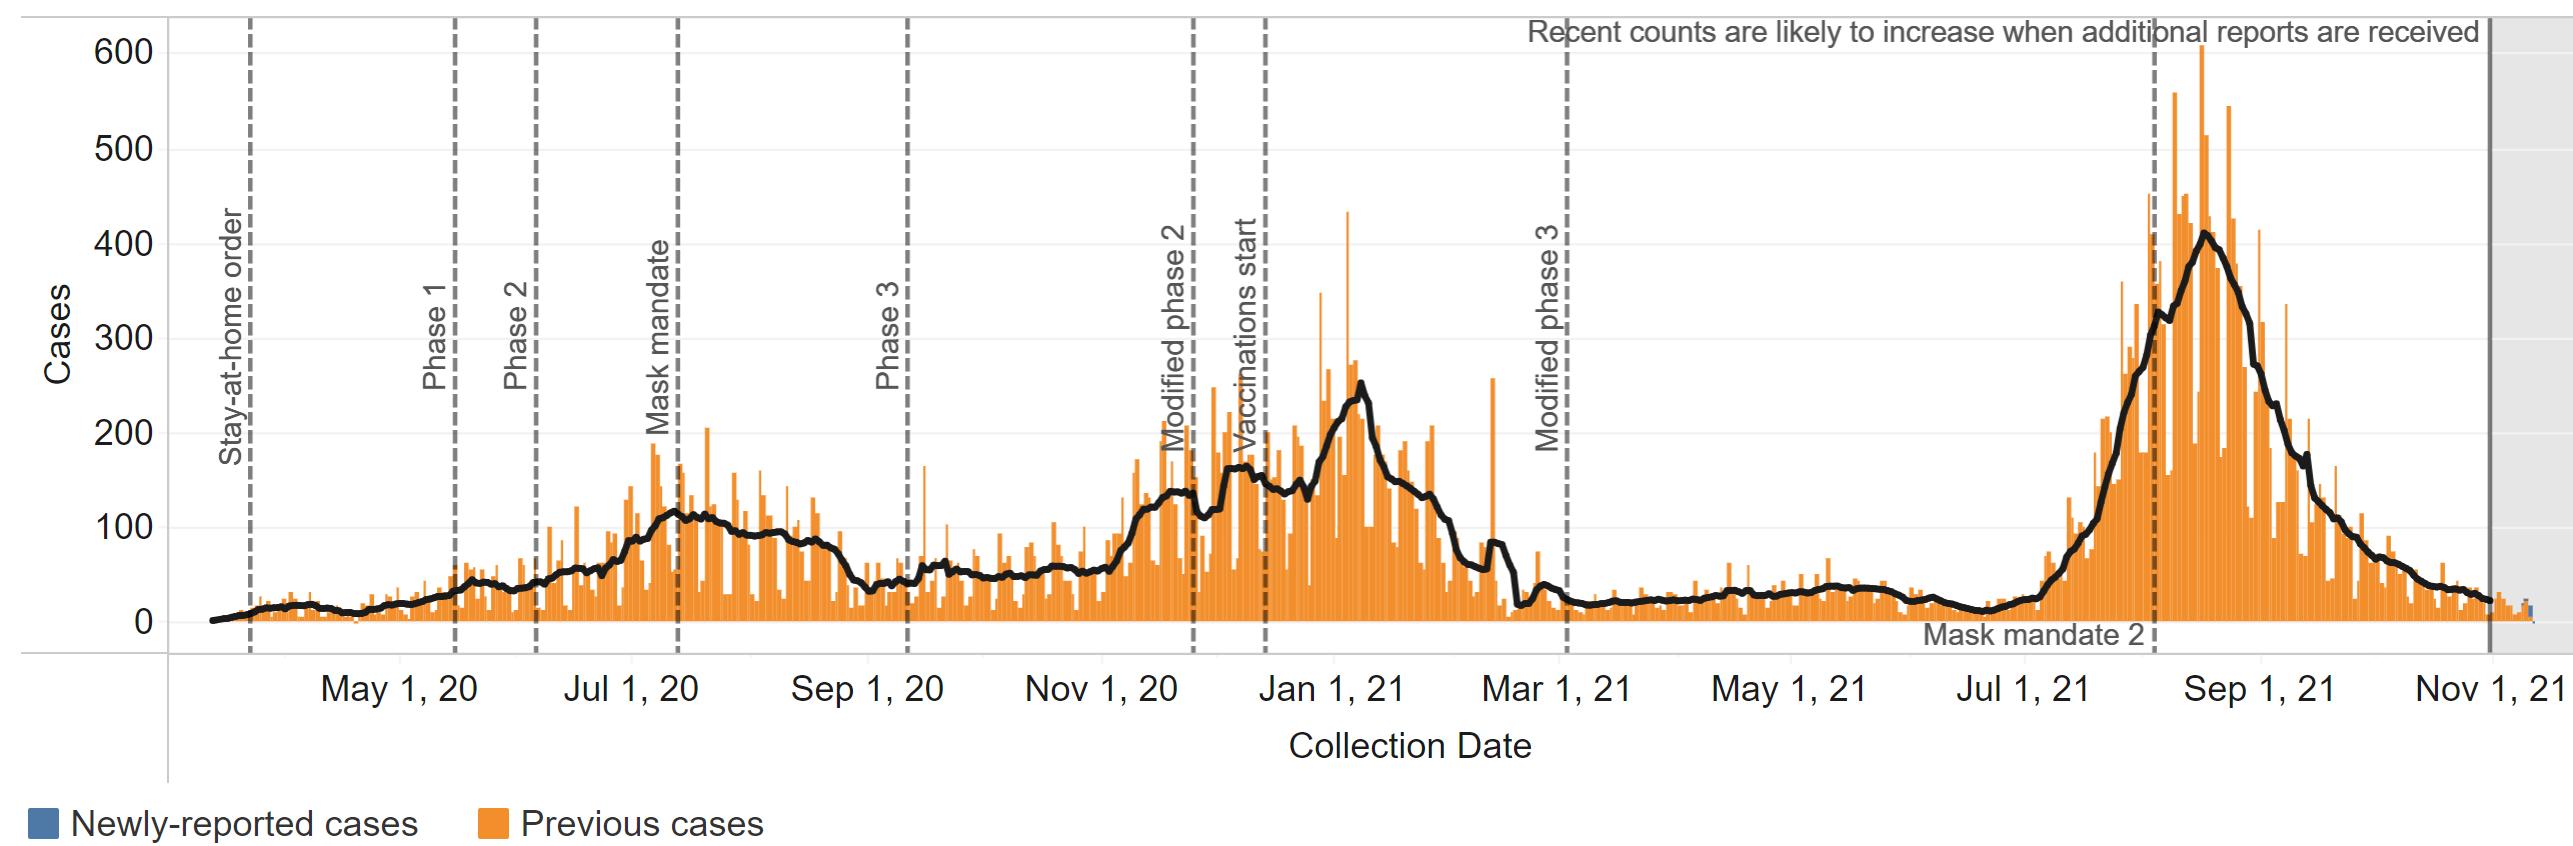
Source: Louisiana Office of Public Health, Region 6 (Central Louisiana), November 14, 2021.
Cases over time by age group in Region 6 through November 14, 2021.
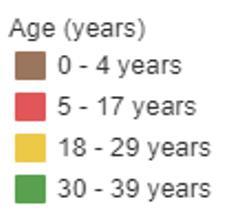
Source: Louisiana Office of Public Health, Region 6 (Central Louisiana), November 14, 2021.
COVID-19 percent positive and test volume in Region 6 as of November 14, 2021.
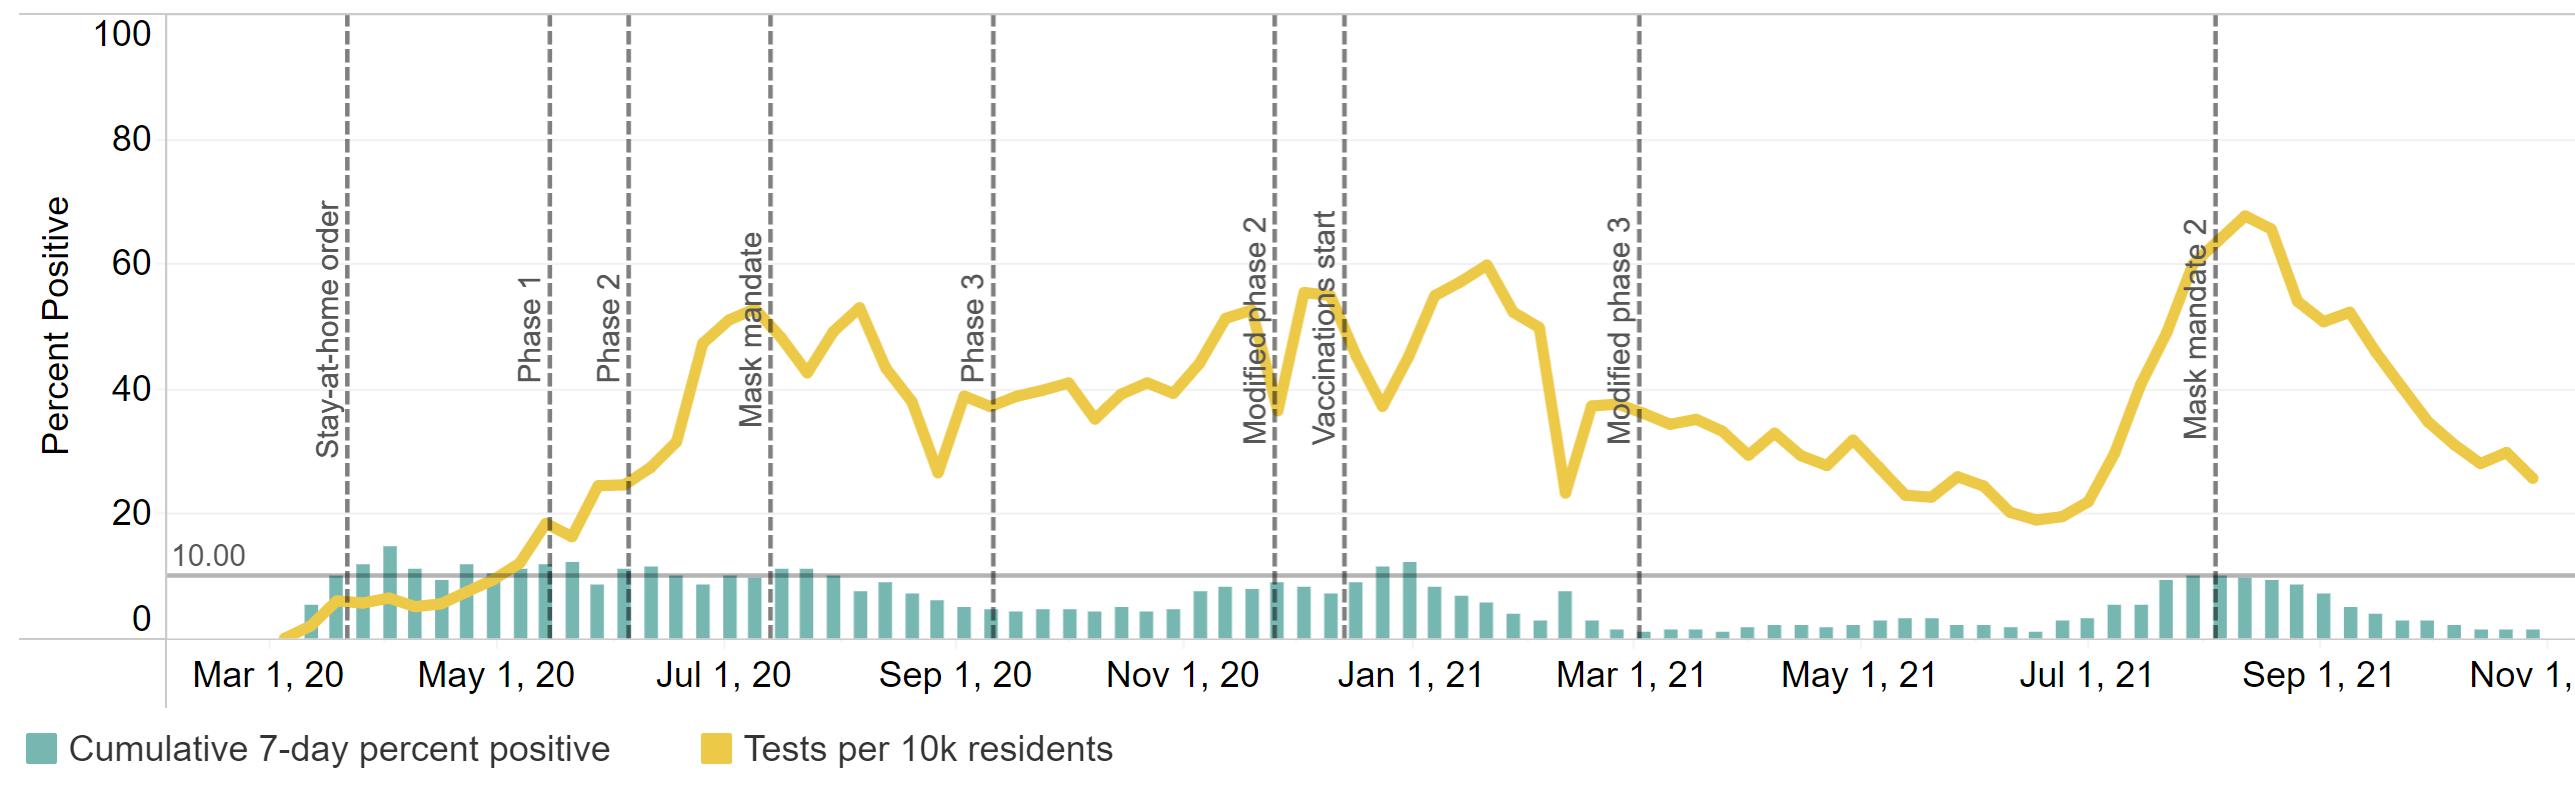
Source: Louisiana Office of Public Health, Region 6 (Central Louisiana), November 14, 2021..
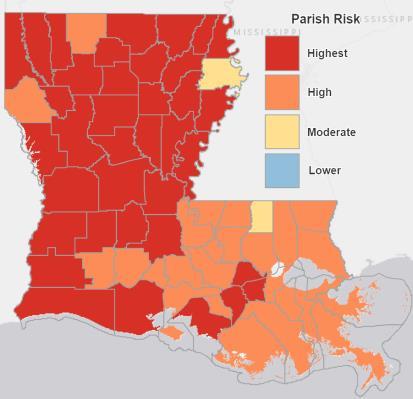
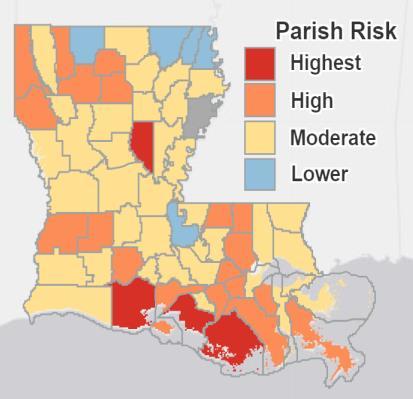
COVID-19 statewide risk by parish.
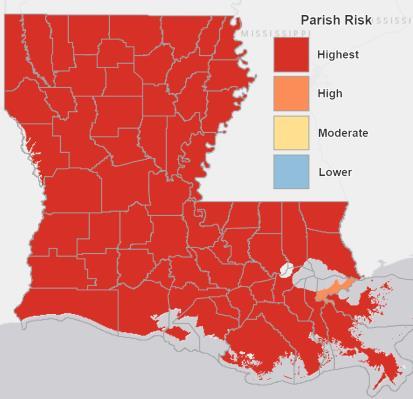
May 13, 2021
June 11, 2021
July 15, 2021
August 18, 2021
September 18, 2021
October 17, 2021
November 14, 2021
Source: Louisiana Office of Public Health, November 14, 2021.
Number of cases hospitalized (green line) and ventilated (yellow line) in Region 6 as of November 14, 2021.
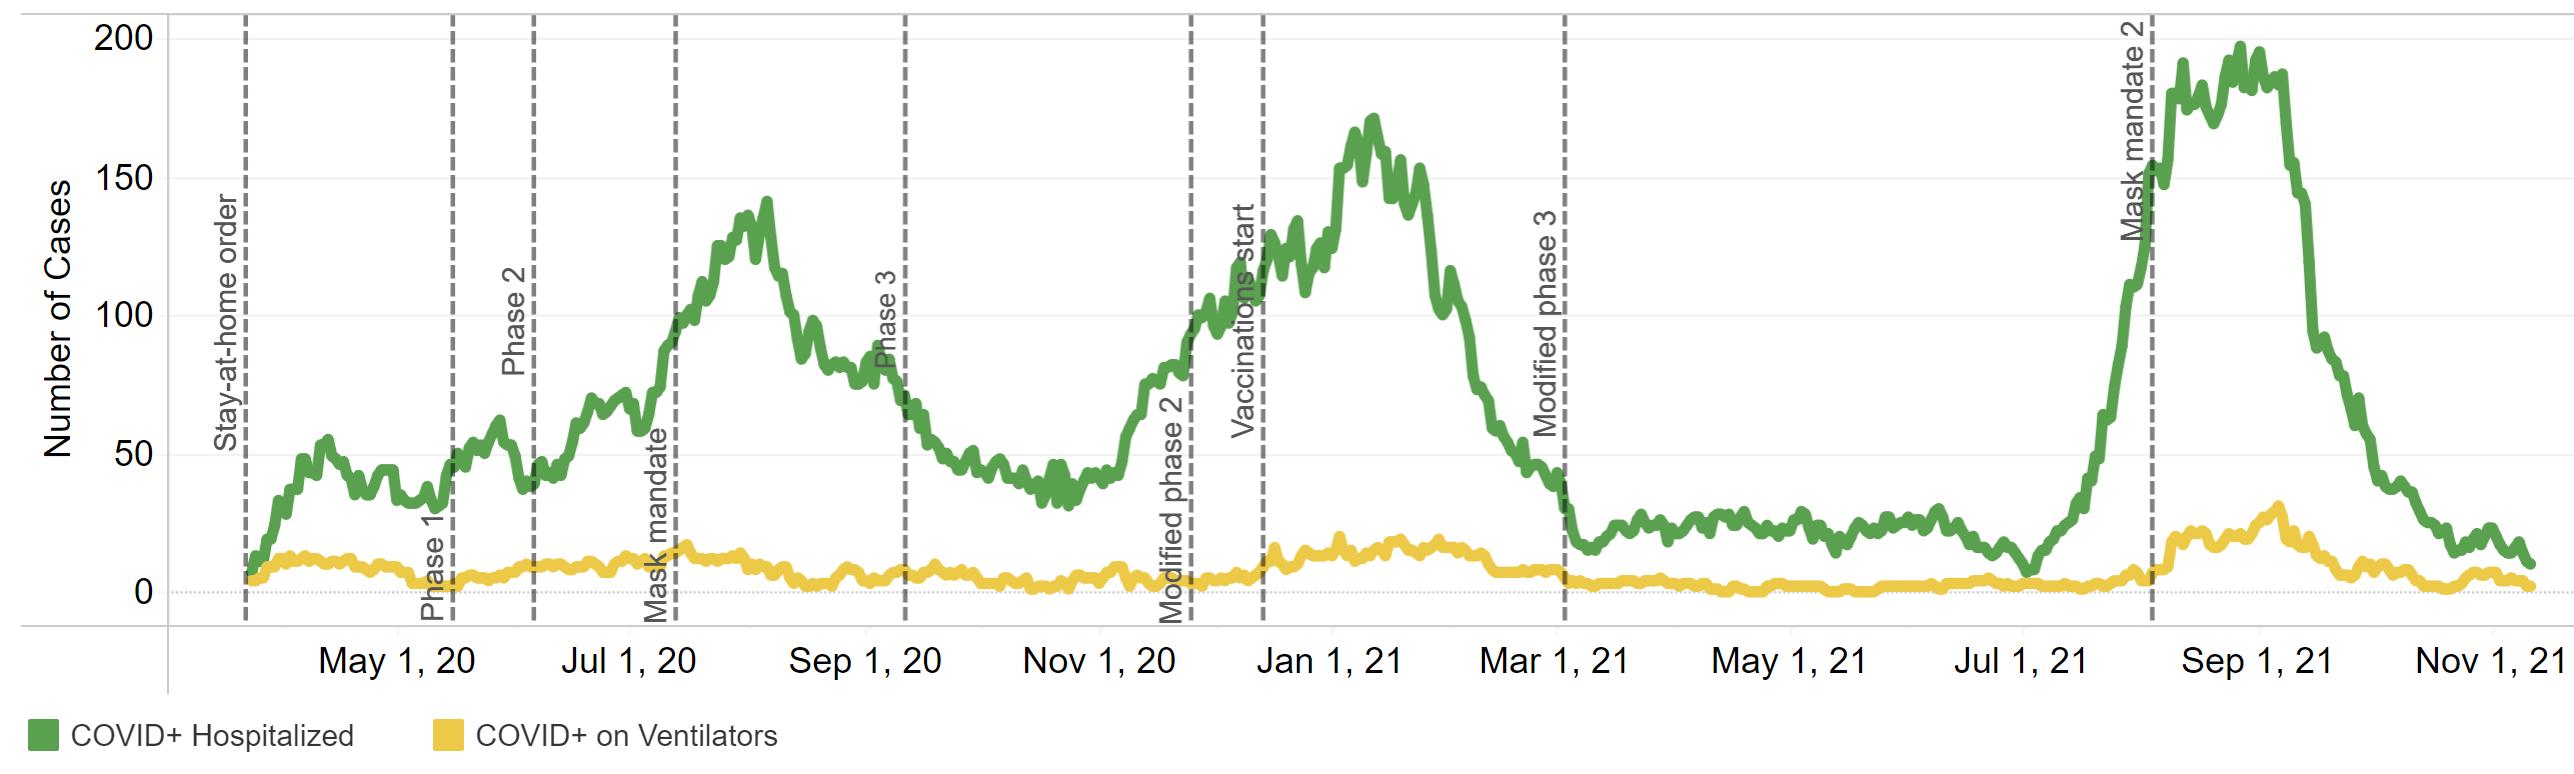
Source: Louisiana Office of Public Health, Region 6 (Central Louisiana), November 14, 2021.
COVID-19 deaths by date of death statewide as of November 14, 2021.
Source: Louisiana Office of Public Health, Region 6 (Central Louisiana), November 14, 2021.

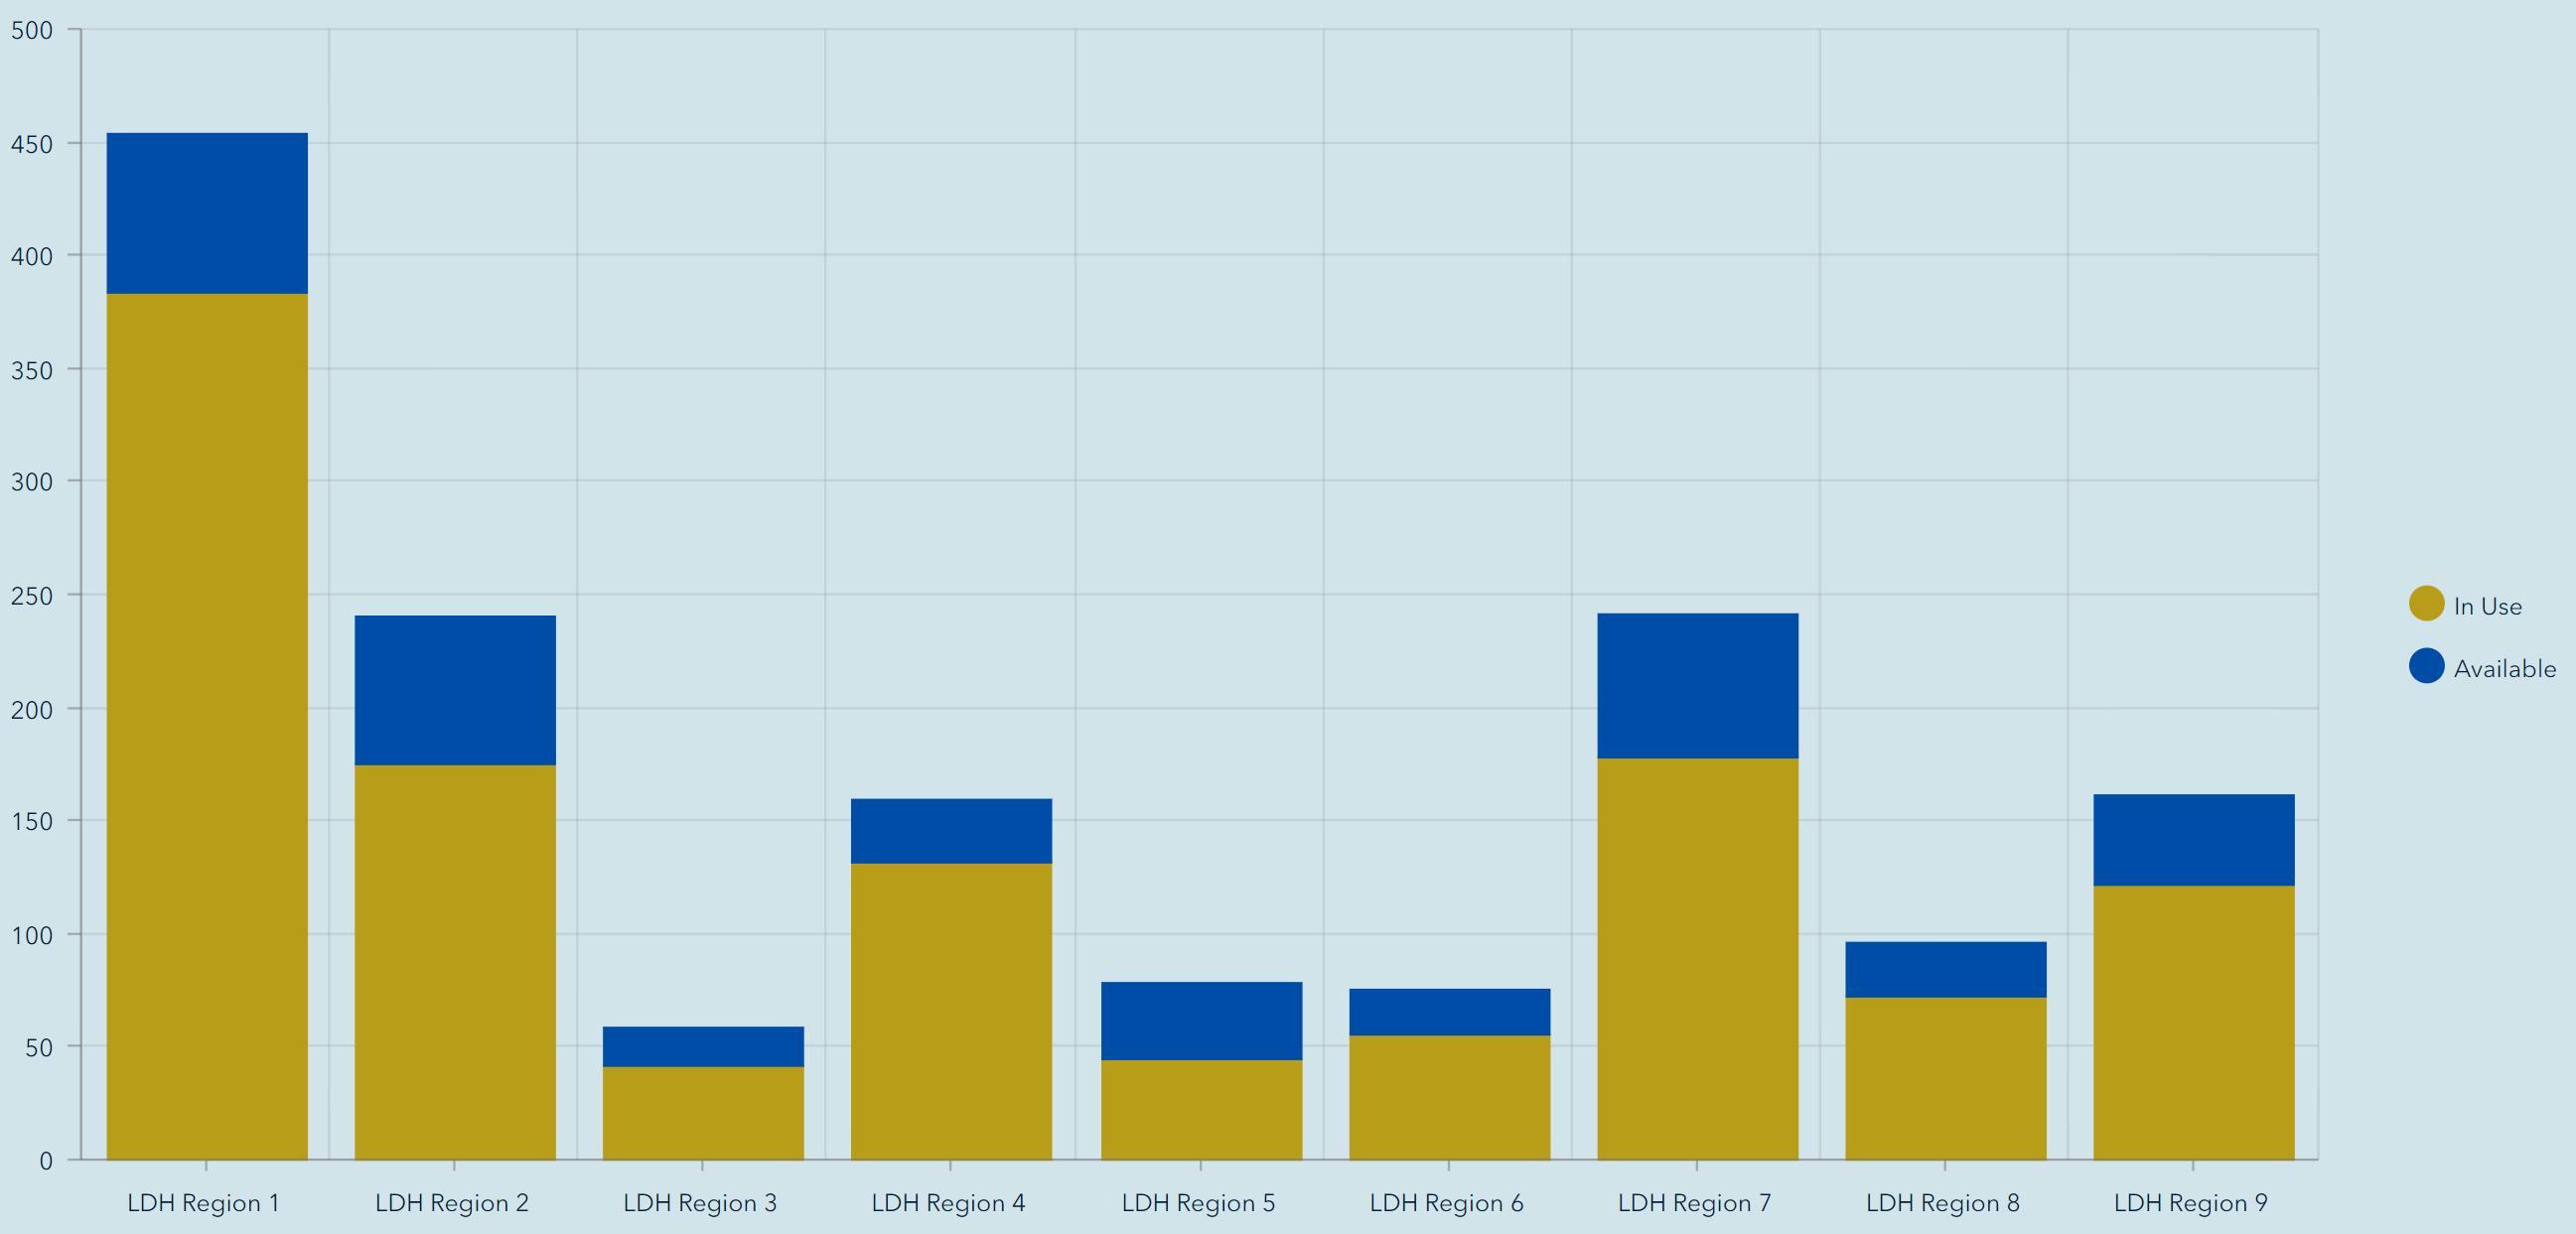
Available beds by Louisiana Department of Health region as of November 14, 2021.
Source: Louisiana Office of Public Health, Region 6 (Central Louisiana), November 14, 2021.
COVID-19 cases (left) and deaths (right) statewide by age group as of November 14, 2021.
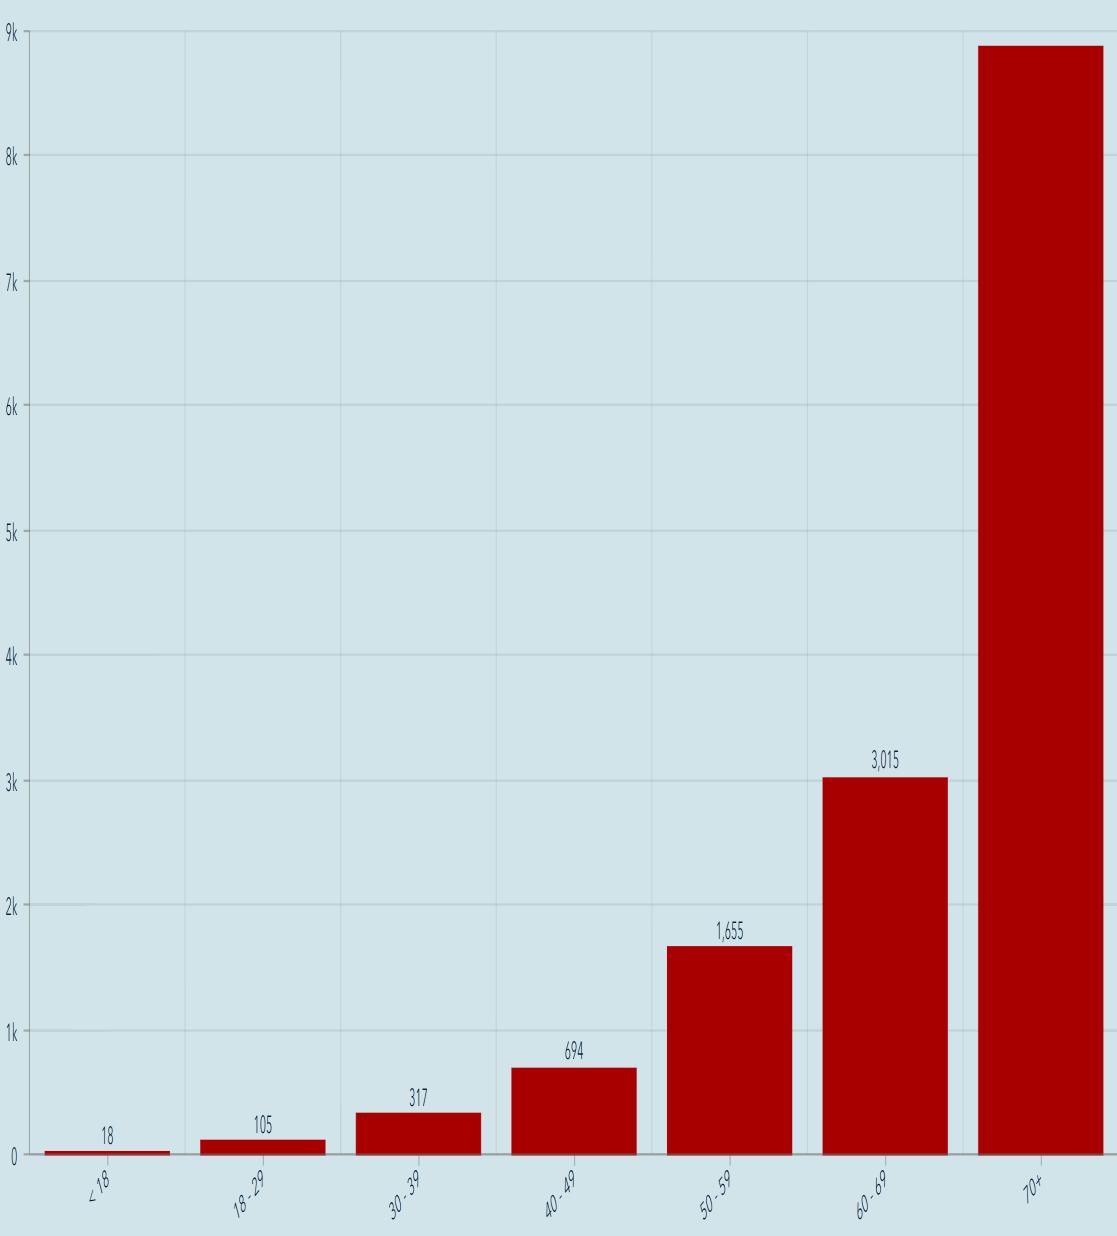
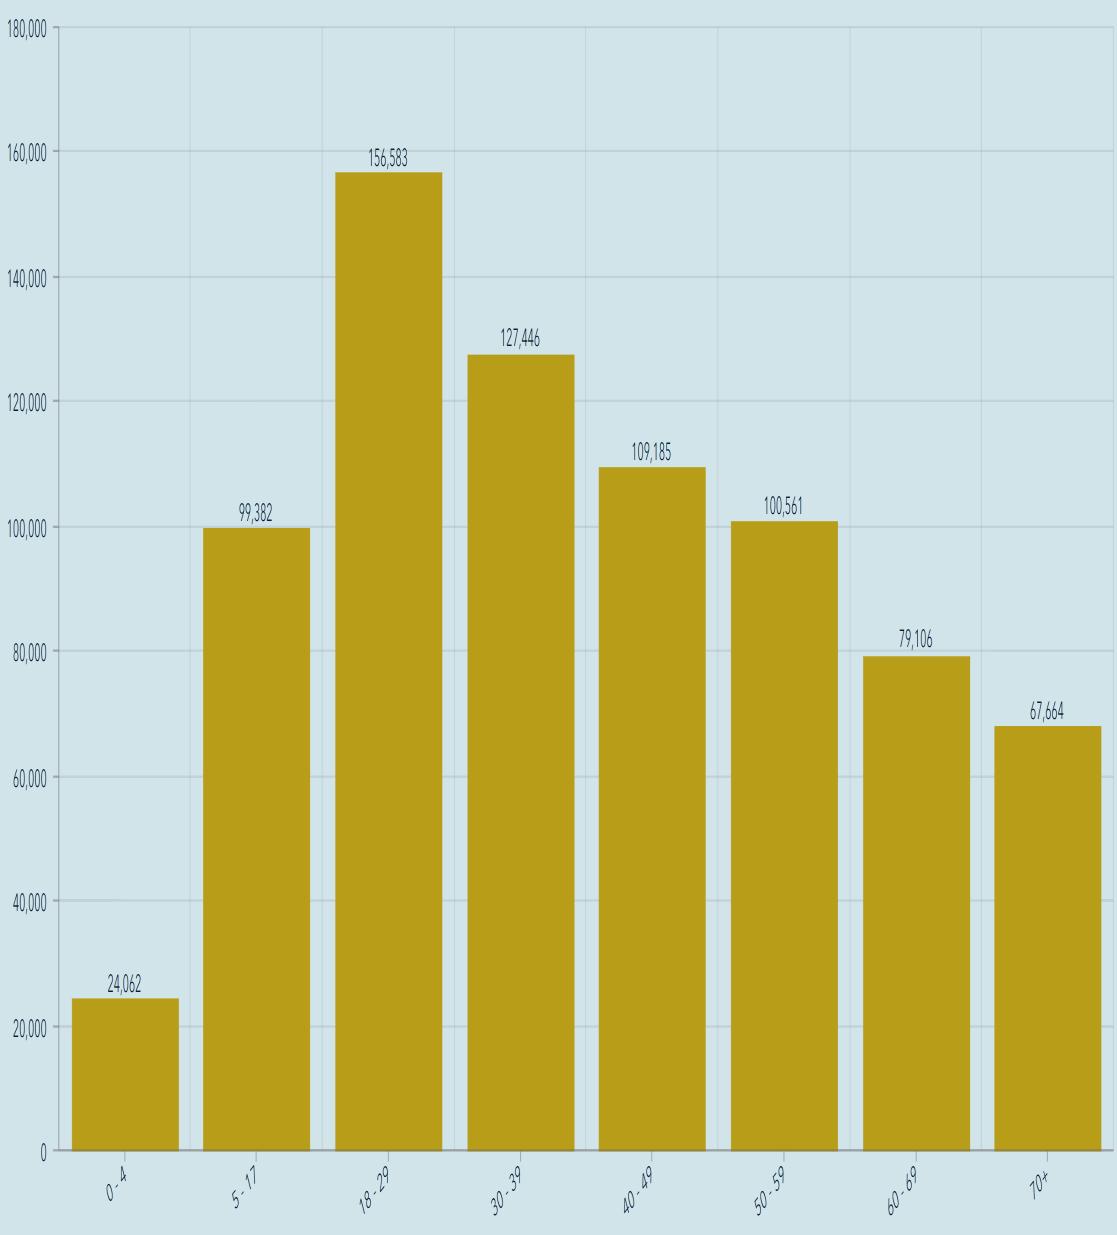
Source: Louisiana Office of Public Health, Region 6 (Central Louisiana), November 14, 2021.
LOIS (Louisiana Occupational Information System) is currently unavailable due to internal server errors. Therefore, the usual employment data presented here is not available this month.
The Louisiana Occupational Information System is Louisiana’s Virtual Labor Market Information Web Portal. LOIS is an interactive site that gives users access to the latest Louisiana labor force, wages, population, industry employment, training schools, training programs, long and short term projections, demographics, nonfarm employment, employer database, unemployment claimants, industry staffing patterns, licensed occupations, and other career products.
https://www2.laworks.net/LaborMarketInfo/LMI_MainMenu.asp
Data Source: Louisiana Workforce Commission, November 18, 2021
The table below shows the educational attainment and wages of individuals 25 years of age and older in the Alexandria MSA.
Average wages in the Alexandria MSAin 2019 was $35,560.
Four-year college graduates made 43% higher wages than the average wage for the MSAand 54% higher than high school graduates.
The table below shows the educational attainment of individuals 25 years of age and older by metropolitan statistical area.
Alexandria MSA ranks second lowest in the state in percentage of population with a 4year degree or higher.
Initial and continued unemployment claims in Louisiana from January to October 30, 2021.


Unemployment Claims in Louisiana
January 1 - October 30, 2021
✓Statewide average weekly initial unemployment claims filed in October fell to 2,845 from 8,714 in September, a -67% decrease.
✓Statewide average weekly continued unemployment claims in fell to 31,908 from 39,327 in September, a -19% decrease.
Source: Louisiana Workforce Commission, November 18, 2021
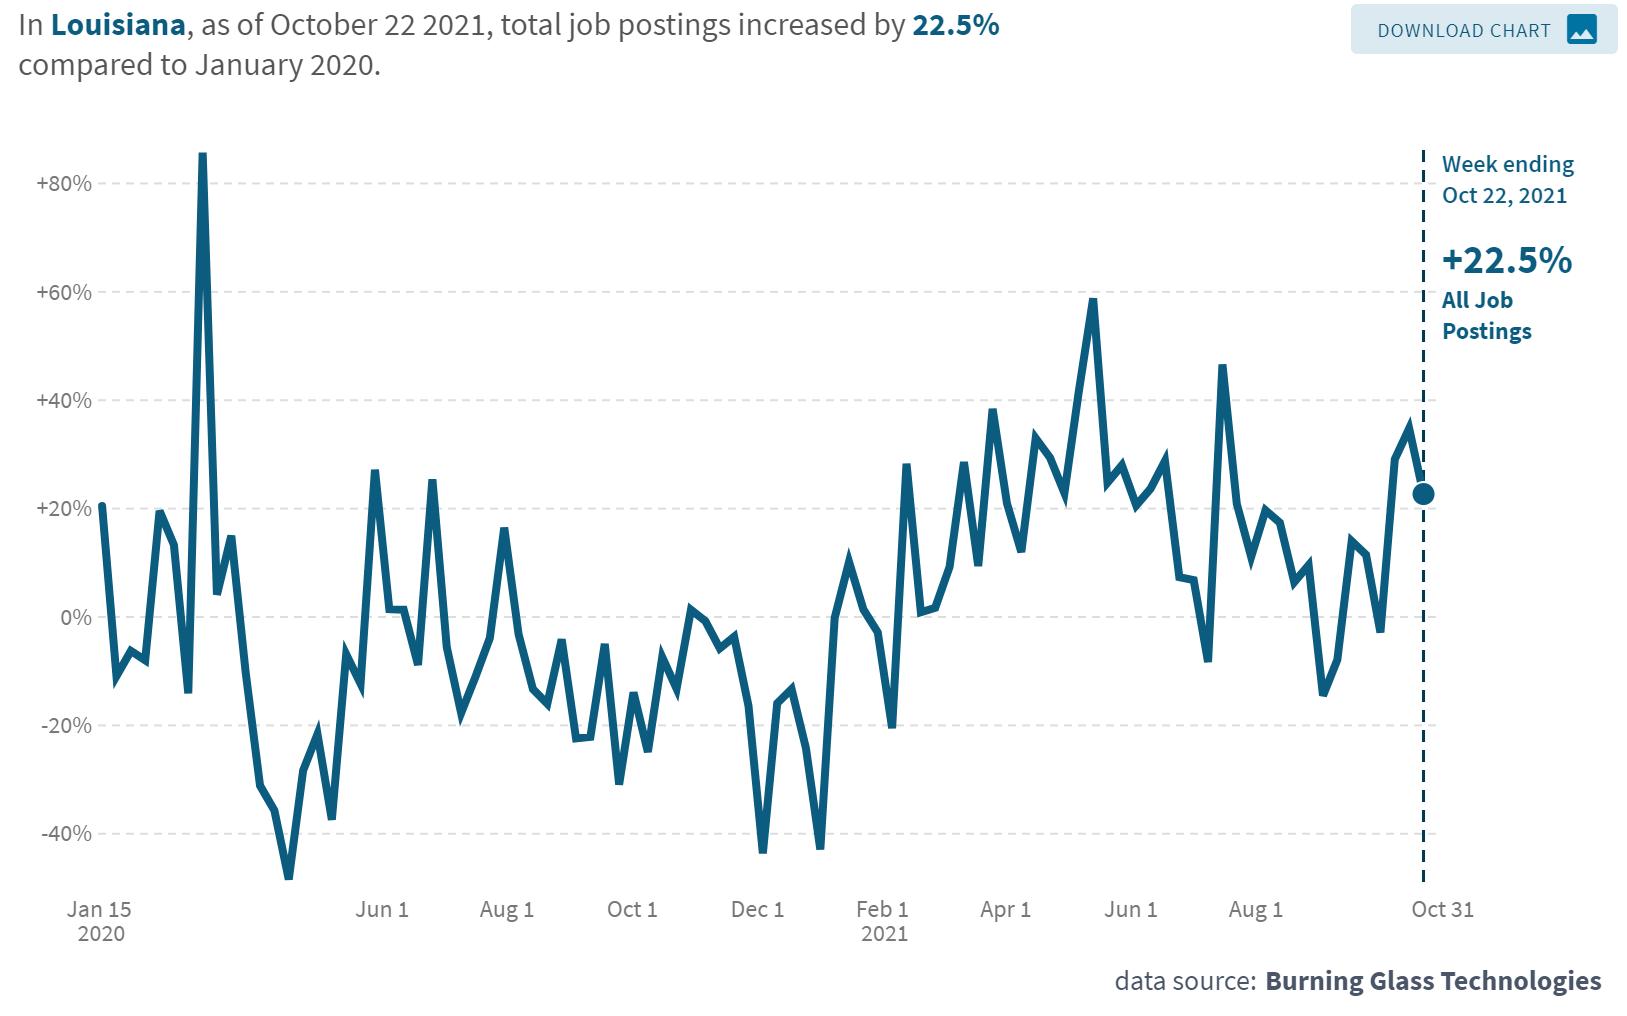
The chart below represents the percent change in job posting by industry in Louisiana as of October 22, 2021 with January 2020 as the baseline.
An overview of sales, vehicle sales, and hotel occupancy taxes collected in the October 2021 reflecting sales activity in September 2021.
Note: October tax revenue reflects sales activity in September. N/a = Not available
Data Source noted in detailed reports.
An overview of sales tax revenue in Rapides Parish other towns and cities in October 2021 (excluding Alexandria and Pineville).


Note: Current tax revenue reflects sales activity in prior month.
Data Source: Rapides Parish Police Jury Treasurer’s Reports, November 2021.


(TR) Alexandria total sales tax revenue for October with previous month, year, and YTD comparisons.
(BR) Alexandria total monthly sales tax revenue from 2019 to present.
Note: October sales tax revenue reflects sales activity in September.
Data Source: Rapides Parish Police Jury Treasurer’s Reports, November 2021.
Avoyelles Parish total sales tax revenue for October with previous month, year, and year-to-date comparisons. Vehicle and hotel tax revenues are excluded. Data Source: Avoyelles Parish School Board. November 2021.
Note: October sales tax revenue reflects sales activity in September.
Avoyelles Parish vehicle sales tax revenue for October with previous month, year, and year-to-date comparisons.
Note: October sales tax revenue reflects sales activity in September.
Data Source: Avoyelles Parish School Board. November 2021
Catahoula Parish total sales tax revenue for October with previous month, year, and year-to-date comparisons.
Note: October sales tax revenue reflects sales activity in September.
Data Source: Catahoula Parish Tax Administrator, November 2021
Concordia Parish total sales tax revenue for October with previous month, year, and year-to-date comparisons.
Note: October sales tax revenue reflects sales activity in September.
Data Source: Concordia Parish Tax Administrator. November 2021
Evangeline Parish total sales tax revenue for October with previous month, year and YTD comparisons.
Note: October sales tax revenue reflects sales activity in September. Evangeline implemented a 1% sales tax increase July 1, 2021.
Data Source: Evangeline Parish Sales Tax Commissioner. November 2021
Evangeline Parish vehicle sales tax revenue for October with previous month, year and YTD comparisons.
Note: October sales tax revenue reflects sales activity in September. Evangeline implemented a 1% sales tax increase July 1, 2021.
Data Source: Evangeline Parish Sales Tax Commissioner. November 2021
(TR) Grant sales tax revenue for October with previous month, year, and YTD comparisons.
(BR) Grant monthly sales tax revenue from 2019 to present.
Note: October sales tax revenue reflects sales activity in September.
Data Source: Grant Parish Sheriff’s Office, November 2021.
La Salle Parish total sales tax revenue for October with previous month, year, and year-to-date comparisons.
Note: October sales tax revenue reflects sales activity in September.
Data Source: La Salle Parish Tax Administrator, November 2021

(TR) Pineville sales tax revenue for October with previous month, year, and YTD comparisons.
(BR) Pineville monthly sales tax revenue from 2019 to present.
Note: Current sales tax revenue reflects sales activity in the prior month. Data
(TR) Rapides Parish sales tax revenue for October with previous month, year, and YTD comparisons.
(BR) Rapides monthly sales tax revenue from 2019 to present.
Note: Current sales tax revenue reflects sales activity in the prior month.
Data Source: Rapides Parish Police Jury Treasurer’s Reports, November 2021.
Rapides Parish vehicle sales tax revenue for October with previous month, year, and YTD comparisons.
*August sales data of $3,173,721 was for two months and therefore evenly split between July andAugust 2021 reports.
Data Source: Rapides Parish Police Jury Treasurer’s Reports, November 2021.
St. Landry Parish sales tax revenue for October with previous month, year, and YTD comparisons.
Note: October sales tax revenue reflects sales activity in September.
Data Source: Tax revenue data from St. Landry Parish School Board. November 2021
St. Landry Parish vehicle sales tax revenue for October with previous month, year, and YTD comparisons.
Note: October sales tax revenue reflects sales activity in September.
Data Source: Tax revenue data from St. Landry Parish School Board. November 2021
Remote seller tax revenue is tax revenue from online sales by location of the seller at the time of purchase.
Total Remote Sellers Sales Tax Collection in Cenla
August 2020 - October 2021
✓
SinceAugust 2020 when remote sellers tax revenue collection started, $18.5 million in sales tax revenue have been collected from online sales in central Louisiana with Rapides collecting $5.6 million.
Online sales tax revenue in Cenla has remained steady since July, averaging $1.32 million a month.
Note: Sales tax revenue collected in October reflects sales activity in September.
Data Source: Louisiana Sales and Use Tax Commission for Remote Sellers.August 2020 – November 2021
Remote seller tax revenue by parish with month-over-month and year-over-year comparisons.
✓Total online sales tax revenue in Cenla in October fell -0.8% from September but increased 38% from a year earlier.
Note: Sales tax revenue collected in October reflects sales activity in September.
Data Source: Louisiana Sales and Use Tax Commission for Remote Sellers.August 2020 – October 2021
Remote sellers tax revenue from online sales in Rapides Parish from July 2020 – October 2021.
Note: Sales tax revenue collected in one month reflects sales activity in the prior month.
Data Source: Louisiana Sales and Use Tax Commission for Remote Sellers.August 2020 – October 2021

(TR) Louisiana tax revenue from all sources for October with previous month, year, and YTD comparisons.
(BR) Louisiana monthly tax revenue from 2019 to present.
The valuation (estimated development cost) of new commercial construction permits issued by the City of Alexandria in October 2021 with previous month, year, and YTD comparisons.
The valuation (estimated development cost) of new residential construction permits issued by the City of Alexandria in October 2021 with previous month, year, and YTD comparisons.
This chart shows the valuation of permits issued by Rapides Area Planning Commission in Allen Parish in October between 2018-2021 with month-tomonth, year-to-year, and year-to-date comparisons.
Data Source: RapidesArea Planning Commission, November 2021
This chart shows the valuation of permits issued by Rapides Area Planning Commission in Avoyelles Parish in October between 2019-2021 with month-to-month, year-to-year, and year-to-date comparisons.
Data Source: RapidesArea Planning Commission, November 2021.
This chart shows the valuation of permits issued by Rapides Area Planning Commission in Evangeline Parish in October between 2018-2021 with month-tomonth, year-to-year, and year-to-date comparisons.
Data Source: RapidesArea Planning Commission, November 2021.
This chart shows the valuation of permits issued by Rapides Area Planning Commission in the City of Pineville in October between 20182021 with month-to-month, year-to-year, and year-to-date comparisons.
Data Source: RapidesArea Planning Commission, November 2021.
This charts shows the valuation of permits issued by Rapides Area Planning Commission in Rapides Parish (excluding Alexandria) in October between 2018-2021 with month-to-month, year-to-year, and year-to-date comparisons.
Data Source: RapidesArea Planning Commission, November 2021.
New residential construction permit valuation (estimated development cost) issued by Rapides Area Planning Commission by jurisdiction in October 2021 compared to October 2020.
Valuation of New Residential Construction
October 2020 vs October 2021
Year-over-year value of new residential construction in the RAPC jurisdictions increased from $4.4 million in October 2020 to $13.8 million in October 2021.
Note: City ofAlexandria permits are accounted for separately.
Data Source: RapidesArea Planning Commission, November 2021.
The chart represents the Lumber Price Index in the U.S. from January 2020 – October 2021.
Monthly Price Index of Lumber 2020 - 2021
▪ In October 2021, the US Lumber Price Index increased 5.5% from the previous month, breaking a four month decline.
▪ The US Lumber Price Index in October was -10% below the January 2021 level.
Data Source: Fed Reserve Economic Database, St. Louis Federal Reserve Bank, November 14, 2021.

The count of active single-family and condo/townhome listings for Alexandria MSA (excludes pending listings) for October 2018-2021 with month-to-month and year-over-year comparisons.
✓Active listings in October decreased -5% over the previous month and remain -20% below a year ago.

The count of pending single-family and condo/townhome listings for Alexandria MSA for October 2018-2021 with month-to-month and year-over-year comparisons.

The median number of days property listings spend on the market in Alexandria MSA for October 2018-2021 with month-to-month and year-over-year comparisons.
Median days on the market rose 31% in October from previous month and was -10% below a year ago.
✓Homes took an average of 67 days on the market to sell in October, down from 74 days the same month in 2020 and 89 in 2019.

The median listing price of houses in Alexandria MSA for October 2018-2021 with month-to-month and year-over-year comparisons.
The median listing price in October rose 2% to $174,500 from the previous month of $170,500, and still remains -25% below a year ago.

The average listing price of houses in Alexandria MSA for October 2018-2021 with month-to-month and year-over-year comparisons.
The average listing price rose 1% to $222,244 this month from $220,586 last month but is -20% below a year ago.
The graph illustrates the number of visitors at Louisiana Welcome Centers from 2018 to 2021.
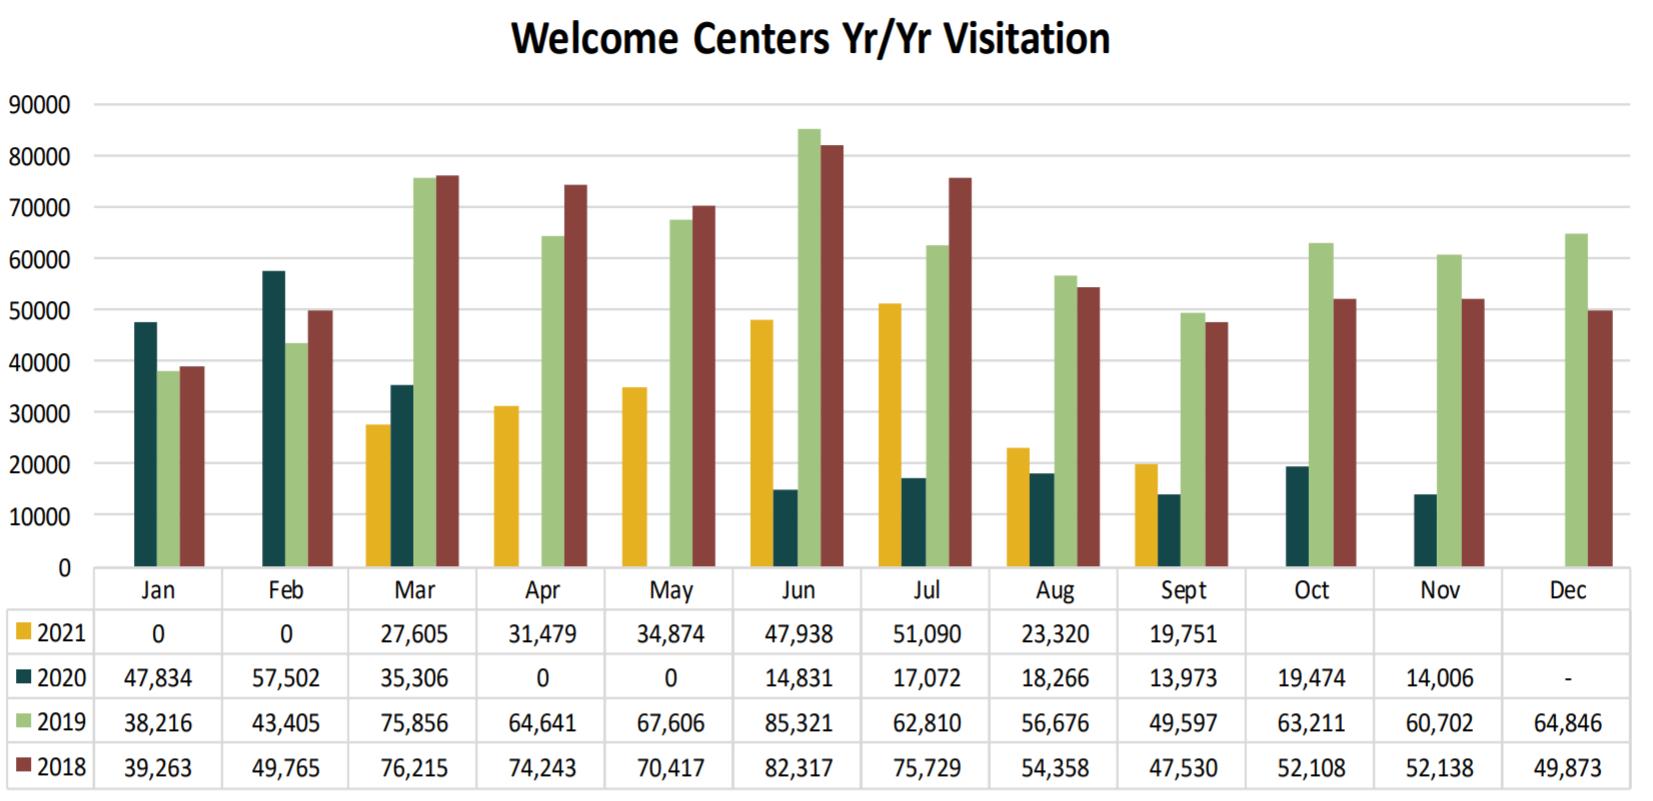
▪ Welcome Center visitors in September 2021 were down 15% fromAugust 2021.
In September, Louisiana’s welcome centers recorded the second monthly decline in traffic since March.
Data Source: Louisiana Department of Culture, Recreation, & Tourism, November 1, 2021
Avoyelles Parish hotel occupancy tax revenue for October with previous month, year, and year-to-date comparisons.
Note: October tax revenue reflects hotel occupancy activity in September. Hotel occupancy tax revenue is used as a proxy for hotel occupancy rate.
Data Source: Avoyelles Parish School Board. November 2021.
Rapides Parish hotel occupancy tax revenue for October with previous month, year, and YTD comparisons.
Note: October tax revenue reflects hotel occupancy activity in September. Hotel occupancy tax revenue is used as a proxy for hotel occupancy rate.
Data Source: Rapides Parish Police Jury Treasurer’s Reports, November 2021.
This chart shows total passenger throughput at AEX and other Louisiana airports in October 2021 as a percent of traffic in 2019. AEX is the solid black line.
Passenger Throughput at AEX as a Percent 2019 Traffic (October 2021)

Last month,AEX had 80%of the passenger throughput of October 2019.
Statewide passenger throughput in October was 66% of October 2019.

Nationwide daily percentage of passengers passing through current TSA checkpoints in 2021 expressed as a percentage of 2019 traffic.
U.S. Airport Passenger Throughput Traffic in 2021 as a Percent of 2019 Traffic
✓Nationally, air passenger traffic in October was up 12% over September.
Data Source: DHS, Transportation Security Administration, https://www.tsa.gov/coronavirus/passenger-throughput, November 16, 2021
This data shows seated diners at restaurants on the OpenTable network in Louisiana in 2021 compared with the same day of the week for 2019. OpenTable reservations are mostly from southeast Louisiana restaurants.
• Reservations in Louisiana have begun a new uptrend from the low reached following Hurricane Ida.
• Reservations were down 21% in October compared to October 2019.
Source: OpenTable, https://www.opentable.com/state-of-industry, November 1, 2021
OpenTable Reservations in Lousiana
Percent Change in 2021 vs 2019
Hurricane Ida
Total gasoline sales in Louisiana in 2019 - 2021.


✓August 2021 gasoline sales fell -0.7% from July and was down3.7% from a year ago.
✓Gasoline sales YTD in August are 5.4% above the same period in 2020.
Data Source: U.S. Energy Information Administration, Prices, Sales Volumes & Stocks by State, November 1, 2021


The chart below represents the weekly number of new businesses applications in Louisiana from 2019-2021
✓
Through October 85,563 of new business applications were filed in Louisiana compared to 70,927 in 2020 and 45,195 in 2019, representing increases of 21% over 2020 and 89% over 2019.
Note: Data reflects businesses applications, not necessarily business formations.
Data Source: U.S. Census Bureau, Business Formation Statistics, Retrieved November 17, 2021.
The chart below represents the number of new businesses established each month in Rapides from January 2019 through October 2021.


The number of new businesses established in Rapides in October 2021 rose 46% from September and was 37% higher than October 2020.
Year-to-date new businesses in Rapides are up 29% over 2020.
Note: Data reflects businesses established in the current month.
Data Source: Rapides Parish Sales and Use Tax Department, November 2021.
Rapides Parish occupational license revenue YTD with previous YTD comparisons.
Note: Rapides Parish reflects unincorporated areas.
Data Source: Rapides Parish Police Jury Treasurer’s Reports, November 2021.
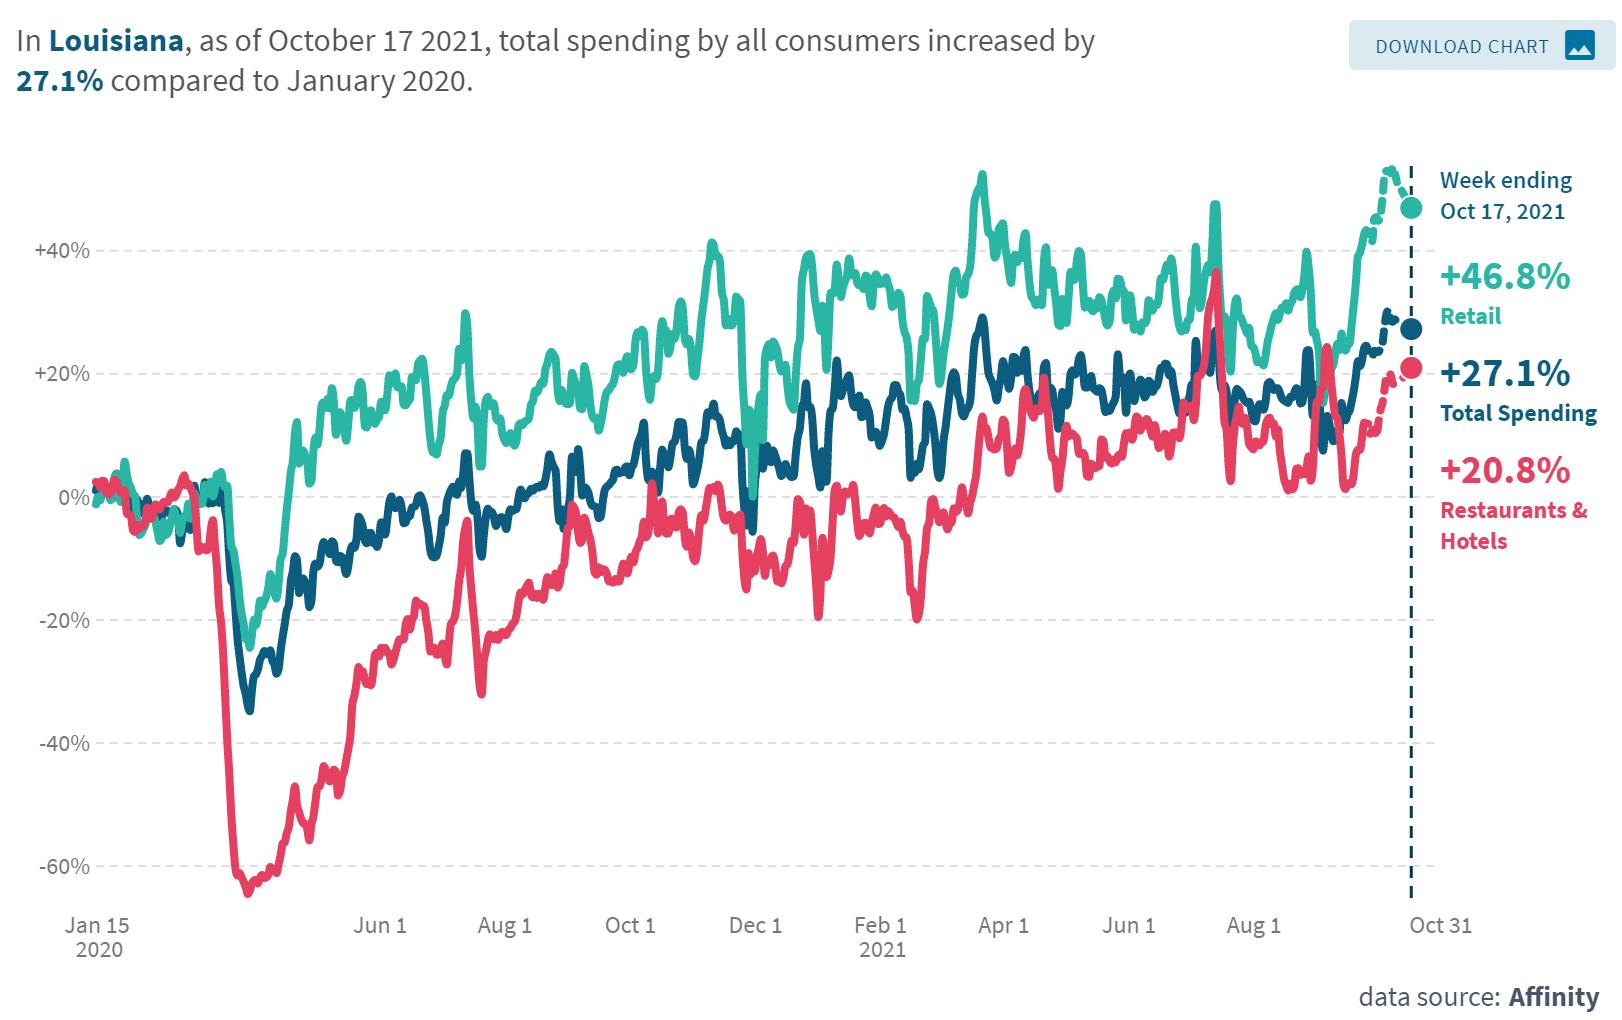
This graph represents the percent change in average consumer credit and debit card spending in Louisiana as of October 17, 2021 with January 2020 as the baseline.
Total consumer spending in Louisiana was 27% above the January 2020 baseline.
From mid-September to midOctober, retail spending increased from 32% to 47% above the baseline. Restaurant spending increased from 4% to 21%, while grocery spending decreased from 18% to 11% from September.
• Compared to the January 2020 baseline, total consumer spending on October 17, 2021 in Louisiana was up 27%, with entertainment spending turning positive in October at 2% compared to -16% in September. Healthcare spending saw the lowest percentage increase in October, rising to 12% from 9% in September.
The table and chart represents the percent change in average consumer credit and debit card spending in Cenla as of October 17, 2021 with January 2020 as the baseline, while the chart represents Rapides.
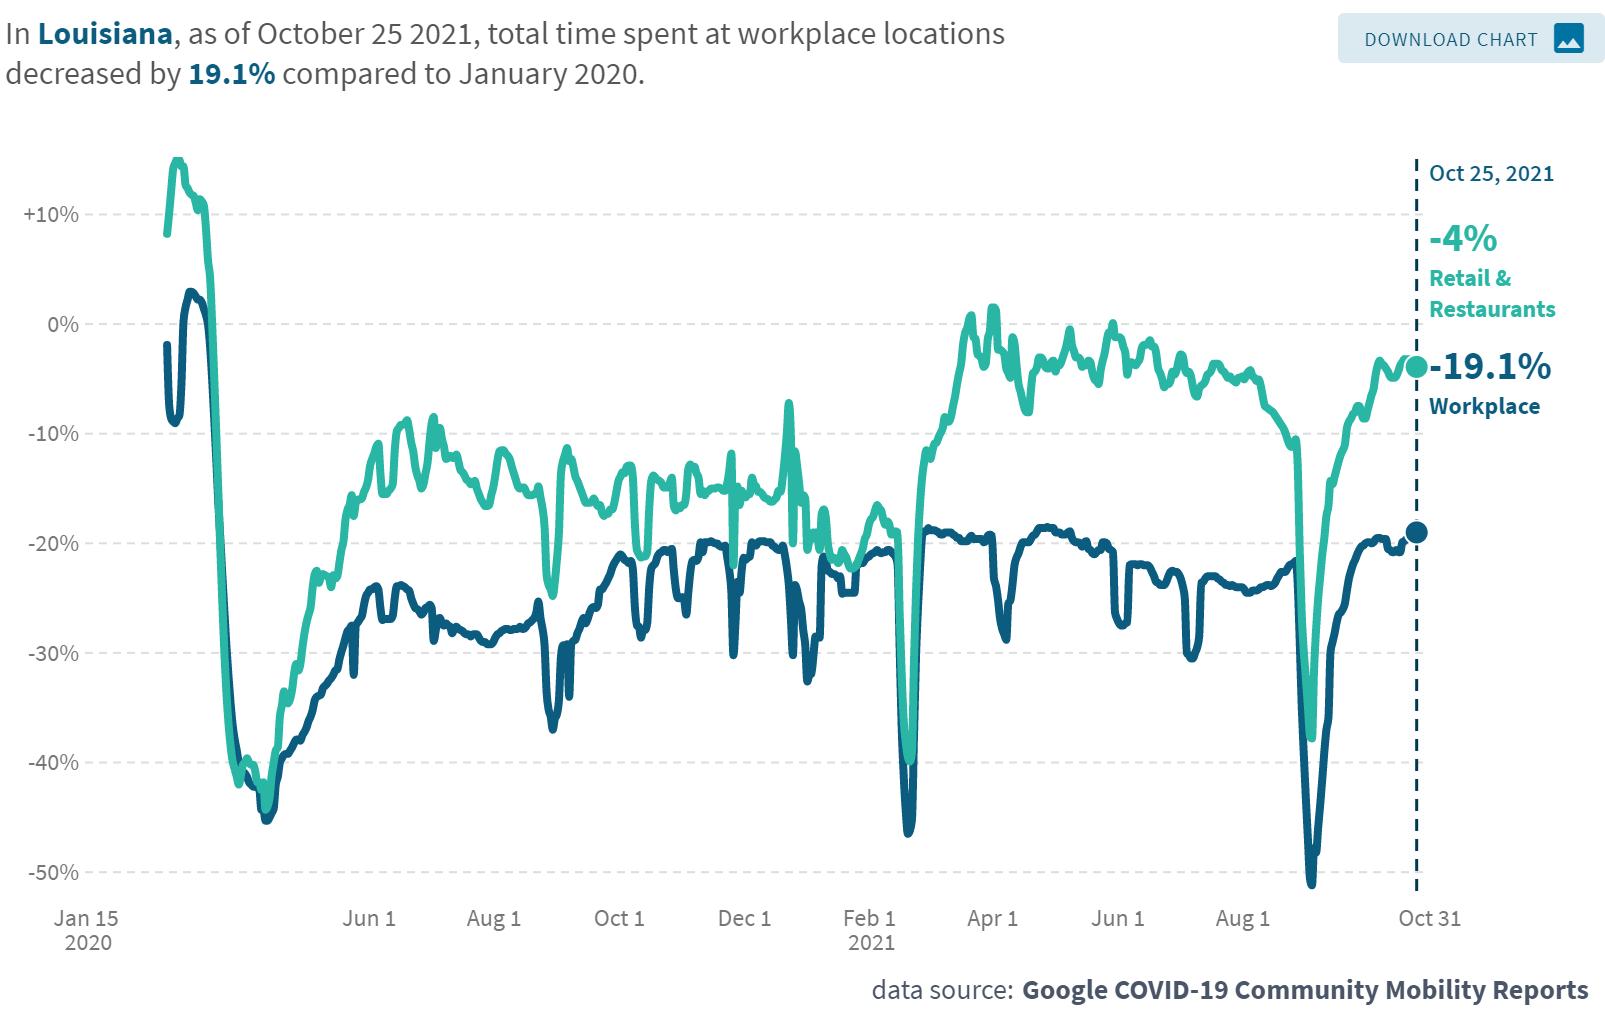
The chart represents the percent of time employees in Cenla and statewide spent at work as of October 25, 2021 with January 2020 as the baseline.
The Coincident Economic Activity Index for Louisiana is set to match the trend in the gross state product and includes four indicators: nonfarm payroll employment, the unemployment rate, average hours worked in manufacturing and wages and salaries. The column graph below represents the percentage change in the index. A positive percentage represents an expanding statewide economy.
Louisiana Coincident Economic Activity Index
2020 - 2021
The Index for September 2021 decreased -0.21% from August.
✓September saw the first decrease in the index since May 2020 indicating a possible slowdown as the economy was hit by the fourth wave of the pandemic.
Represents the number of drilling rigs actively exploring for or developing oil or natural gas in Louisiana and the U.S. in 2021


LOUISIANA 38 39 47
US 280 508
✓Rig count in Louisiana increased by 8 rigs or 21% in October from September regaining most of the decline from Hurricane Ida. ▪ The offshore rig count is only two below the pre-Ida level. ✓Nationwide, the rig count is up 92% from a year ago.
Source: Baker Hughes, https://rigcount.bakerhughes.com/na-rig-count, November 1, 2021
Gaming revenue in Louisiana for September 2021 with previous month and year comparisons.
Data Source: Louisiana Gaming Control Board, November 1, 2021. http://lgcb.dps.louisiana.gov/revenue_reports.html
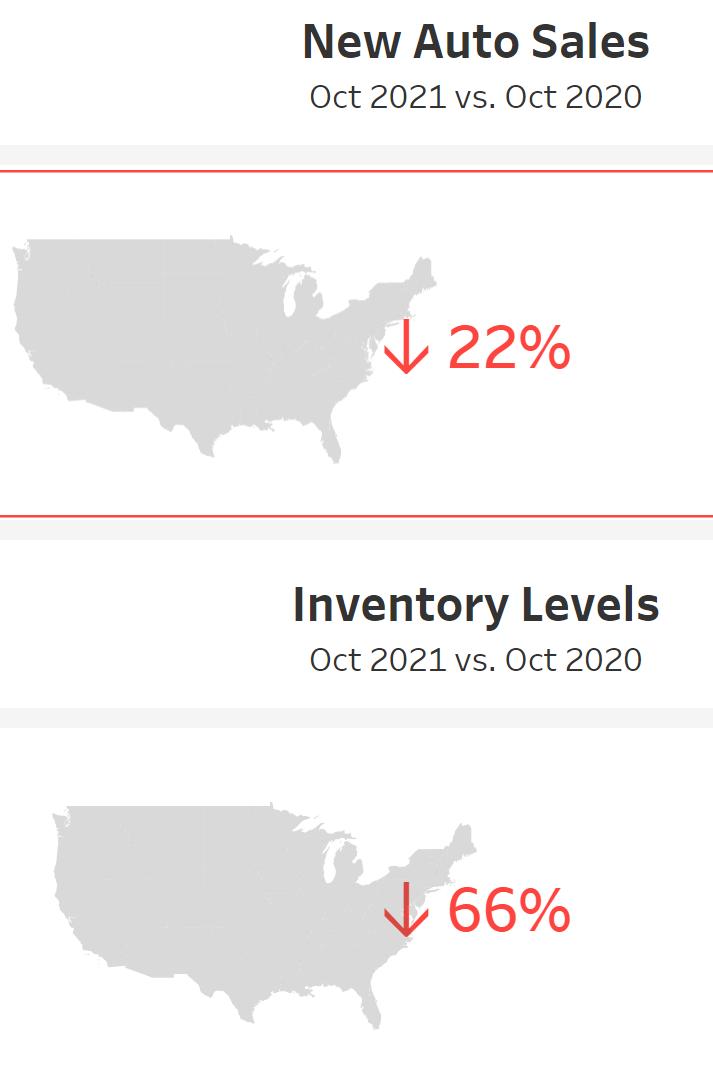
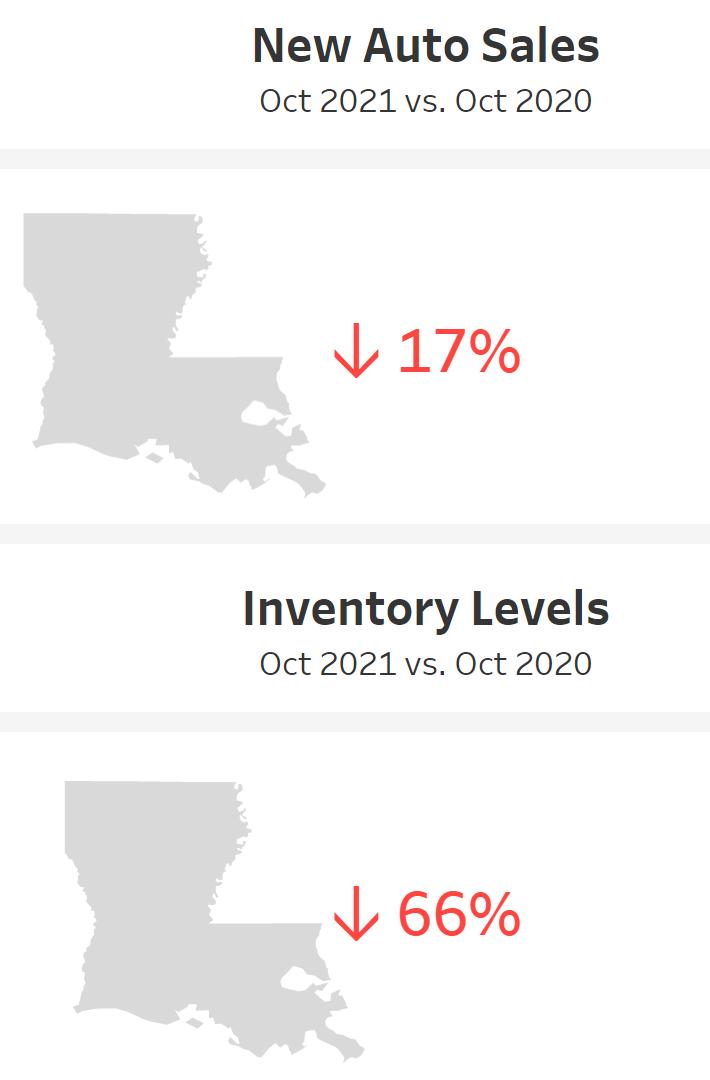
Data Source: Foureyes, November 16, 2021.
Monthly U.S. economic indicators for September 2021 with select (*) indicators for October.
* Indicates the current month is October and previous month is September.
Data Source: U.S. Census, https://www.census.gov/economic-indicators/ November 17, 2021.
The data presented throughout the CENLA Economic Dashboard reflects contributions from the following local organizations.
• Rapides Parish Policy Jury Treasurer
• Rapides Sales TaxAdministrator
• Avoyelles Parish School Board
• Alexandria International Airport
• RapidesArea Planning Commission
• City ofAlexandria Planning Division
• Evangeline Parish Sales Tax Commissioner
• Concordia, Catahoula, & La Salle TaxAdministrator
• Louisiana Office of Public Health, Region 6
• St. Landry Parish School Board
• Grant Parish Sheriff’s Office
Also, special thanks to the following partners for distributing the dashboard.
Next Issue: Week of Dec. 20th
• LSUAFoundation
• Central Louisiana Regional Chamber of Commerce
• Marksville Chamber of Commerce
• Bunkie Chamber of Commerce
• Evangeline Chamber of Commerce
• Concordia Chamber of Commerce
• St. Landry Chamber of Commerce
• Greater Vernon Chamber of Commerce
Current and past issues of the CENLAEconomic Dashboard can be found at http://www.lsua.edu/coronavirus/cenla-economic-dashboard/