CENLA ECONOMIC DASHBOARD
October 19, 2021.
Dr.RandallDupont Dean,CollegeofBusinessLouisianaStateUniversityofAlexandria
rdupont@lsua.edu


October 19, 2021.
Dr.RandallDupont Dean,CollegeofBusinessLouisianaStateUniversityofAlexandria
rdupont@lsua.edu
Region 6 (central Louisiana) continues to rank as the second lowest vaccinated region in the state with 38% of the population fully vaccinated, up from 35% in mid-September. Rapides and Avoyelles have the highest percentage of completed vaccinations in Region 6 at 43% and 41%, respectively. The number of cases continues to decline nearing pre-4th wave levels. Young adults led the 4th wave of the pandemic with 5-17 year olds reporting the highest number of cases, followed by 18-29 year olds, then 30-39 year olds, etc. Children (0-4) and elderly (60+) were the least infected.

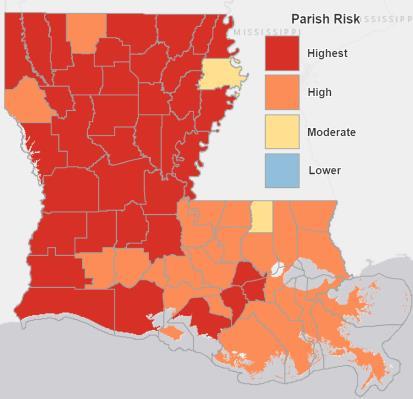
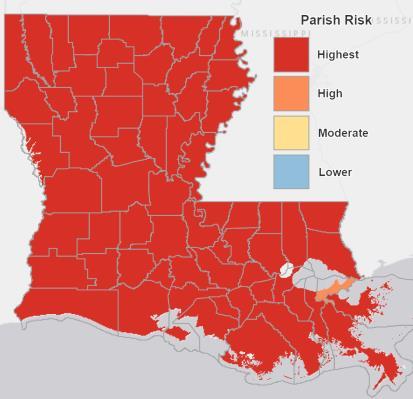
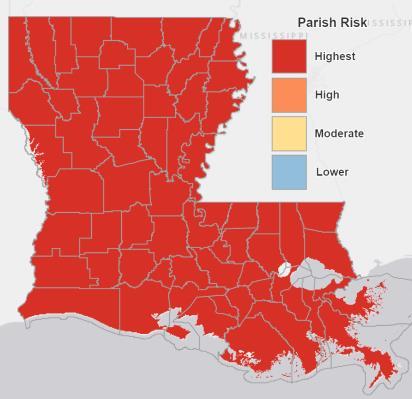
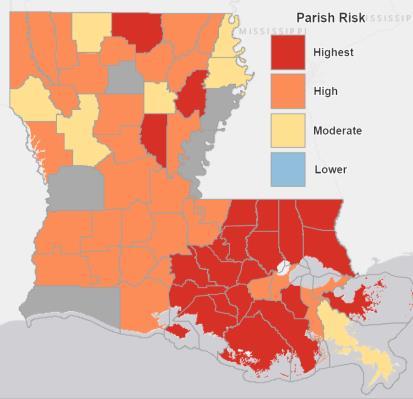
Every parish in Region 6 remains at the highest risk level while other regions of the state are beginning to experience reduce risk levels. Hospitalizations for Covid for Region 6 continue to decline but have not reached the lows of post3rd wave.
After reaching a multi-year employment peak of 61,950 in theAlexandria MSA in July 2021, employment declined by 614 to 61,366 in August. The metro area reached a pandemic low of 55,588 employed just 15 months ago. Statewide initial unemployment claims were up 286% in September due to Hurricane Ida, while continued claims remained unchanged. The unemployment rate in Cenla fell to 4.7% inAugust compared to 5.4% in July and 5.5% for the state. In August, Rapides reported a 3.8% unemployment rate down from 4.3% in July and well below the state and Cenla rates. Hiring pressures tightened even further in the Alexandria MSAand statewide. Currently, there are almost three job openings for every unemployed in Alexandria, while the state average is less than one unemployed for every opening.
Changes in consumer spending are measured by changes in sales tax revenue. Sales taxes collected in September reflect activity in August. Spending in August was lower in 8 of the ten jurisdictions reporting and ranged from -32% in Catahoula to +13% inAvoyelles. Vehicle sales were down -50% inAvoyelles, and single digits in Evangeline and Rapides, but up 3% in St. Landry. Year-to-date comparisons of consumer spending and vehicle sales remain very positive. Since the first of the year, $12.2 million in sales tax revenue have been collected from online sales in central Louisiana with Rapides collecting the most at $3.7 million, followed by St. Landry at $2.3 million, and Vernon at $1.4 million. Thanks to Sheriff McCain, Grant sales tax data is now included in the Dashboard.
The adverse impact from the 4th wave is now visible in travel data. Travelers at state welcome centers dropped 55% in July from the previous month. Louisiana gasoline sales in July fell by 6% over June, but year-to-date is still 7% above 2020. Visitors to Louisiana by highway were down 55% inAugust compared to July. It was the first monthly decline since Spring, according to Welcome Center records. Statewide, air passenger traffic suffered in September due to Hurricane Ida, falling from 81% of the 2019 level inAugust to 40% in September. At 88% of the 2019 level, AEX outpaced the national average of 76%, while Lafayette led the air transportation sector statewide at 99%. Hotel occupancy so far this year is up 28% inAvoyelles and 39% in Rapides, but was mixed for September. Restaurant reservations in Louisiana (largely New Orleans) continued to trend downward in September, according to OpenTable. However, the is reservations are expected to start a new uptrend.
Because of the volatility of monthly data, year-to-date permit data presents a clearer picture of local construction. Commercial permits inAlexandria are up 59% for the year while the value of residential permits are up 57%. So far this year, permit valuations issued inAvoyelles are up 56%, Evangeline 153%, and Rapides parish 1082%! Permits in Pineville are down -33%. Residential construction permits in Cenla are up 40% within the RAPC jurisdiction over September 2020.
The US Lumber Price Index declined only -3% in September from the previous month, but it was the fourth consecutive monthly decline and stands -14% below January 2021. Nationwide residential construction increased 3.9% inAugust. Active listings in theAlexandria MSApicked up 12% in September, with median days on the market slipping -4% and the median and average listing price falling -5%.
New business growth fell in central Louisiana in the latest report. In September 2021, the number of new businesses established in Rapides fell -34% from August, but remains 28% year-to-date over 2020. Through September of this year, the number of new business applications in Louisiana in 2021 grew 22% over 2020.
COVID-19 vaccinations as a percent of region population as of October 17, 2021.
Region 6 continues to have the second lowest vaccination rate in the state with 38.2% of the population vaccinated in October, up from 35% in September, 30% inAugust and 27% in July. Region 1 (New Orleans) and Region 2 (Baton Rouge) have the highest rates of vaccination at 57% and 49%, respectively.
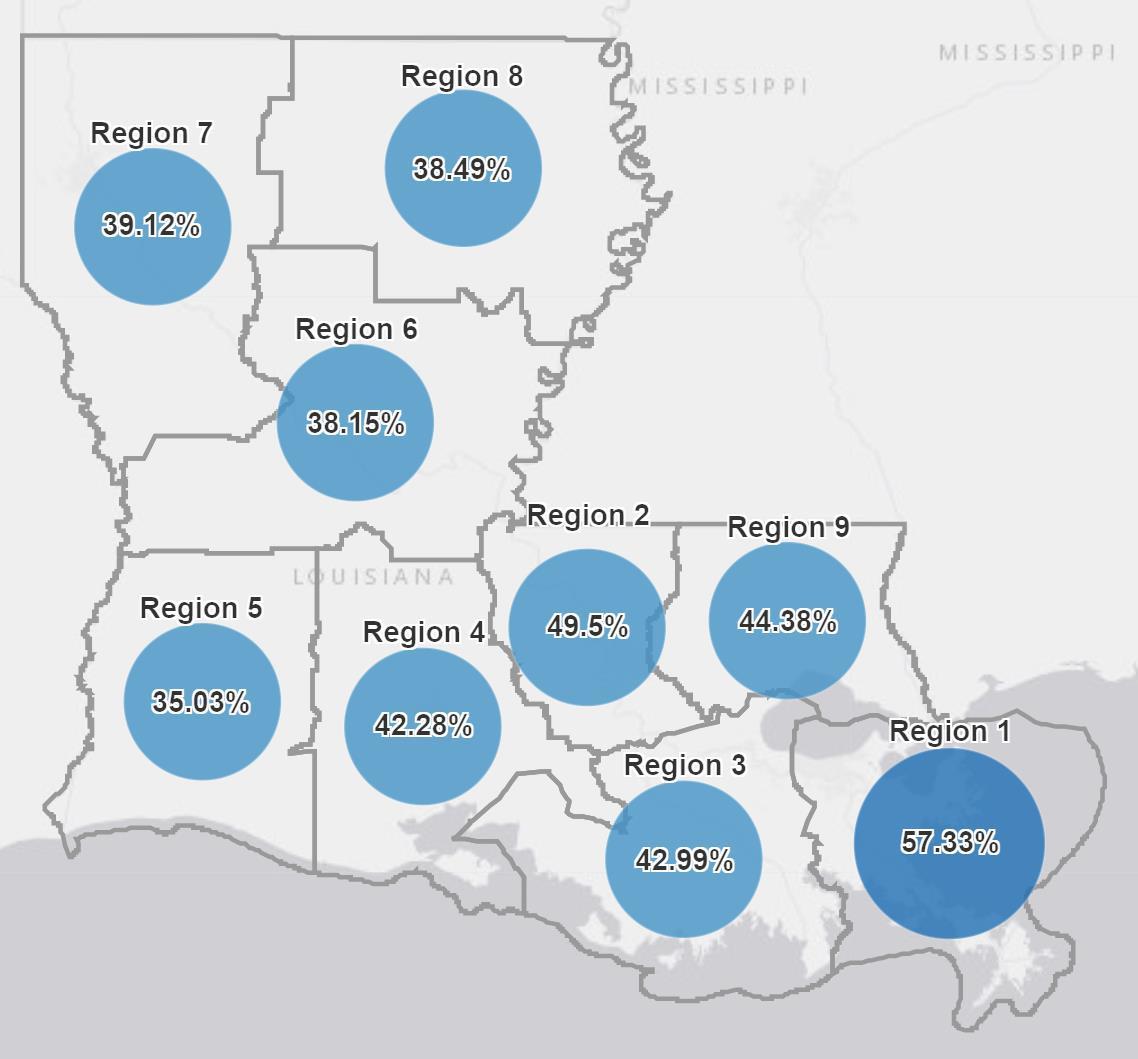
Source: Louisiana Office of Public Health, https://ldh.la.gov/covidvaccine, October 17, 2021
COVID-19 vaccinations as a percent of parish population as of October 13, 2021.
Rapides andAvoyelles have the highest percentage of completed vaccinations in Region 6 at 42.8% and 41.2% respectively.
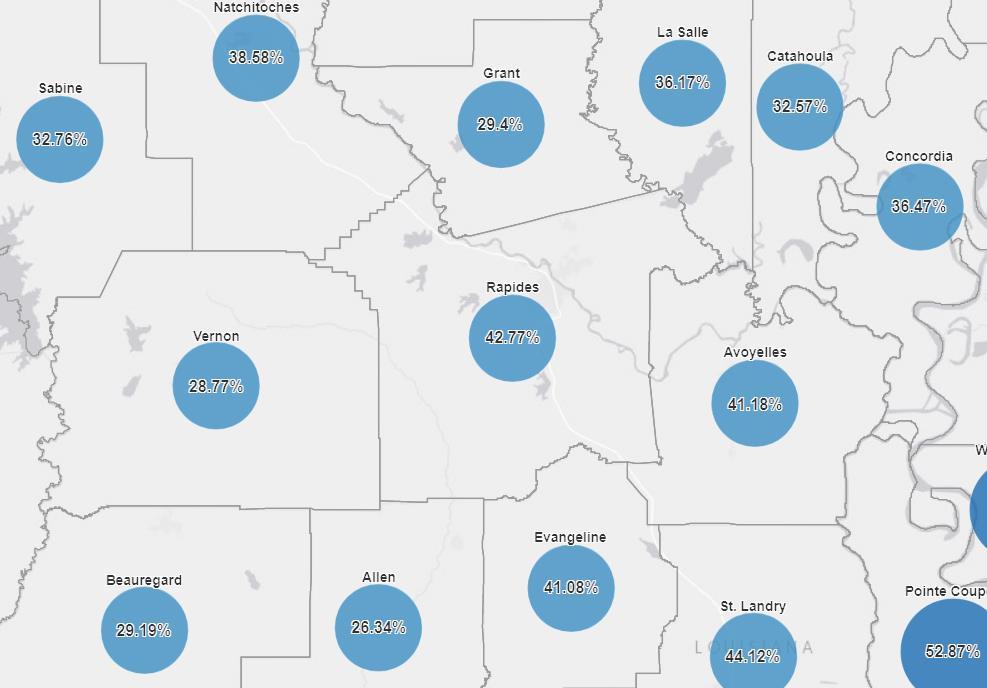
Source: Louisiana Office of Public Health, https://ldh.la.gov/covidvaccine, October 13, 2021
COVID-19 cases by collection date as of October 13, 2021 in Region 6 with a 7day moving average.
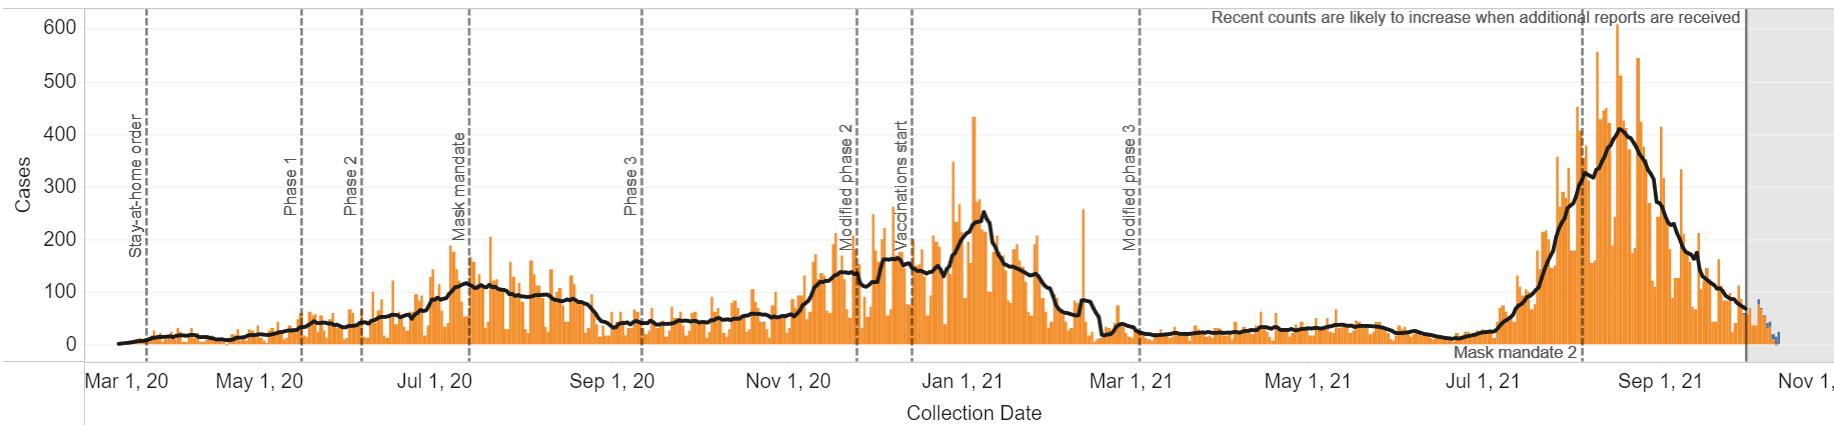
Source: Louisiana Office of Public Health, Region 6 (Central Louisiana), October 13, 2021.
Cases over time by age group in Region 6 through October 13, 2021.
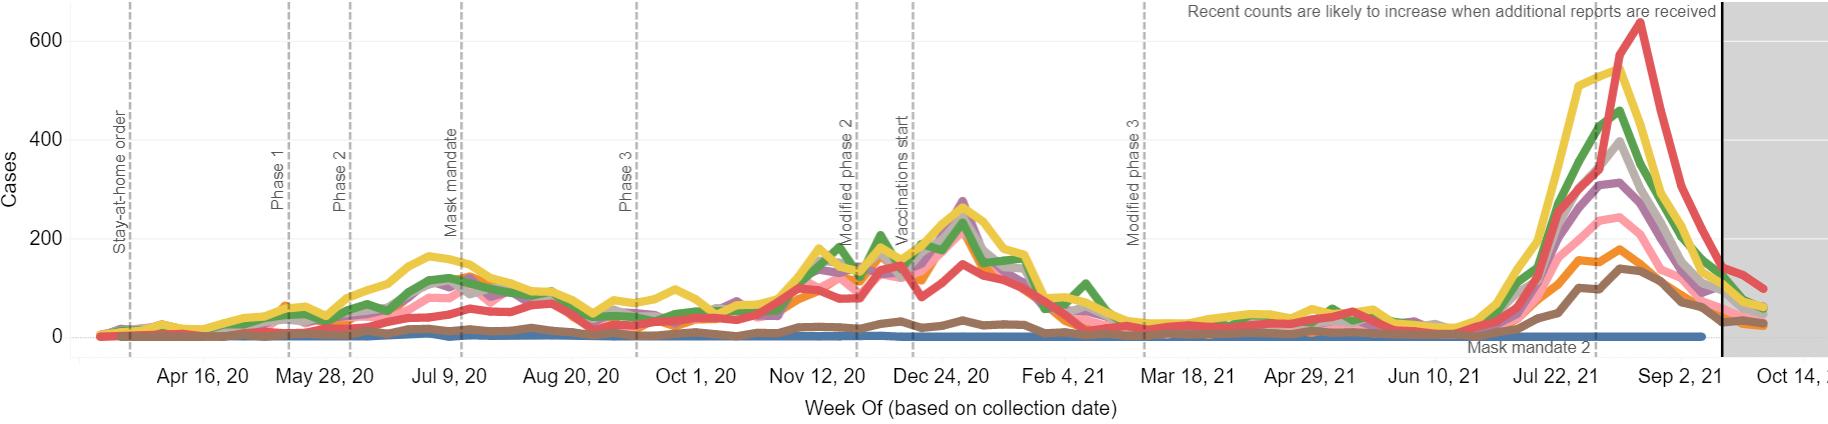
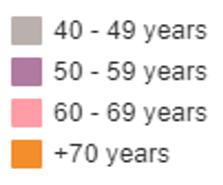
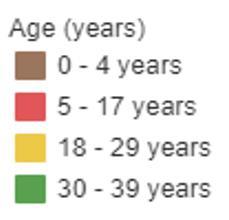
Source: Louisiana Office of Public Health, Region 6 (Central Louisiana), October 13, 2021.
COVID-19 percent positive and test volume in Region 6 as of October 13, 2021.
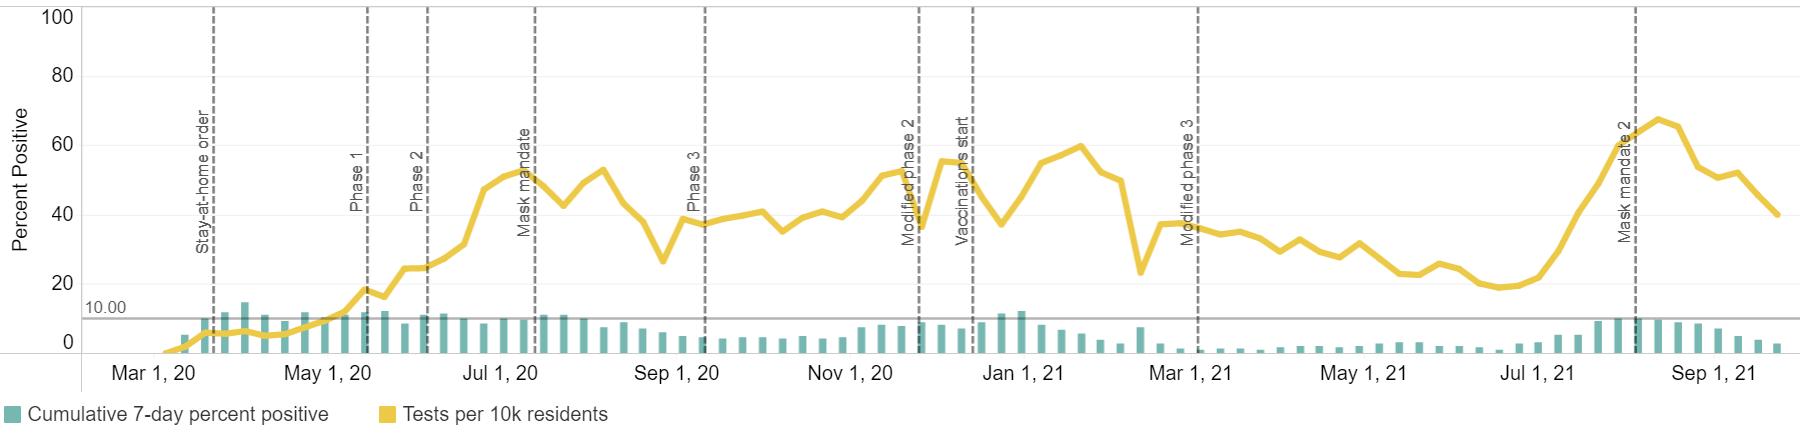
Source: Louisiana Office of Public Health, Region 6 (Central Louisiana), October 13, 2021..
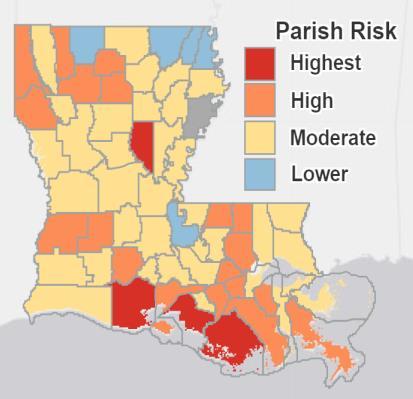
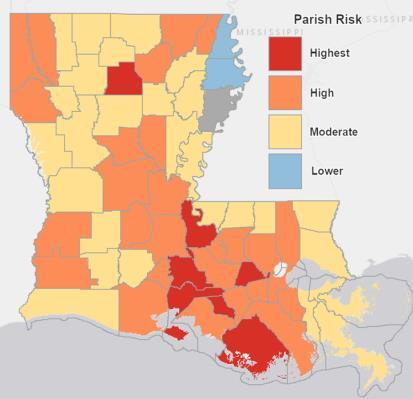
COVID-19 statewide risk by parish.
May 13, 2021
June 11, 2021
July 15, 2021
August 18, 2021
September 18, 2021
October 17, 2021
Source: Louisiana Office of Public Health, October 18, 2021.
Number of cases hospitalized (green line) and ventilated (yellow line) in Region 6 as of October 13, 2021.
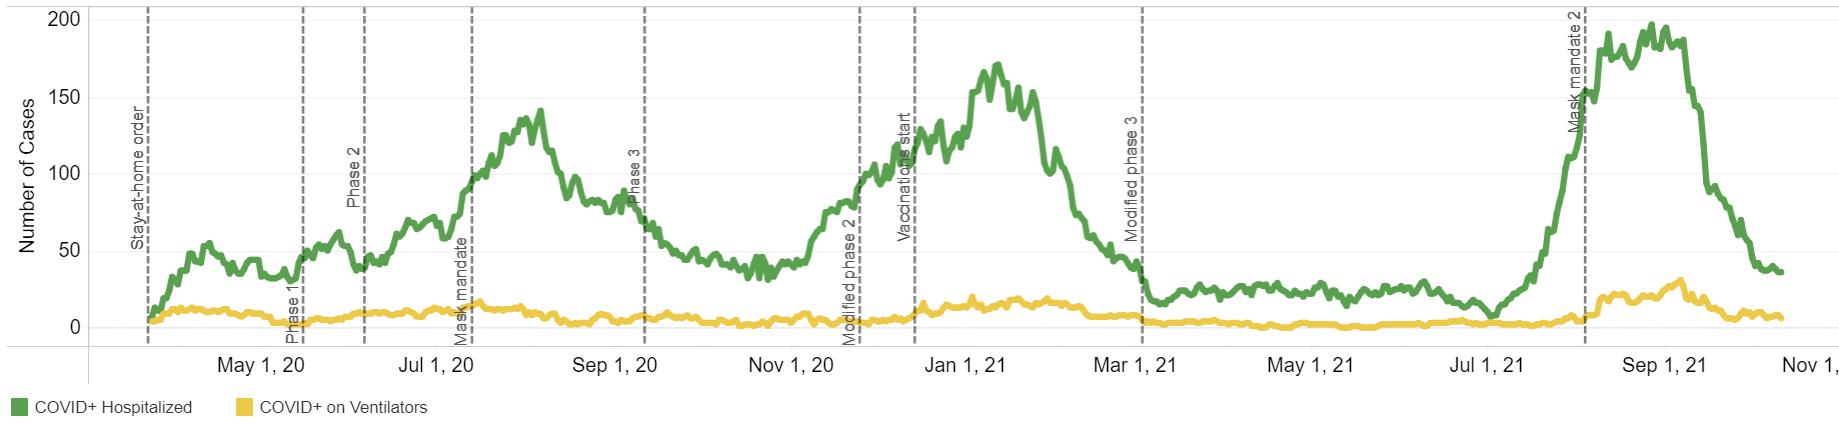
Source: Louisiana Office of Public Health, Region 6 (Central Louisiana), October 13, 2021.
COVID-19 deaths by date of death statewide as of October 13, 2021.
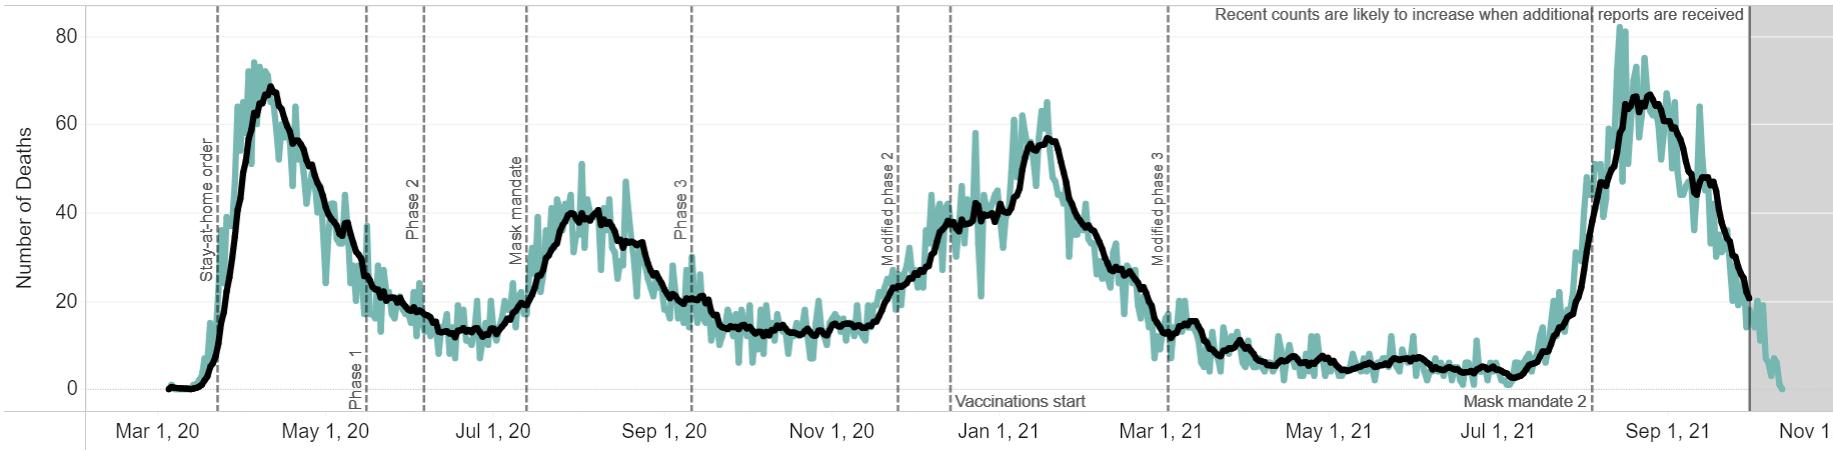
Source: Louisiana Office of Public Health, Region 6 (Central Louisiana), October 13, 2021.

Available beds by Louisiana Department of Health region as of October 17, 2021.
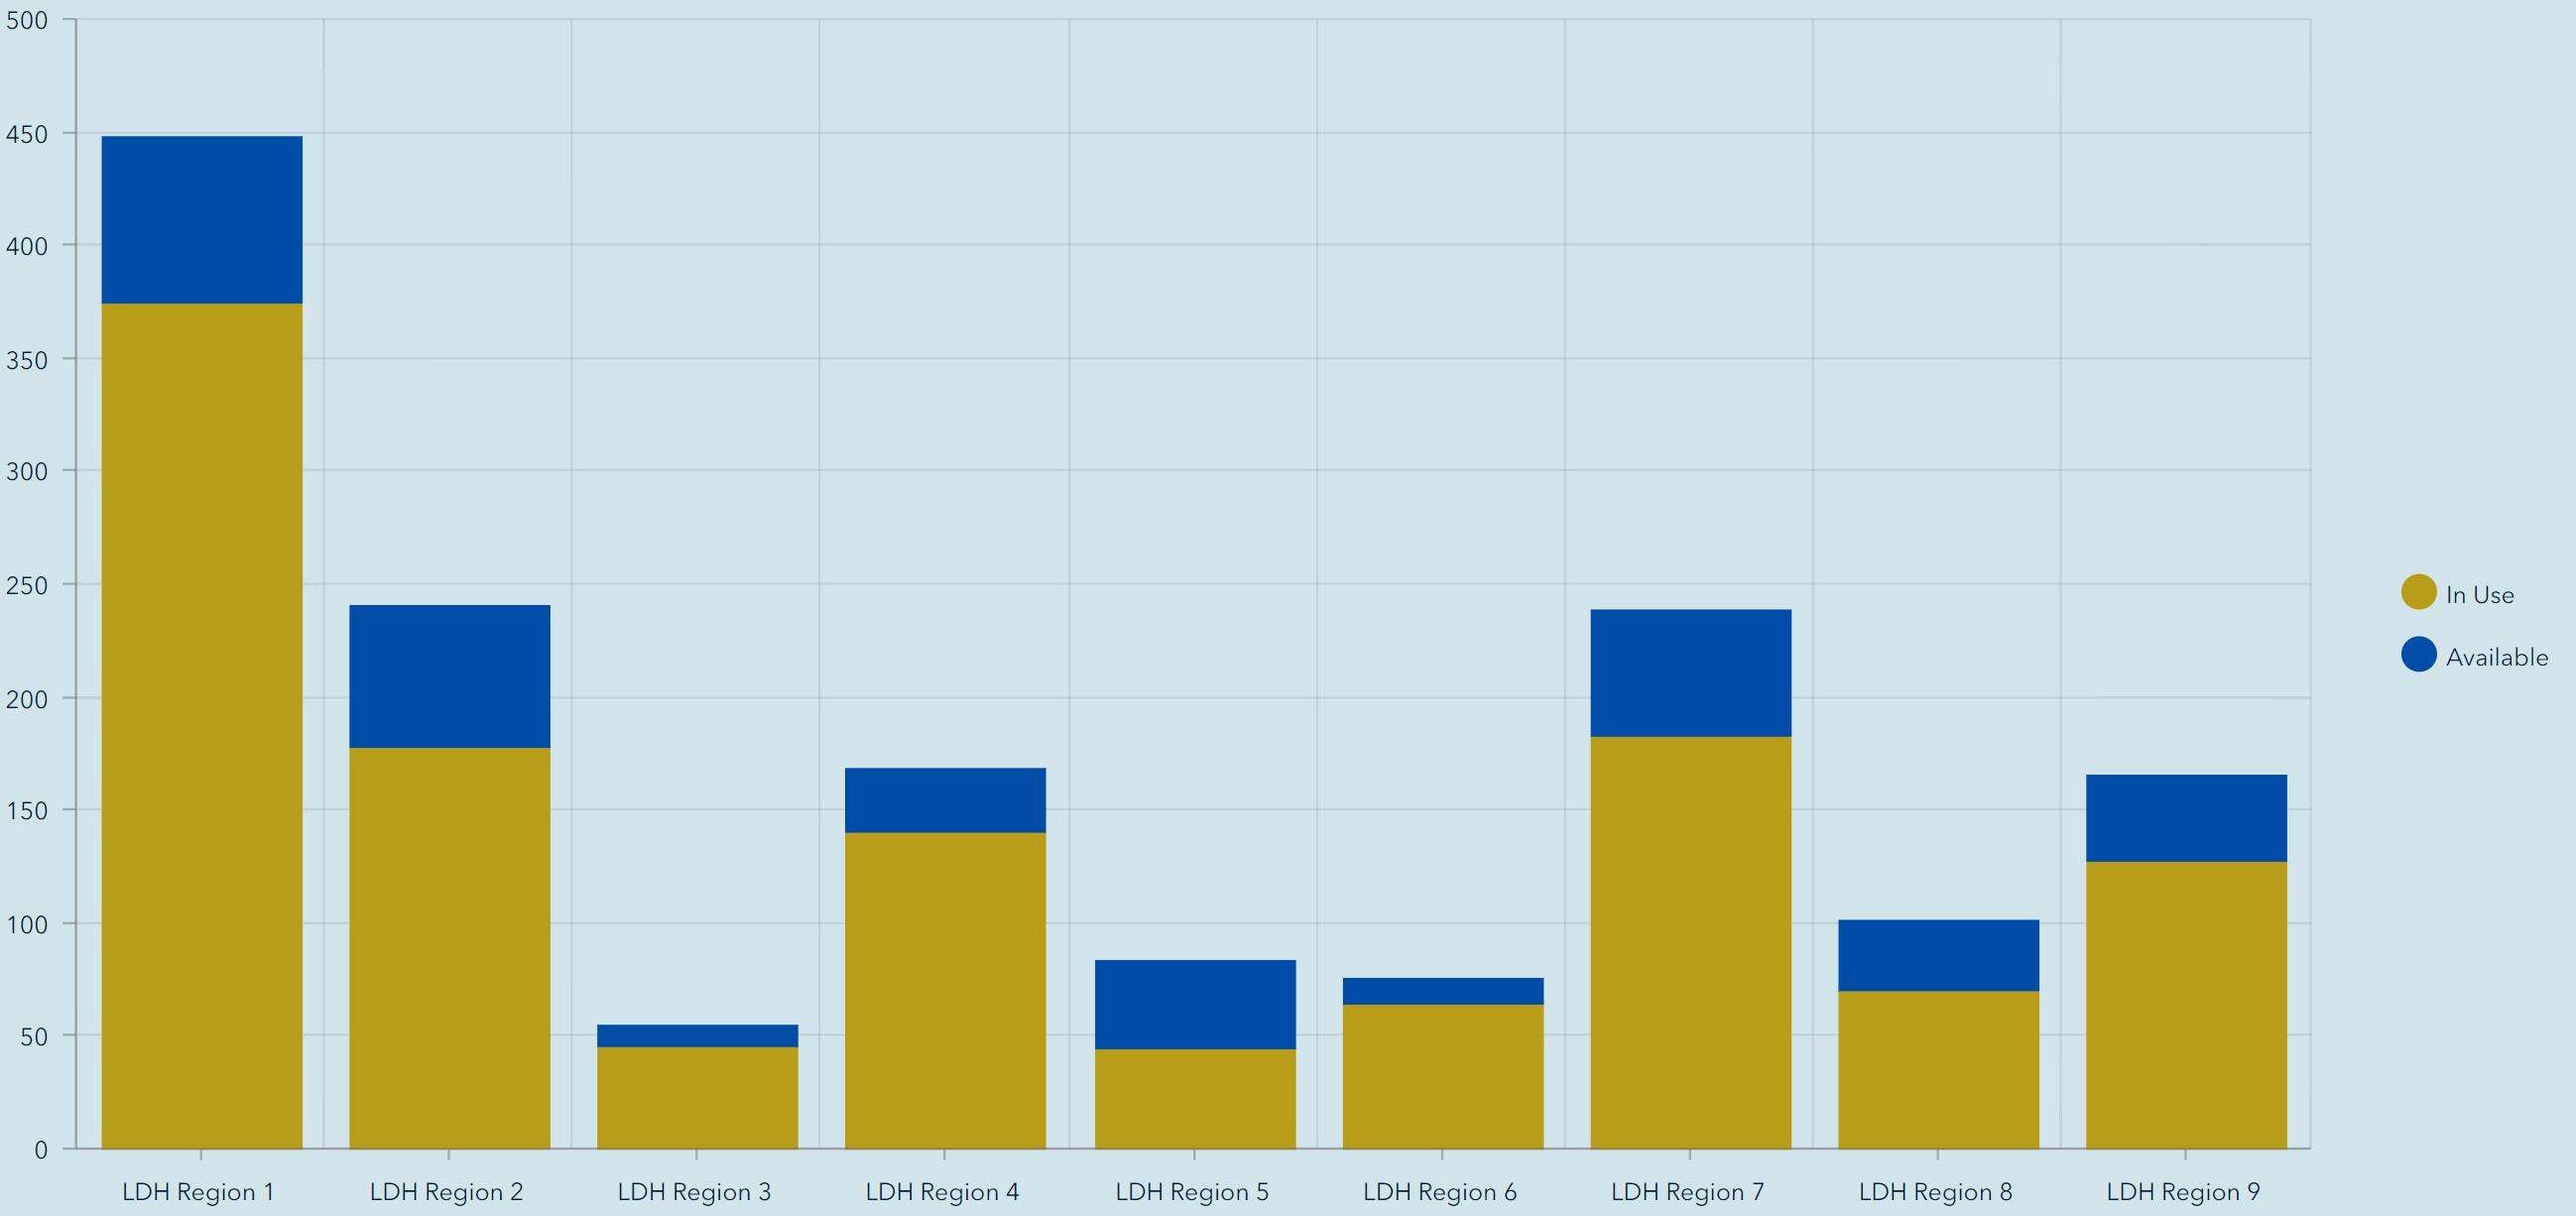
Source: Louisiana Office of Public Health, Region 6 (Central Louisiana), October 17, 2021.
COVID-19 cases (left) and deaths (right) statewide by age group as of October 17, 2021.
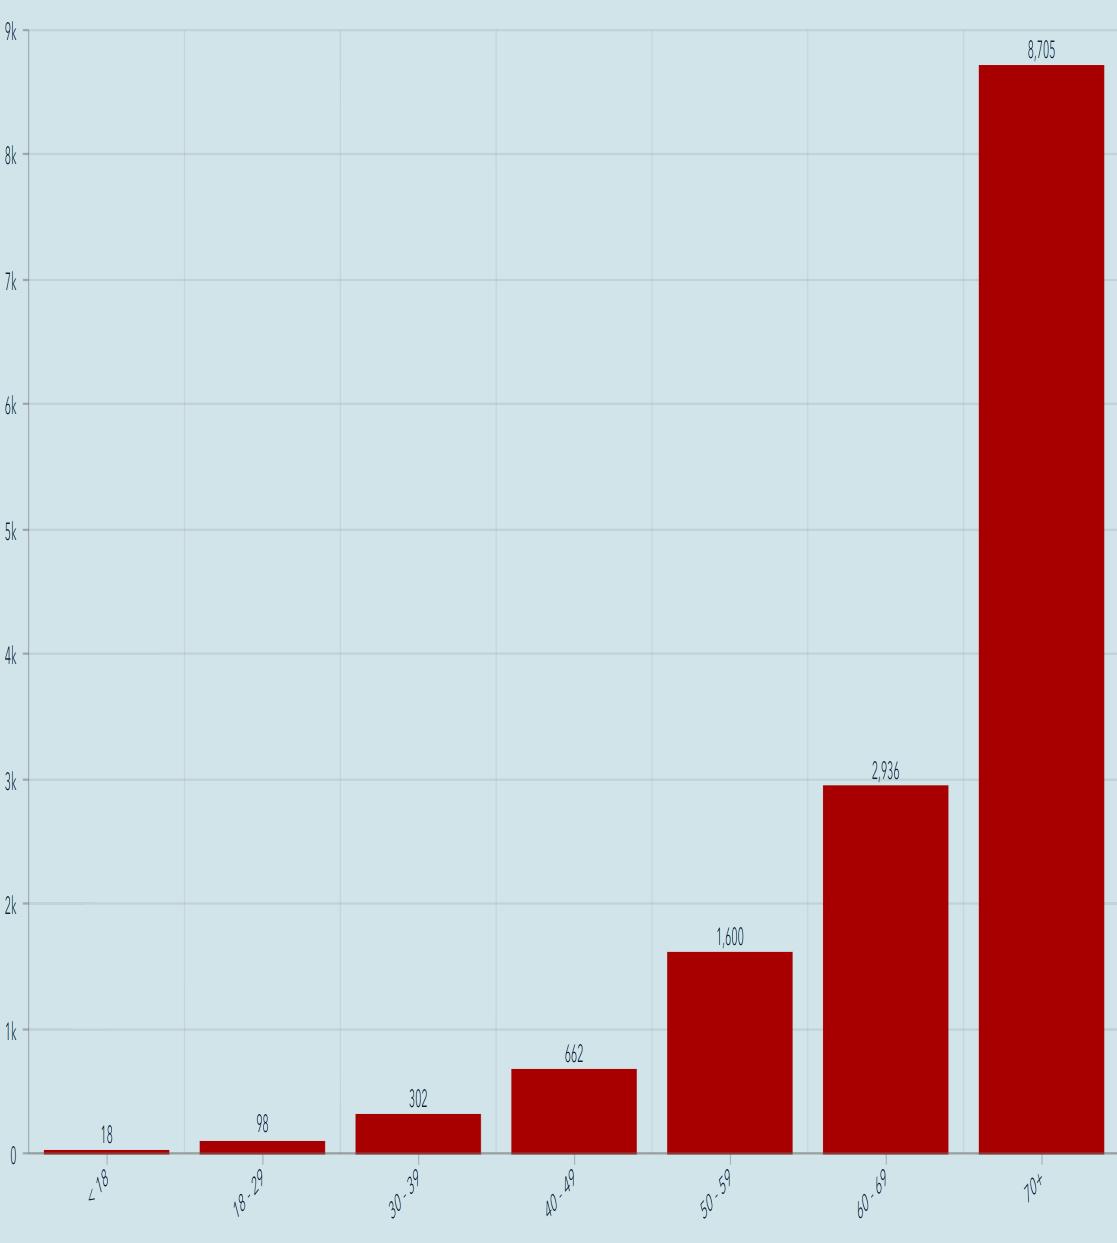
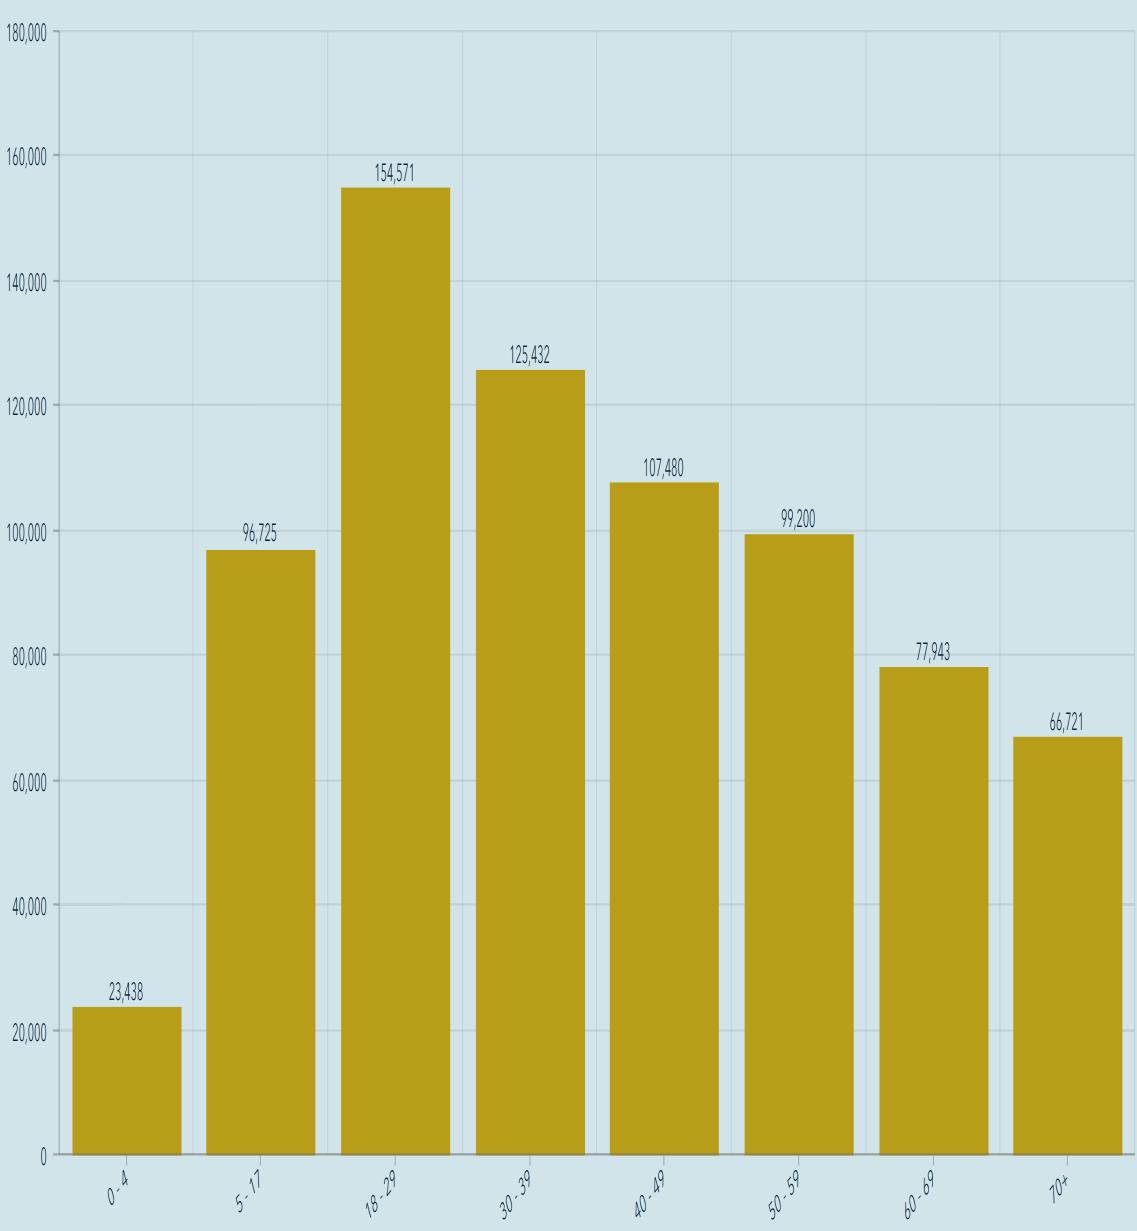
Source: Louisiana Office of Public Health, Region 6 (Central Louisiana), October 17, 2021.
Employed persons in the Alexandria MSA from 2019 – 2021.
InAugust 2021, 61,336 were employed in the Alexandria metro area, a decrease of 614 from July.
July 2021 recorded the highest employment level since July 2016 at 61,950.
Source: Louisiana Workforce Commission, October 13, 2021
The table below shows August 2021 preliminary unemployment rate, labor force, and employment data for central Louisiana parishes.
InAugust, parishes in central Louisiana had an average unemployment rate of 4.7% compared to 5.5% statewide.
At 2.8%, La Salle Parish had the lowest unemployment rate in the state, a record it has held throughout the pandemic.
Grant and Rapides had the 11th and 14th lowest unemployment rate in the state, respectively.
Data Source: Louisiana Workforce Commission, October 17, 2021.
Initial and continued unemployment claims in Louisiana from January to October 2, 2021.


Statewide average weekly initial unemployment claims filed in September rose to 8,714 from 2,260 in August, a 286% increase.
Statewide average weekly continued unemployment claims were little changed in September at 39,327 compared to 39,429 in August.
Following Hurricane Ida, initial claims rose from 2,061 onAugust 28 to 14,056 on September 11, up 582%.
Source: Louisiana Workforce Commission, October 15, 2021
Unemployment Claims in Louisiana January - October 2, 2021
The table below shows August 2021 preliminary unemployment rate, labor force, and employment data for Metropolitan Statistical Areas in Louisiana.
At 3.8%, the Alexandria MSAhad the lowest unemployment rate among the state’s major metro areas for the 16th straight month, down 0.5% from the previous month.
Louisiana’s unemployment rate fell 0.8% inAugust to 5.5% from 6.3% in July.
Data Source: Louisiana Workforce Commission, October 17, 2021.
The table below shows the number of unemployed, number of advertised jobs online, and the ratio of unemployed to advertised job openings online for Metropolitan Statistical Areas in Louisiana in August 2021.
InAugust, the Alexandria MSAhad the tightest labor market in the state with only 0.39 unemployed persons per job opening, down from 0.49 a month earlier.
InAugust, Louisiana had an unemployed to job openings ratio of 0.90 down from 1.16 in July and 1.41 in June.
An overview of sales, vehicle sales, and hotel occupancy taxes collected in the September 2021 reflecting sales activity in August 2021.
Data Source noted in detailed reports.
September 2021


An overview of sales tax revenue in Rapides Parish other towns and cities in September 2021 (excluding Alexandria and Pineville).
Note: Current tax revenue reflects sales activity in prior month.


(TR) Alexandria total sales tax revenue for September with previous month, year, and YTD comparisons.
(BR) Alexandria total monthly sales tax revenue from 2019 to present.
Note: September sales tax revenue reflects sales activity in August.
Data Source: Rapides Parish Police Jury Treasurer’s Reports, October 2021.
Avoyelles Parish total sales tax revenue for September with previous month, year, and year-to-date comparisons. Vehicle and hotel tax revenues are excluded. Data
Avoyelles Parish vehicle sales tax revenue for September with previous month, year, and year-to-date comparisons.
Note: September sales tax revenue reflects sales activity in August.
Data Source: Avoyelles Parish School Board. October 2021
Catahoula Parish total sales tax revenue for September with previous month, year, and year-todate comparisons.
Note: September sales tax revenue reflects sales activity in August.
Data Source: Catahoula Parish Tax Administrator, October 2021
Concordia Parish total sales tax revenue for September with previous month, year, and year-todate comparisons.
Note: September sales tax revenue reflects sales activity in August.
Data Source: Concordia Parish Tax Administrator. October 2021
Evangeline Parish total sales tax revenue for September with previous month, year and YTD comparisons.
Note: September sales tax revenue reflects sales activity in August. Evangeline implemented a 1% sales tax increase July 1, 2021.
Data Source: Evangeline Parish Sales Tax Commissioner. October 2021
Evangeline Parish vehicle sales tax revenue for September with previous month, year and YTD comparisons.
Note: September sales tax revenue reflects sales activity in August. Evangeline implemented a 1% sales tax increase July 1, 2021.
Data Source: Evangeline Parish Sales Tax Commissioner. October 2021
(TR) Grant sales tax revenue for September with previous month, year, and YTD comparisons.
(BR) Grant monthly sales tax revenue from 2019 to present.
Note: September sales tax revenue reflects sales activity in August.
Data Source: Grant Parish Sheriff’s Office, October 2021.
La Salle Parish total sales tax revenue for September with previous month, year, and year-todate comparisons.
Note: September sales tax revenue reflects sales activity in August.
Data Source: La Salle Parish Tax Administrator, October 2021

(TR) Pineville sales tax revenue for September with previous month, year, and YTD comparisons.
(BR) Pineville monthly sales tax revenue from 2019 to present.
Note: Current sales tax revenue reflects sales activity in the prior month.
Data Source: Rapides Parish Police Jury Treasurer’s Reports, October 13, 2021.
Rapides Parish occupational license revenue YTD with previous YTD comparisons.
Note: Rapides Parish reflects unincorporated areas.
Data Source: Rapides Parish Police Jury Treasurer’s Reports, October 2021.
(TR) Rapides Parish sales tax revenue for September with previous month, year, and YTD comparisons.
(BR) Rapides monthly sales tax revenue from 2019 to present.
Note: Current sales tax revenue reflects sales activity in the prior month.
Rapides Parish vehicle sales tax revenue for September with previous month, year, and YTD comparisons.
*August sales data of $3,173,721 was for two months and therefore evenly split between July andAugust 2021 reports.
Data Source: Rapides Parish Police Jury Treasurer’s Reports, October 2021.
St. Landry Parish sales tax revenue for September with previous month, year, and YTD comparisons.
Note: September sales tax revenue reflects sales activity in August.
Data Source: Tax revenue data from St. Landry Parish School Board. October 2021
St. Landry Parish vehicle sales tax revenue for September with previous month, year, and YTD comparisons.
Note: September sales tax revenue reflects sales activity in August.
Data Source: Tax revenue data from St. Landry Parish School Board. October 2021
Remote seller tax revenue is tax revenue from online sales by location of the seller at the time of purchase.
Total Remote Sellers Sales Tax Collection in Cenla
August 2020 - September 2021
SinceAugust 2020, $17.2 million in sales tax revenue have been collected from online sales in central Louisiana with Rapides collecting $5.2 million. Online sales tax revenue in Cenla increased 1% in September from August.
Note: Sales tax revenue collected in September reflects sales activity inAugust.
Data Source: Louisiana Sales and Use Tax Commission for Remote Sellers. August 2020 – October 2021
Remote seller tax revenue by parish with month-over-month and year-over-year comparisons.
Total online sales tax revenue in Cenla in September increased 63% from a year earlier.
Note: Sales tax revenue collected in September reflects sales activity inAugust.
Data Source: Louisiana Sales and Use Tax Commission for Remote Sellers. August 2020 – October 2021
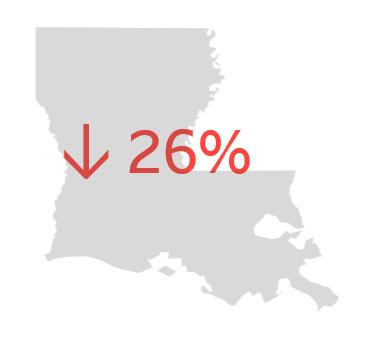
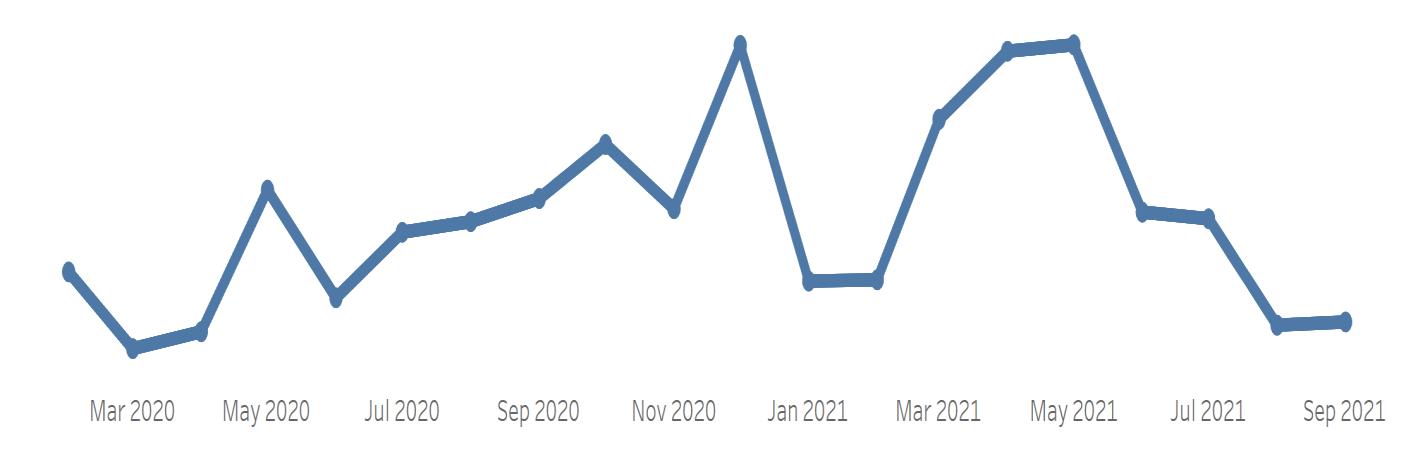
Remote sellers tax revenue from online sales in Rapides Parish from July 2020 – September 2021.
Note: Sales tax revenue collected in one month reflects sales activity in the prior month.
Data Source: Louisiana Sales and Use Tax Commission for Remote Sellers. August 2020 – October 2021

(TR) Louisiana tax revenue from all sources for September with previous month, year, and YTD comparisons.
(BR) Louisiana monthly tax revenue from 2019 to present.
The valuation (estimated development cost) of new commercial construction permits issued by the City of Alexandria in September 2021 with previous month, year, and YTD comparisons.
The valuation (estimated development cost) of new residential construction permits issued by the City of Alexandria in September 2021 with previous month, year, and YTD comparisons.
This chart shows the valuation of permits issued by Rapides Area Planning Commission in Allen Parish in September between 2018-2021 with monthto-month, year-to-year, and year-to-date comparisons.
Data Source: RapidesArea Planning Commission, October 2021
This chart shows the valuation of permits issued by Rapides Area Planning Commission in Avoyelles Parish in September between 2019-2021 with month-tomonth, year-to-year, and year-to-date comparisons.
Data Source: RapidesArea Planning Commission, October 2021.
This chart shows the valuation of permits issued by Rapides Area Planning Commission in Evangeline Parish in September between 2018-2021 with month-tomonth, year-to-year, and year-to-date comparisons.
Data Source: RapidesArea Planning Commission, October 2021.
This chart shows the valuation of permits issued by Rapides Area Planning Commission in the City of Pineville in September between 2018-2021 with month-to-month, year-to-year, and year-to-date comparisons.
Data Source: RapidesArea Planning Commission, October 2021.
This charts shows the valuation of permits issued by Rapides Area Planning Commission in Rapides Parish (excluding Alexandria) in September between 2018-2021 with month-to-month, year-to-year, and year-to-date comparisons.
Data Source: RapidesArea Planning Commission, October 2021.
New residential construction permit valuation (estimated development cost) issued by Rapides Area Planning Commission by jurisdiction in September 2021 compared to September 2020.
Year-over-year value of residential construction in the RAPC jurisdictions increased from $6.6 million in September 2020 to $9.2 million in September 2021.
Note: City ofAlexandria permits are accounted for separately.
Data Source: RapidesArea Planning Commission, October 2021.
Valuation of New Residential Construction
September 2020 vs September 2021
The chart represents the Lumber Price Index in the U.S. from January 2020 – August 2021.
Monthly Price Index of Lumber 2020 - 2021
In September 2021, the US Lumber Price Index declined -3% from the previous month, the fourth consecutive monthly decline.
The US Lumber Price Index nears the November 2020 level.
The US Lumber Price Index in August was -14% below January’s level.
Data Source: Fed Reserve Economic Database, St. Louis Federal Reserve Bank, October 15, 2021.

The count of active single-family and condo/townhome listings for Alexandria MSA (excludes pending listings) for September 2018-2021 with month-to-month and year-over-year comparisons.
Active listings in September increased 12% over the previous month but remain -18% below a year ago.

The count of pending single-family and condo/townhome listings for Alexandria MSA for September 2018-2021 with month-tomonth and year-over-year comparisons.
Pending listings were unchanged over last month but are -8% below a year ago.

Median days on the market fell -4% in September from previous month and was -23% below a year ago.
Homes took an average of 51 days on the market to sell in September, down from 67 days the same month in 2020 and 88 in 2019.
The median number of days property listings spend on the market in Alexandria MSA for September 2018-2021 with month-to-month and year-over-year comparisons. Data Source:

The median listing price of houses in Alexandria MSA for September 2018-2021 with month-to-month and year-over-year comparisons.
The median listing price in September fell -5% to $170,500 from the previous month of $179,700, and still remains -24% below a year ago.

The average listing price of houses in Alexandria MSA for September 2018-2021 with month-to-month and year-over-year comparisons.
The average listing price fell -5% to $220,586 this month from $232,620 last month and is -19% below the year ago.
The graph illustrates the number of visitors at Louisiana Welcome Centers from 2018 to 2021.
Welcome Center visitors inAugust 2021 were down 55% from July 2021.
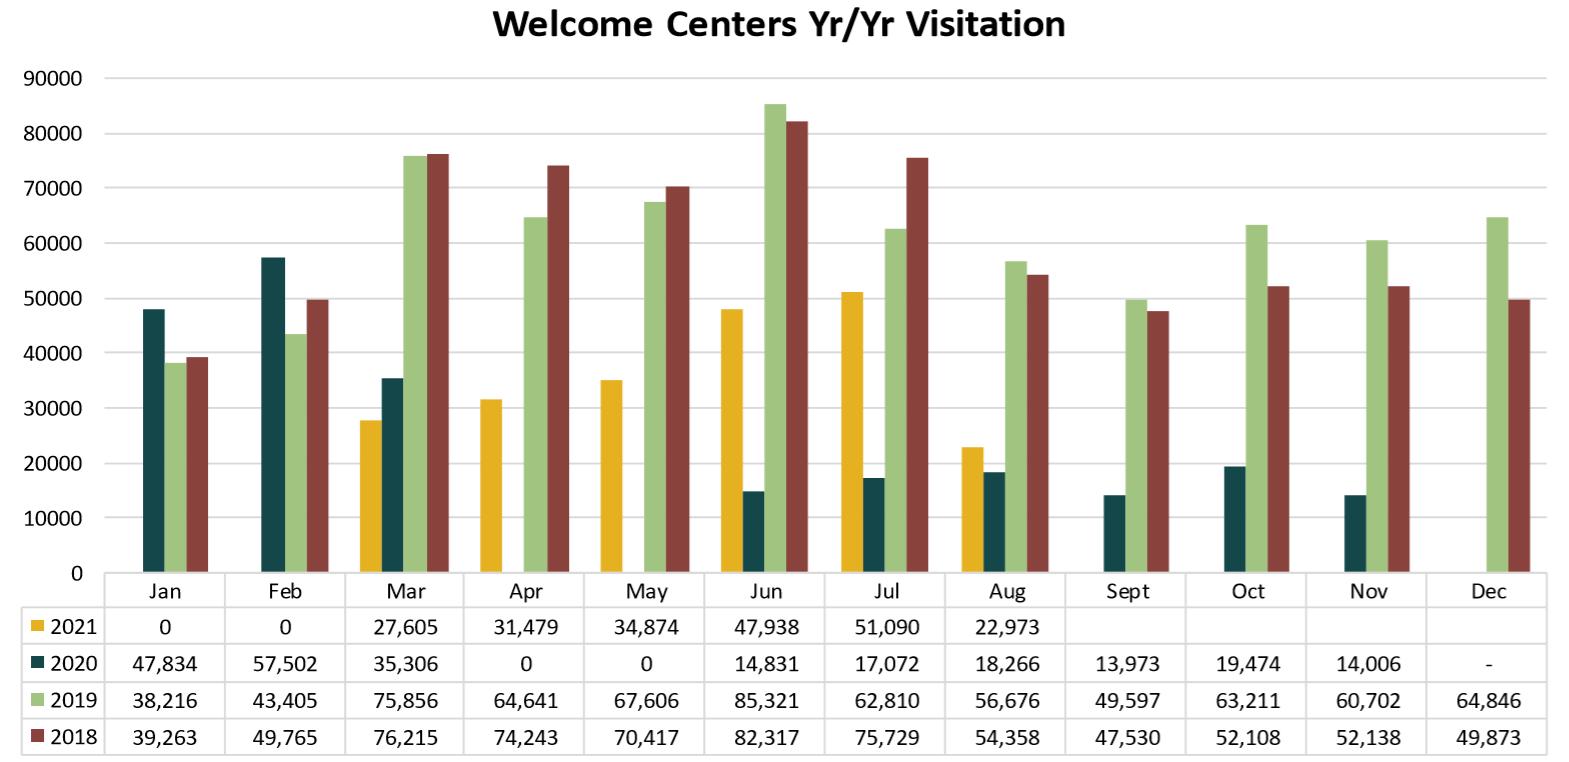
InAugust, Louisiana’s welcome centers recorded the first monthly decline in traffic since March.
Data Source: Louisiana Department of Culture, Recreation, & Tourism, October 3, 2021
Avoyelles Parish hotel occupancy tax revenue for September with previous month, year, and year-to-date comparisons.
Note: September tax revenue reflects hotel occupancy activity in August. Hotel occupancy tax revenue is used as a proxy for hotel occupancy rate.
Data Source: Avoyelles Parish School Board. October 2021.
Rapides Parish hotel occupancy tax revenue for September with previous month, year, and YTD comparisons.
Note: Sepember tax revenue reflects hotel occupancy activity inAugust. Hotel occupancy tax revenue is used as a proxy for hotel occupancy rate.
Data Source: Rapides Parish Police Jury Treasurer’s Reports, October 2021.
This chart shows total passenger throughput at AEX and other Louisiana airports in September 2021 as a percent of traffic in 2019. AEX is the solid black line.
Passenger Throughput at AEX as a Percent 2019 Traffic (September 2021)
AEX had an 88% passenger throughput in the state in September 2021 compared to the September 2019 level. The state averaged 40%.
Data Source: Alexandria International Airport, October 2021


Nationwide daily percentage of passengers passing through current TSA checkpoints in 2021 expressed as a percentage of 2019 traffic.
U.S. Airport Passenger Throughput Traffic in 2021 as a Percent of 2019 Traffic
Nationally, air passenger traffic in September was down -8% over August and down -16% since July.
Average US passenger traffic showed signs of improving in late September.
Data Source: DHS, Transportation Security Administration, https://www.tsa.gov/coronavirus/passenger-throughput, October 3, 2021
This data shows year-overyear seated diners at restaurants on the OpenTable network in Louisiana. Yearover-year comparisons by day compare the same day of the week from the same week in the previous year.
• Dinner reservations in Louisiana have not broken the downtrend that started in mid-July.
• Compared to January 2020, September 2021 reservations were down -48%, -29% in August, and -23% in July.
Source: OpenTable, https://www.opentable.com/state-of-industry, October 3, 2021
OpenTable Reservations in Lousiana Percent Change Over Year Ago
Feb. 2020 - Present
Total gasoline sales in Louisiana in 2019 - 2021.


July 2021 gasoline sales fell -6% from June but was 1% above July 2020.
Gasoline sales YTD in July are 7% above the same period in 2020.
Data Source: U.S. Energy Information Administration, Prices, Sales Volumes & Stocks by State, October 3, 2021


The chart below represents the weekly number of new businesses applications in Louisiana from 2019-2021
Year-to-date the number of new business applications in Louisiana in 2021 grew 22% over 2020.
Note: Data reflects businesses applications, not necessarily business formations.
Data Source: U.S. Census Bureau, Business Formation Statistics, Retrieved October 2, 2021.
The chart below represents the number of new businesses established each month in Rapides from January 2019 through September 2021.


The number of new businesses established in Rapides in September 2021 fell -34% fromAugust and was -23% lower than September 2020.
Year-to-date new businesses in Rapides are up 28% over 2020.
Note: Data reflects businesses established in the current month.
Data Source: Rapides Parish Sales and Use Tax Department, October 2021.
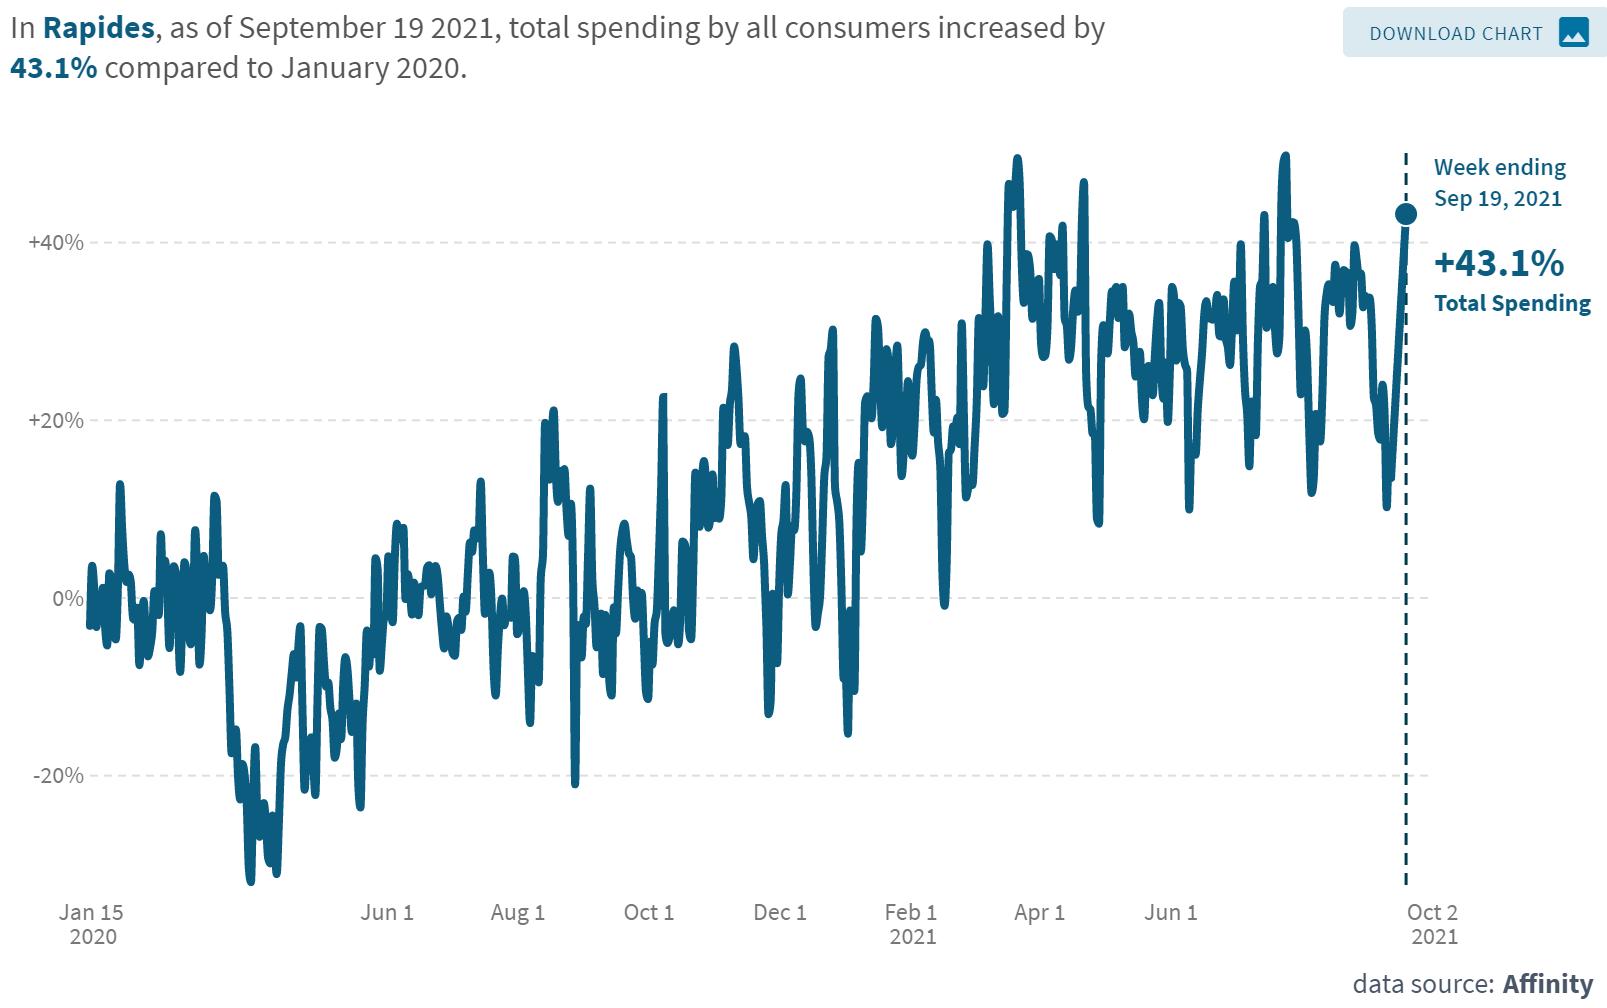
These graphs represents the percent change in average consumer credit and debit card spending in Louisiana as of September 19, 2021 with January 2020 as the baseline.
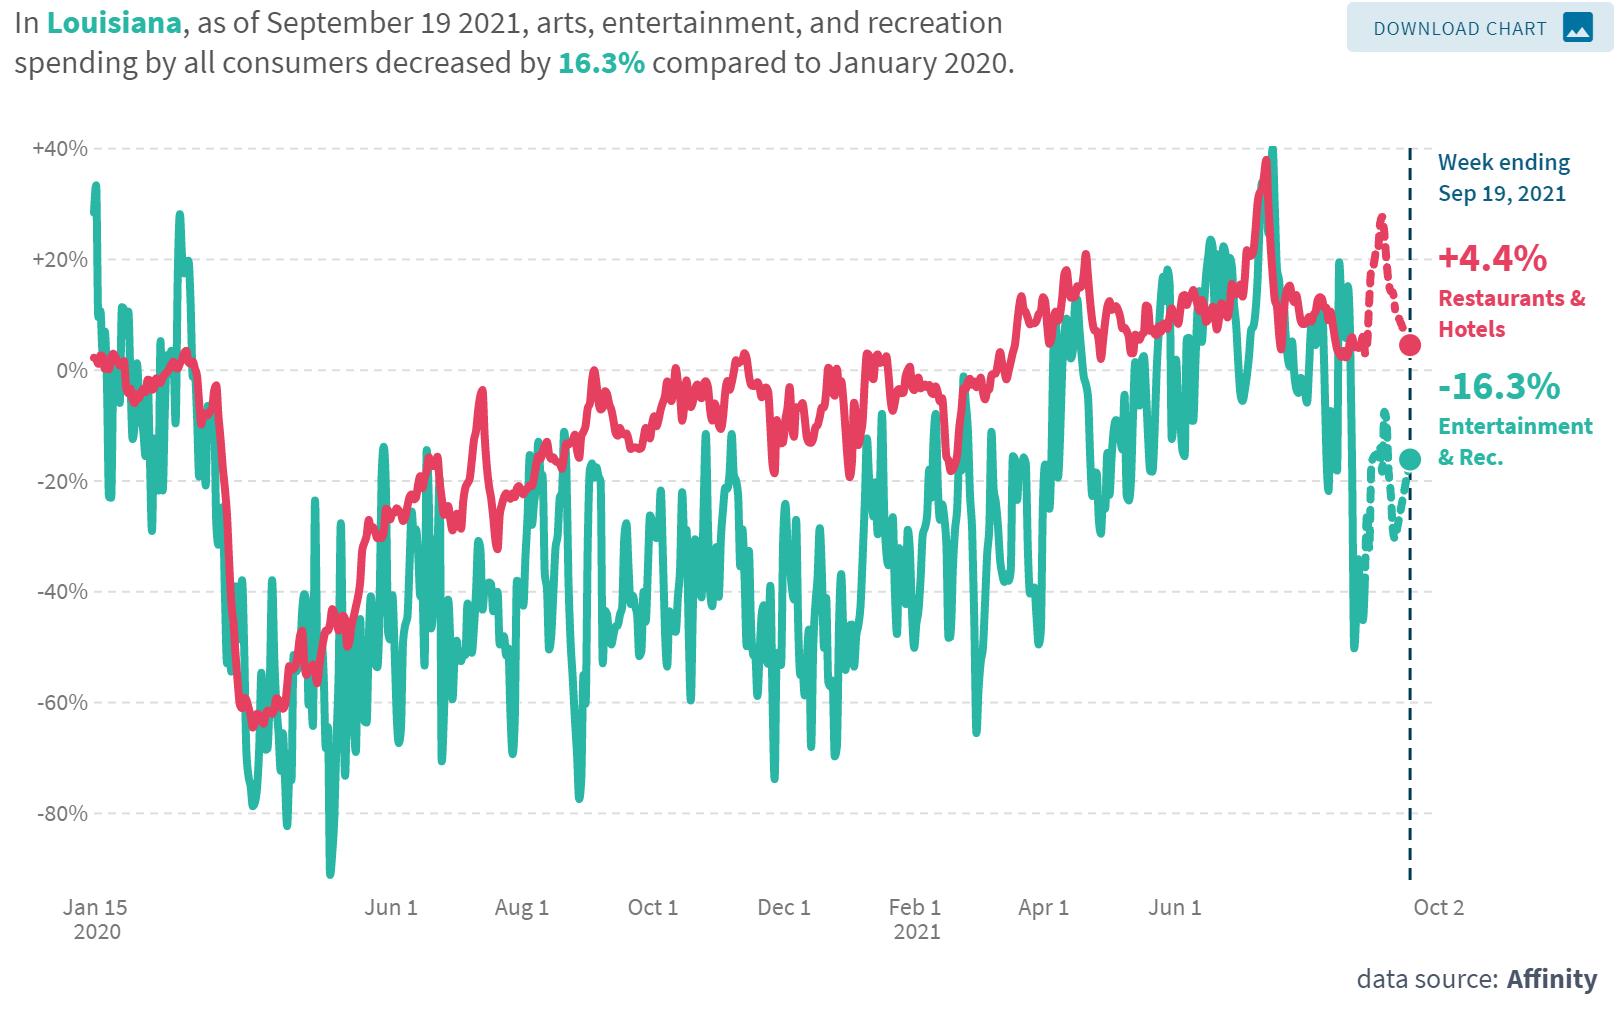
Total consumer spending in Louisiana was 18% over the baseline.
From mid-August to midSeptember, grocery spending increased from 15% to 18% while retail spending remained steady at 32% above January 2020.
• Compared to the January 2020 baseline, total consumer spending on September 19, 2021 in Louisiana was up 18%, with retail and grocery spending leading with 32% and 18% increases over January 2020. Entertainment was down -16%, restaurant and hotel spending up 4%, and healthcare spending up 9%.
The table and chart represents the percent change in average consumer credit and debit card spending in Cenla as of September 19, 2021 with January 2020 as the baseline, while the chart represents Rapides.
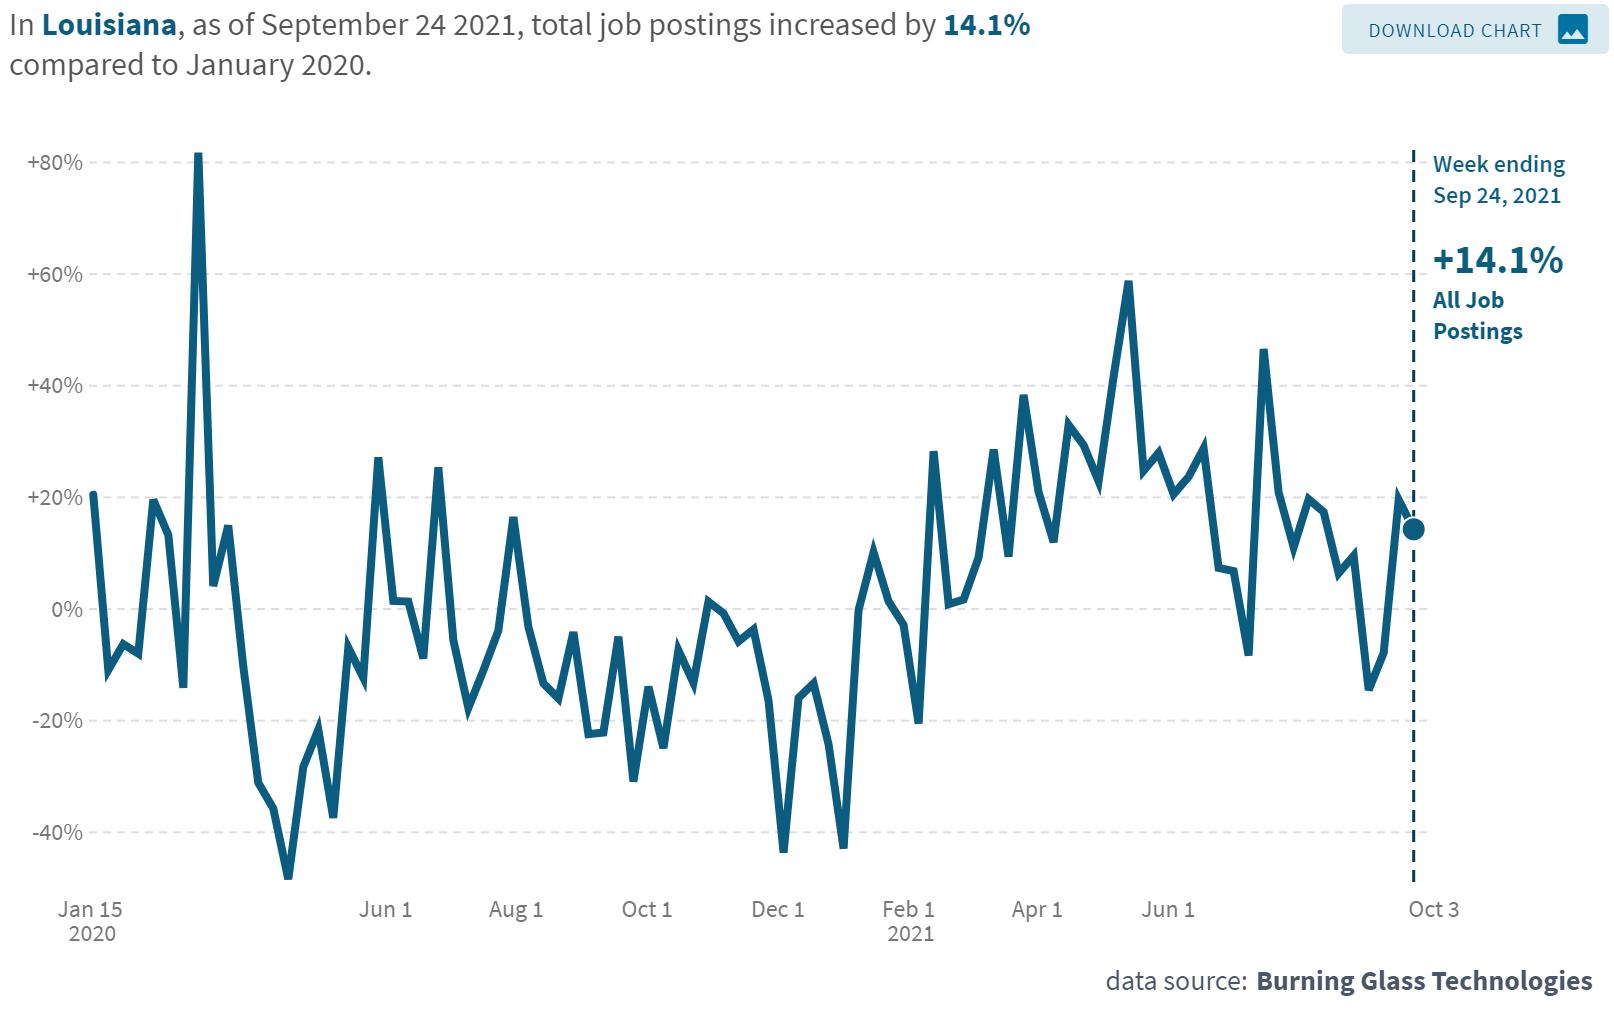
The chart below represents the percent change in job posting by industry in Louisiana as of September 24, 2021 with January 2020 as the baseline.
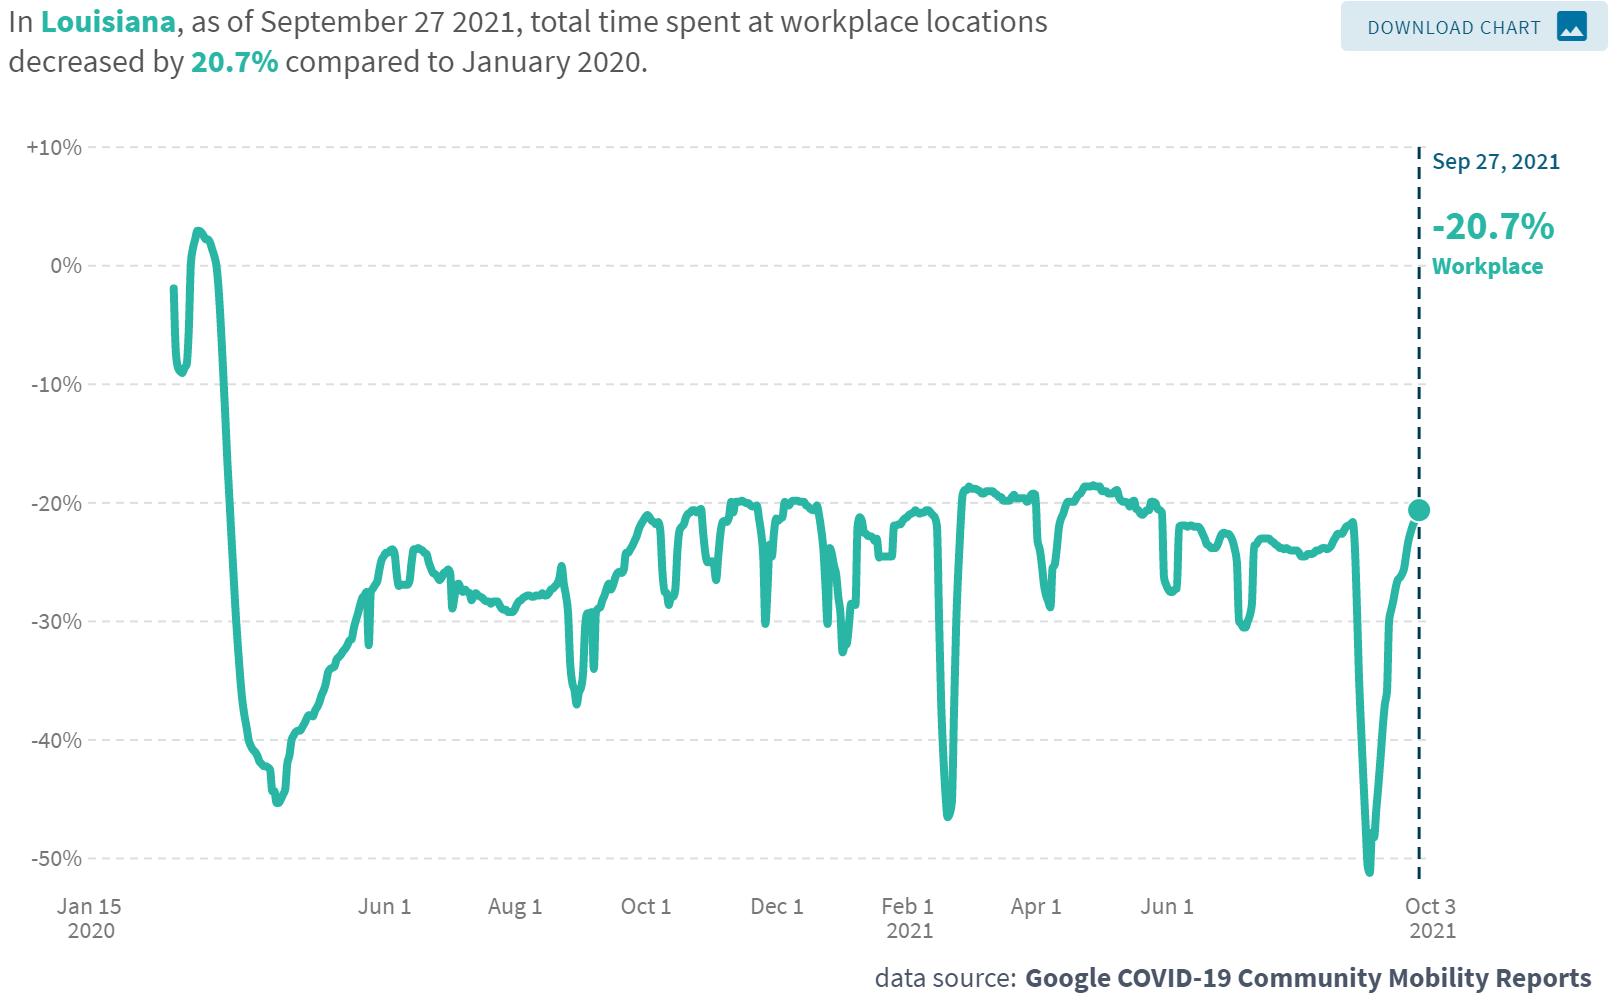
The chart represents the percent of time employees in Cenla and statewide spent at work as of September 27, 2021 with January 2020 as the baseline.
The Coincident Economic Activity Index for Louisiana is set to match the trend in the gross state product and includes four indicators: nonfarm payroll employment, the unemployment rate, average hours worked in manufacturing and wages and salaries. The column graph below represents the percentage change in the index. A positive percentage represents an expanding statewide economy.
Louisiana Coincident Economic Activity Index 2020 - 2021
The Index for August 2021 increased 0.69% over July.
The Index has had positive increases for 15 consecutive months, which indicates a continuation of the economic recovery.
Represents the number of drilling rigs actively exploring for or developing oil or natural gas in Louisiana and the U.S. in 2021


Rig count in Louisiana fell by 10 rigs or 20% in September fromAugust as a result of Hurricane Ida.
All 15 offshore rigs were shut down the week following Ida and only half were operational at month’s end.
Nationwide, the rig count is up 98% from a year ago.
Source: Baker Hughes, https://rigcount.bakerhughes.com/na-rig-count, October 3, 2021
Gaming revenue in Louisiana for August 2021 with previous month and year comparisons.
Data Source: Louisiana Gaming Control Board, October 6, 2021. http://lgcb.dps.louisiana.gov/revenue_reports.html
New auto sales in U.S. and Louisiana.
Data Source: Foureyes, October 15, 2021.
U.S. New Auto Sales

U.S. Daily Sales for September 2021

U.S. economic indicators for August 2021.
Data Source: U.S. Census, https://www.census.gov/economic-indicators/ October 3, 2021.
The data presented throughout the CENLA Economic Dashboard reflects contributions from the following local organizations.
• Rapides Parish Policy Jury Treasurer
• Rapides Sales TaxAdministrator
• Avoyelles Parish School Board
• Alexandria International Airport
• RapidesArea Planning Commission
• City ofAlexandria Planning Division
• Evangeline Parish Sales Tax Commissioner
• Concordia, Catahoula, & La Salle TaxAdministrator
• Louisiana Office of Public Health, Region 6
• St. Landry Parish School Board
• Grant Parish Sheriff’s Office
Also, special thanks to the following partners for distributing the dashboard.
Next Issue: Week of Nov. 15th
• LSUAFoundation
• Central Louisiana Regional Chamber of Commerce
• Marksville Chamber of Commerce
• Bunkie Chamber of Commerce
• Evangeline Chamber of Commerce
• Concordia Chamber of Commerce
• St. Landry Chamber of Commerce
• Greater Vernon Chamber of Commerce
Current and past issues of the CENLAEconomic Dashboard can be found at http://www.lsua.edu/coronavirus/cenla-economic-dashboard/