LSUACENLA ECONOMIC DASHBOARD
August 20, 2021.
Dr.RandallDupont Dean,CollegeofBusiness
LouisianaStateUniversityofAlexandria
rdupont@lsua.edu


August 20, 2021.
Dr.RandallDupont Dean,CollegeofBusiness
LouisianaStateUniversityofAlexandria
rdupont@lsua.edu
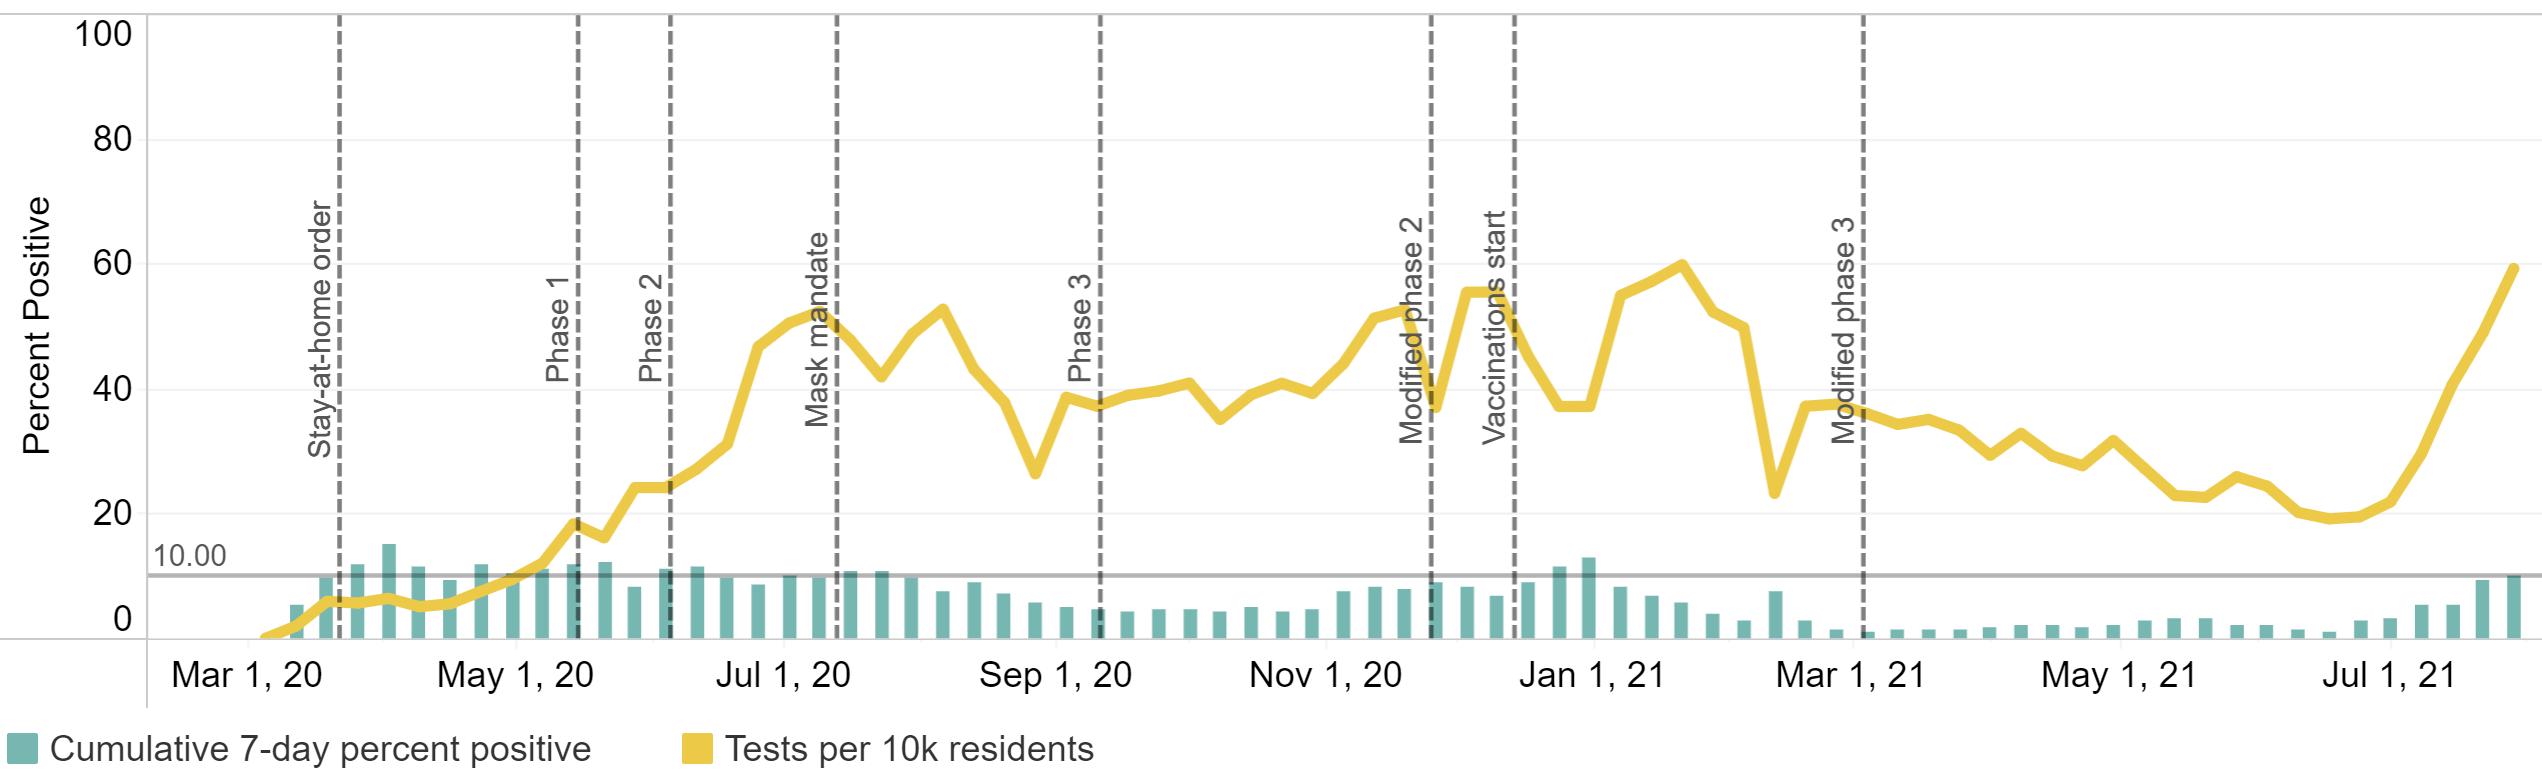
Region 6 (central Louisiana) continues to rank as the second lowest vaccinated region in the state with just 30% of the population fully vaccinated, up from 27% in July. Last month we saw the beginning of new upward trend in Covid cases. We are now fully engulfed in the fourth wave which has already exceeded the third wave in the number of cases. Young adults are leading the 4th wave with 18-29 year olds reporting the highest case numbers, followed by 30-39 year olds. Elderly (60+) have been the least impacted. Every parish is considered in the highest risk. Hospitalizations for Covid for Region 6 have already exceeded the third wave, but not deaths. Available ICU beds are almost nonexistent in this region.
The unemployment rate in Cenla rose to 6.3% in June compared to 7.4% for the state. Rapides reported a 5.2% unemployment rate, up from 4.6% in May and well below the state rate.
Hiring pressures have eased slightly in the Alexandria MSAand statewide, but remain challenging. Currently, there are three job openings for every two unemployed inAlexandria, while the state average is three unemployed for every two openings. For over a year, the Alexandria MSAhas had the lowest unemployment rate in the state among metro areas. In June it stood at 5.1% with New Orleans reporting the highest rate at 8.9%.
Statewide initial unemployment claims fell -16% in July while continued claims fell only -3%.

Changes in consumer spending are measured by changes in sales tax revenue. Sales taxes collected in July reflect activity in June. Spending in June was mixed compared to May, with five of the nine jurisdictions reporting increases for the month. Year-to-date comparisons remain very positive with consumer spending up between 11% to 55% so far this year. Vehicle sales were mixed for the month ranging from -9% inAvoyelles to +8% in St. Landry. However, yearto-date vehicle sales are up 25% or more in the region.
Any adverse impact from the 4th wave is not yet evident in travel data, except for a leveling off of passenger traffic after the July 4th holiday. Travelers have been taking to the road and sky again since the Spring. Statewide air passenger traffic increased month-over-month in July from 74% to 84% of the 2019 level, outpacing the nationwide increase from 74% to 80%.AEX continues to lead recovery of the air transportation sector statewide, with passenger traffic in July at 110% of the 2019 level.
Hotel occupancy was up double digits across the board in Rapides andAvoyelles. Rapides had increases of 11% in June over May while Avoyelles had a 17% in the same period. Both parishes are seeing occupancy rates of more than 30% higher for the year.
Gasoline sales in May, the latest available data, remained level with April and were 17% above May 2020.
On a monthly basis, permit data sends a mixed signal on construction. However, year-to-date data paints a clearer picture. Commercial permits inAlexandria are up 33% for the year while the value residential permits are up 71%. So far this year permit valuations issued inAllen parish are up 38%,Avoyelles 58%, Evangeline 162%, and Rapides parish 1330%! Most of the increase results from commercial permits.
Lumber prices have fallen 21% in July from the previous month, perhaps because residential construction fell -7% in June.Active listing continue to be low. The short supply of houses on the market means houses are still selling fast. The number of days a listing stays on the market eased some from 38 to 41 days, but homes are selling in half the time as a year ago. The median listing price remained unchanged from June at $180,000, while the average listing price fell 4% to $242,000.
New business growth continues strong in central Louisiana. The number of new businesses established in Rapides in July 2021 rose 19% from June and was 6% higher than the same month last year. Year-to-date new businesses in Rapides are up 36% over 2020. Occupational licenses tell a similar story. So far in 2021, licenses are up 4% for the year in Rapides with rural areas of the parish growing the fastest at 9%.
COVID-19 vaccinations as a percent of region population as of August 18, 2021.
Region 6 continues to have the second lowest vaccination rate in the state with 30% of the population vaccinated, up from 27% in July.
Region 1 (New Orleans) and Region 2 (Baton Rouge) have the highest rates of vaccination at 51% and 42%, respectively.
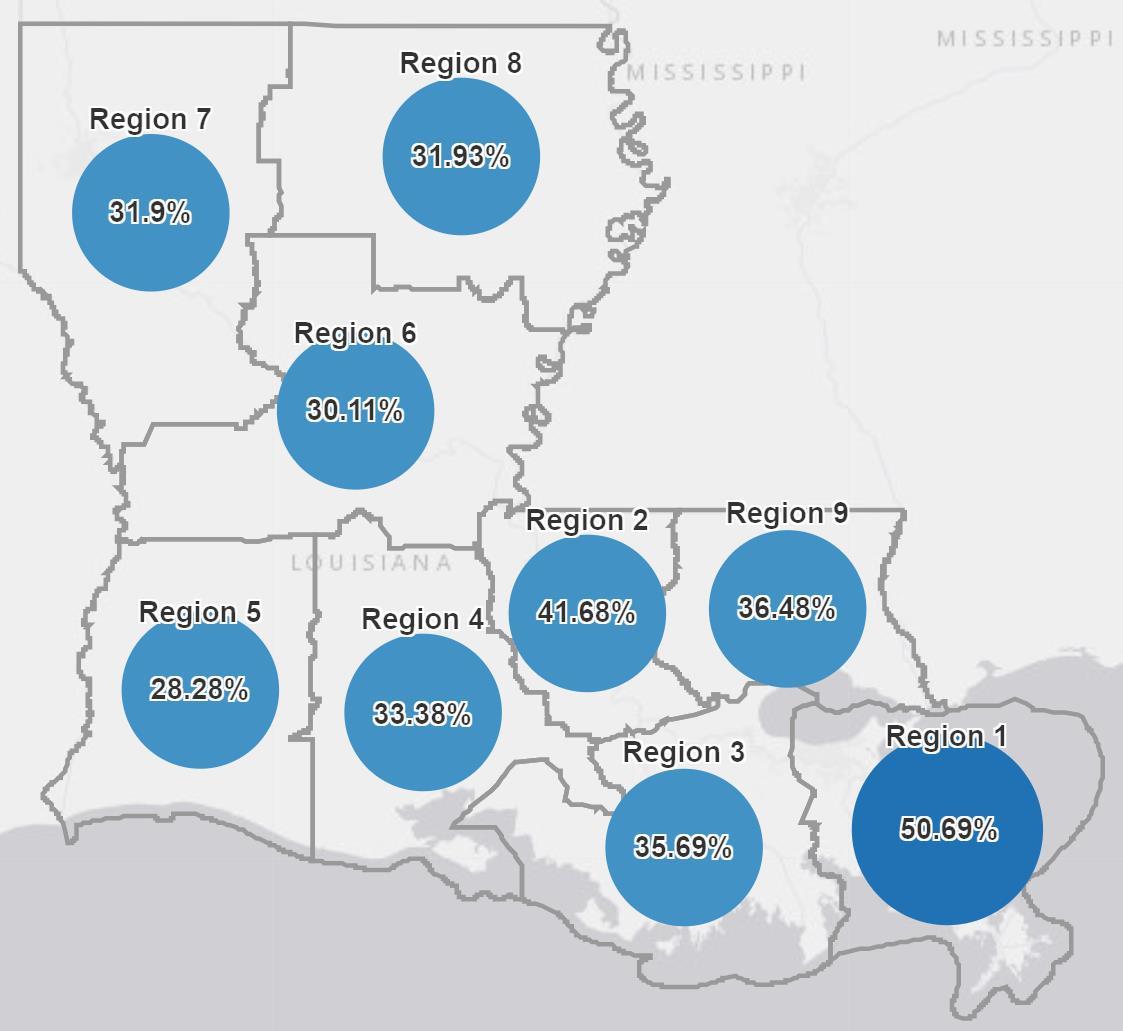
Source: Louisiana Office of Public Health, https://ldh.la.gov/covidvaccine, August 18, 2021
COVID-19 vaccinations as a percent of parish population as of August 15, 2021.
Rapides and Evangeline have the highest percentage of completed vaccinations in Region 6 at 35% and 32% respectively, up from 31% and 29% a month ago.
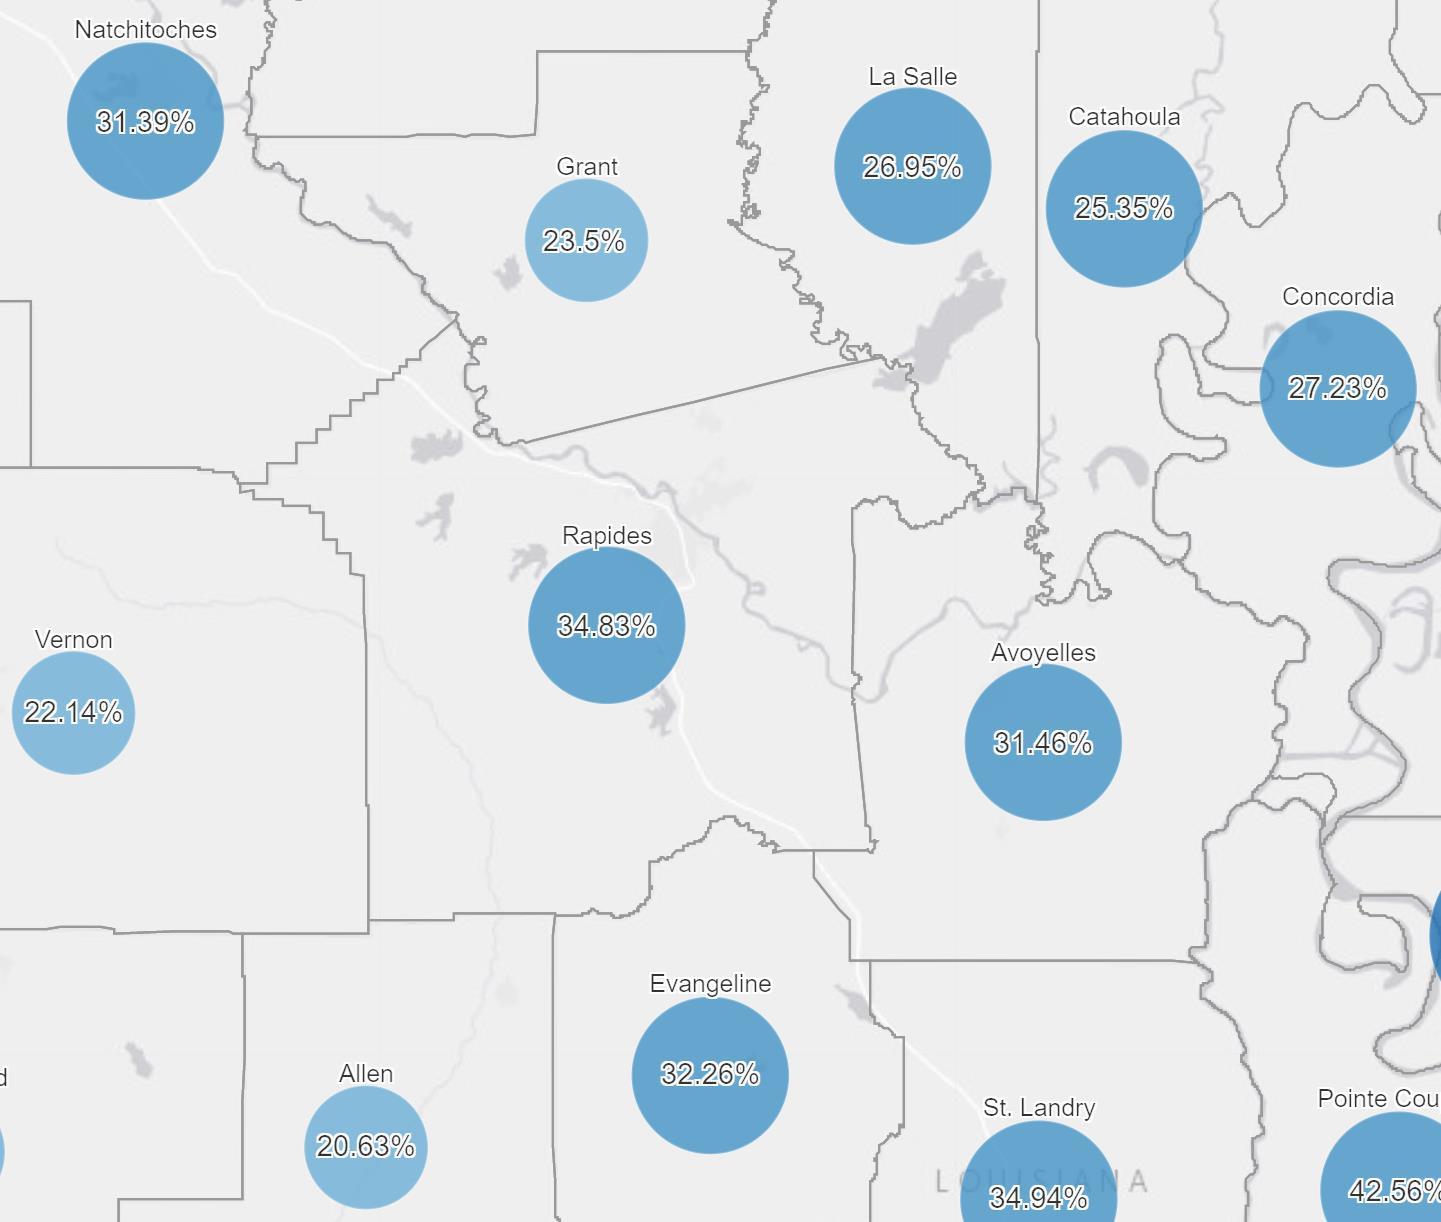
Since the last report,Avoyelles increased from 28.7% to 31.5%, Natchitoches from 29.4% to 31.4%, Vernon from 18.8% to 22.1%, and LaSalle from 23.4% to 27.0%.
Source: Louisiana Office of Public Health, https://ldh.la.gov/covidvaccine, August 15, 2021
COVID-19 cases by collection date as of August 18, 2021 in Region 6 with a 7day moving average.
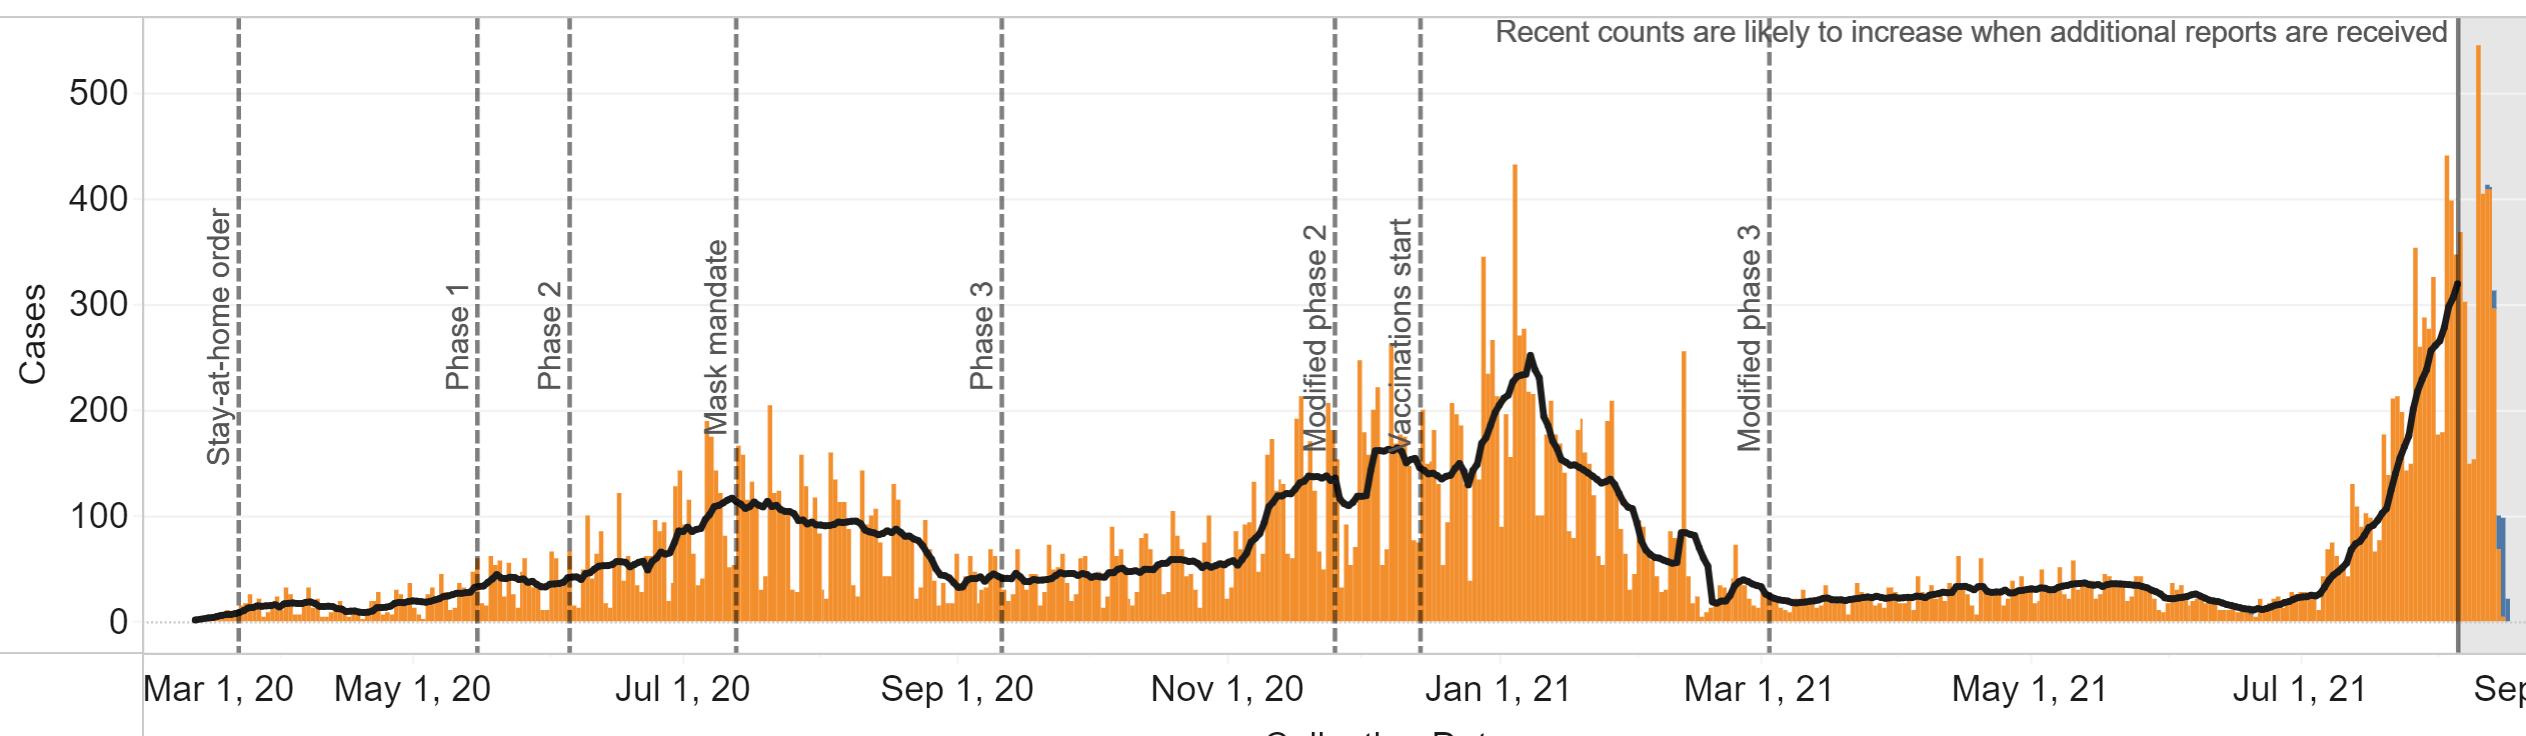
Source: Louisiana Office of Public Health, Region 6 (Central Louisiana), August 18, 2021.
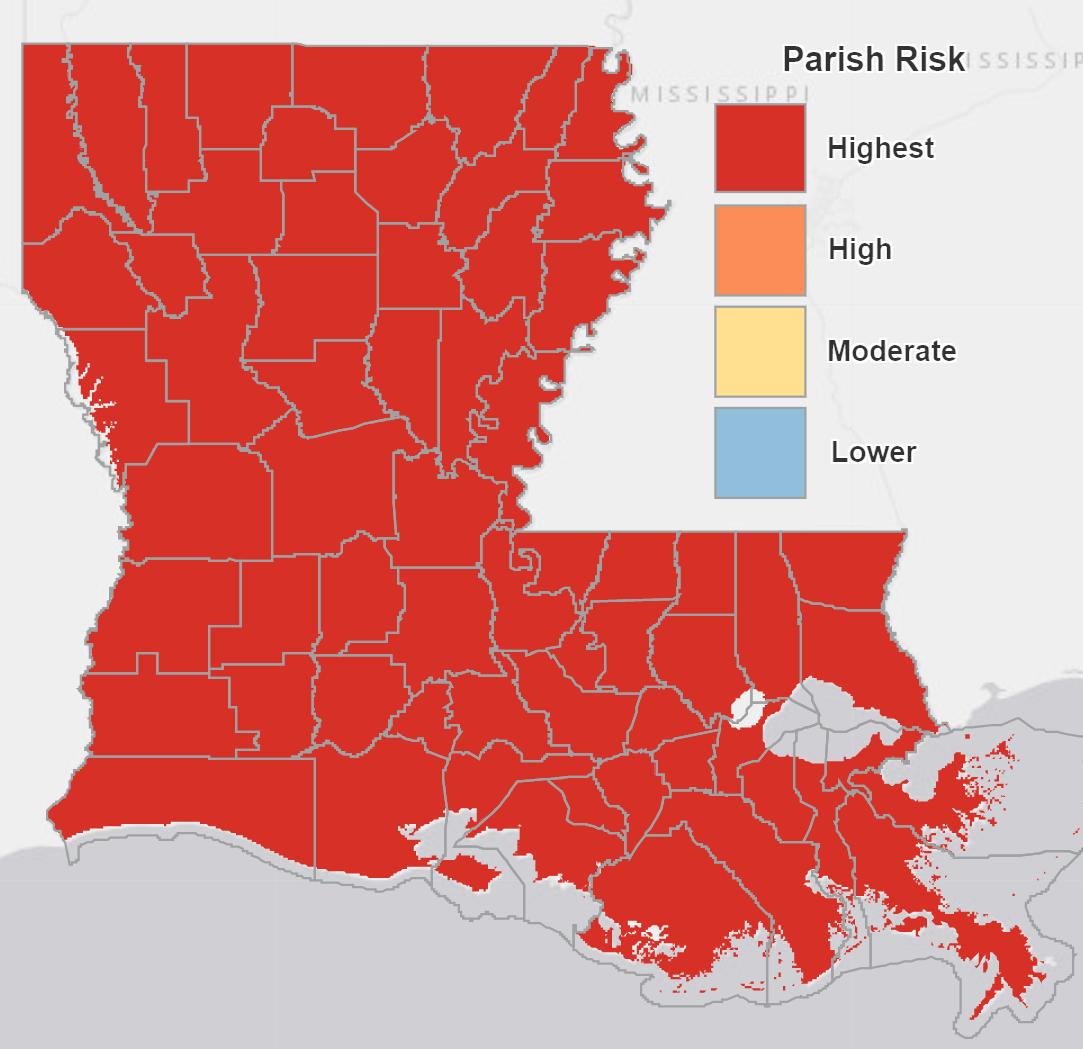
Cases over time by age group in Region 6 through August 18, 2021.
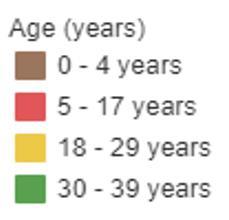
Source: Louisiana Office of Public Health, Region 6 (Central Louisiana), August 18, 2021.
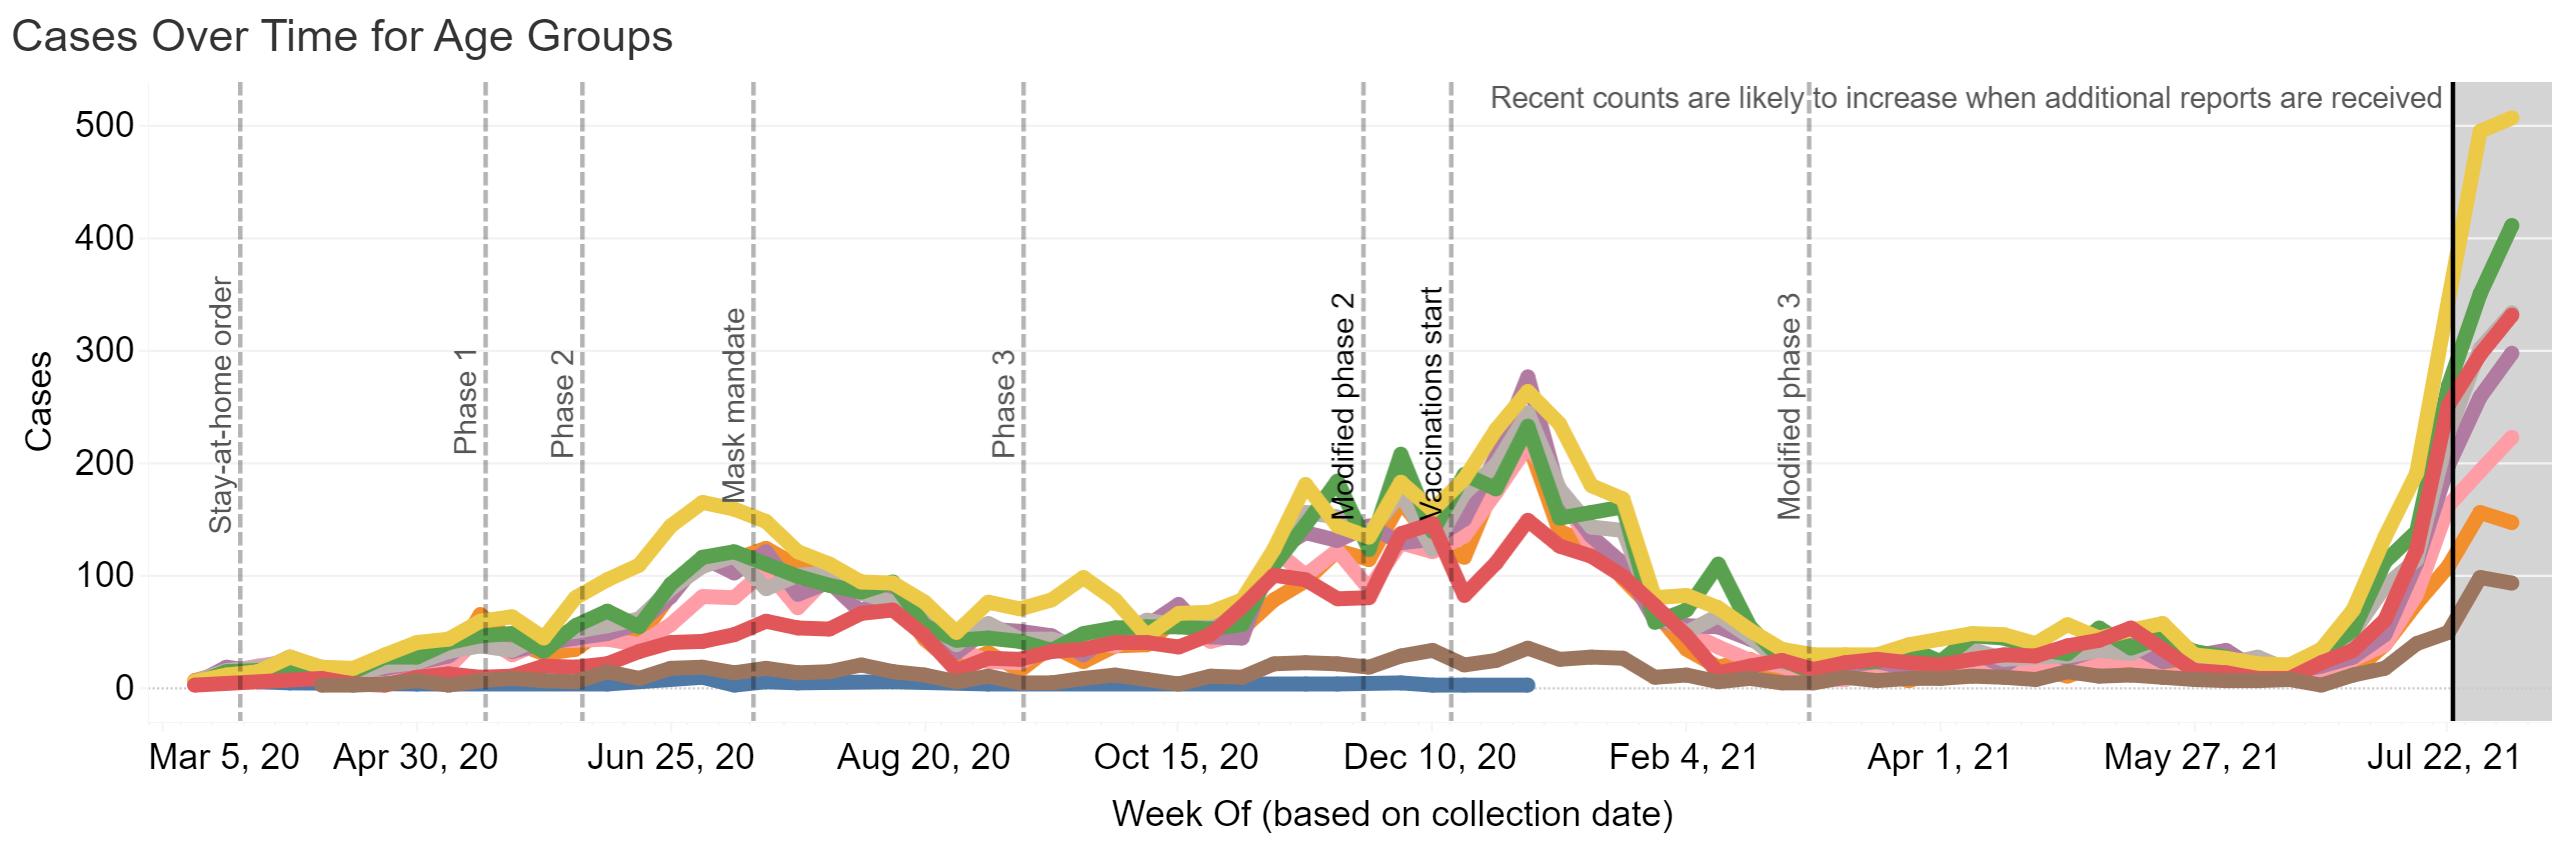

COVID-19 percent positive and test volume in Region 6 as of August 18, 2021.
Source: Louisiana Office of Public Health, Region 6 (Central Louisiana), August 18, 2021..
COVID-19 statewide risk by parish.
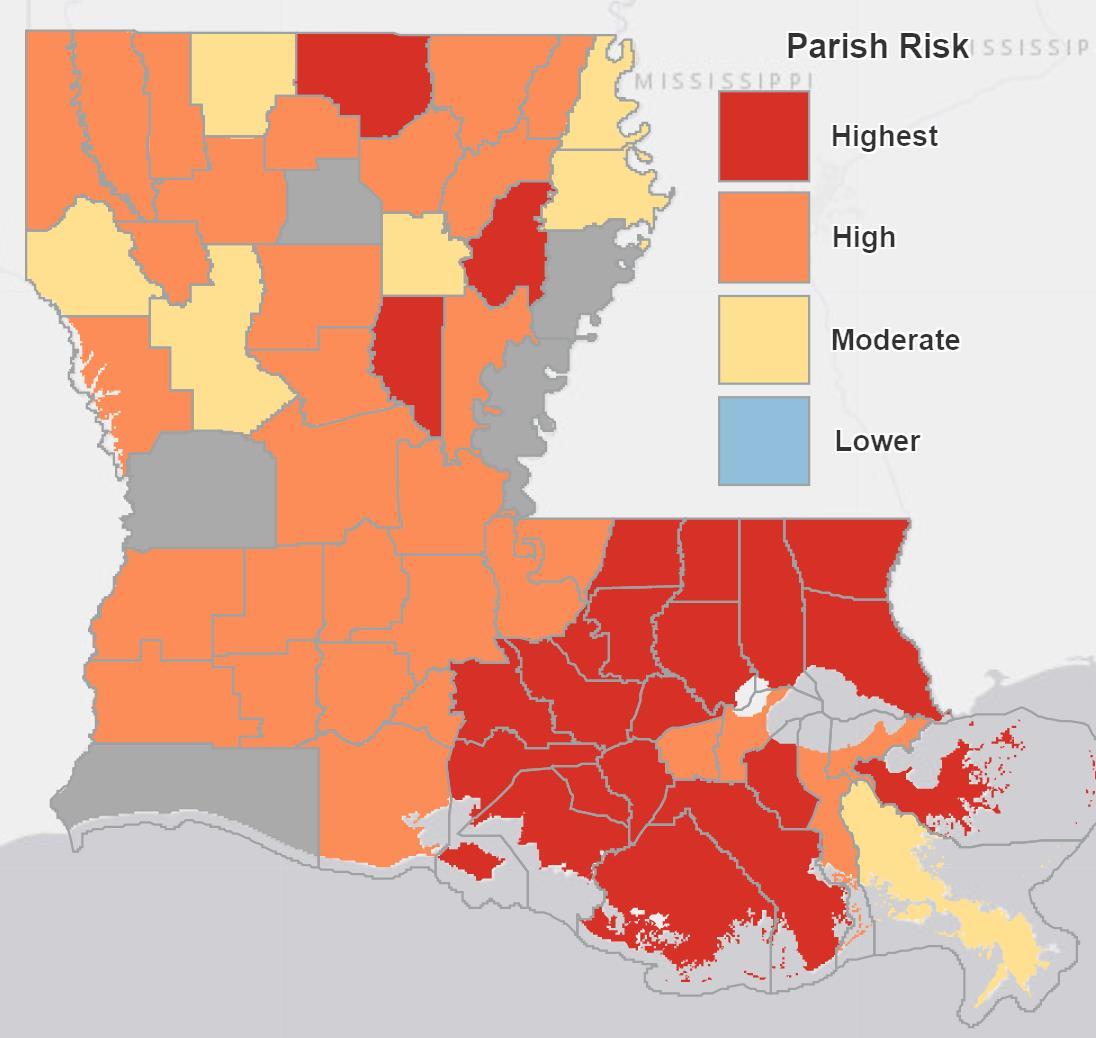
July 15, 2021
Source: Louisiana Office of Public Health, Region 6 (Central Louisiana), August 18, 2021.
August 18, 2021
Number of cases hospitalized (green line) and ventilated (yellow line) in Region 6 as of August 18, 2021.
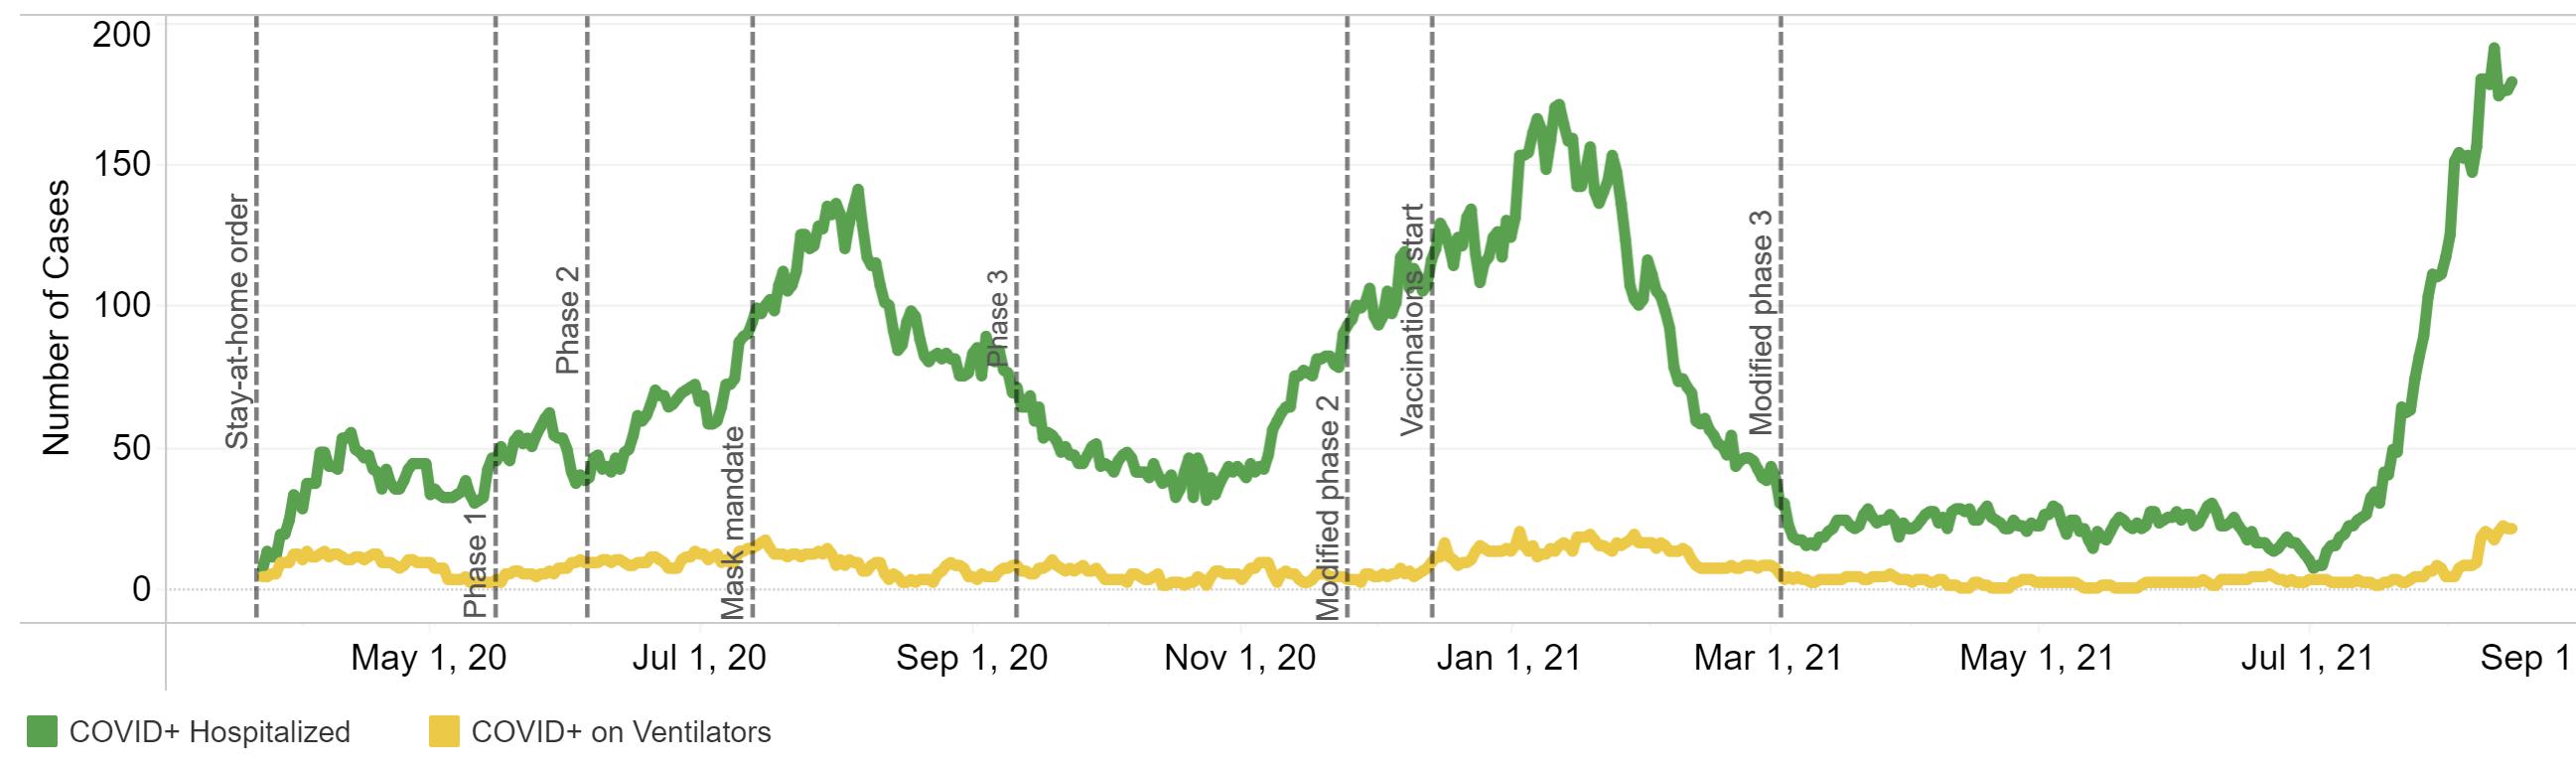
Source: Louisiana Office of Public Health, Region 6 (Central Louisiana), August 18, 2021.
COVID-19 deaths by date of death statewide as of August 18, 2021.
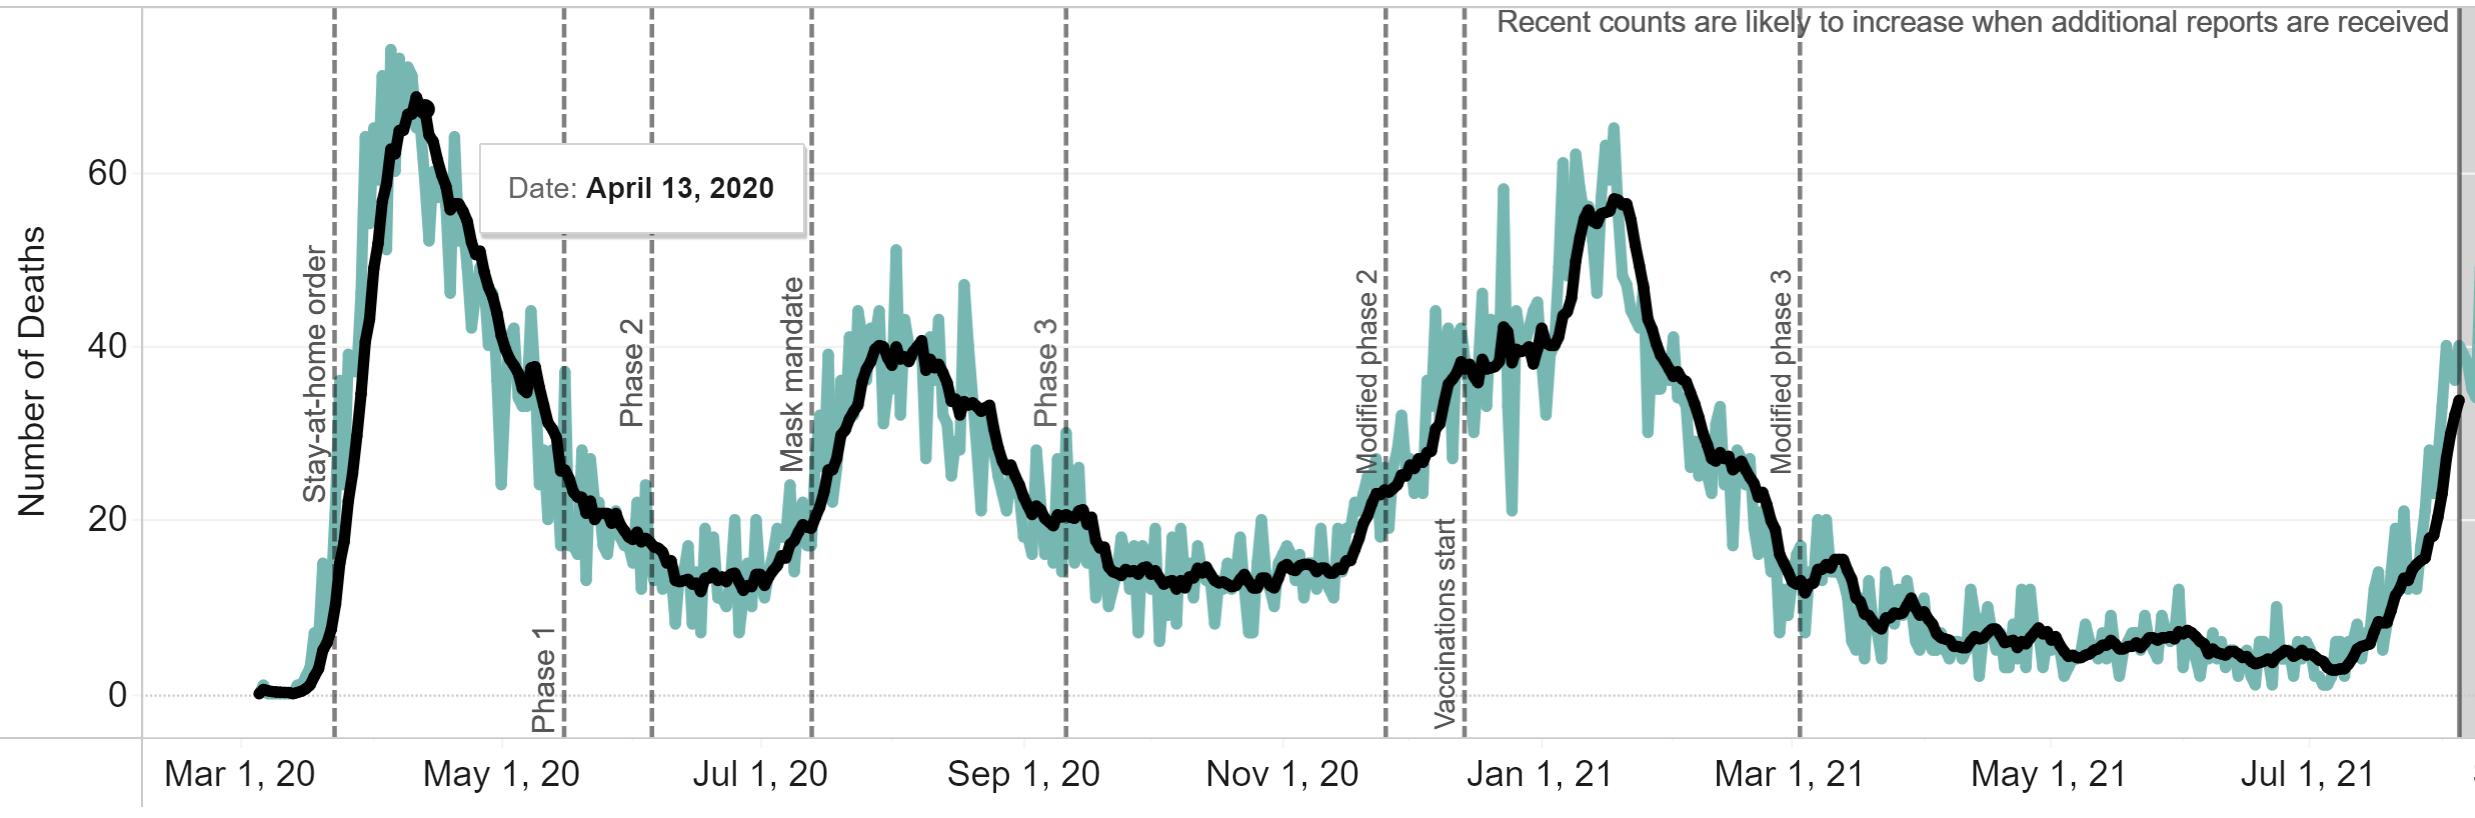
Source: Louisiana Office of Public Health, Region 6 (Central Louisiana), August 18, 2021.

Available beds by Louisiana Department of Health region as of August 18, 2021.
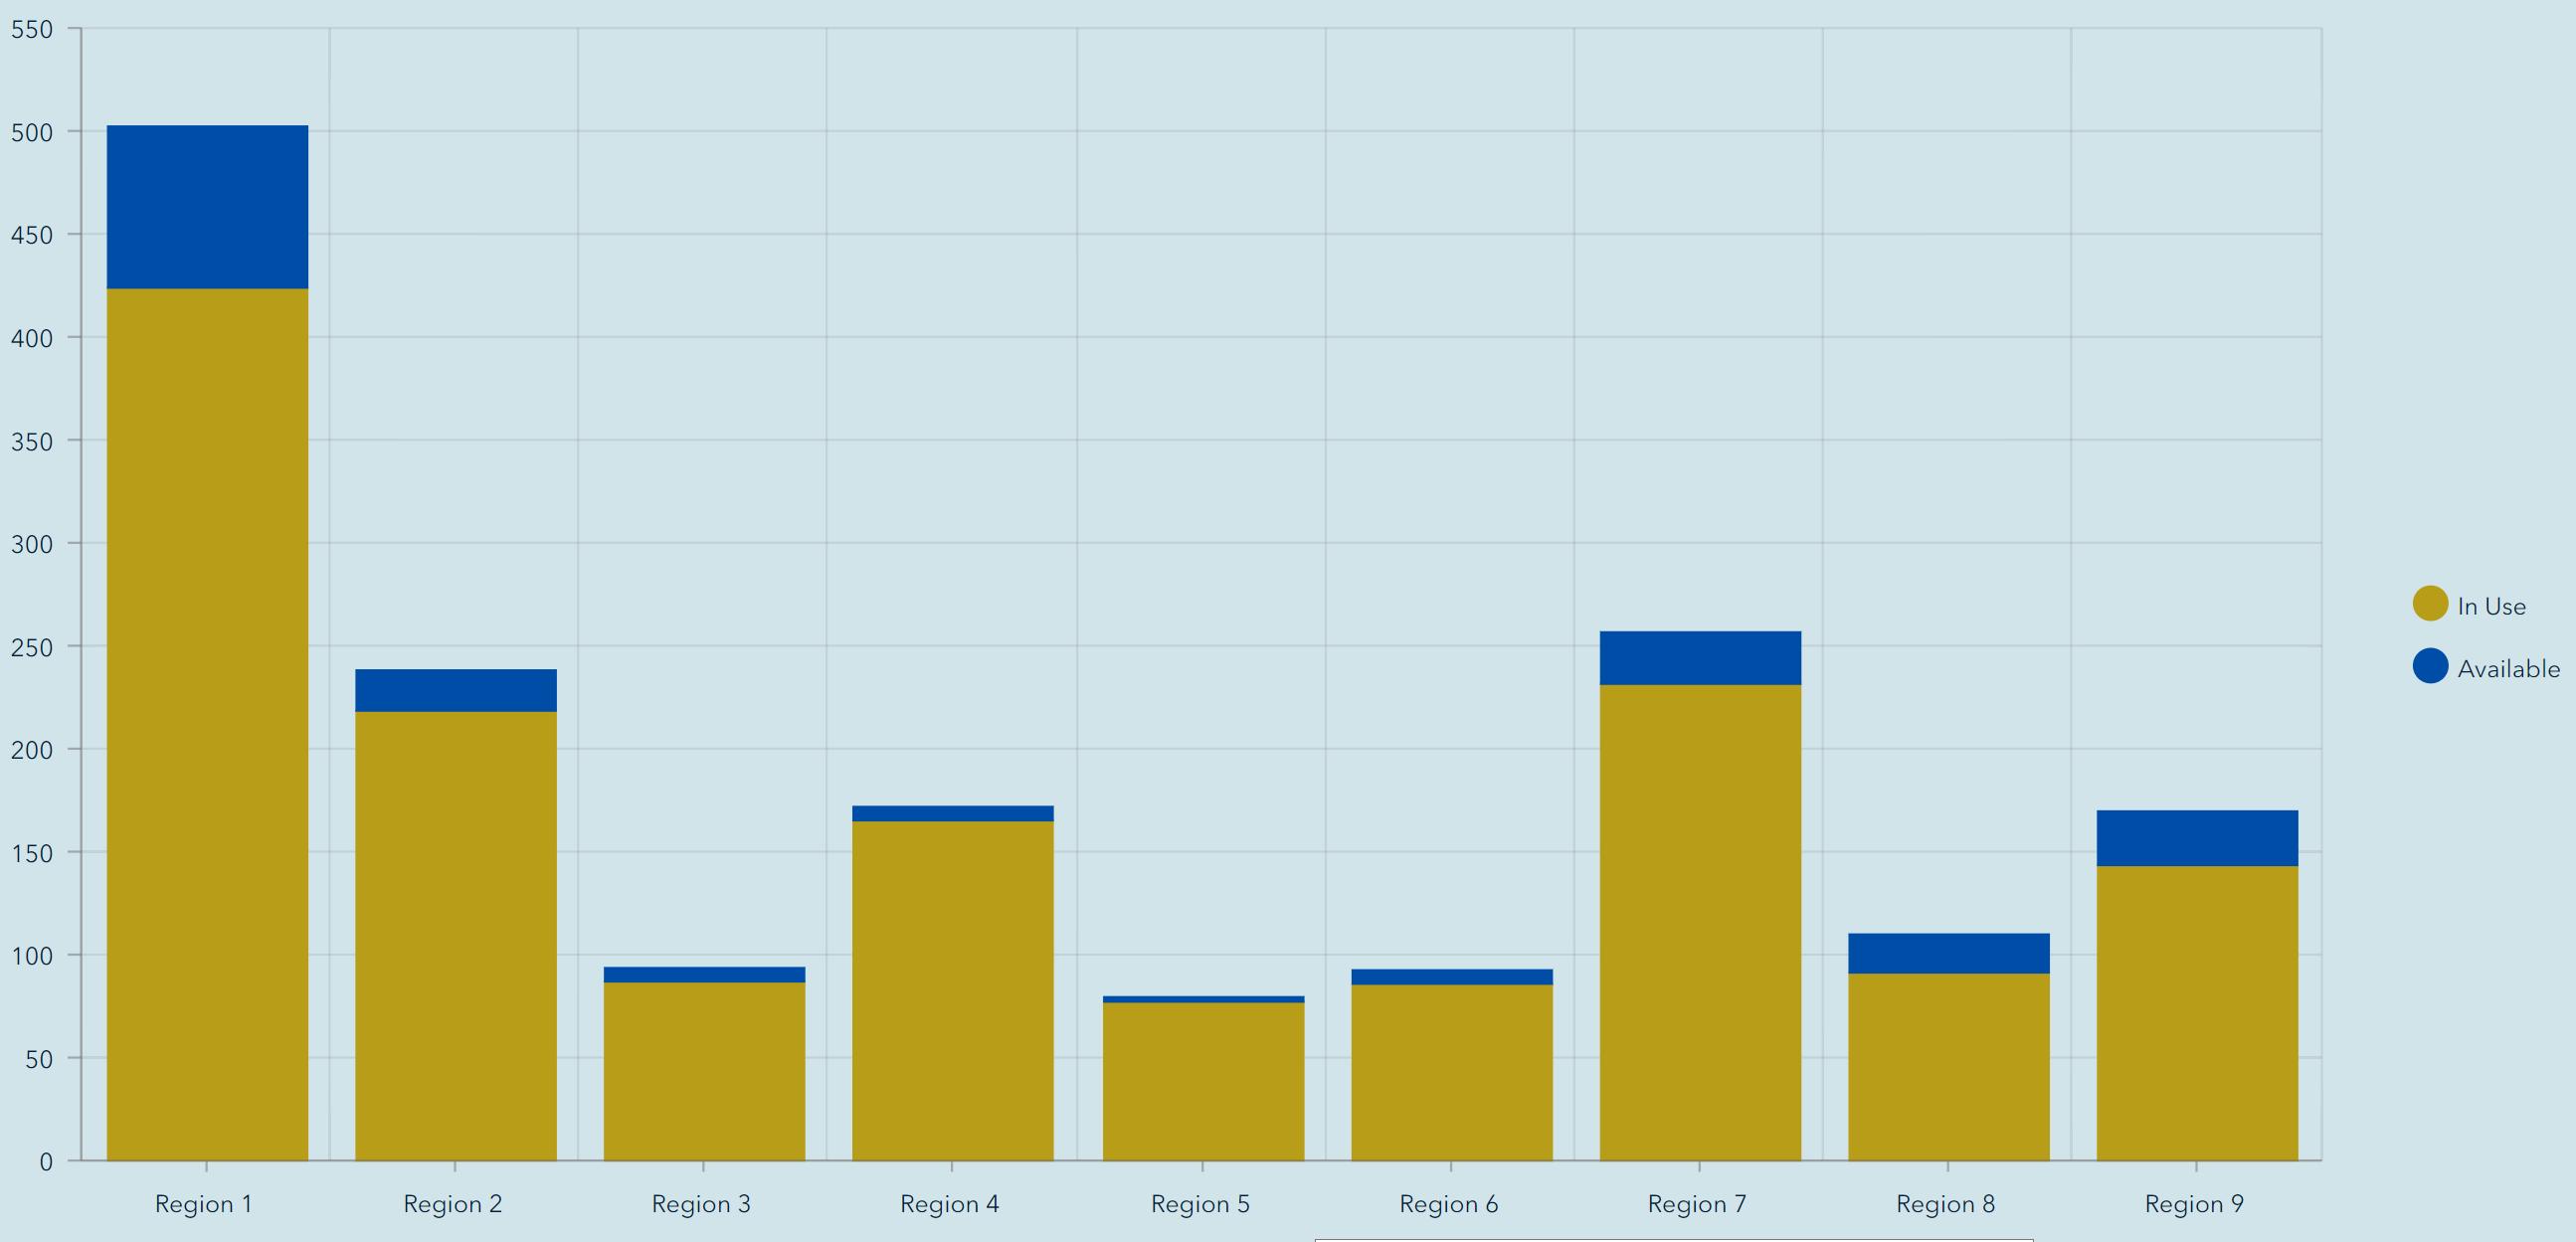
Source: Louisiana Office of Public Health, Region 6 (Central Louisiana), August 18, 2021.
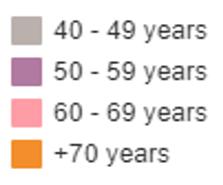
COVID-19 cases (left) and deaths (right) statewide by age group as of August 18, 2021.
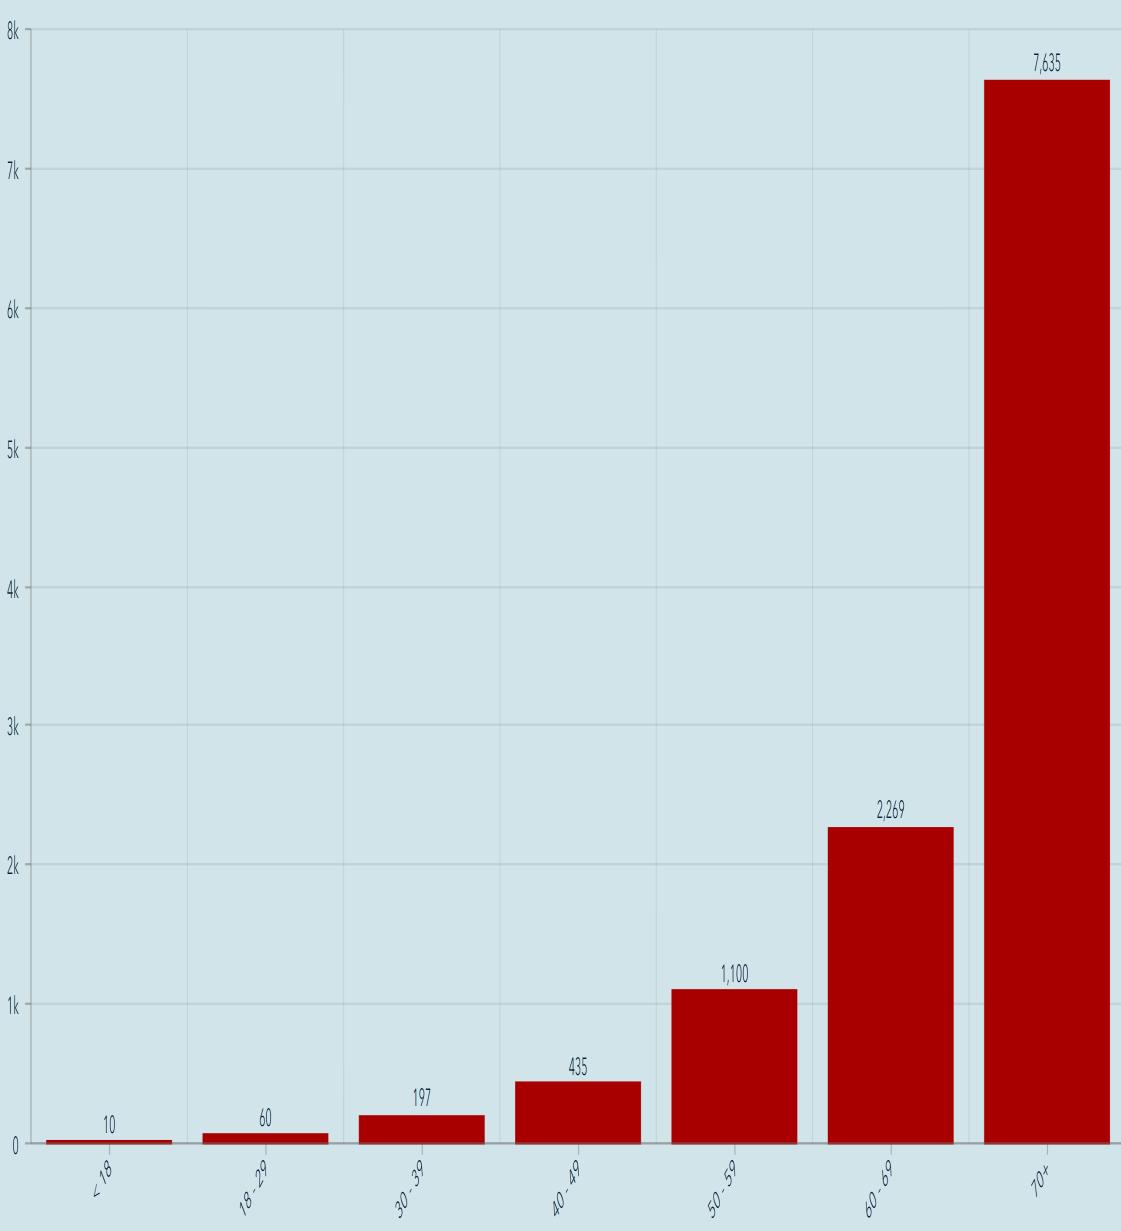
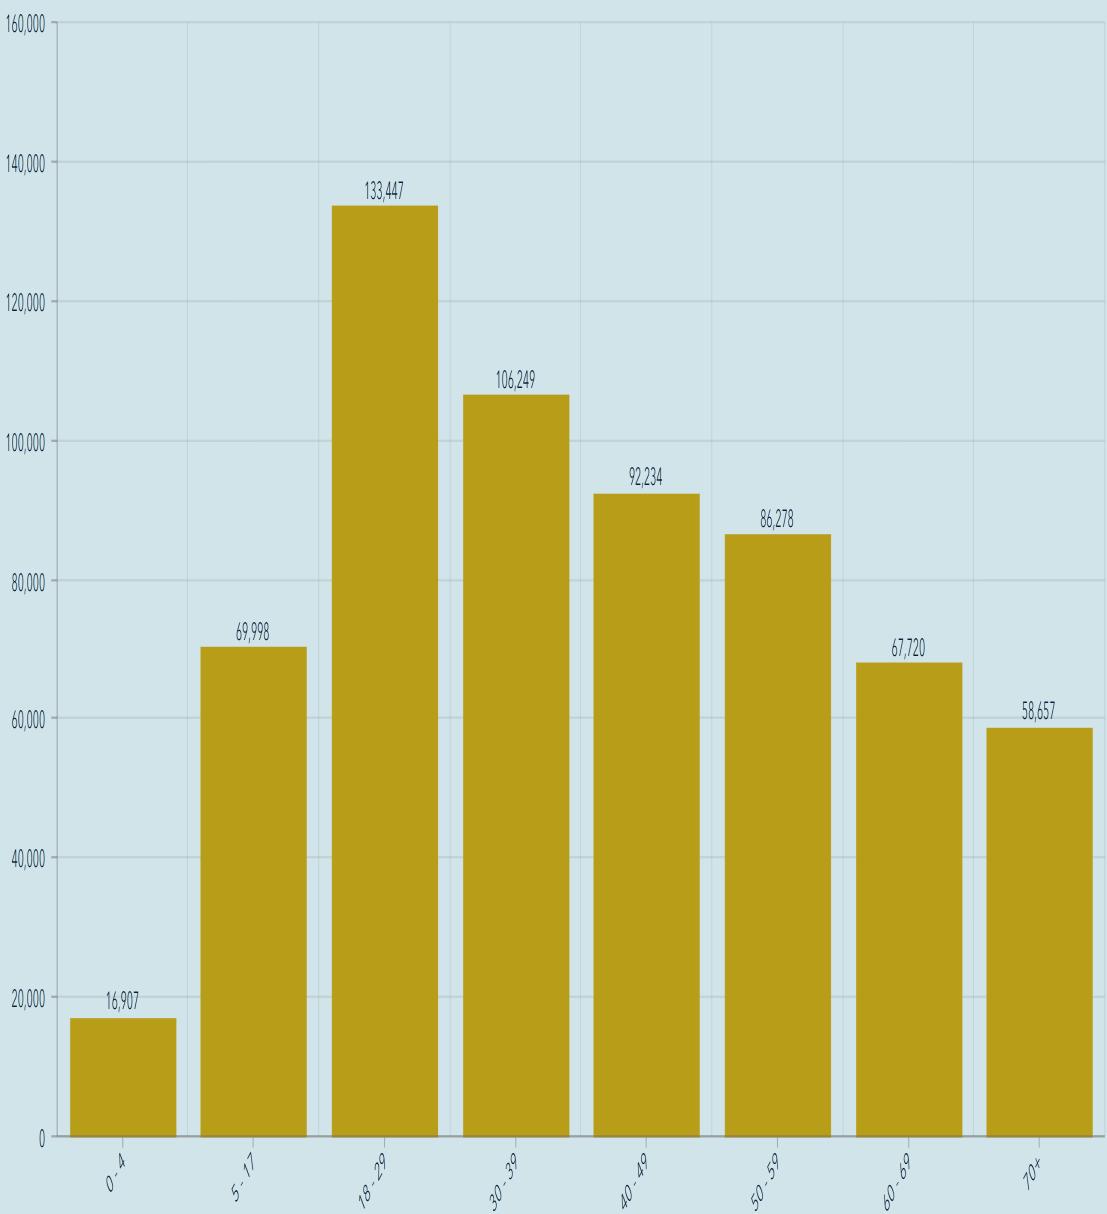
Source: Louisiana Office of Public Health, Region 6 (Central Louisiana), August 18 2021.
Employed persons in the Alexandria MSA from 2019 – 2021.
Employed
In June 2021, 60,655 were employed in the Alexandria metro area, which is an increase of 149 from May.
Source: Louisiana Workforce Commission,August 19, 2021
Initial and continued unemployment claims in Louisiana from January to July 2021.


Statewide average weekly initial unemployment claims filed in July fell to 4,134 from 4,8131 in June, a -16% decrease.
Statewide average weekly continued unemployment claims filed in July fell to 47,997 from 49,631 in June, a -3% decrease.
Source: Louisiana Workforce Commission,August 18, 2021
Unemployment Claims in Louisiana
January - July 2021
The table below shows June 2021 preliminary unemployment rate, labor force, and employment data for central Louisiana parishes.
In June, parishes in central Louisiana had an average unemployment rate of 6.3% compared to 7.4% statewide.
At 4.0%, La Salle Parish had the lowest unemployment rate in the state, a record it has held for over a year.
Data Source: Louisiana Workforce Commission, August 18, 2021.
The table below shows June 2021 preliminary unemployment rate, labor force, and employment data for Metropolitan Statistical Areas in Louisiana.
At 5.1%, the Alexandria MSAhad the lowest unemployment rate among the state’s major metro areas for the fourteenth straight month, up 0.5% from the previous month.
Louisiana’s unemployment rate increased 0.7% in June to 7.4% from 6.7% in May.
Data Source: Louisiana Workforce Commission,August 19, 2021.
The table below shows the number of unemployed, number of advertised jobs online, and the ratio of unemployed to advertised job openings online for Metropolitan Statistical Areas in Louisiana in June 2021.
In June, the Alexandria metro area continues to have the tightest labor market in the state with only 0.62 unemployed persons per job opening.
In June, Louisiana had an unemployed to job openings ratio of 1.41.
An overview of sales, vehicle sales, and hotel occupancy taxes collected in the July 2021 reflecting sales activity in June 2021.
Note: July tax revenue reflects sales activity in June. N/a = Not available
Data Source noted in detailed reports.


An overview of sales tax revenue in Rapides Parish other towns and cities in July 2021 (excluding Alexandria and Pineville).
Note: Current tax revenue reflects sales activity in prior month.


(TR) Alexandria total sales tax revenue for July with previous month, year, and YTD comparisons.
(BR) Alexandria total monthly sales tax revenue from 2019 to present.
Note: July sales tax revenue reflects sales activity in June.
Data Source: Rapides Parish Police Jury Treasurer’s Reports,August 2021.
Avoyelles Parish total sales tax revenue for July with previous month, year, and year-to-date comparisons. Vehicle and hotel tax revenues are excluded.
Avoyelles Parish vehicle sales tax revenue for July with previous month, year, and year-to-date comparisons.
Note: July sales tax revenue reflects sales activity in June.
Data Source: Avoyelles Parish School Board. August 2021
Catahoula Parish total sales tax revenue for July with previous month, year, and year-to-date comparisons.
Note: July sales tax revenue reflects sales activity in June.
Data Source: Catahoula Parish Tax Administrator August 2021
Concordia Parish total sales tax revenue for July with previous month, year, and year-to-date comparisons.
Note: July sales tax revenue reflects sales activity in June.
Data Source: Concordia Parish Tax Administrator.August 2021
Evangeline Parish total sales tax revenue for July with previous month, year and YTD comparisons.
Note: July sales tax revenue reflects sales activity in June.
Data Source: Evangeline Parish Sales Tax Commissioner.August 2021
Evangeline Parish vehicle sales tax revenue for July with previous month, year and YTD comparisons.
Note: July sales tax revenue reflects sales activity in June.
Data Source: Evangeline Parish Sales Tax Commissioner.August 2021
La Salle Parish total sales tax revenue for July with previous month, year, and year-to-date comparisons.
Note: July sales tax revenue reflects sales activity in June.
Data Source: La Salle Parish Tax Administrator, August 2021

(TR) Pineville sales tax revenue for July with previous month, year, and YTD comparisons.
(BR) Pineville monthly sales tax revenue from 2019 to present.
Note: Current sales tax revenue reflects sales activity in the prior month.
Data Source: Rapides Parish Police Jury Treasurer’s Reports,August 2021.
Rapides Parish occupational license revenue YTD with previous YTD comparisons.
Note: Rapides Parish reflects unincorporated areas.
Data Source: Rapides Parish Police Jury Treasurer’s Reports,August 2021.
(TR) Rapides Parish sales tax revenue for July with previous month, year, and YTD comparisons.
(BR) Rapides monthly sales tax revenue from 2019 to present.
Note: Current sales tax revenue reflects sales activity in the prior month.
Data Source: Rapides Parish Police Jury Treasurer’s Reports,August 2021.
St. Landry Parish sales tax revenue for July with previous month, year, and YTD comparisons.
Note: July sales tax revenue reflects sales activity in June.
Data Source: Tax revenue data from St. Landry Parish School Board. August 2021
St. Landry Parish vehicle sales tax revenue for July with previous month, year, and YTD comparisons.
Note: July sales tax revenue reflects sales activity in June.
Data Source: Tax revenue data from St. Landry Parish School Board. August 2021
Remote seller tax revenue is tax revenue from online sales by location of the seller at the time of purchase.
August 2020 - July 2021
SinceAugust 2020, $14.6 million in sales tax revenue have been collected from online sales in central Louisiana.
Online sales tax revenue in July decreased 9% from June.
Note: Sales tax revenue collected in July reflects sales activity in June.
Data Source: Louisiana Sales and Use Tax Commission for Remote Sellers. August 2020 –August 2021


Remote sellers tax revenue is tax revenue from online sales by location of the seller at the time of purchase.
Note: Sales tax revenue collected in one month reflects sales activity in the prior month.
Data Source: Louisiana Sales and Use Tax Commission for Remote Sellers. August 2020 –August 2021
The valuation (estimated development cost) of new commercial construction permits issued by the City of Alexandria in July 2021 with previous month, year, and YTD comparisons.
The valuation (estimated development cost) of new residential construction permits issued by the City of Alexandria in July 2021 with previous month, year, and YTD comparisons.
This chart shows the valuation of permits issued by Rapides Area Planning Commission in Allen Parish in July between 2018-2021 with month-tomonth, year-to-year, and year-to-date comparisons.
Data Source: RapidesArea Planning Commission,August, 2021
This chart shows the valuation of permits issued by Rapides Area Planning Commission in Avoyelles Parish in July between 2019-2021 with month-to-month, year-to-year, and year-to-date comparisons.
Data Source: RapidesArea Planning Commission,August 2021.
This chart shows the valuation of permits issued by Rapides Area Planning Commission in Evangeline Parish in July between 2018-2021 with month-to-month, year-to-year, and year-to-date comparisons.
Data Source: RapidesArea Planning Commission,August 2021.
This chart shows the valuation of permits issued by Rapides Area Planning Commission in the City of Pineville in July between 2018-2021 with month-to-month, year-to-year, and year-to-date comparisons.
Data Source: RapidesArea Planning Commission,August 2021.
This charts shows the valuation of permits issued by Rapides Area Planning Commission in Rapides Parish (excluding Alexandria) in July between 20182021 with month-to-month, year-to-year, and year-to-date comparisons.
Data Source: RapidesArea Planning Commission, August 2021.
New residential construction permit valuation (estimated development cost) issued by Rapides Area Planning Commission by jurisdiction in July 2021 compared to July 2020.
Year-over-year value of residential construction in the RAPC jurisdictions decreased from $6.2 to $6.1 million.
Note: City ofAlexandria permits are accounted for separately.
Data Source: RapidesArea Planning Commission,August 2021.
Valuation of New Residential Construction
July 2020 vs July 2021
The chart represents the lumber price index in the U.S. from January 2020 – July 2021.
Monthly Price Index of Lumber 2020 - 2021
In July 2021, the US Lumber Price Index declined -21% from the previous month.
The US Lumber Price Index has fallen the past two month and nears February’s level.
Since January 2021, the US Lumber Price Index increased 9% and remains 45% above a year ago.
Data Source: Fed Reserve Economic Database, St. Louis Federal Reserve Bank, August 18, 2021.

The count of active single-family and condo/townhome listings for Alexandria MSA (excludes pending listings) for July 20182021 with month-to-month and year-over-year comparisons.
Active listings in July increased 11% but remain -36% below July 2020.

The count of pending single-family and condo/townhome listings for Alexandria MSA for July 2018-2021 with month-to-month and year-over-year comparisons.

Median days on the market rose 9% in July from June 2021 but was still -48% below July 2020.
Homes took an average of 41 days on the market to sell in June, the second fastest in 5 years.
The median number of days property listings spend on the market in Alexandria MSA for July 2018-2021 with month-to-month and year-over-year comparisons. Data Source:

The median listing price of houses in Alexandria MSA for July 20182021 with month-to-month and year-over-year comparisons.
The median listing price remained unchanged from last month at $179,900, but still remains -18% below the July 2020 level.

The average listing price of houses in Alexandria MSA for July 20182021 with month-to-month and year-over-year comparisons.
The average listing price fell -4.2% to $242,090 this month from $252,577 in June and is -8% below the year ago level.
Avoyelles Parish hotel occupancy tax revenue for July with previous month, year, and year-to-date comparisons.
Note: July tax revenue reflects hotel occupancy activity in June. Hotel occupancy tax revenue is used as a proxy for hotel occupancy rate.
Data Source: Avoyelles Parish School Board. August 2021.
Rapides Parish hotel occupancy tax revenue for July 2020 with previous month, year, and YTD comparisons.
Note: July tax revenue reflects hotel occupancy activity in June. Hotel occupancy tax revenue is used as a proxy for hotel occupancy rate.
Data Source: Rapides Parish Police Jury Treasurer’s Reports, August 2021.
This chart shows total passenger throughput at AEX and other Louisiana airports in July 2021 as a percent of traffic in 2019. AEX is the solid black line.
Passenger Throughput at AEX as a Percent 2019 Traffic (July 2021)

AEX had the highest percentage of total passenger throughput in the state in July 2021 at 110% of the July 2019 level. The state average is 84%.

Nationwide daily percentage of passengers passing through current TSA checkpoints in 2021 expressed as a percentage of 2019 traffic.
U.S. Airport Passenger Throughput Traffic in 2021 as a Percent of 2019 Traffic
Nationally, air passenger traffic in July was up 8% over June 2021 and up 205% from a year ago. However, passenger traffic remains -20% below the July 2019 level.
For the first time since the pandemic started, nationwide passenger traffic exceeded 2019 levels on July 1-2.
Data Source: DHS, Transportation Security Administration, https://www.tsa.gov/coronavirus/passenger-throughput, August 7, 2021


The chart illustrates the level of employment retained since 2020 with January 2020 being the baseline. Data
AmericanAirlines has retained 91% employment since January 2020 compared to Delta and United which stand 75%.
This data shows year-overyear seated diners at restaurants on the OpenTable network in Louisiana. Year-over-year comparisons by day compare the same day of the week from the same week in the previous year.
OpenTable Reservations in Lousiana
Percent Change Over Year Ago
Feb. 2020 - Present
• July 10, 2021 saw a 475% spike in restaurant reservations in Louisiana, almost one year after a 155% spike on July 11, 2020.
Source: OpenTable, https://www.opentable.com/state-of-industry, August 7, 2021
Total gasoline sales in Louisiana in 2019 - 2021.


May 2021 gasoline sales remained near the previous month’s level, but was 17% above May 2020.
Gasoline sales in the previous 12 trailing months (June 2020May 2021) exceeded the year early by 1.3%.
Data Source: U.S. Energy Information Administration, Prices, Sales Volumes & Stocks by State,August 7, 2021
The chart below represents the number of new businesses established each month in Rapides from January 2019 through July 2021.


The number of new businesses established in Rapides in July 2021 rose 19% from June and it 6% higher than July 2020.
Year-to-date new businesses in Rapides are up 36% over 2020.
Data Source: Rapides Parish Sales and Use Tax Department, August 7, 2021.
These graphs represents the percent change in average consumer credit and debit card spending in Louisiana as of July 18, 2021 with January 2020 as the baseline.
Total consumer spending in Louisiana has remained level since earlyApril.
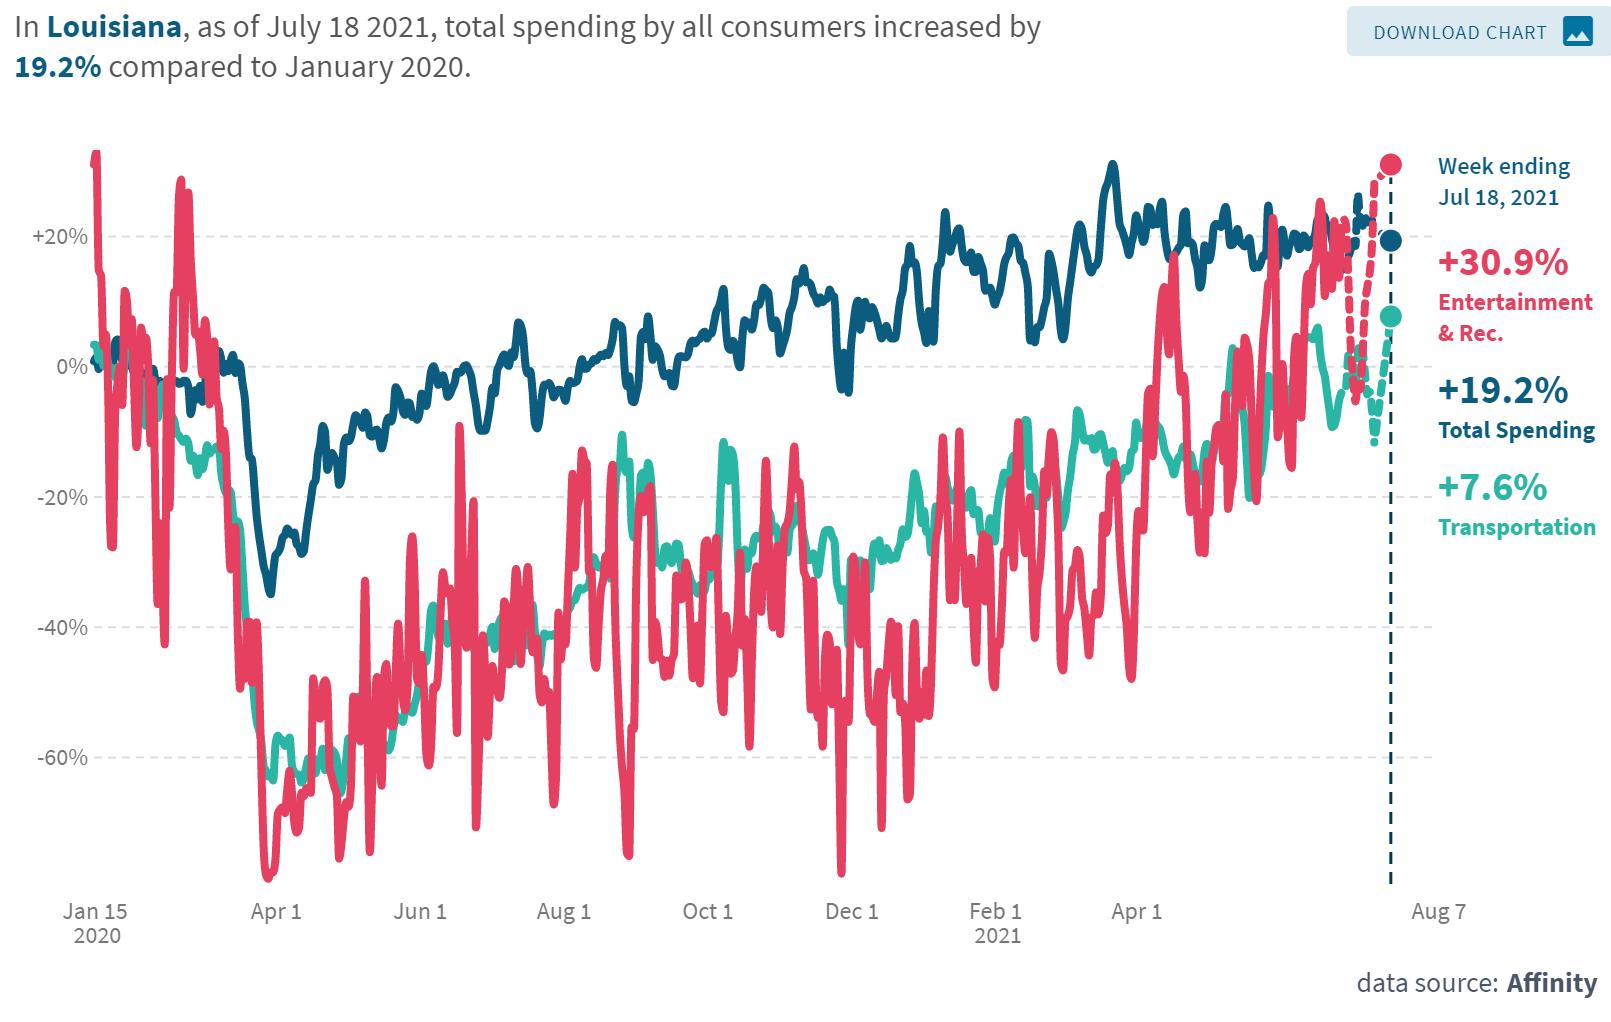
Entertainment and transportation spending continues to trend upward reaching 31% and 8% higher than January 2020, respectively.
• Total consumer spending on July, 2021 in Louisiana was up 19% compared to January 2020, with retail and entertainment and recreation spending each up 31%. Grocery spending was up 14%, health care up 29%, and restaurants up 12%.
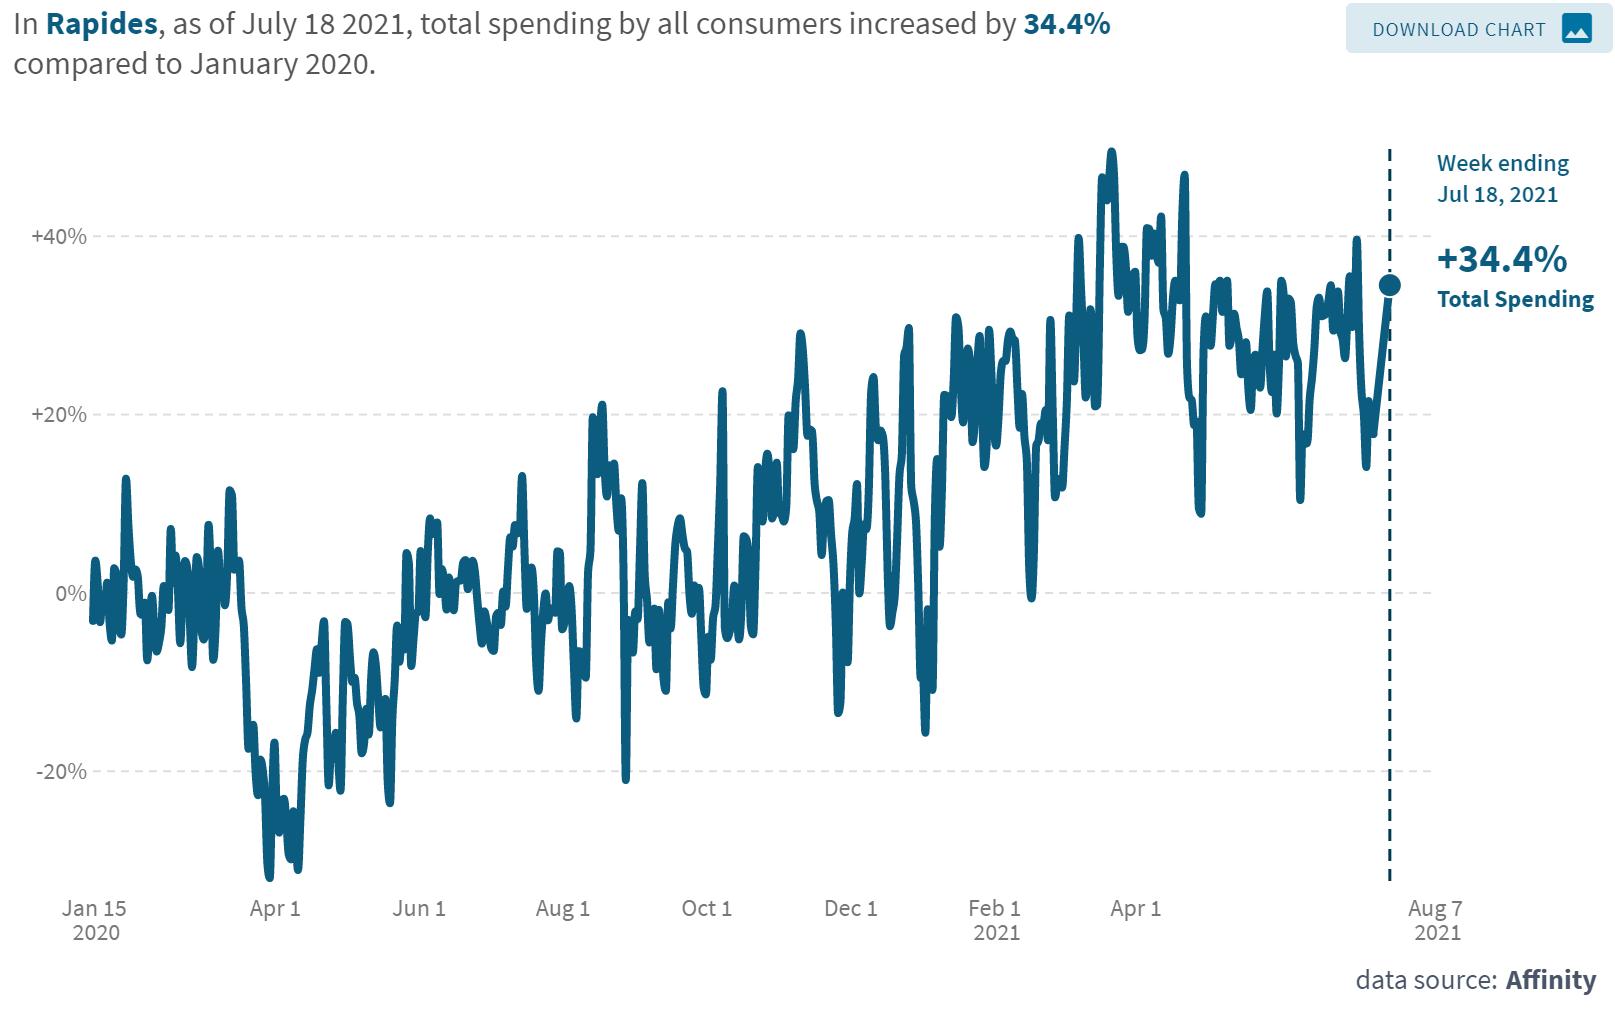
The table and chart represents the percent change in average consumer credit and debit card spending in Cenla as of July 18, 2021 with January 2020 as the baseline, while the chart represents Rapides.
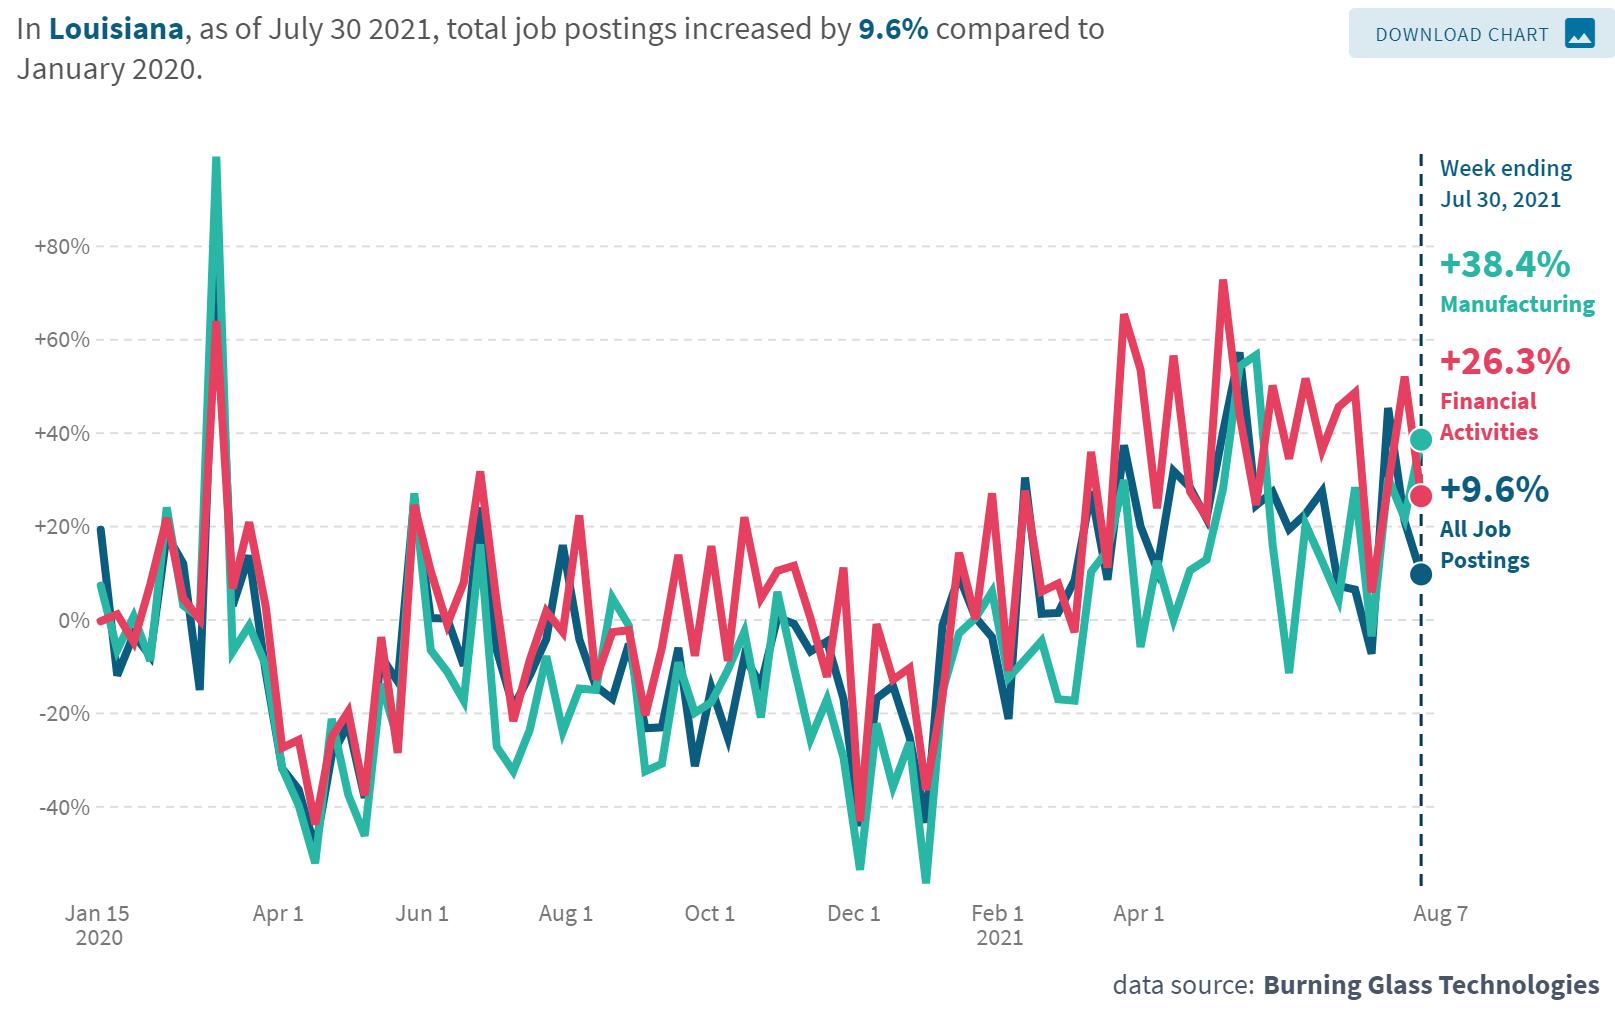
The chart below represents the percent change in job posting by industry in Louisiana as of July 30, 2021 with January 2020 as the baseline.
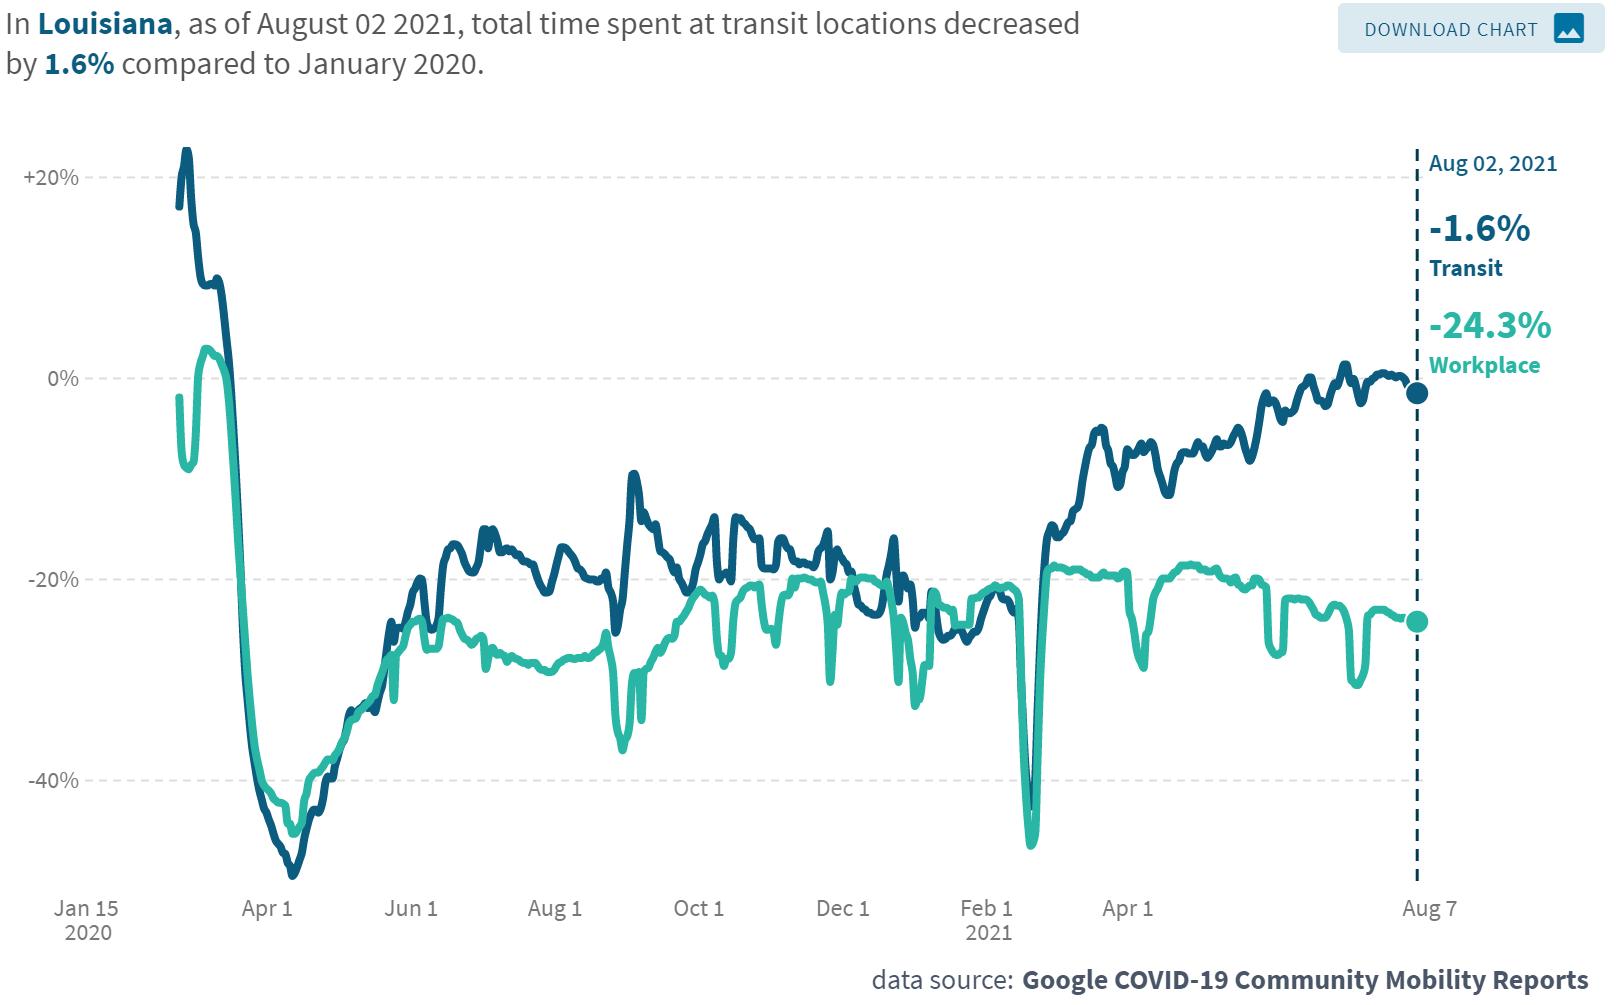
The chart represents the percent of time employees in Cenla and statewide spent at work as of August 2, 2021 with January 2020 as the baseline.
The Coincident Economic Activity Index for Louisiana includes four indicators: nonfarm payroll employment, the unemployment rate, average hours worked in manufacturing and wages and salaries. The index is set to match the trend for gross state product.
The Index for June 2021 increased 0.4% over May, indicating the economic recovery in Louisiana is continuing.

Data Source: FRED Economic Data, Federal Reserve Bank of St. Louis, August 7, 2021. https://fred.stlouisfed.org/series/LAPHCI
Represents the number of drilling rigs actively exploring for or developing oil or natural gas in Louisiana and the U.S. in 2021


Rig count in Louisiana remained unchanged in July from June but is up 73% from July 2020.
Nationwide, the rig count is up 67% from a year ago.
Source: Baker Hughes, https://rigcount.bakerhughes.com/na-rig-count, August 7, 2021
Monthly U.S. economic indicators for June 2021.
Data Source: U.S. Census, https://www.census.gov/economic-indicators/ August 18, 2021.
The data presented throughout the CENLA Economic Dashboard reflects contributions from the following local organizations.
• Rapides Parish Policy Jury Treasurer
• Rapides Sales TaxAdministrator
• Avoyelles Parish School Board
• Alexandria International Airport
• RapidesArea Planning Commission
• City ofAlexandria Planning Division
• Evangeline Parish Sales Tax Commissioner
• Concordia, Catahoula, & La Salle TaxAdministrator
• Louisiana Office of Public Health, Region 6
• St. Landry Parish School Board
Also, special thanks to the following partners for distributing the dashboard.
Next Issue: Week of Sep. 20th
• LSUAFoundation
• Central Louisiana Regional Chamber of Commerce
• Marksville Chamber of Commerce
• Bunkie Chamber of Commerce
• Evangeline Chamber of Commerce
• Concordia Chamber of Commerce
• St. Landry Chamber of Commerce
• Greater Vernon Chamber of Commerce