CENLA ECONOMIC DASHBOARD
June 16, 2021.
Dr.RandallDupont Dean,CollegeofBusinessLouisianaStateUniversityofAlexandria
rdupont@lsua.edu


June 16, 2021.
Dr.RandallDupont Dean,CollegeofBusinessLouisianaStateUniversityofAlexandria
rdupont@lsua.edu
Region 6 (central Louisiana) has the second lowest vaccination rate in the state with 24% of the population vaccinated, up from 21% in May. Rapides and Natchitoches have the highest rate of vaccinations within the region at 28% and 27%, respectively. New cases remain low with most of central LAconsidered at a moderate risk.
Employment in Cenla remained steady inApril with a 5.4% unemployment rate compared to 6.6% for the state. Rapides reported a 4.4% unemployment rate, the same as the Alexandria MSAwhich includes Grant. For the twelfth straight month, theAlexandria MSA had the lowest unemployment rate in the state among metro areas with New Orleans reporting the highest at 8.1%. The low unemployment rate combined with an expanding economy has resulted in a tight local labor market for central LA. There are almost two job openings for every unemployed in theAlexandria area. Hiring difficulties are expected to continue through the summer. New graduates with the right skills or willingness to learn have an excellent job market ahead.
Statewide initial unemployment claims fell -33% in May, but only down -10% in central LA. On the other had, statewide continued claims remained steady in May compared toApril, but rose 9% in central LAover the previous month.

June 16, 2021 CENLA Economic Dashboard
Sales tax revenue is used as a proxy of consumer spending. Sales taxes collected in May reflects activity inApril. Year-over-year consumer spending is up in every central LAjurisdiction reported in the Economic Dashboard with increases ranging from 22% to 54%. However, April consumer spending is down from March when stimulus funds from theAmerican Rescue Plan were distributed. Nevertheless, consumer spending on a year-to-date basis remains significantly higher with increases anywhere from 12% to 73% over last year.
Vehicles sales remain strong as they have most of the past year with year-over-year sales 60% to 120% over May 2020 and year-to-date sales up as much as 45%. Logistical and supply issues along with strong demand have cut auto inventories.
Travel is back! Hotel occupancy is positive on a monthly, yearly, and year-to-date basis in central LA. Gasoline sales in Louisiana reached the highest level in almost two years and the highest March since 2018.And we are not just traveling by car. Nationwide passenger air traffic recovered 90% of the pre-pandemic traffic in the days leading to Memorial Day. Locally, AEX averaged 88% of its 2019 passenger traffic level in May, the second-highest in the state. AEX continues to outperform the national average which stands at only 67% andAEX is expected to exceed 2019 levels now that a new East coast route via Charlotte has been established.
Permit data is sending a mixed signal. Commercial permits are down 5% in Alexandria so far this year compared to 2020, although residential permits are up 75% in the city. Outlying parishes present a different picture. Evangeline permits are up 68% in May and 288% YTD. Rapides permits are up a staggering 4600% in May over April and 2000% so for this year. The reason isAcadian Gas Pipeline Systems’ construction of a $193 million compressor station in Boyce in January and May 2021. Residential construction permits in central LAremained the same as May 2020.
Housing continues to show strength although there are some signs of easing. With active listing down 65% and pending listing up 44%, it is still a seller’s market. Confirming this trend is the 20% drop in the number of days a house stays on the market which fell from 69 inApril to 55 in May. For home buyers the good news is the average median listing price has come off its high, falling 6% this past month and 18% from a year ago. However, newer homes on the market are keeping the average listing price steady at $238,000. Lumber prices have not helped homebuyers. Although prices have fallen somewhat in recent weeks, the Lumber Price Index rose 16.5% in May and is up 100% from May 2020.
New business growth is particularly strong in central LA. Through May, new businesses established in Rapides are up 50% over the first five months of 2020 with 227 new businesses established so far this year compared to 151 last year. Fifty-seven new businesses were created in May alone compared 49 in April and only 20 in May of last year.
COVID-19 vaccinations as a percent of region population as of June 11, 2021.
Region 6 has the second lowest vaccination rate in the state with 24% of the population vaccinated, up from 21% in May.
Region 1 (New Orleans) and Region 2 (Baton Rouge) have the highest rates of vaccination at 42% and 36%, respectively.
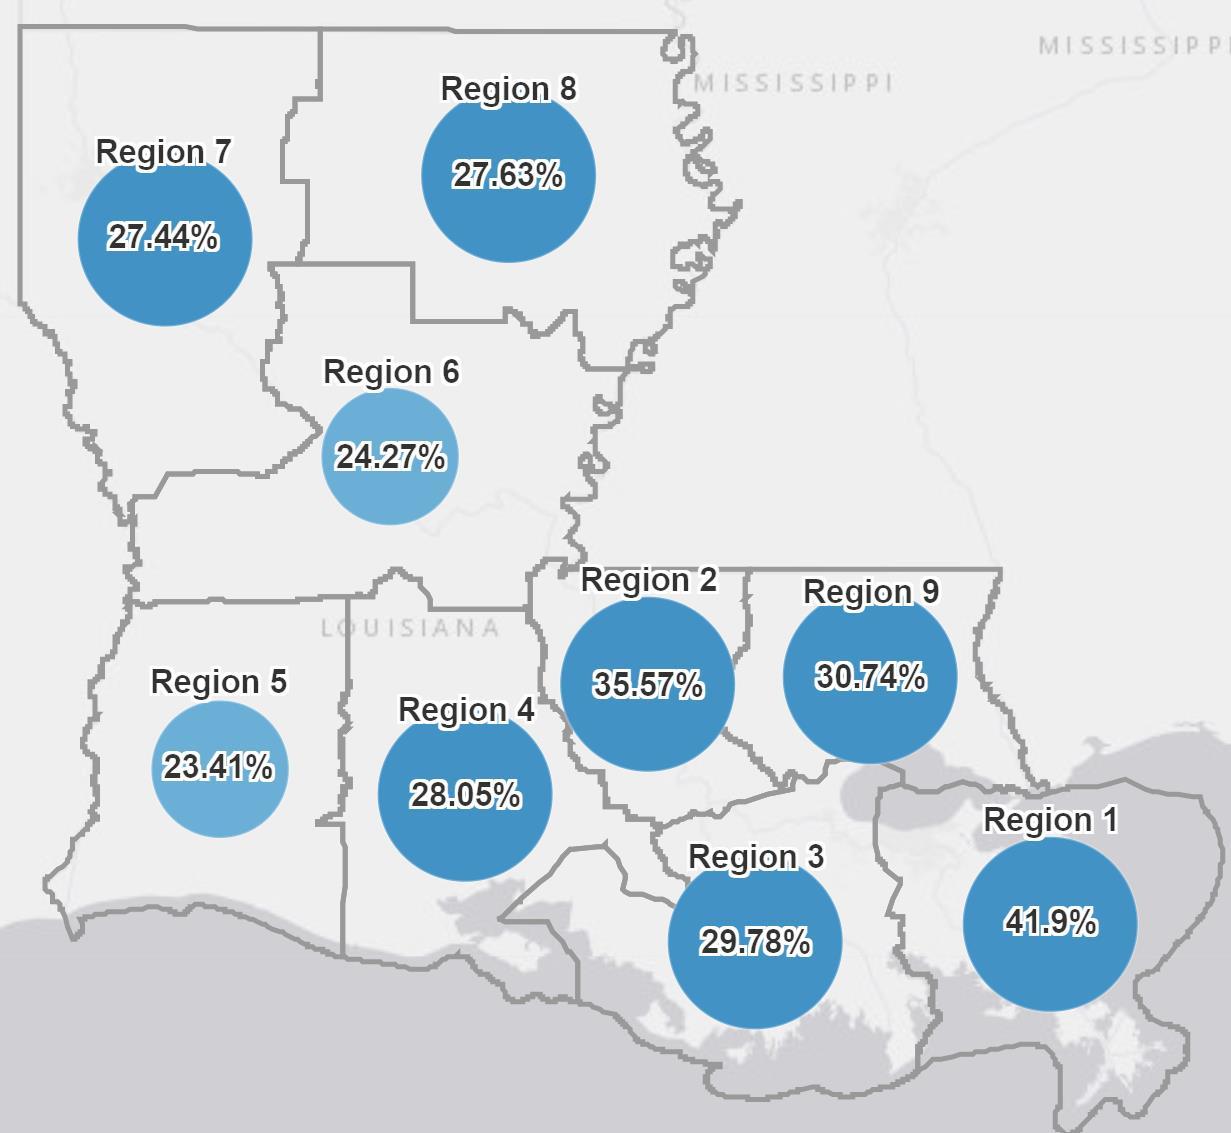
Source: Louisiana Office of Public Health, https://ldh.la.gov/covidvaccine, June 11, 2021
COVID-19 vaccinations as a percent of parish population as of June 11, 2021.
Rapides and Natchitoches have the highest percentage of completed vaccinations in Region 6 at 28% and 27% respectively, up from 25% a month ago.
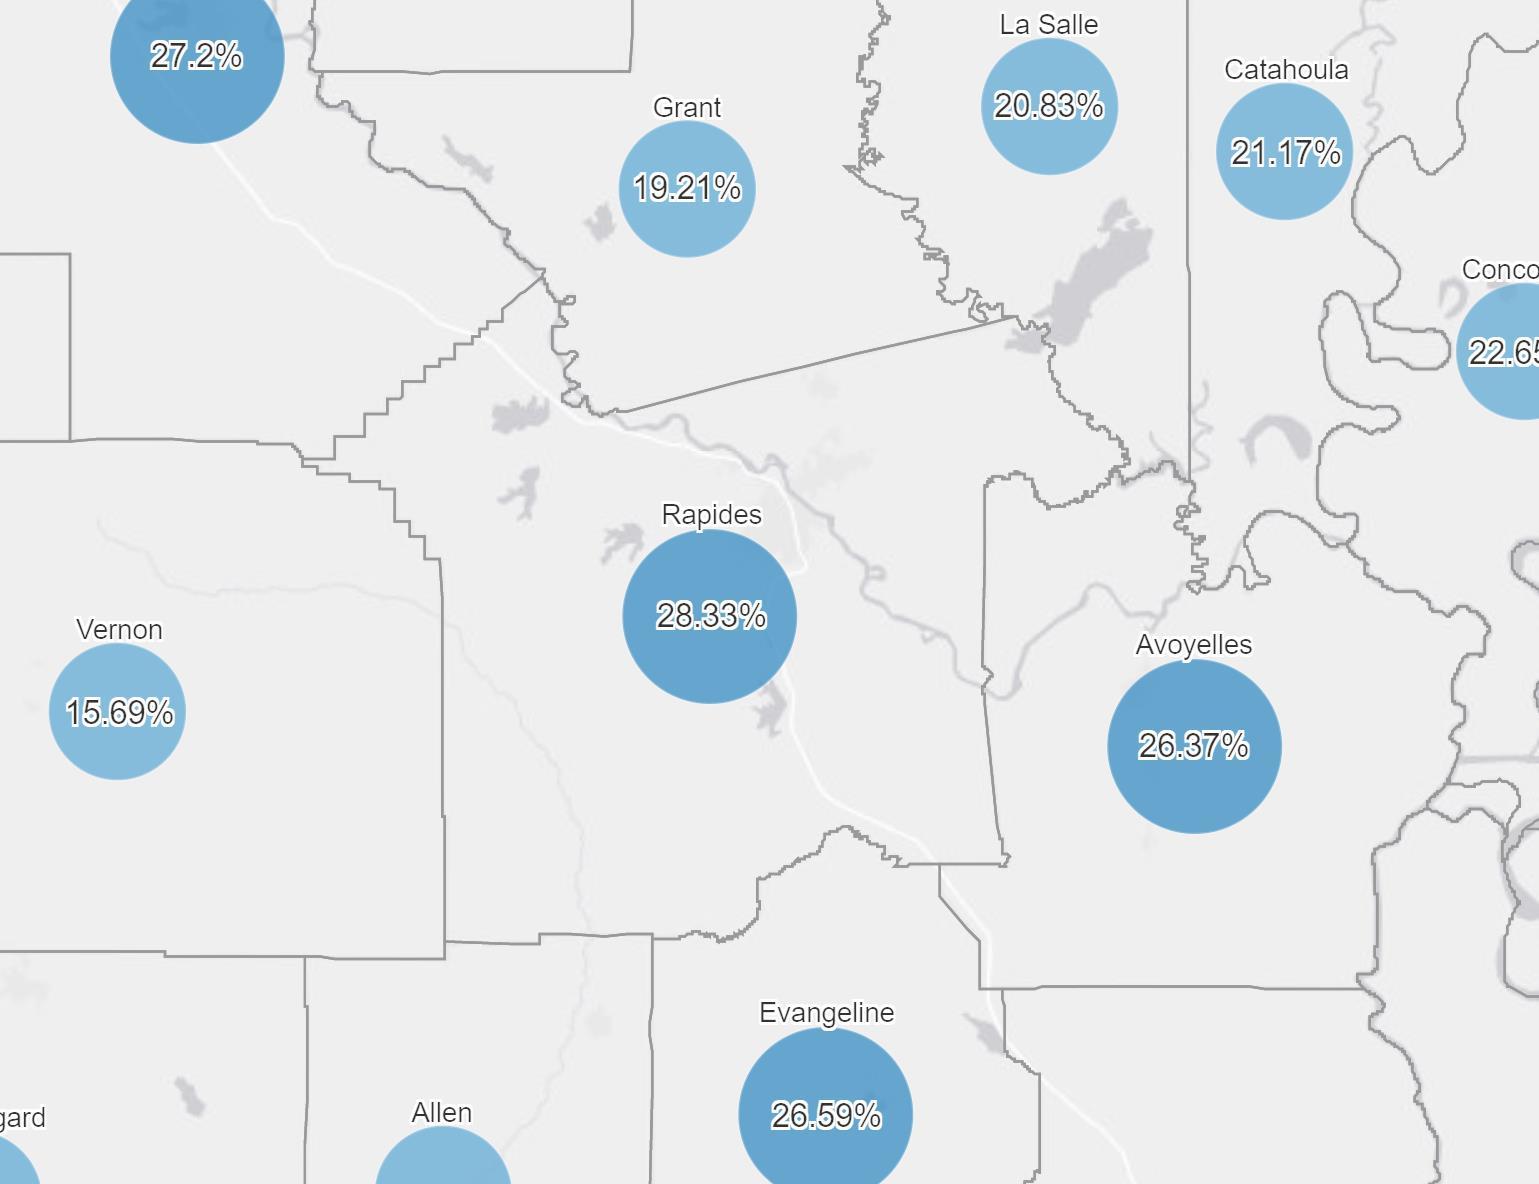
Orleans and East Baton Rouge have the highest vaccination rates in the state at 44% and 36%, respectively.
Source: Louisiana Office of Public Health, https://ldh.la.gov/covidvaccine, June 11, 2021
COVID-19 cases by collection date as of June 11, 2021 in Region 6 with a 7-day moving average.
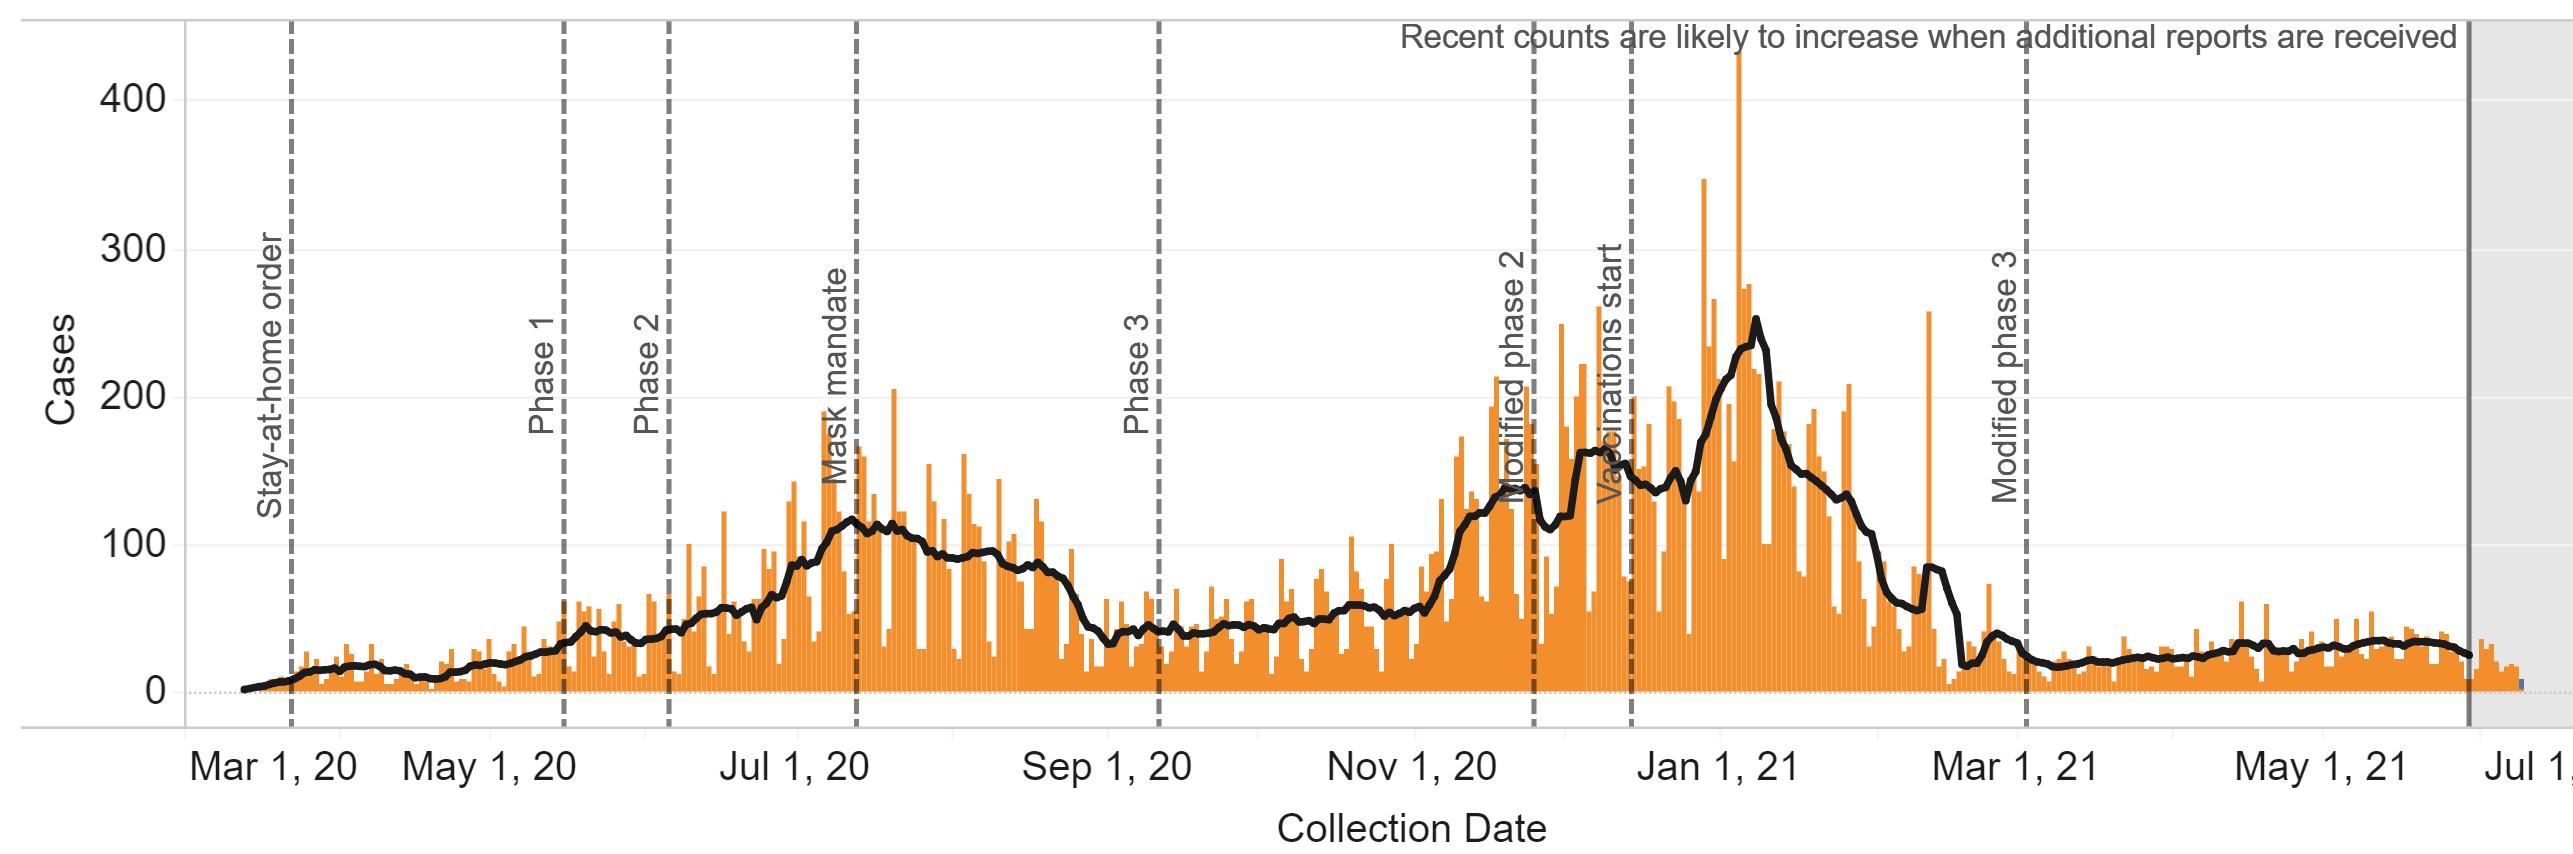
Source: Louisiana Office of Public Health, Region 6 (Central Louisiana), June 11 2021.
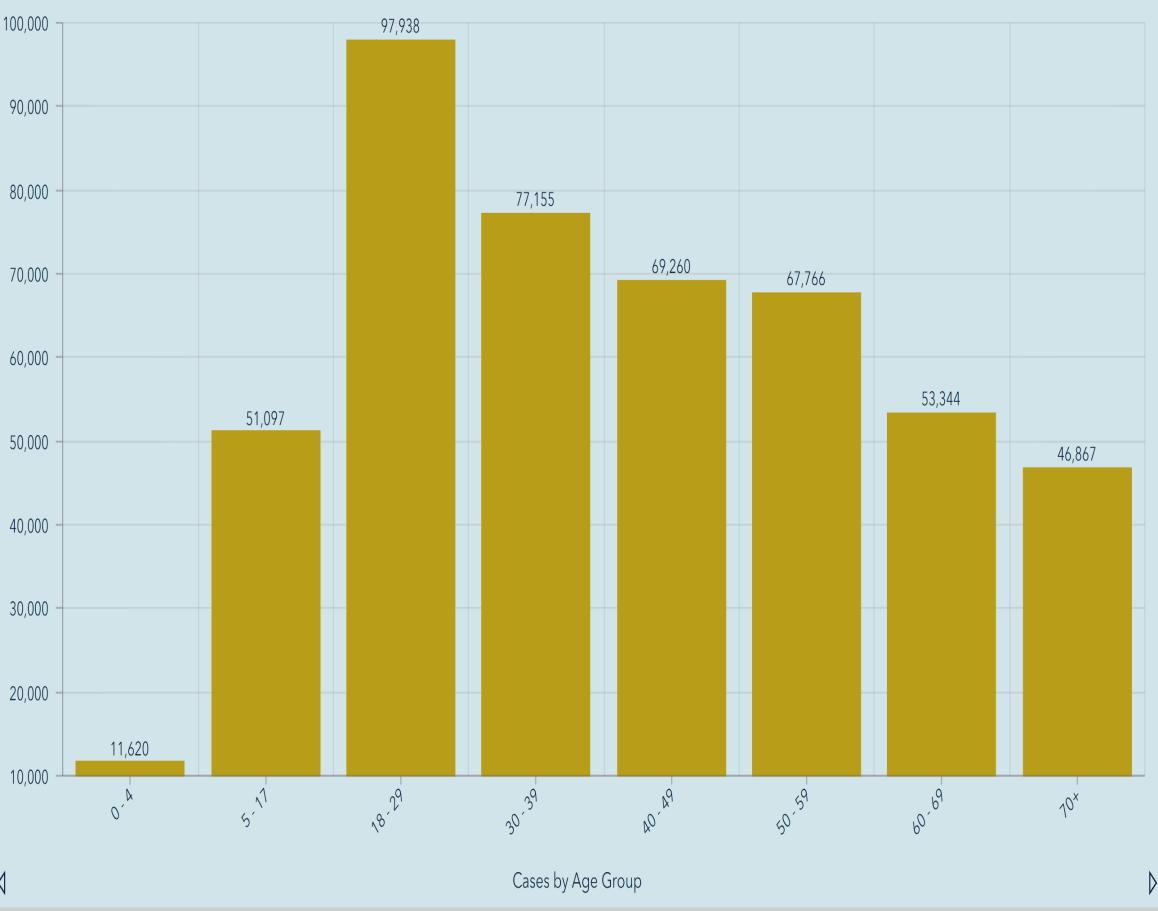
Cases over time by age group in Region 6 through June 11, 2021.
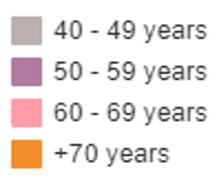
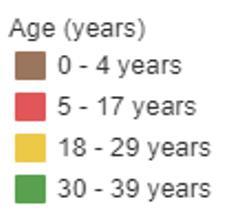
Source: Louisiana Office of Public Health, Region 6 (Central Louisiana), June 11, 2021.
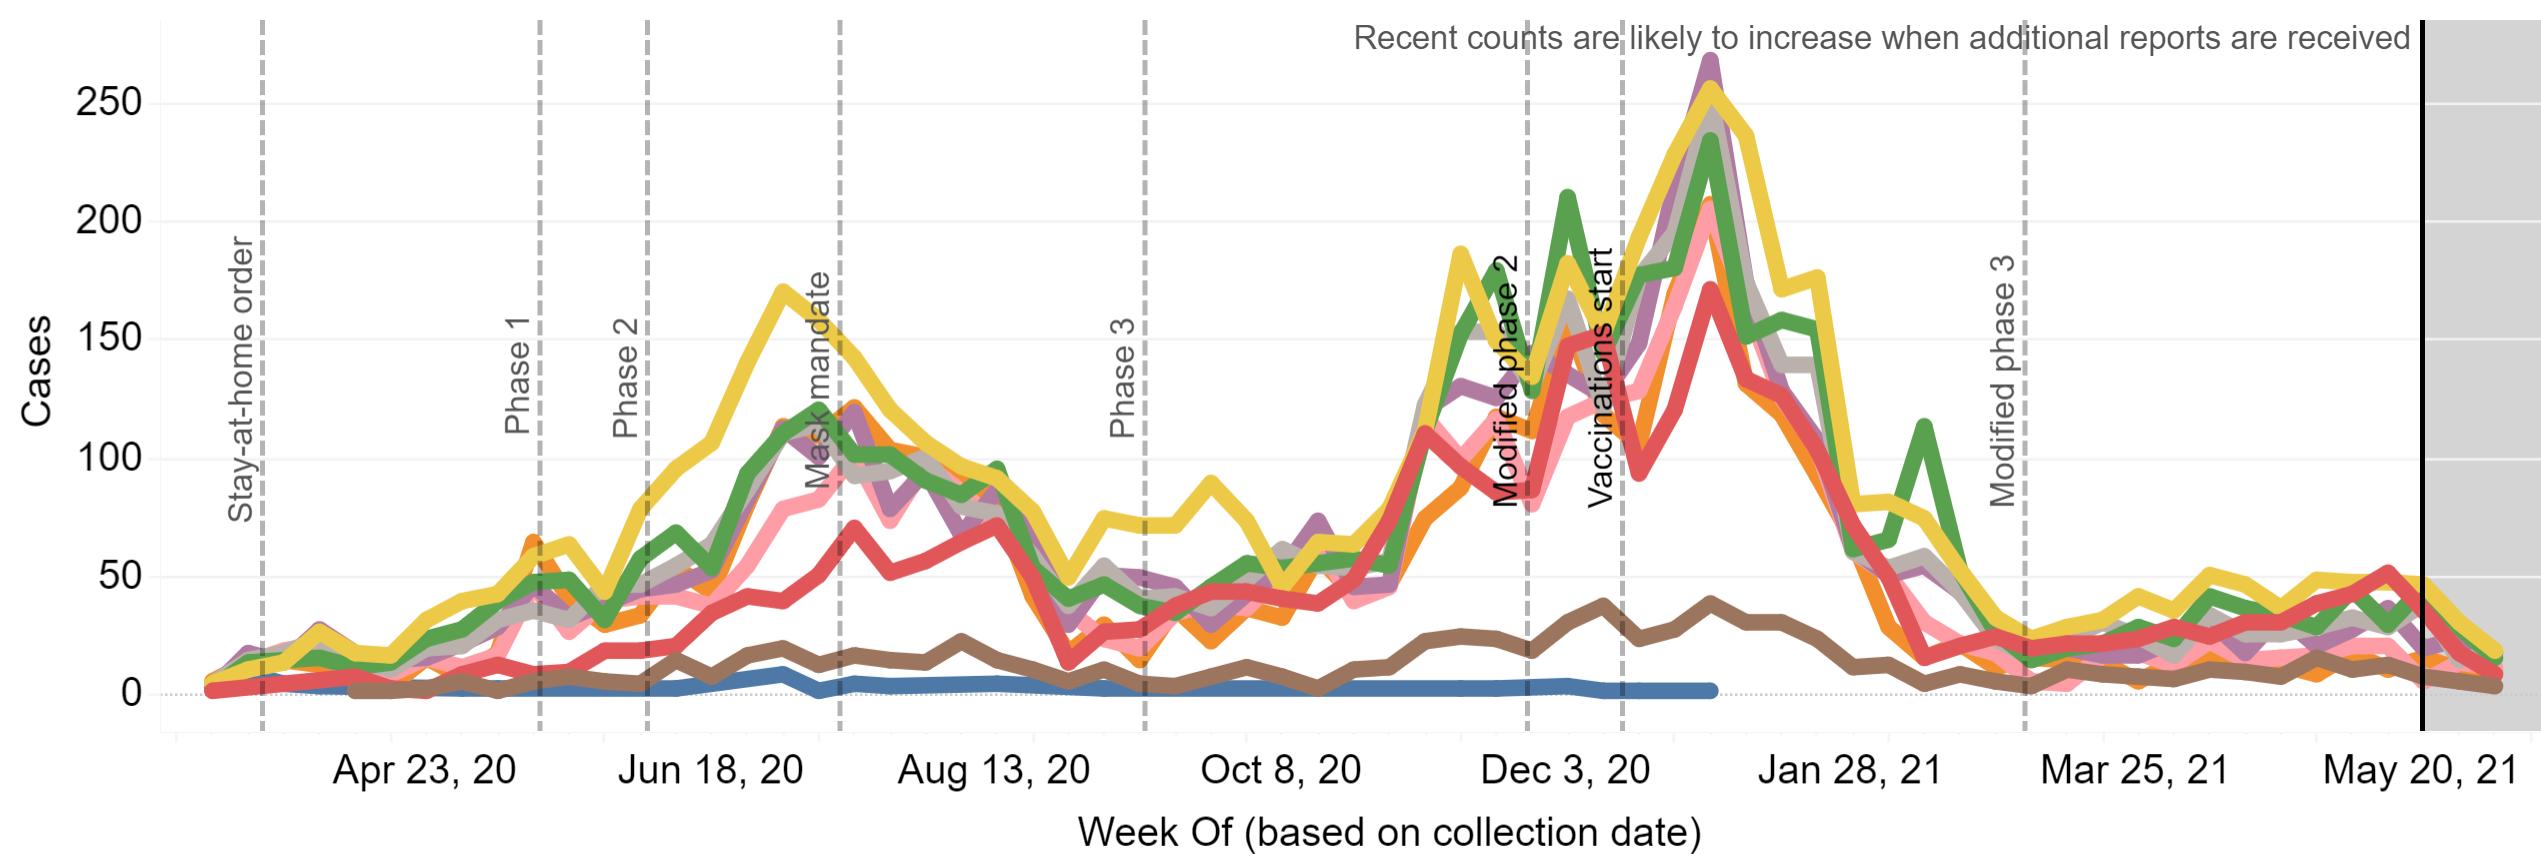
COVID-19 percent positive and test volume in Region 6 as of June 11, 2021.
Source: Louisiana Office of Public Health, Region 6 (Central Louisiana), June 11, 2021..
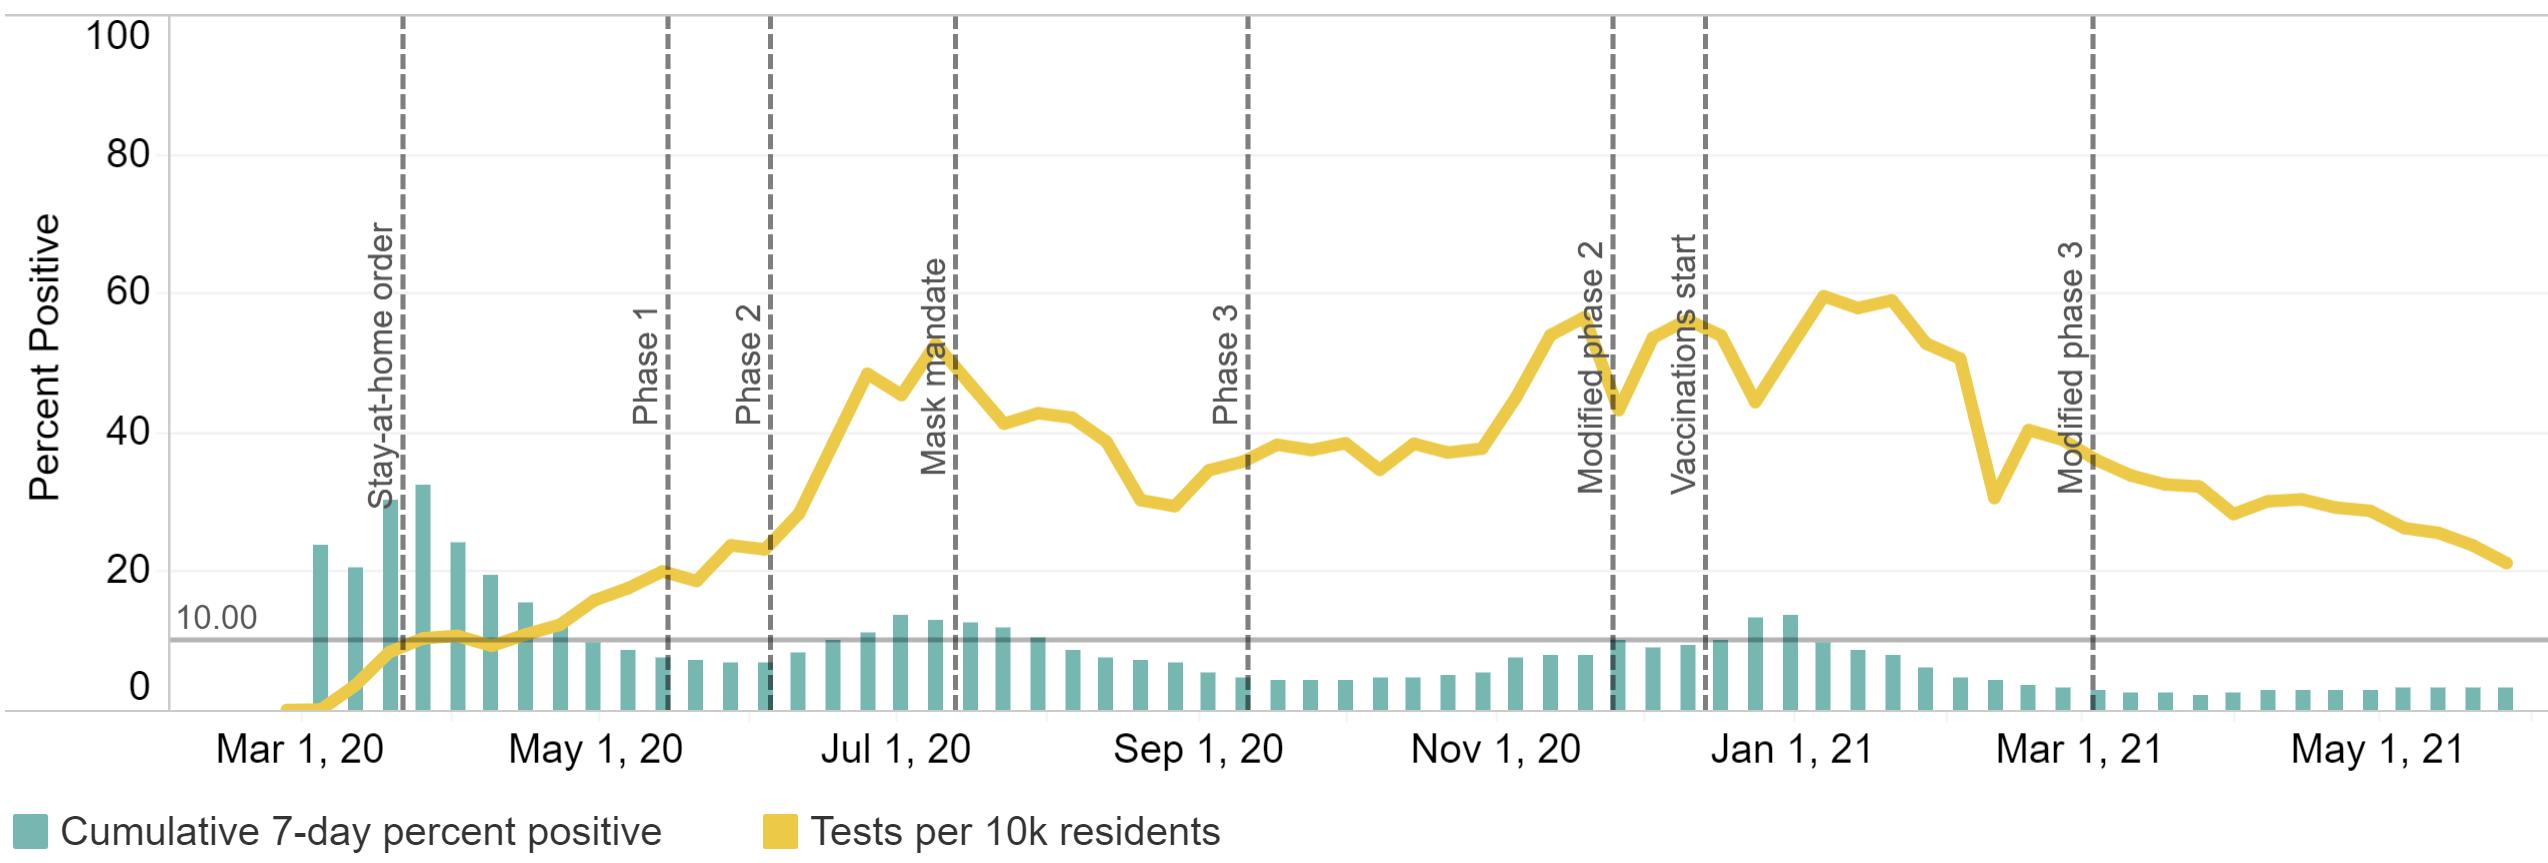
COVID-19 statewide risk by parish.
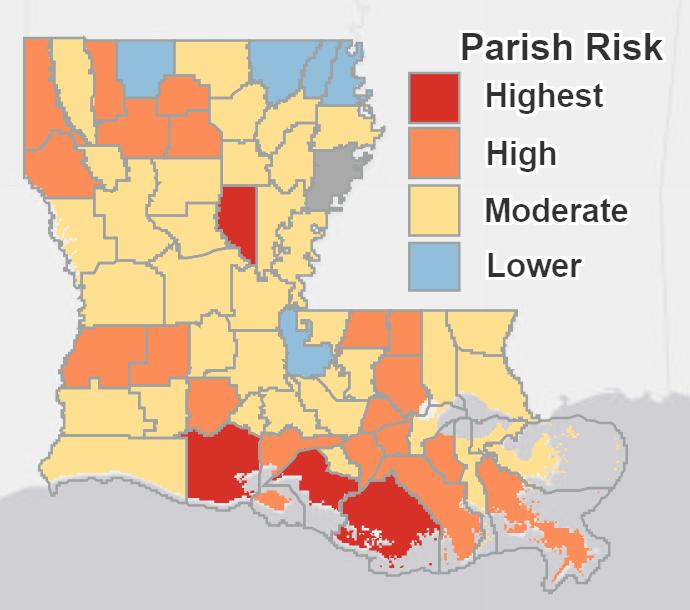
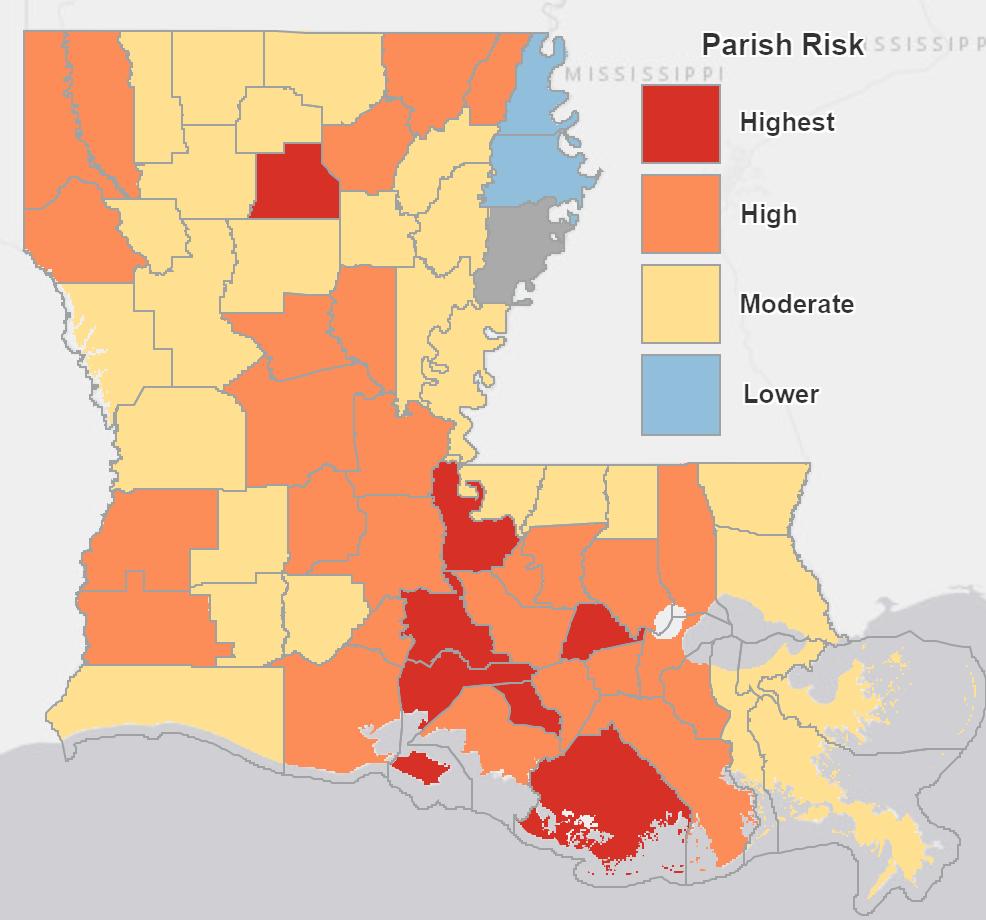
May 13, 2021
Source: Louisiana Office of Public Health, Region 6 (Central Louisiana), June 11, 2021.
June 11, 2021
Number of cases hospitalized (green line) and ventilated (yellow line) in Region 6 as of June 11, 2021.
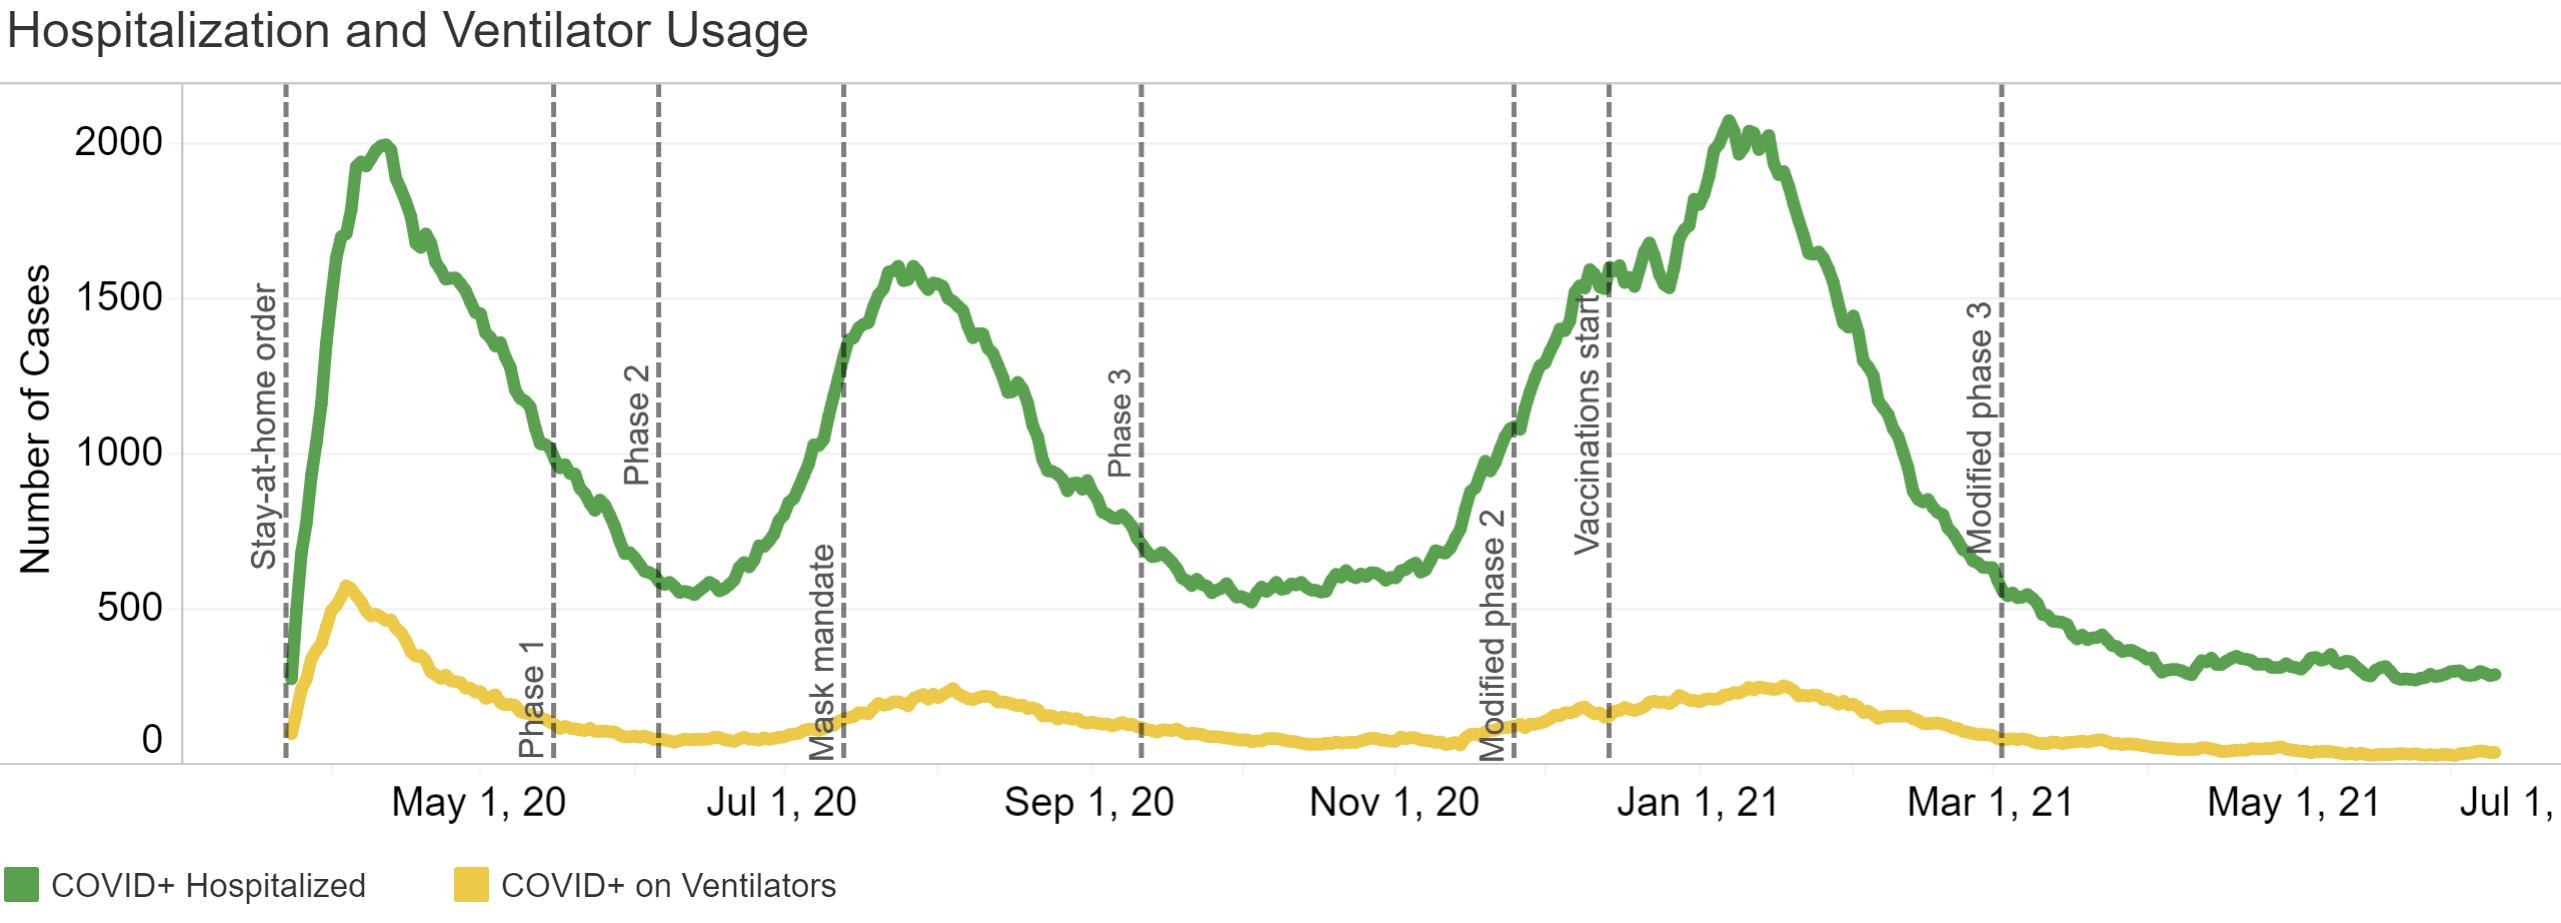
Source: Louisiana Office of Public Health, Region 6 (Central Louisiana), June 11, 2021.
COVID-19 deaths by date of death statewide as of June 11, 2021.
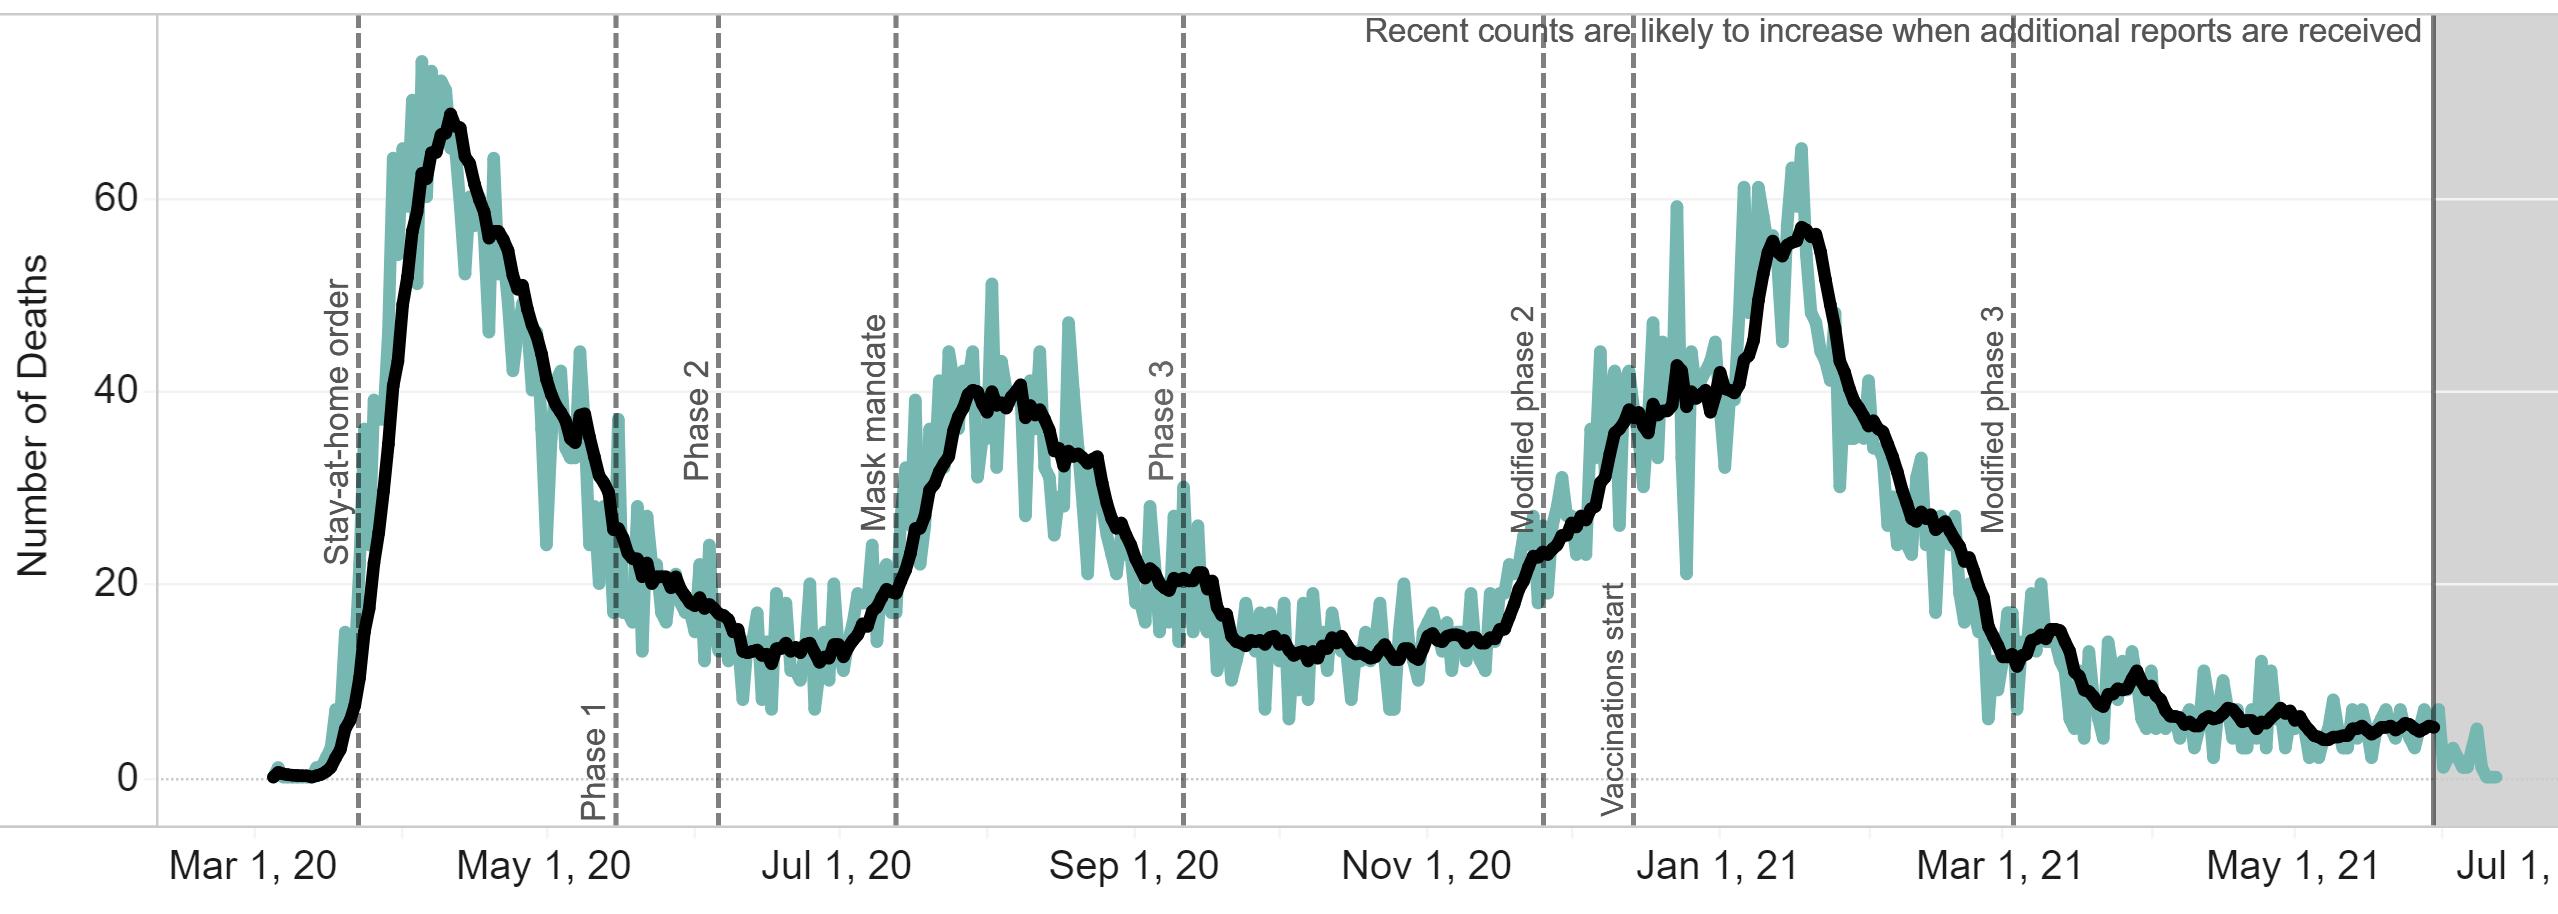
Source: Louisiana Office of Public Health, Region 6 (Central Louisiana), June 11, 2021.
COVID-19 cases (left) and deaths (right) statewide by age group as of June 11, 2021.
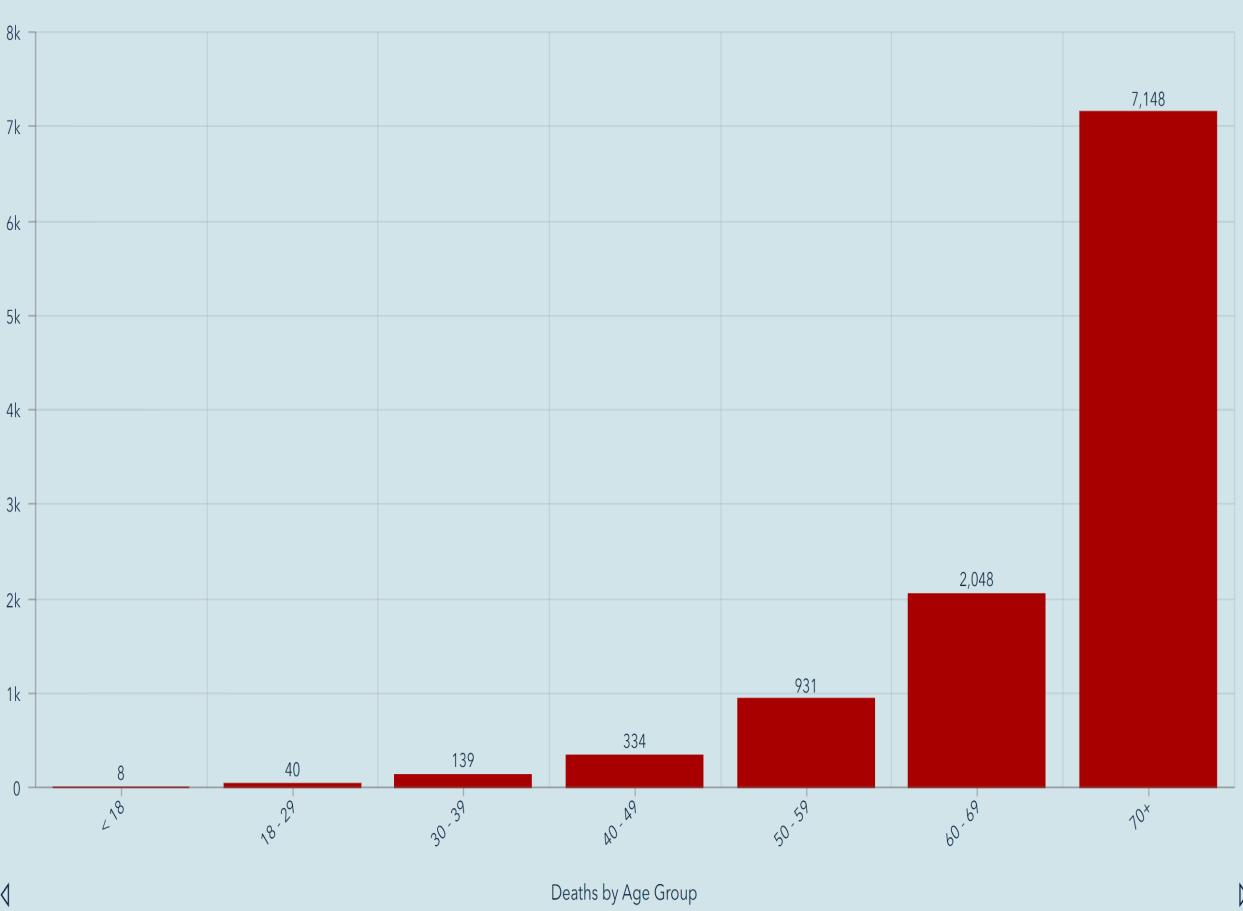
Source: Louisiana Office of Public Health, Region 6 (Central Louisiana), June 11, 2021.
Employed persons in the Alexandria MSA from 2019 – 2021.
Employed Persons in Alexandria, LA MSA
Since the pandemic started, employment bottomed at 55,588 in May 2020 and peaked at 61,615 in November 2020.
InApril 2021, 60,414 were employed, which is relatively unchanged at 60,487 in March.
Source: Louisiana Workforce Commission, June 14, 2021
Initial and continued unemployment claims in Louisiana from March 14, 2020 through May 29, 2021.


Statewide average weekly initial unemployment claims filed in May fell to 6,368 from 9,519 inApril, a -33% decrease.
Statewide average weekly continued unemployment claims in filed in May rose slightly to 50,719 from 50,446 in April, a 0.5% increase.
Source: Louisiana Workforce Commission, June 13, 2021
Initial and continued unemployment claims in central Louisiana from March 14, 2020 through May 29, 2021.

Average weekly initial unemployment claims in central Louisiana fell to 469 in May from 522 April, a -10.2% decrease. Average weekly continued unemployment claims in central Louisiana rose to 3,314 in May from 3,046 inApril, a 9% increase.
Source: Louisiana Workforce Commission, June 14, 2021
The table below shows April 2021 preliminary unemployment rate, labor force, and employment data for central Louisiana parishes.
InApril, parishes in central Louisiana had an average unemployment rate of 5.4% compared to 6.6% statewide.
At 3.4%, La Salle Parish had the lowest unemployment rate in the state.
Data Source: Louisiana Workforce Commission, June 14, 2021.
The table below shows April 2021 preliminary unemployment rate, labor force, and employment data for Metropolitan Statistical Areas in Louisiana.
At 4.4%, the Alexandria MSAhad the lowest unemployment rate among the state’s major metro areas for the twelfth straight month, unchanged from the previous month.
Louisiana’s unemployment rate also remained unchanged inApril at 6.6%.
Data Source: Louisiana Workforce Commission, June 14, 2021.
The table below shows the number of unemployed, number of advertised jobs online, and the ratio of unemployed to advertised job openings online for Metropolitan Statistical Areas in Louisiana in April 2021.
Alexandria metro area continues to have the tightest labor market in the state with only 0.59 unemployed persons per job opening.
Louisiana has 136,010 unemployed and 100,717 job openings for a ratio of 1.35.
An overview of sales, vehicle sales, and hotel occupancy taxes collected in the May 2021 reflecting sales activity in April 2021.
Note: April tax revenue reflects sales activity in March. N/a = Not available
Data Source noted in detailed reports.
An overview of sales tax revenue in Rapides Parish other towns and cities in May 2021 (excluding Alexandria and Pineville).


Note: Current tax revenue reflects sales activity in prior month.


(TR) Alexandria total sales tax revenue for May with previous month, year, and YTD comparisons.
(BR) Alexandria total monthly sales tax revenue from 2019 to present.
Note: April sales tax revenue reflects sales activity in March.
Data Source: Rapides Parish Police Jury Treasurer’s Reports, June 2021.
Avoyelles Parish total sales tax revenue for May with previous month, year, and year-to-date comparisons. Vehicle and hotel tax revenues are excluded.
Note: May sales tax revenue reflects sales activity in April.
Data Source: Avoyelles Parish School Board. June 2021.
Avoyelles Parish vehicle sales tax revenue for May with previous month, year, and year-to-date comparisons.
Note: May sales tax revenue reflects sales activity in April.
Data Source: Avoyelles Parish School Board. June 2021
Catahoula Parish total sales tax revenue for May with previous month, year, and year-to-date comparisons.
Note: May sales tax revenue reflects sales activity in April.
Data Source: Catahoula Parish Tax Administrator June 2021
Concordia Parish total sales tax revenue for May with previous month, year, and year-to-date comparisons.
Note: May sales tax revenue reflects sales activity in April.
Data Source: Concordia Parish Tax Administrator. June 2021
Evangeline Parish total sales tax revenue for May with previous month, year and YTD comparisons.
Note: May sales tax revenue reflects sales activity in April.
Data Source: Evangeline Parish Sales Tax Commissioner. June 2021
Evangeline Parish vehicle sales tax revenue for May with previous month, year and YTD comparisons.
Note: May sales tax revenue reflects sales activity in April.
Data Source: Evangeline Parish Sales Tax Commissioner. June 2021
La Salle Parish total sales tax revenue for May with previous month, year, and year-to-date comparisons.
Note: May sales tax revenue reflects sales activity in April.
Data Source: La Salle Parish Tax Administrator, May 2021

(TR) Pineville sales tax revenue for May with previous month, year, and YTD comparisons.
(BR) Pineville monthly sales tax revenue from 2019 to present.
Note: Current sales tax revenue reflects sales activity in the prior month.
Data Source: Rapides Parish Police Jury Treasurer’s Reports, June 2021.
Rapides Parish occupational license revenue YTD with previous YTD comparisons.
Note: Rapides Parish reflects unincorporated areas.
Data Source: Rapides Parish Police Jury Treasurer’s Reports, June 2021.
(TR) Rapides Parish sales tax revenue for May with previous month, year, and YTD comparisons.
(BR) Rapides monthly sales tax revenue from 2019 to present.
Note: Current sales tax revenue reflects sales activity in the prior month.
Data Source: Rapides Parish Police Jury Treasurer’s Reports, June 2021.
Rapides Parish vehicle sales tax revenue for May with previous month, year, and YTD comparisons. Data Source: Tax revenue data from Rapides Parish Police Jury Treasurer’s Reports, June 2021.
St. Landry Parish sales tax revenue for May with previous month, year, and YTD comparisons.
Note: May sales tax revenue reflects sales activity in April.
Data Source: Tax revenue data from St. Landry Parish School Board. June 2021
St. Landry Parish vehicle sales tax revenue for May with previous month, year, and YTD comparisons.
Note: May sales tax revenue reflects sales activity in April.
Data Source: Tax revenue data from St. Landry Parish School Board. June 2021

Remote seller tax revenue is tax revenue from online sales by location of the seller at the time of purchase.
Total Remote Sellers Sales Tax Collection in Cenla August 2020 - May 2021
SinceAugust 2020, $11.7 million in sales tax revenue has been collected from online sales in central Louisiana.
Online sales tax revenue in May declined 21% from April.
Note: Sales tax revenue collected in May reflects sales activity inApril.
Data Source: Louisiana Sales and Use Tax Commission for Remote Sellers. August 2020 – June 2021


Remote sellers tax revenue is tax revenue from online sales by location of the seller at the time of purchase.
Note: Sales tax revenue collected in one month reflects sales activity in the prior month.
Data Source: Louisiana Sales and Use Tax Commission for Remote Sellers. August 2020 – June 2021


Remote sellers tax revenue is tax revenue from online sales by location of the seller at the time of purchase.
Note: Sales tax revenue collected in one month reflects sales activity in the prior month.
Data Source: Louisiana Sales and Use Tax Commission for Remote Sellers. August 2020 – June 2021


Remote sellers tax revenue is tax revenue from online sales by location of the seller at the time of purchase.
Note: Sales tax revenue collected in one month reflects sales activity in the prior month.
Data Source: Louisiana Sales and Use Tax Commission for Remote Sellers. August 2020 – June 2021
The valuation (estimated development cost) of new commercial construction permits issued by the City of Alexandria in May 2021 with previous month, year, and YTD comparisons.
The valuation (estimated development cost) of new residential construction permits issued by the City of Alexandria in May 2021 with previous month, year, and YTD comparisons.
This chart shows the valuation of permits issued by Rapides Area Planning Commission in Allen Parish in May between 2018-2021 with month-tomonth, year-to-year, and year-to-date comparisons.
Data Source: RapidesArea Planning Commission, June, 2021
This chart shows the valuation of permits issued by Rapides Area Planning Commission in Avoyelles Parish in May between 2019-2021 with month-to-month, year-to-year, and year-to-date comparisons.
Data Source: RapidesArea Planning Commission, June 2021.
This chart shows the valuation of permits issued by Rapides Area Planning Commission in Evangeline Parish in May between 2018-2021 with month-to-month, year-to-year, and year-to-date comparisons.
Data Source: RapidesArea Planning Commission, June 2021.
This chart shows the valuation of permits issued by Rapides Area Planning Commission in the City of Pineville in May between 20182021 with month-to-month, year-to-year, and year-to-date comparisons.
Data Source: RapidesArea Planning Commission, June 2021.
This charts shows the valuation of permits issued by Rapides Area Planning Commission in Rapides Parish (excluding Alexandria) in May between 20182021 with month-to-month, year-to-year, and year-to-date comparisons.
Data Source: RapidesArea Planning Commission, June 2021.
New residential construction permit valuation (estimated development cost) issued by Rapides Area Planning Commission by jurisdiction in May 2021 compared to March 2020.
Valuation of New Residential Construction May 2020 vs May 2021
Note: City ofAlexandria permits are accounted for separately.
Data Source: RapidesArea Planning Commission, June 2021.
The chart represents the lumber price index in the U.S. from January 2020 – May 2021.
Monthly Price Index of Lumber 2020 - 2021
In May 2021, the US Lumber Price Index rose 16.5% over the previous month.
The US Lumber Price Index has risen in 10 of the past 12 month. From May 2020 to May 2021, the US Lumber Price Index rose from 225 to 452, an 100% increase.
Data Source: Fed Reserve Economic Database, St. Louis Federal Reserve Bank, June 15, 2021.

The count of active single-family and condo/townhome listings for Alexandria MSA (excludes pending listings) for May 20182021 with month-to-month and year-over-year comparisons.
Active listings decreased65% since May 2020.

The count of pending single-family and condo/townhome listings for Alexandria MSA for May 2018-2021 with month-to-month and year-over-year comparisons.

The median number of days property listings spend on the market in Alexandria MSA for May 2018-2021 with month-to-month and year-over-year comparisons.
The median listing price of houses in Alexandria MSA for May 20182021 with month-to-month and year-over-year comparisons.
The median listing price fell -6% sinceApril 2021 from $172,450 to $161,500 and declined -18% since May 2020.

The average listing price of houses in Alexandria MSA for May 20182021 with month-to-month and year-over-year comparisons.
The average listing price fell -0.1% to $238,110 this month from $238,409 inApril, and is -3.1% below year ago levels.
Avoyelles Parish hotel occupancy tax revenue for May with previous month, year, and year-to-date comparisons.
Note: May tax revenue reflects hotel occupancy activity in April. Hotel occupancy tax revenue is used as a proxy for hotel occupancy rate.
Data Source: Avoyelles Parish School Board. June 2021.
Rapides Parish hotel occupancy tax revenue for May 2020 with previous month, year, and YTD comparisons.
Note: April tax revenue reflects hotel occupancy activity in March. Hotel occupancy tax revenue is used as a proxy for hotel occupancy rate.
Data Source: Rapides Parish Police Jury Treasurer’s Reports, June 2021.
This chart shows total passenger throughput at AEX and other airports in May 2021 as a percent of traffic in 2019. AEX is the solid black line. Data
Passenger Throughput as a Percent 2019 Traffic (May 2021)
AEX had the second highest total passenger throughput in the state in May at 88% compared to 2019 which showsAEX’s relative outperformance in 2021.


Nationwide daily percentage of passengers passing through current TSA checkpoints in 2021 expressed as a percentage of 2019 traffic.
Airport Passenger Throughput Traffic At AEX 2021 vs 2019
Nationally, air passenger traffic in May was up 15% overApril and was up 579% from a year ago.
% Chg 2021 vs 2019
Data Source: DHS, Transportation Security Administration, https://www.tsa.gov/coronavirus/passenger-throughput, June 6, 2021
Total gasoline sales in Louisiana in 2019 - 2021.


In March 2021, Louisiana gasoline sales reached the highest level since May 2019 and the highest March since 2018.
March 2021 gasoline sales increased 17% over February and 10% over a year ago.
Data Source: U.S. Energy Information Administration, Prices, Sales Volumes & Stocks by State, June 6, 2021
The chart below represents the number of new businesses established each month in Rapides from January 2019 through May 2021.


The number of new businesses established in Rapides in May 2021 was 16% higher thanApril 2021 and 185% over a year ago.
Year-to-date new businesses in Rapides are up 50% over 2020.
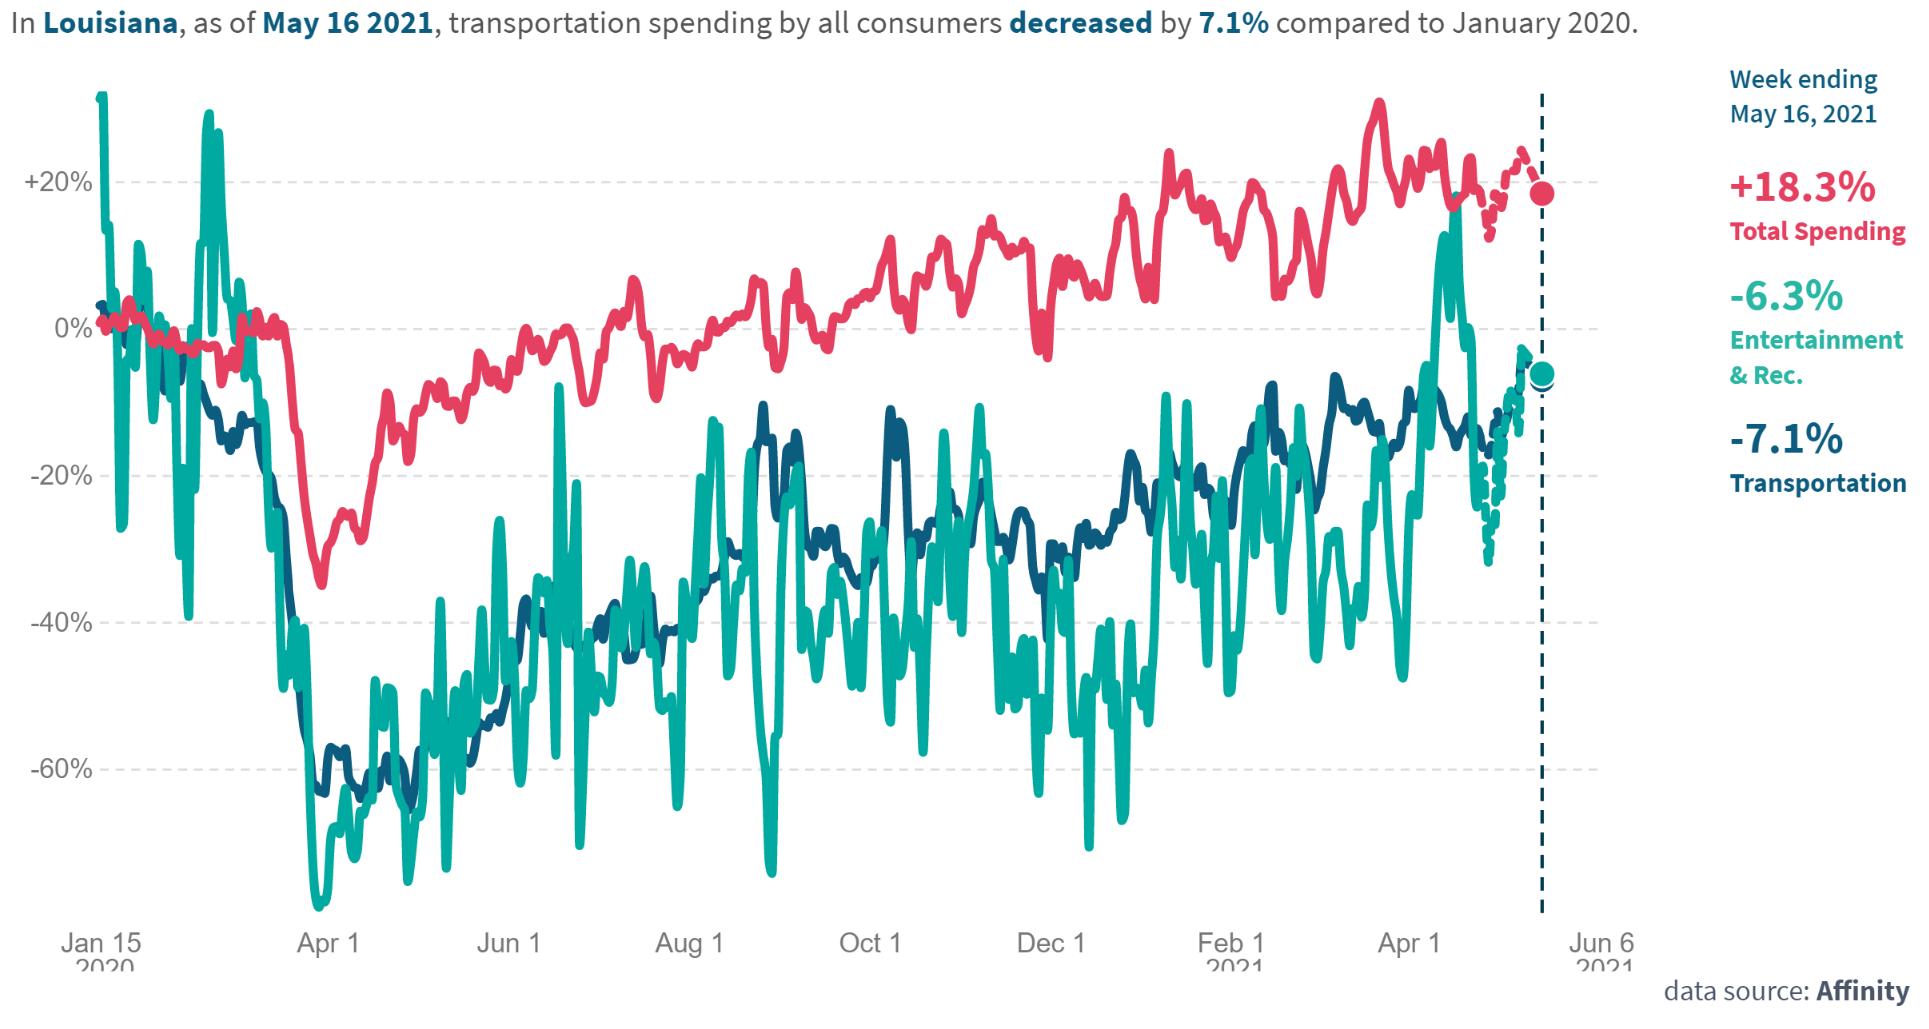
These graphs represents the percent change in average consumer credit and debit card spending in Louisiana as of May 16, 2021 with January 2020 as the baseline.
Louisianans are spending more of entertainment, recreation, and health care this Spring.
For the first time since the pandemic started, entertainment and recreation spending exceeded January 2020 levels by 18% inApril, 2021.
• Total consumer spending on May 16, 2021 in Louisiana was up 18% compared to January 2020, with retail spending up 34% while entertainment and recreation spending down -6%. Grocery spending was up 15%, health care up 24%, and restaurants up 5%.
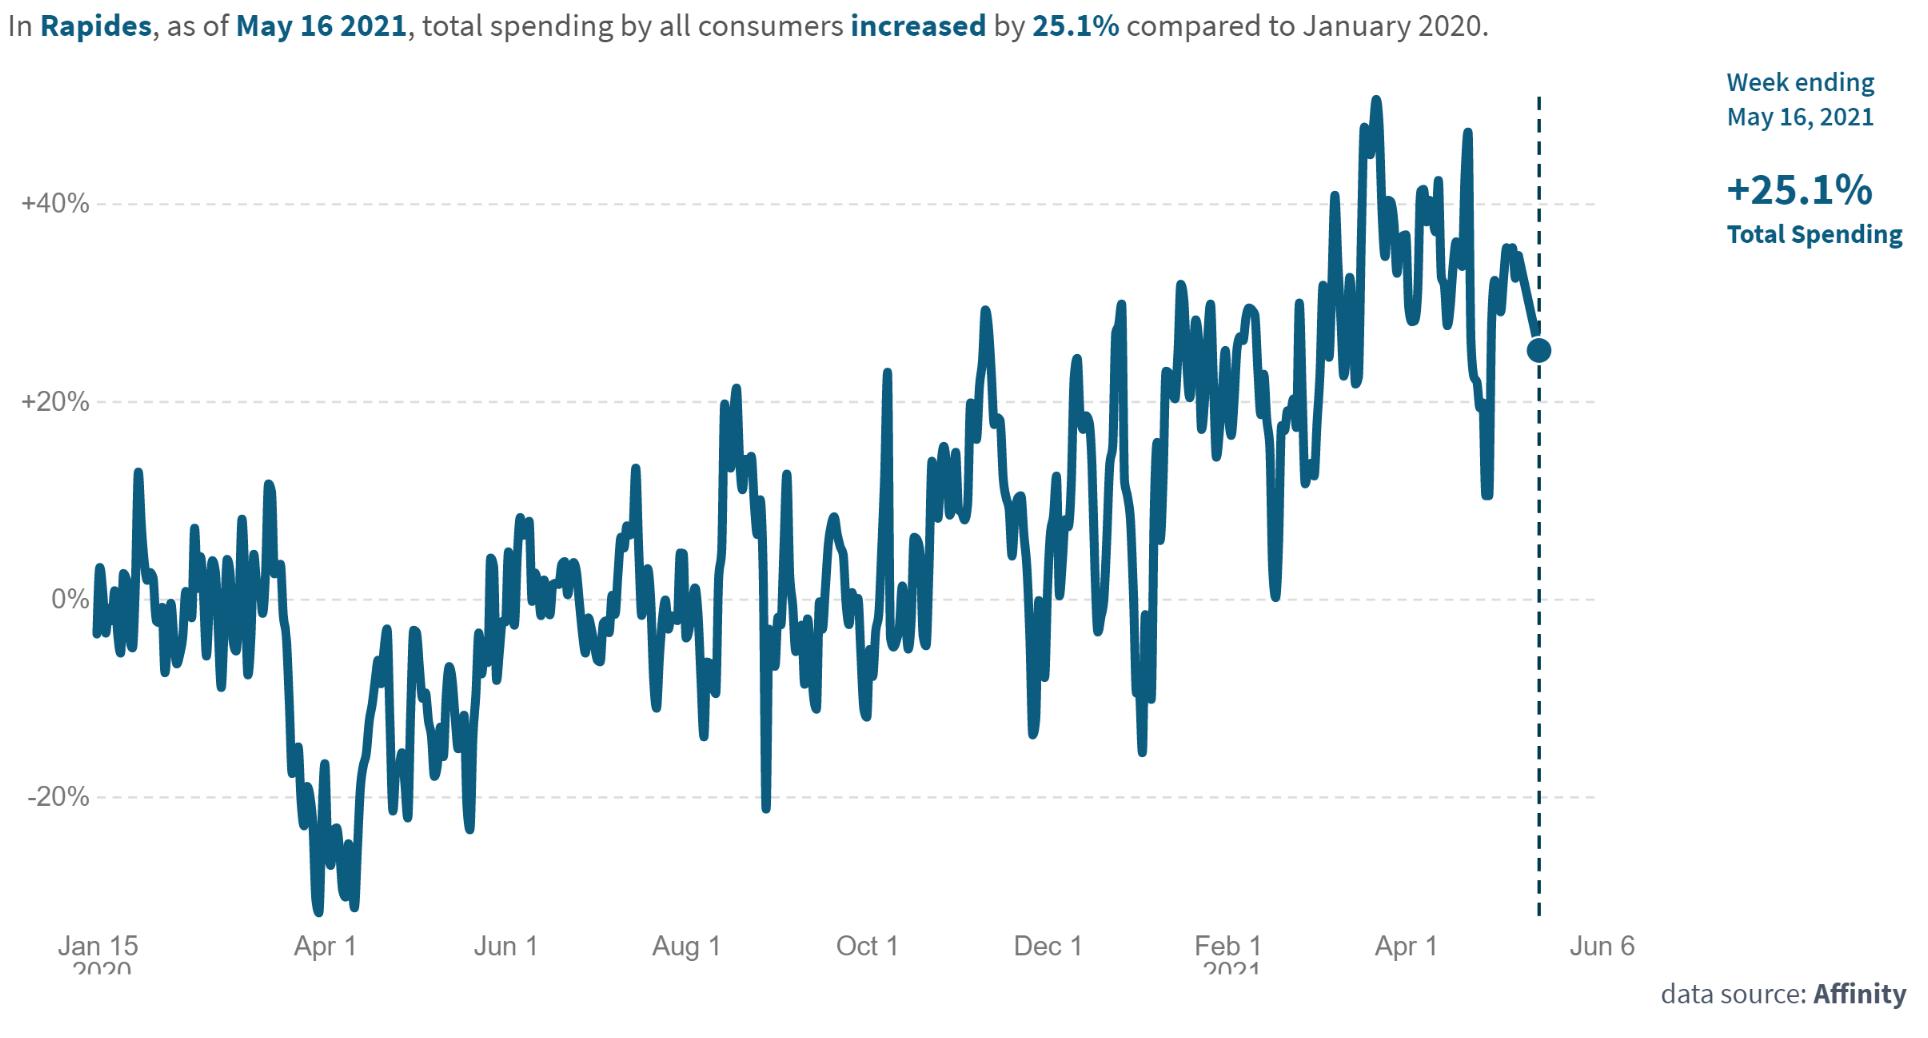
The table and chart represents the percent change in average consumer credit and debit card spending in Cenla as of May 16, 2021 with January 2020 as the baseline, while the chart represents Rapides.
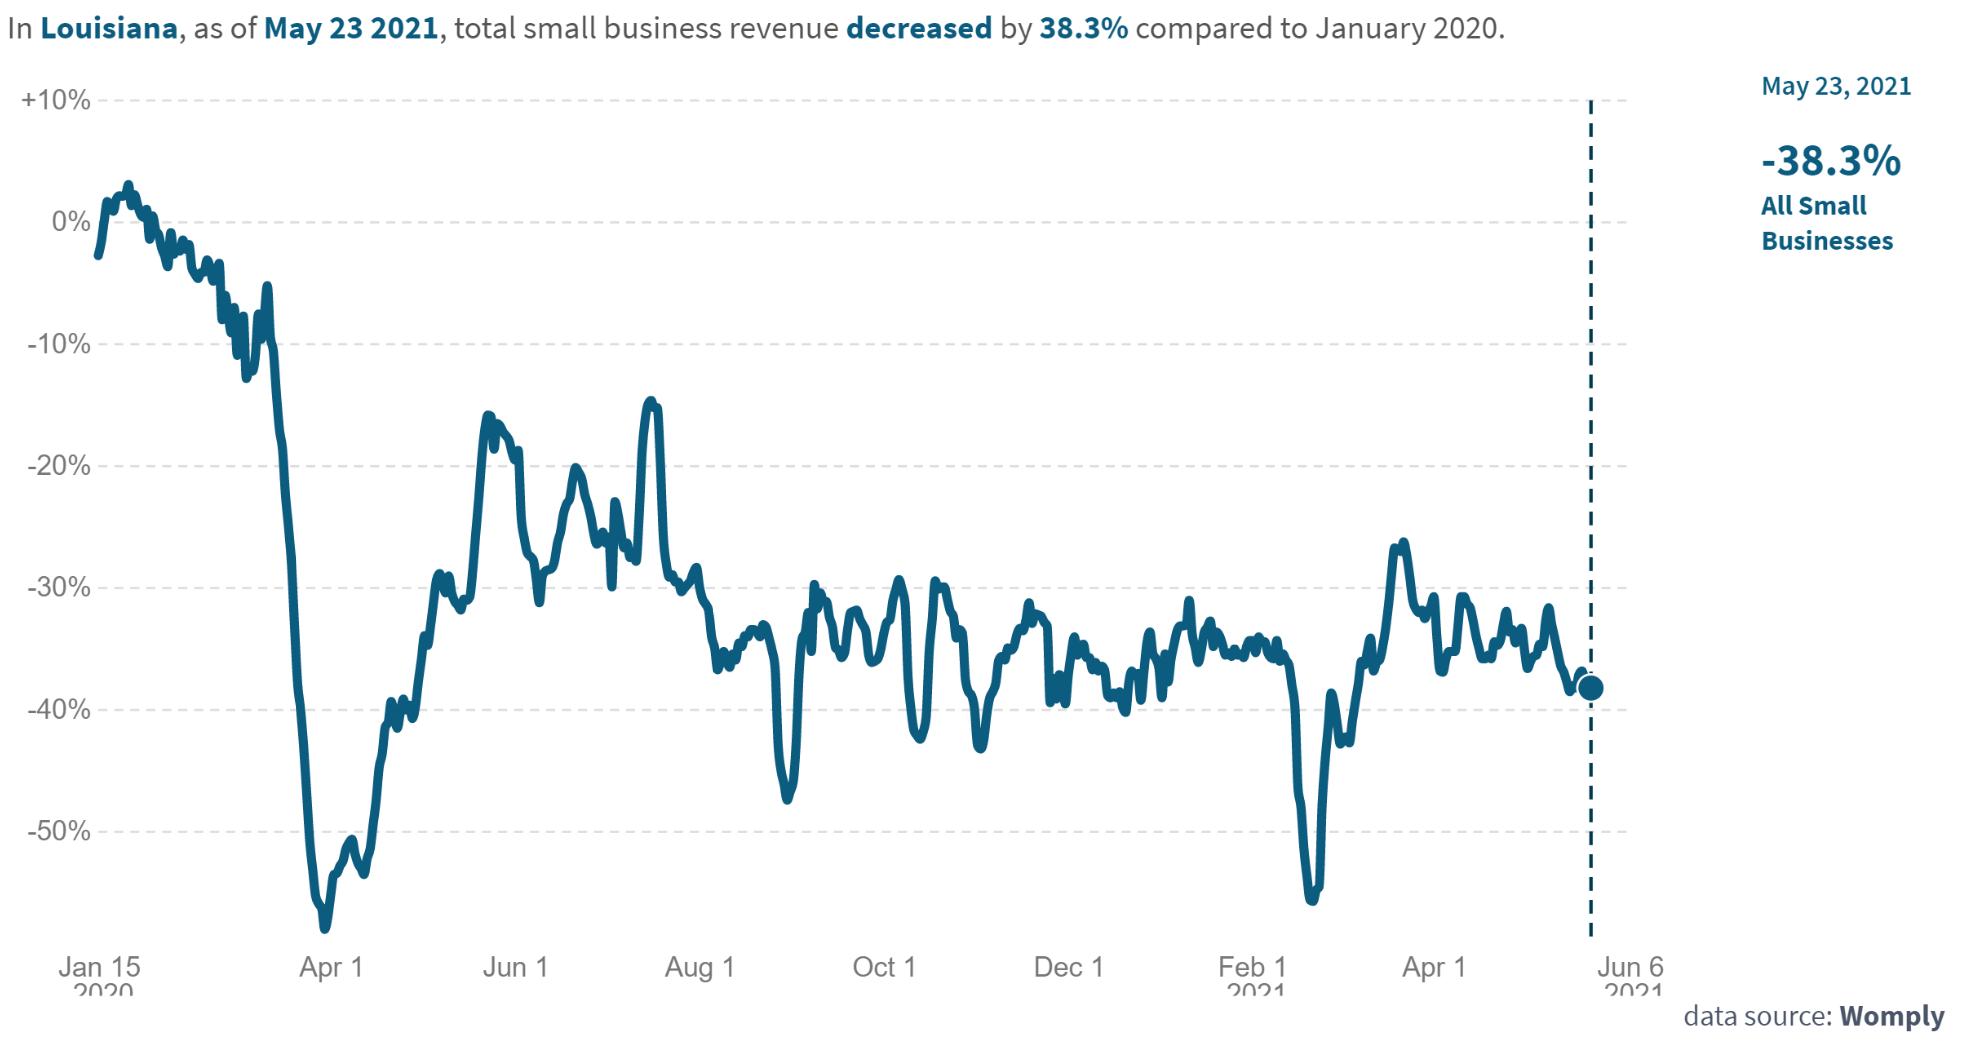
The chart below represents the percent change in small business revenue in Louisiana as of May 23, 2021 with January 2020 as the baseline. The table shows the percentage change for small business revenue by industry.
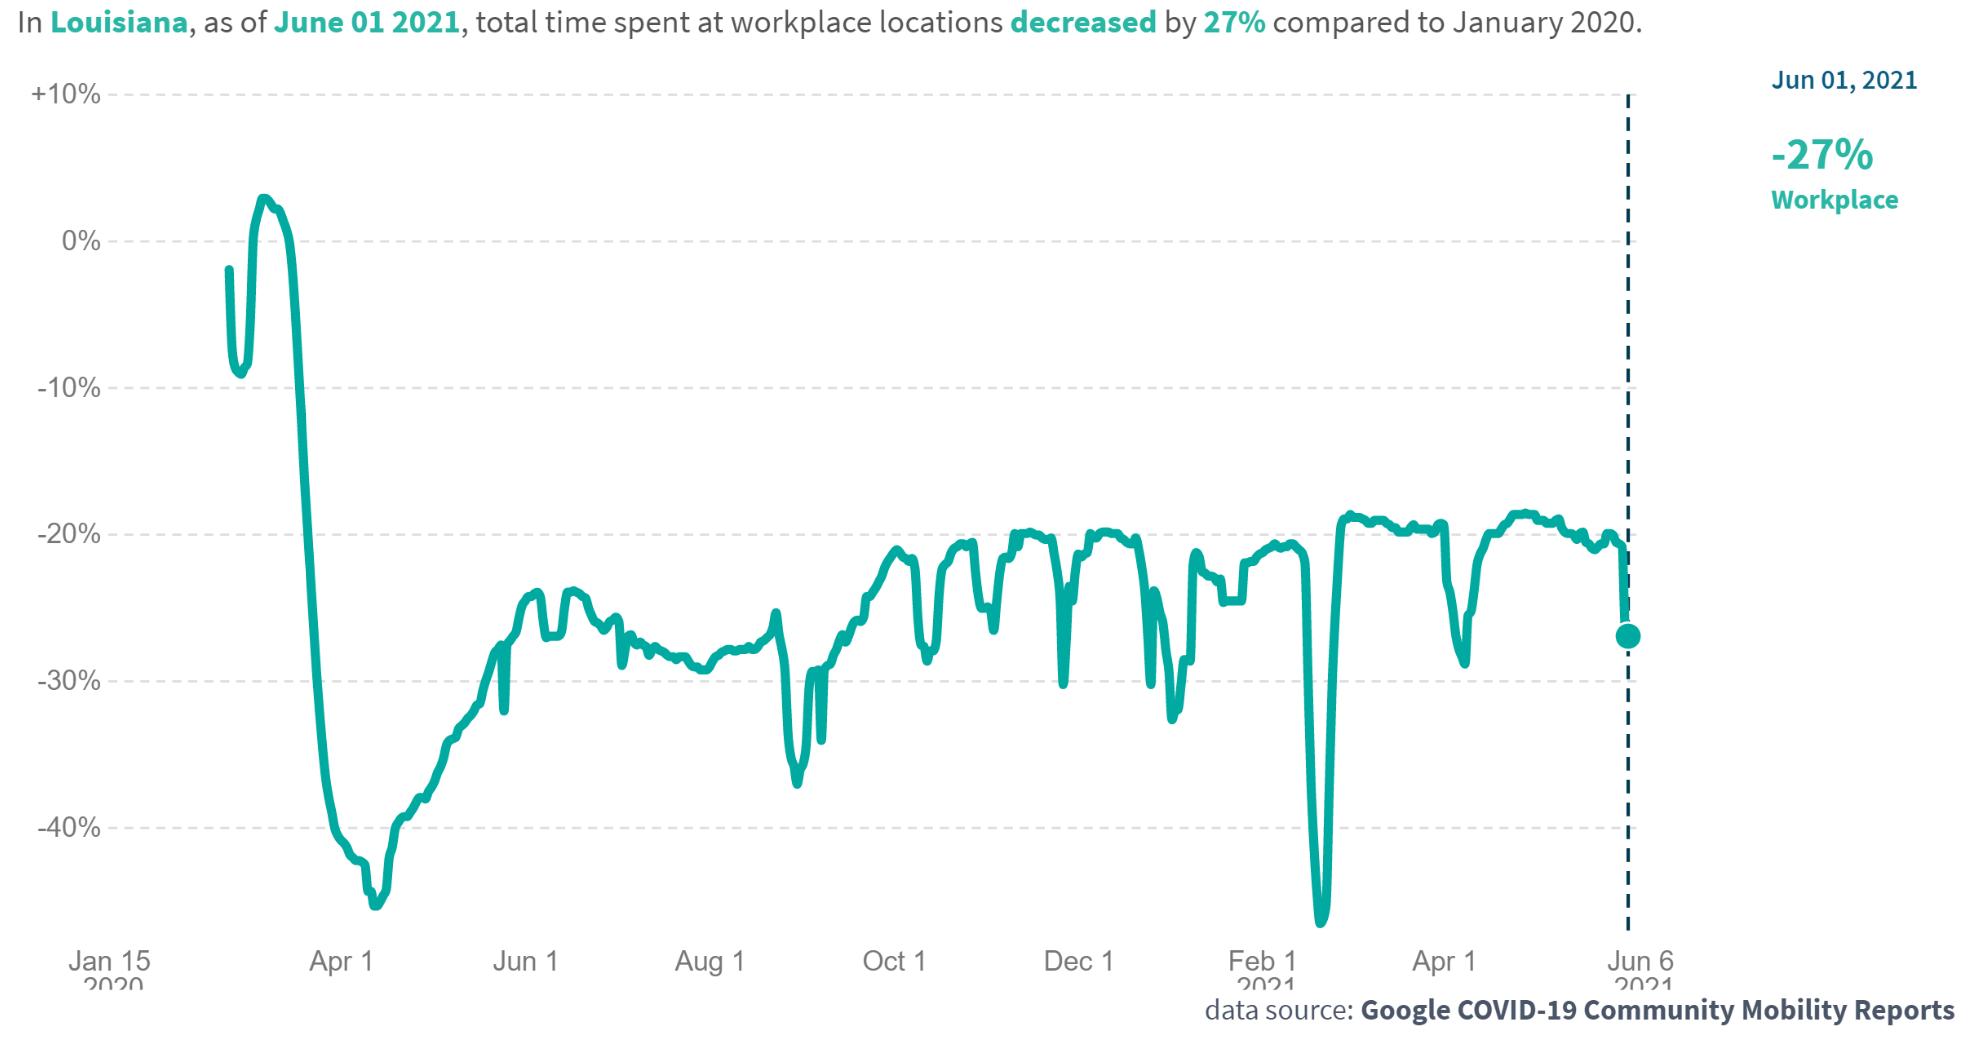
The chart represents the percent of time employees in Cenla and statewide spent at work as of June 1, 2021 with January 2020 as the baseline.
The Coincident Economic Activity Index for Louisiana includes four indicators: nonfarm payroll employment, the unemployment rate, average hours worked in manufacturing and wages and salaries. The index is set to match the trend for gross state product.
Coincident Economic Activity Index for Louisiana January 2020 - April 2021
The index for April 2021 increased 0.2% over March 2021, indicating the economic recovery in Louisiana is still expanding although the recovery is slowing.

Data Source: FRED Economic Data, Federal Reserve Bank of St. Louis, June 6, 2021. https://fred.stlouisfed.org/series/LAPHCI
Represents the number of drilling rigs actively exploring for or developing oil or natural gas in Louisiana and the U.S.


In May 2021, the rig count in Louisiana increased 13% overApril 2021, indicating oil and natural gas exploration is accelerating.
In Louisiana, the rig count is up 51% from a year ago and 30% nationwide.
Source: Baker Hughes, https://rigcount.bakerhughes.com/na-rig-count, June 6, 2021
Gaming revenue in Louisiana for April 2021 with previous month and year comparisons.
Casinos were closed inApril 2020.
Data Source: Louisiana Gaming Control Board, June 6, 2021. http://lgcb.dps.louisiana.gov/revenue_reports.html
Monthly U.S. economic indicators for April 2021.
Data Source: U.S. Census, https://www.census.gov/economic-indicators/, June 12, 2021.
The data presented throughout the CENLA Economic Dashboard reflects contributions from the following local organizations.
• Rapides Parish Policy Jury Treasurer
• Rapides Sales TaxAdministrator
• Avoyelles Parish School Board
• Alexandria International Airport
• RapidesArea Planning Commission
• City ofAlexandria Planning Division
• Evangeline Parish Sales Tax Commissioner
• Concordia, Catahoula, & La Salle TaxAdministrator
• Louisiana Office of Public Health, Region 6
• St. Landry Parish School Board
Also, special thanks to the following partners for distributing the dashboard.
Next Issue: Week of July 19th
• LSUAFoundation
• Central Louisiana Regional Chamber of Commerce
• Marksville Chamber of Commerce
• Bunkie Chamber of Commerce
• Evangeline Chamber of Commerce
• Concordia Chamber of Commerce
• St. Landry Chamber of Commerce
• Greater Vernon Chamber of Commerce