CENLA ECONOMIC DASHBOARD
May 17, 2021.
Dr.RandallDupont Dean,CollegeofBusinessLouisianaStateUniversityofAlexandria
rdupont@lsua.edu


May 17, 2021.
Dr.RandallDupont Dean,CollegeofBusinessLouisianaStateUniversityofAlexandria
rdupont@lsua.edu
• Natchitoches and Rapides have the highest percentage of completed vaccinations in Region 6 at 25% each, up from 15% and 17%, respectively, a month ago. However, Region 6 has the second lowest vaccination rate in the state with 21% of the population vaccinated, up from 14% in April.
• In March 2021, 60,487 were employed in the Alexandria MSAcompared to 59,483 in February, a 1.7% increase. Since the pandemic started, employment bottomed at 55,588 in May 2020 and peaked at 61,615 in November 2020.
• Statewide average weekly initial unemployment claims filed inApril rose to 9,519 from 8,418 in March, a 13% increase, while statewide average weekly continued unemployment claims in filed inApril rose to 50,446 from 44,514 in March, a 13% increase.
• In CENLA, average weekly initial unemployment claims in central Louisiana rose to 522 in April from 401in March, a 30% increase, while average weekly continued unemployment claims in central Louisiana rose to 3,046 in April from 2,932 in March, a 4% increase.
• Louisiana’s unemployment rate fell 0.5% in March to 6.6% from 7.1% in February and 7.6% in January.
• In March, parishes in central Louisiana had an average unemployment rate of 5.6% compared to 6.6% statewide.
• At 3.4%, La Salle Parish had the lowest unemployment rate in the state, while Rapides had the 9th lowest at 4.4%.
• At 4.4%, the Alexandria MSA had the lowest unemployment rate among the state’s major metro areas for the eleventh straight month, falling 0.3% since February.
• Alexandria metro area continues to have the tightest labor market in the state with only 0.53 unemployed persons per job opening compared to 1.40 statewide.
• All central Louisiana parishes saw gains in sales tax revenue in March with increases ranging from a 21% to 282%. Yearto-date, all central Louisiana are outperforming the same period in 2020.April tax collections reflect sales activity in March.
• Rapides sales tax revenue is up 46% over February, 45% overApril 2020, and 21% over the first four months of last year.

• Ball, Boyce, and Woodworth experienced 47%-plus sales tax gains over the previous month.
• Occupational license revenue was 5.3% year-to-date in April over last year, indicating stronger than expected growth in business formation.
• Vehicle sales were strong in central Louisiana except for Avoyelles. Vehicle sales tax revenue was up 30% in Rapides and 55% and 62% respectively in Evangeline and St. Landry. YTD, vehicle sales tax revenue is up in all four parishes between 5 – 33%.
• Online sales tax revenue in central Louisiana increased 18.5% in March over February.
• Since August 2020, $10.4 million in sales tax revenue has been collected from online sales in central Louisiana, with Rapides collecting $3.1 million of that total.
• Year-to-date, the value of residential building permits in the Alexandria MSA is up 77% and commercial building permits up 6%.
• Residential construction permits in central Louisiana in April 2021 are up 2% overApril 2020.
• US homeownership rate peaked in 2004 at 69%, while the Louisiana homeownership rate peaked in 2008 at 73.5%. In 2020, Louisiana remained 5.5% below it’s peak compared to 3.4% below nationwide.
• The US Lumber Price Index has risen in 10 of the past 12 month. From April 2020 toApril 2021, the US Lumber Price Index rose from 205 to 388, an 89% increase.
• TheAlexandria real estate market remains strong with active listings down and pending listings up over March. Active listings fell 60% and pending listings rose 53% inApril from a year ago. The number of days a house stayed on the market fell 22% from a year earlier.
• Hotel occupancy in Rapides andAvoyelles increased over last month and are up for the year. In Rapides, occupancy increased 23% in March compared to February and 119% compared to a year ago.Avoyelles likewise experienced a 2% gain over last month and a 6% gain this year. Hotel occupancy tax revenue is a proxy for the hotel occupancy rate.
• Average passenger traffic in U.S. increased 13% inApril 2021 from March 2021.
• Nationwide air passenger traffic inApril 2021 was up 9% above March and 1170% from a year ago.
• In February 2021, Louisiana gasoline sales increased 0.9% from January and was -9.3% below February 2020.
• Gasoline sales in Louisiana over the past 12 months are down -8.0% compared to the previous 12 months.
• The number of new businesses established in Rapides in April 2021 was 7% higher than March 2021 and 158% over a year ago. Year-to-date new businesses in Rapides are up 30% over 2020.
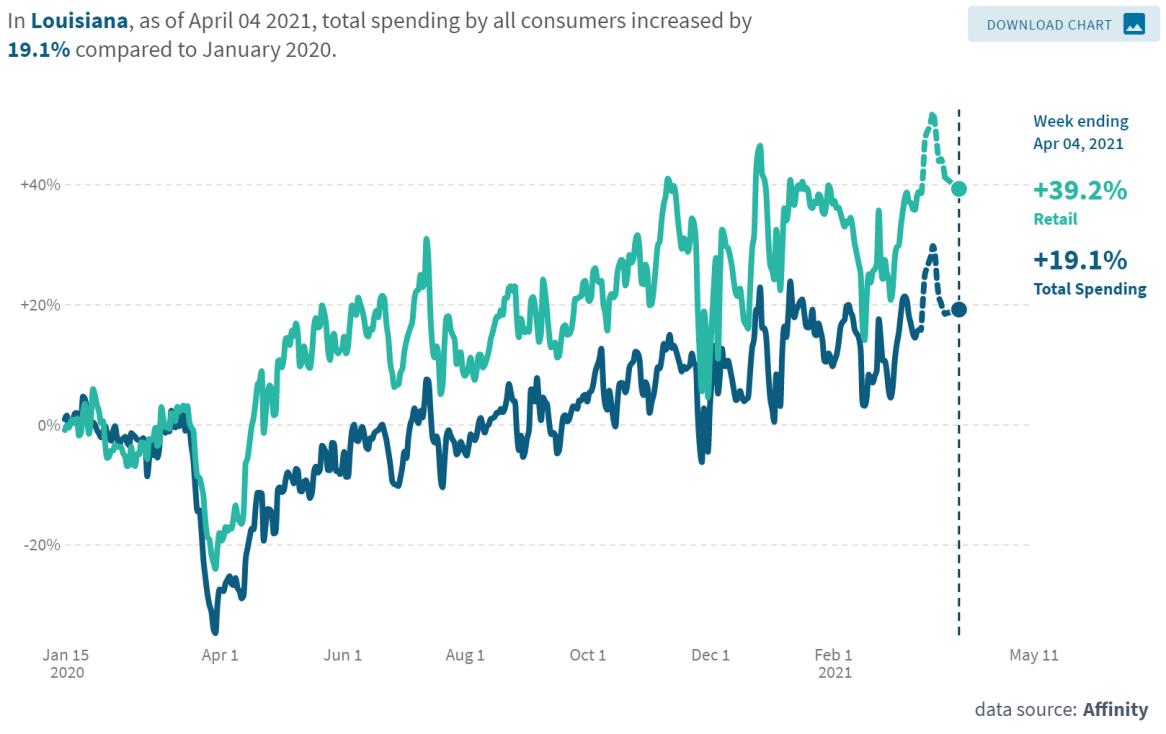
• Total consumer spending onApril 4, 2021 in Louisiana was up 19% compared to January 2020, with retail spending up 39% while entertainment and recreation spending is down25%. Grocery spending was up 32%, health care up 9%, and restaurants up 4%.
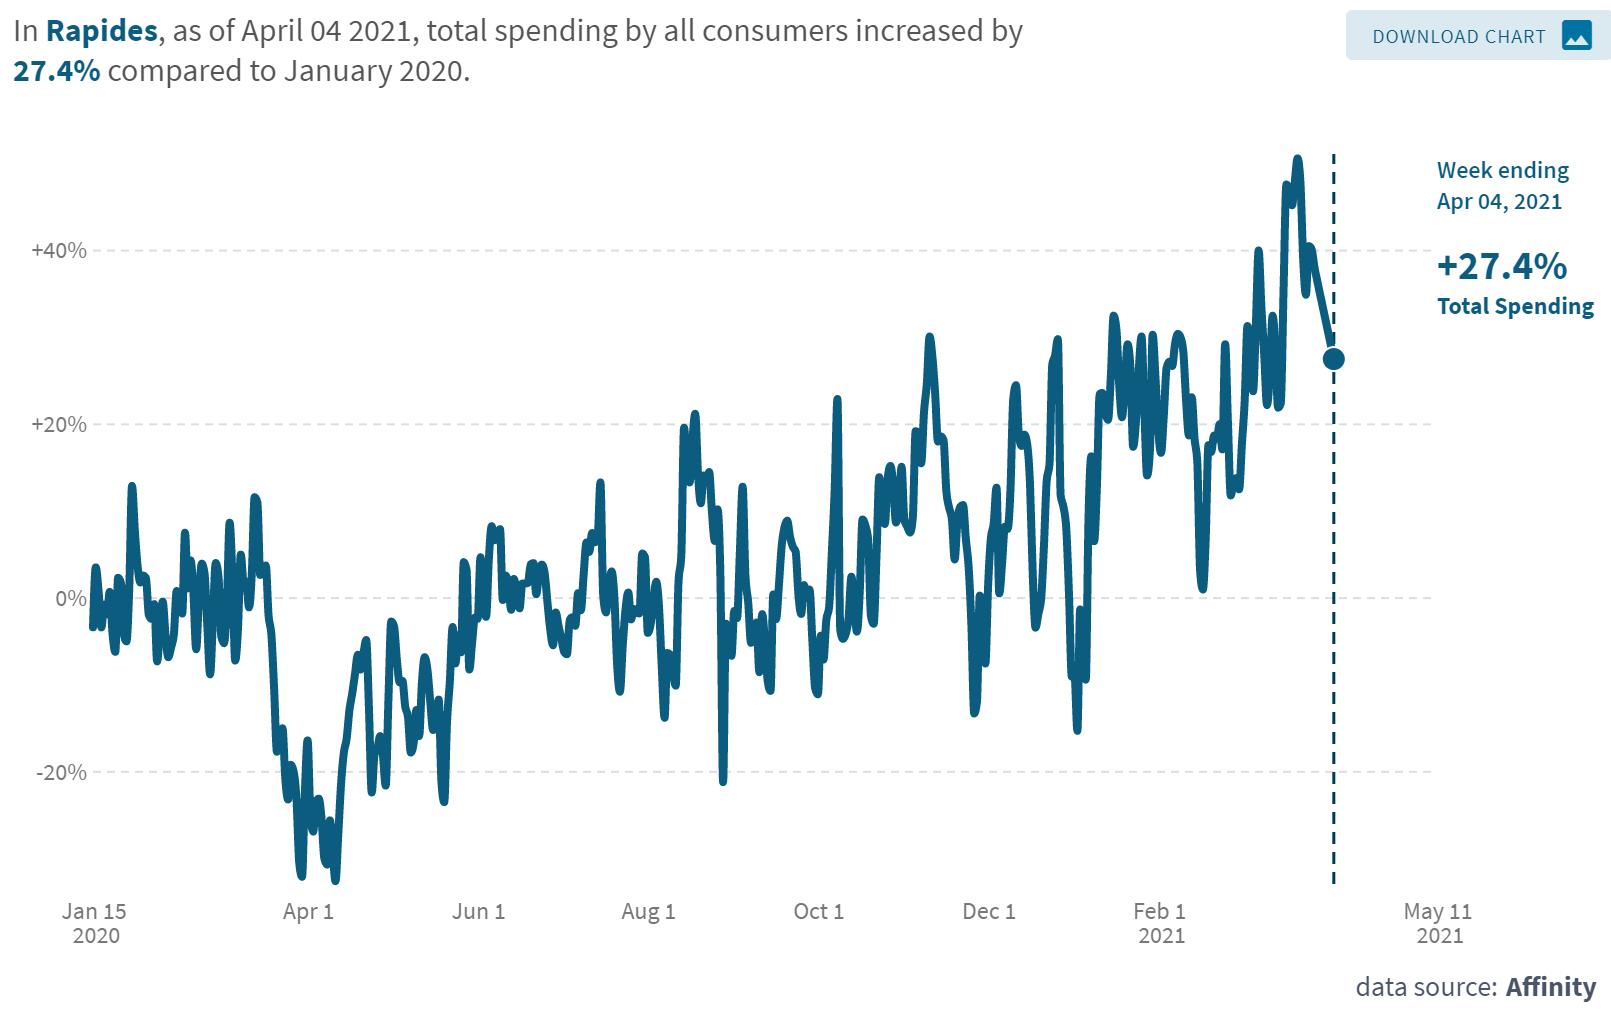
• Consumer spending in Rapides was up 27% in April 2021 over the January 2020 level.
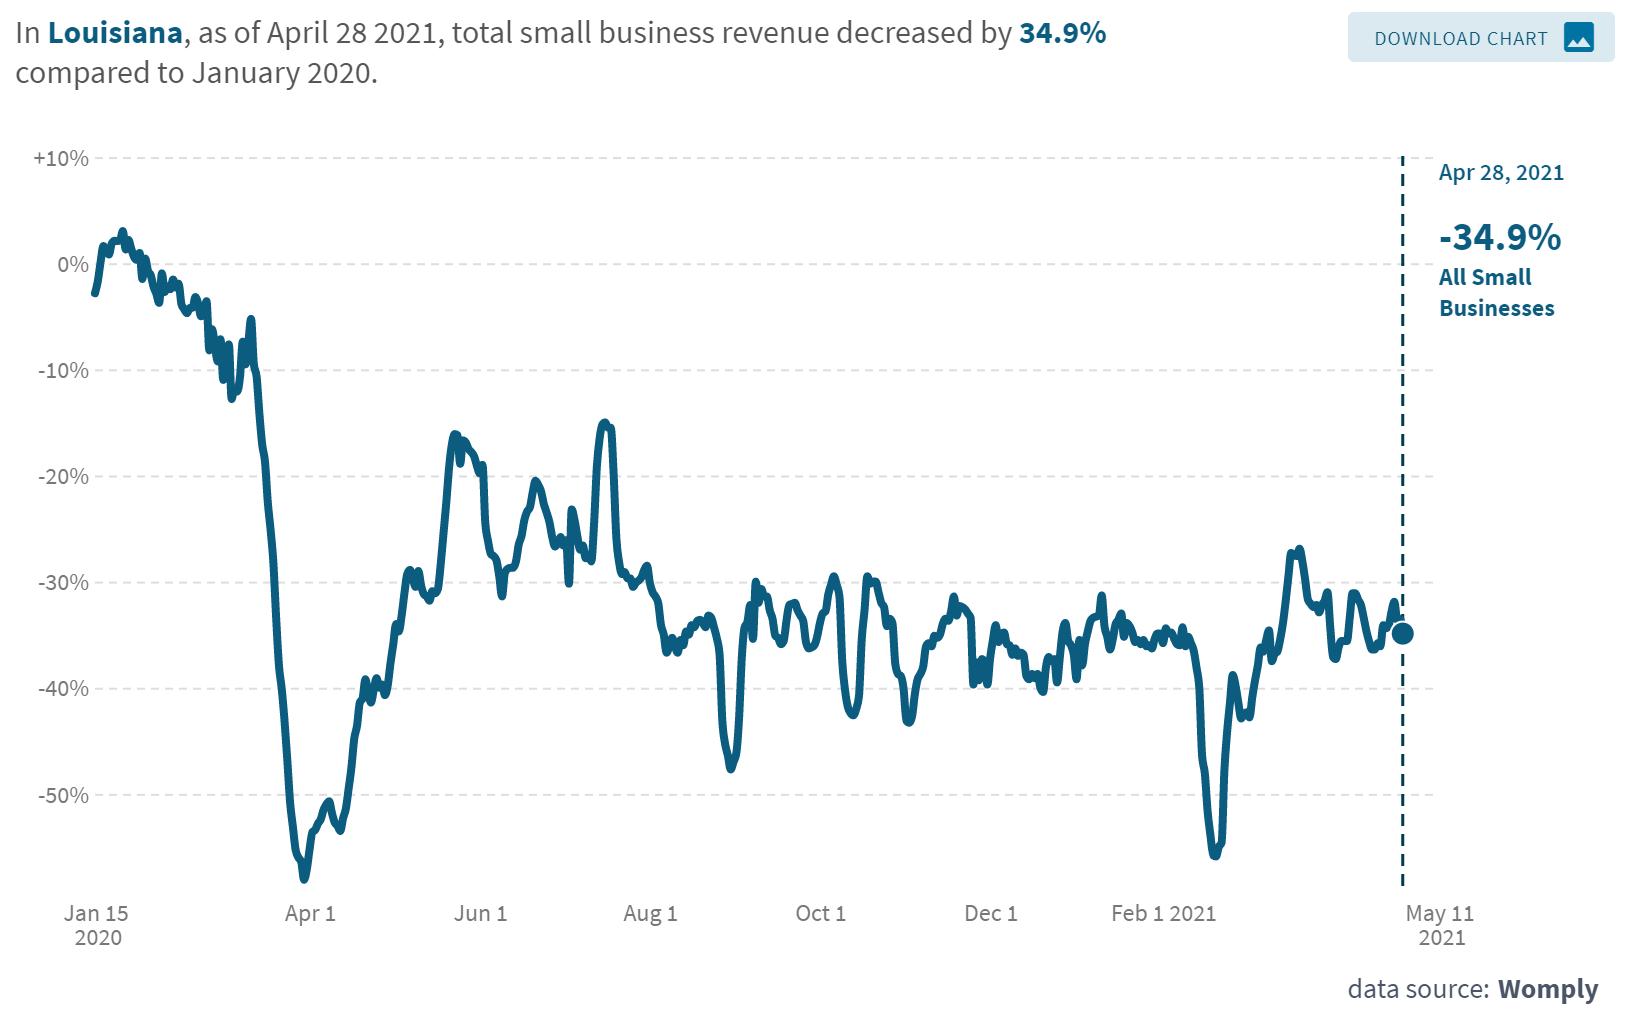
• Small business revenue in Louisiana was down 35% as of April 28, 2021 compared to January 2020 with small business retail down -23%.
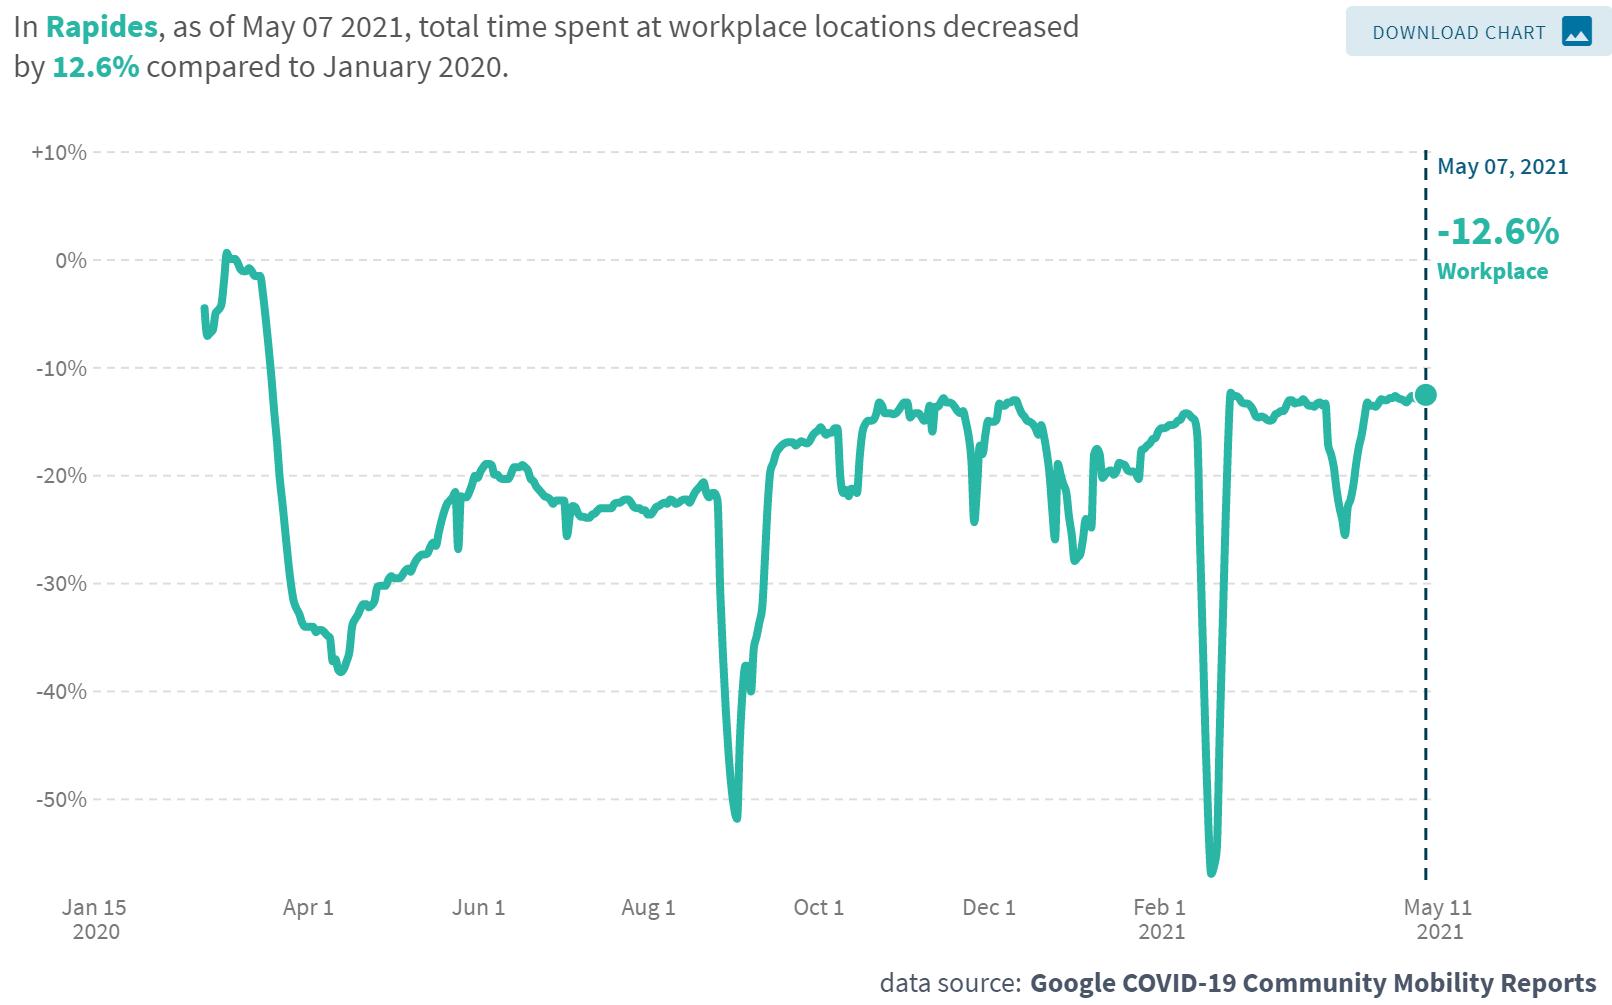
• More employees in Cenla are spending time at their workplace. As of May 7th, total time spent at work in Rapides was only 13% below January 2020 levels.
• The Coincident Economic Activity Index for March 2021 increased 0.7% over February 2021, indicating the economic recovery in Louisiana is still expanding although the recovery is slowing.
• ForApril 2021, the Baker Hughes exploration rig count the rig count in Louisiana increased 2% over March 2021, indicating oil and natural gas exploration is still expanding although at a slow rate.
• Gaming revenue in Louisiana increased 51% in March over February and was up 140% compared to the same month a year ago.
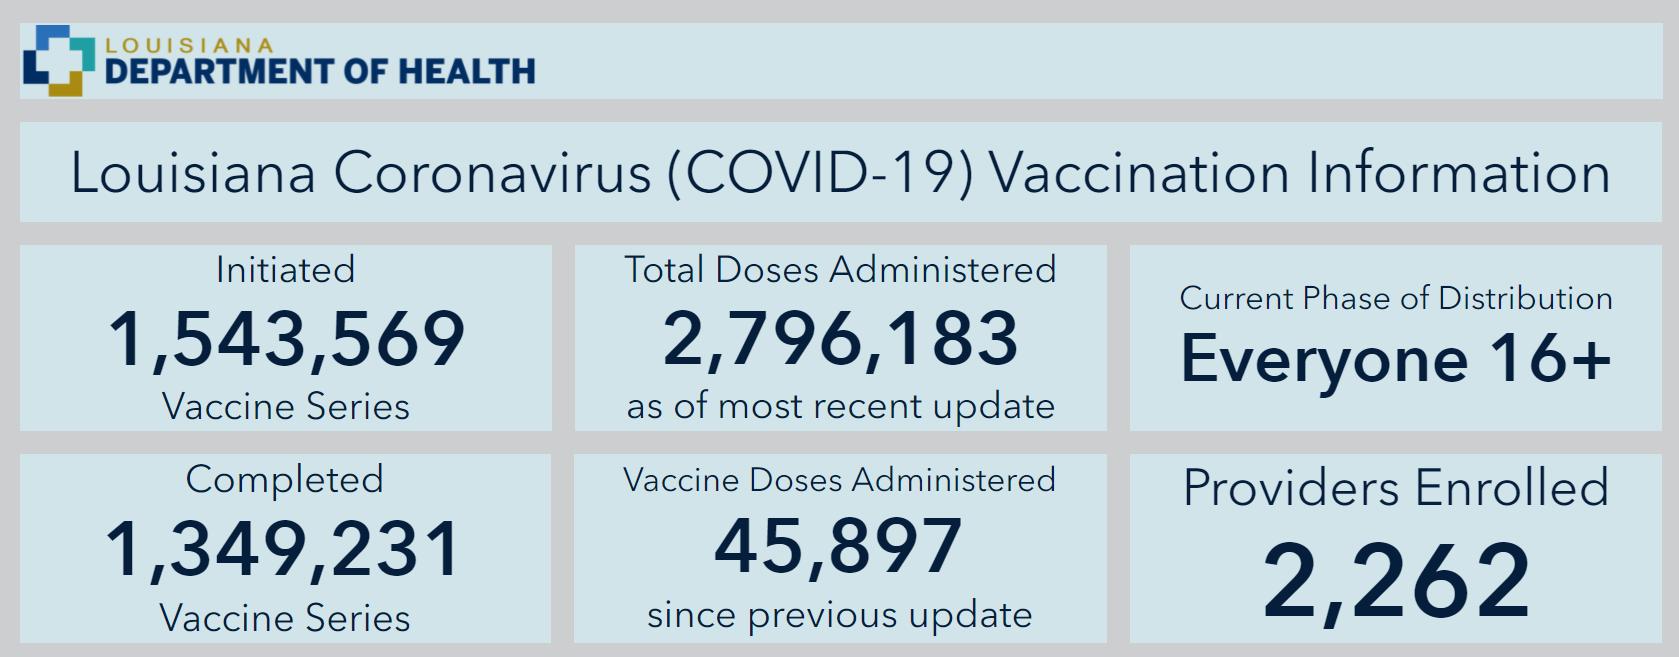
COVID-19 vaccinations as a percent of region population (left) and statewide (right) as of May 13, 2021.
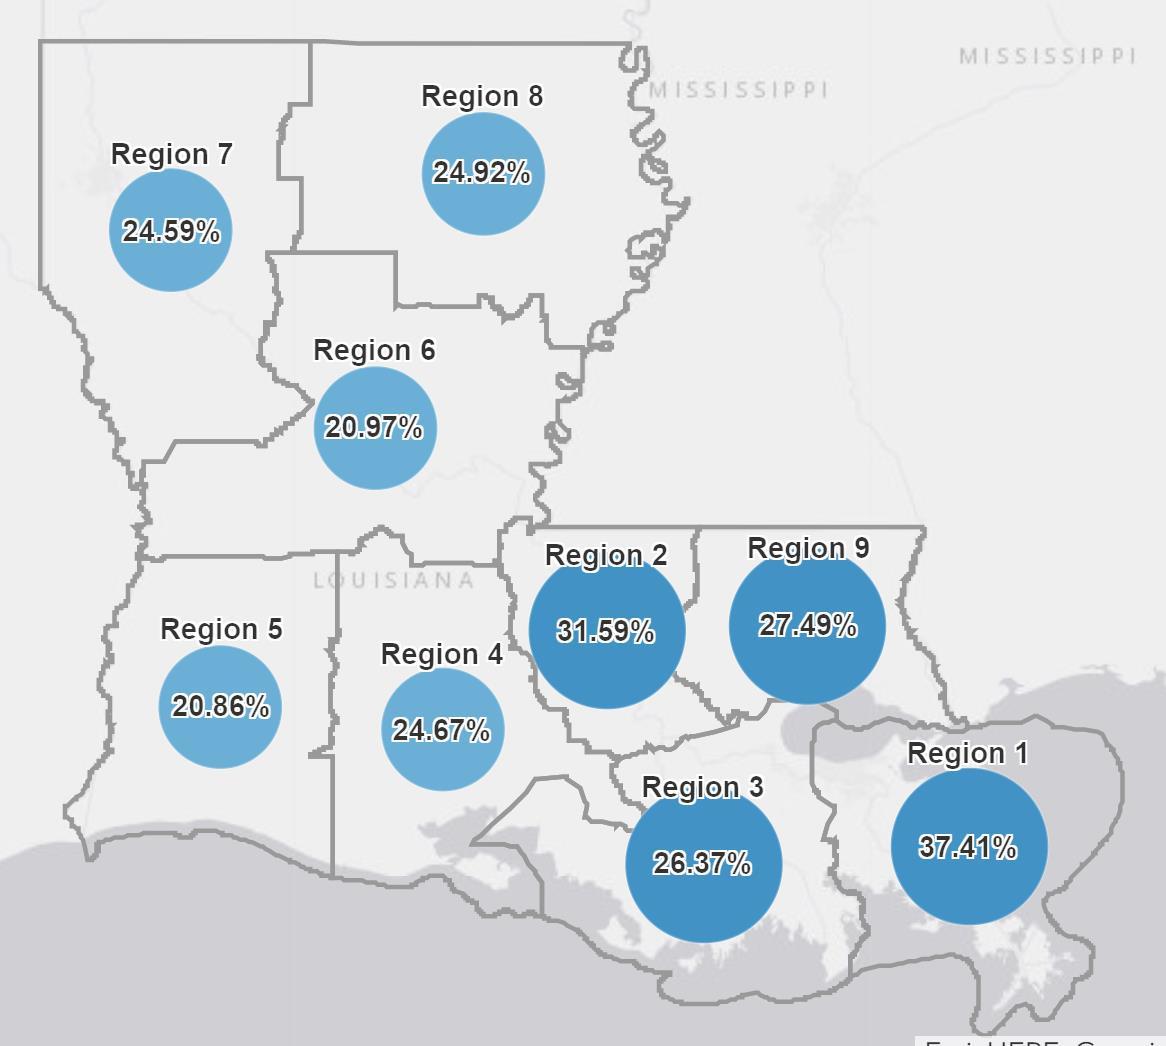
Source: Louisiana Office of Public Health, https://ldh.la.gov/covidvaccine, May 13, 2021
Region 6 has the second lowest vaccination rate in the state with 21% of the population vaccinated, up from 14% inApril.
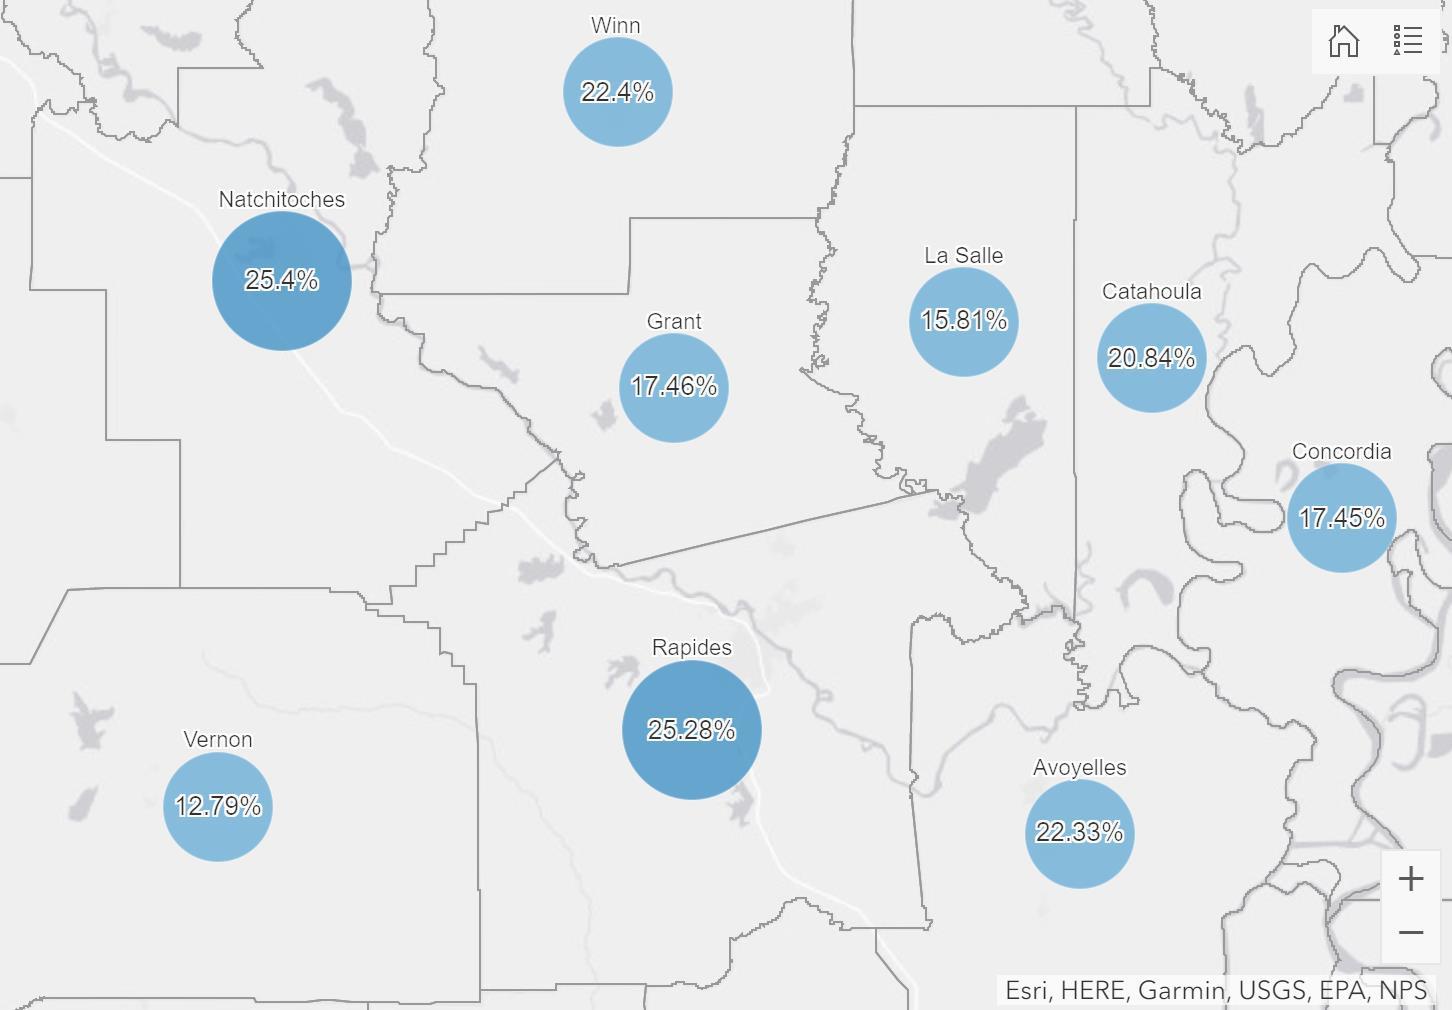
COVID-19 vaccinations as a percent of parish population as of May 13, 2021.
Natchitoches and Rapides have the highest percentage of completed vaccinations in Region 6 at 25% each, up from 15% and 17%, respectively, a month ago.
Region 1 (New Orleans) and Region 2 (Baton Rouge) have the highest vaccination rates at 37% and 32%, respectively.
Source: Louisiana Office of Public Health, https://ldh.la.gov/covidvaccine, May 13, 2021
Covid-19 cases reported by K-12 schools in Region 6 from May 3 - 9, 2021.
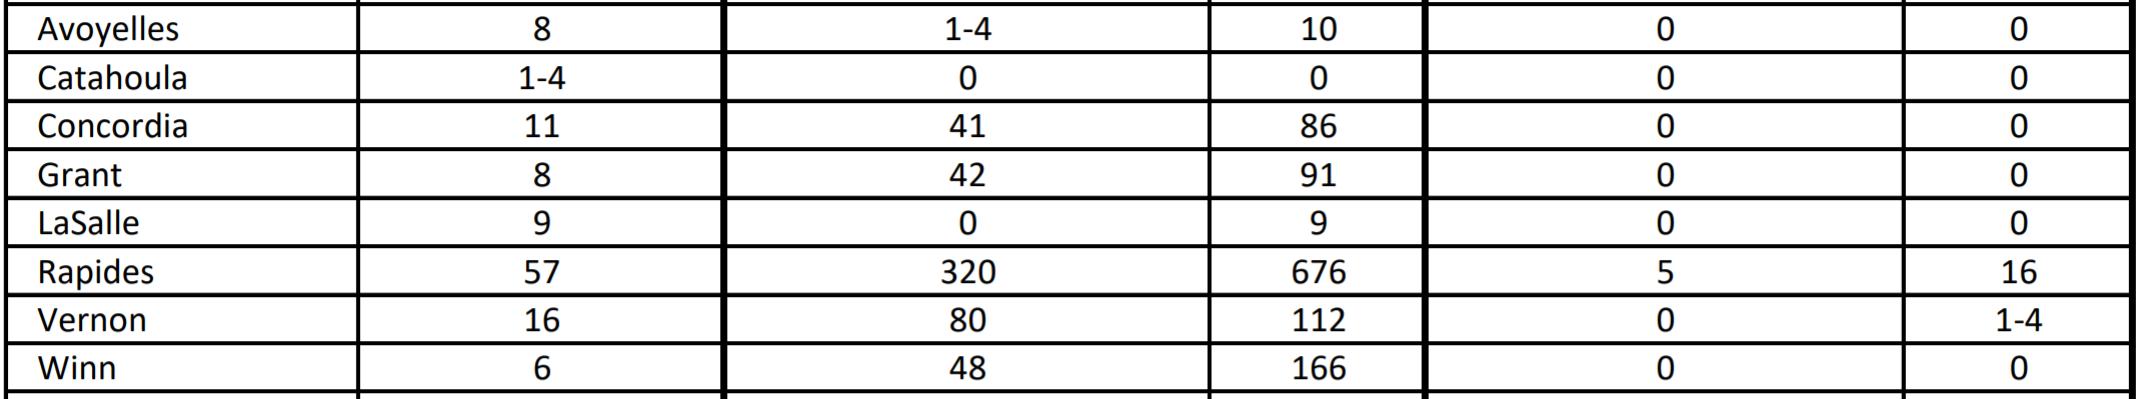
Source: Louisiana Office of Public Health, Region 6 (Central Louisiana), May 13, 2021.
COVID-19 cases by collection date as of May 13, 2021 in Region 6 with a 7-day moving average.
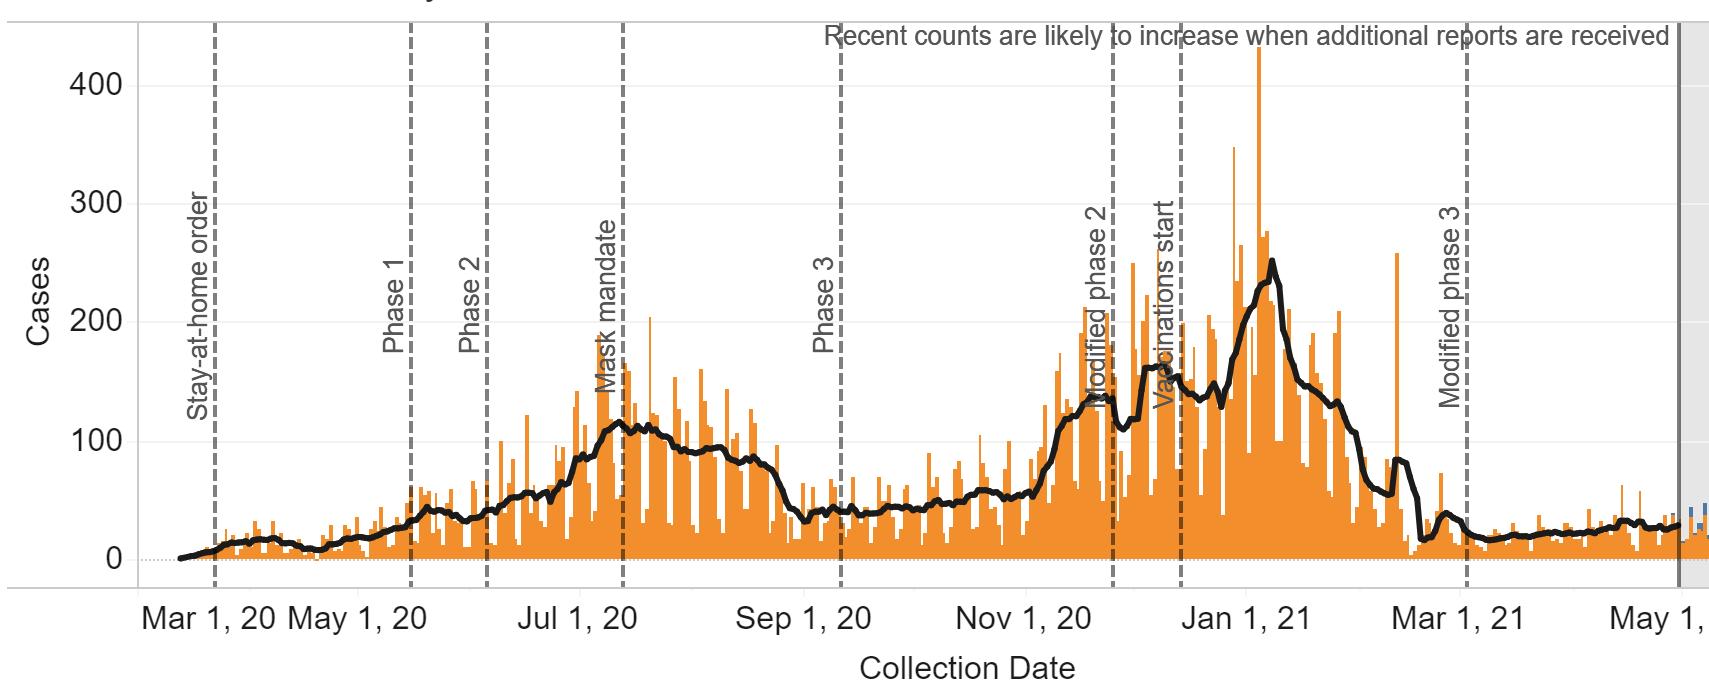
Source: Louisiana Office of Public Health, Region 6 (Central Louisiana), May 13 2021.
Cases over time by age group in Region 6 through May 13, 2021.
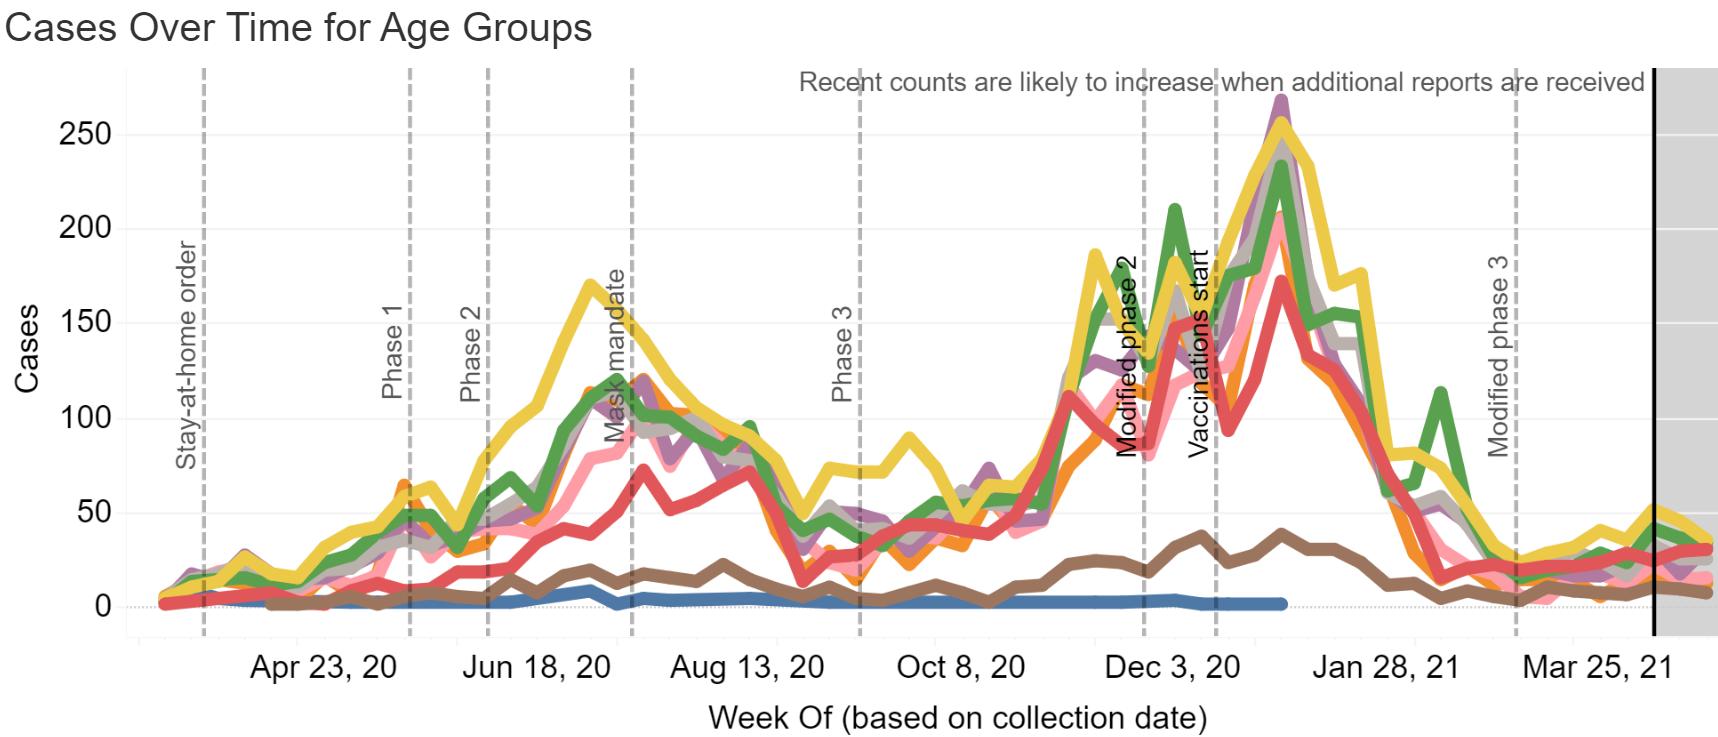
Source: Louisiana Office of Public Health, Region 6 (Central Louisiana), May 13, 2021.
COVID-19 percent positive and test volume in Region 6 as of May 13, 2021.
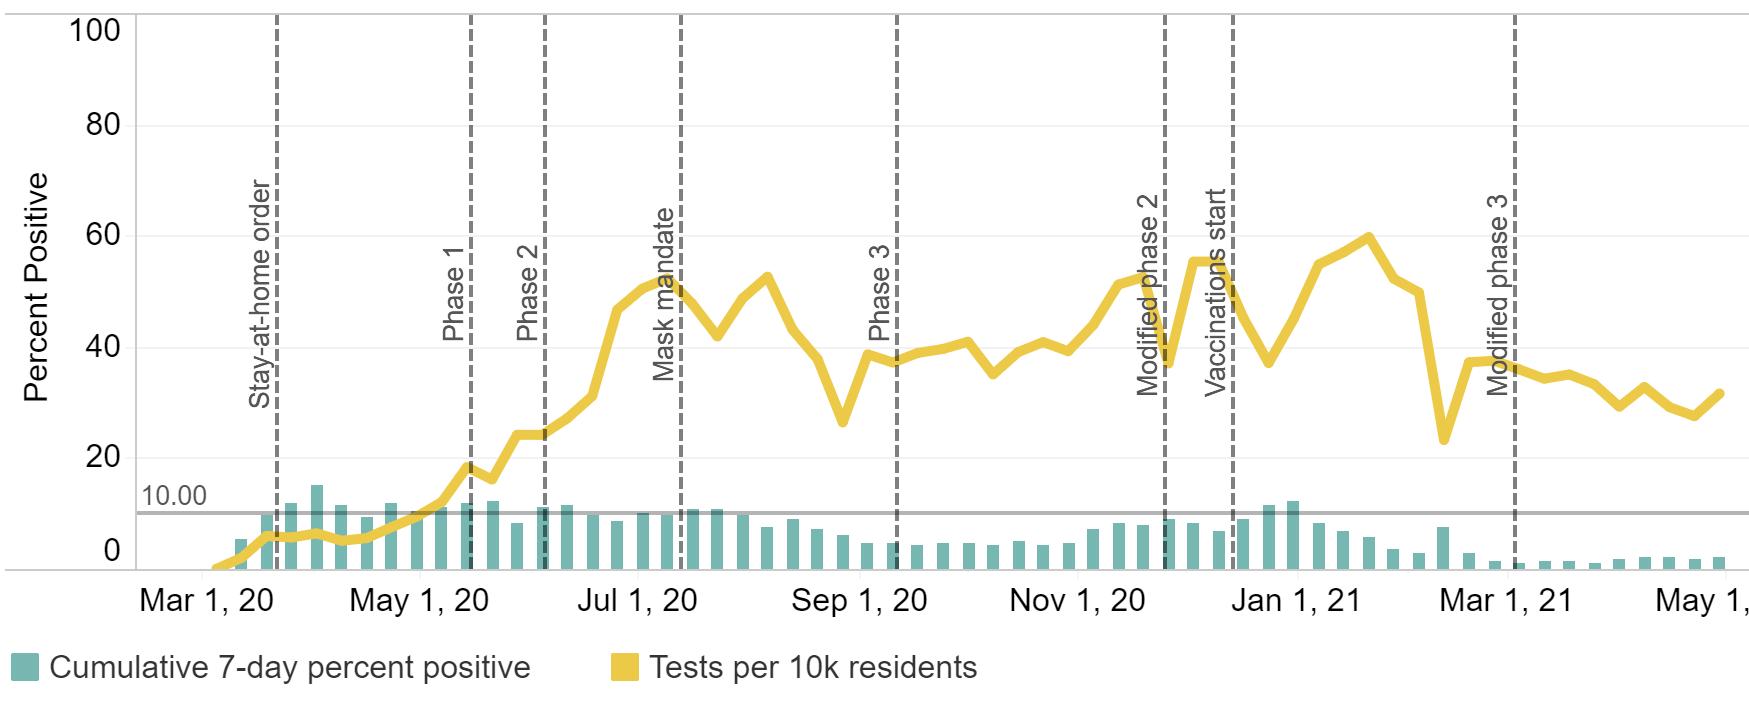
Source: Louisiana Office of Public Health, Region 6 (Central Louisiana), May 13, 2021..
COVID-19 cases statewide by age group as of May 13, 2021.
Source: Louisiana Office of Public Health, Region 6 (Central Louisiana), May 13, 2021.
Number of cases hospitalized (green line) and ventilated (yellow line) in Region 6 as of May 13, 2021.
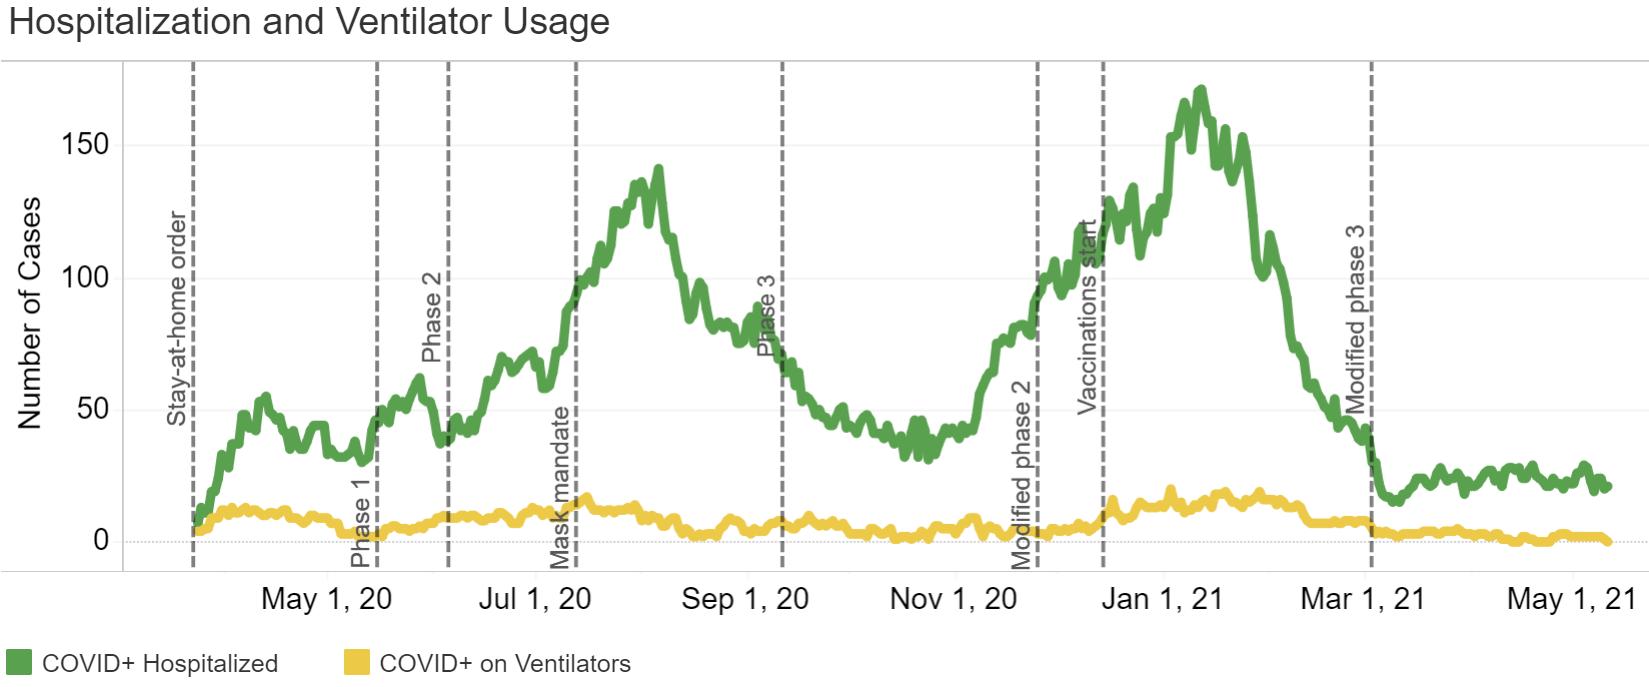
Source: Louisiana Office of Public Health, Region 6 (Central Louisiana), May 13, 2021.
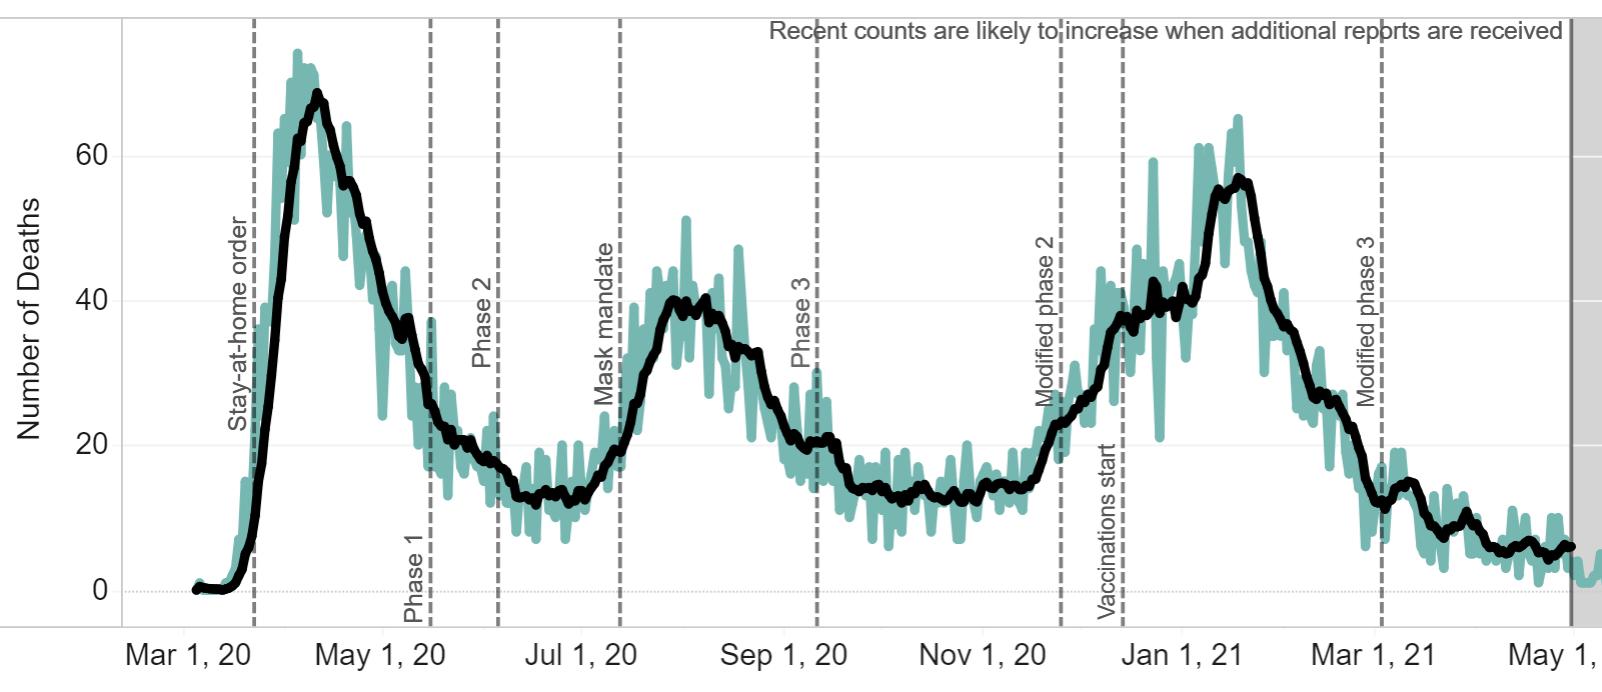
COVID-19 deaths by date of death statewide as of May 13, 2021.
Source: Louisiana Office of Public Health, Region 6 (Central Louisiana), May 13, 2021.
COVID-19 cases (left) and deaths (right) statewide by age group as of May 13, 2021.
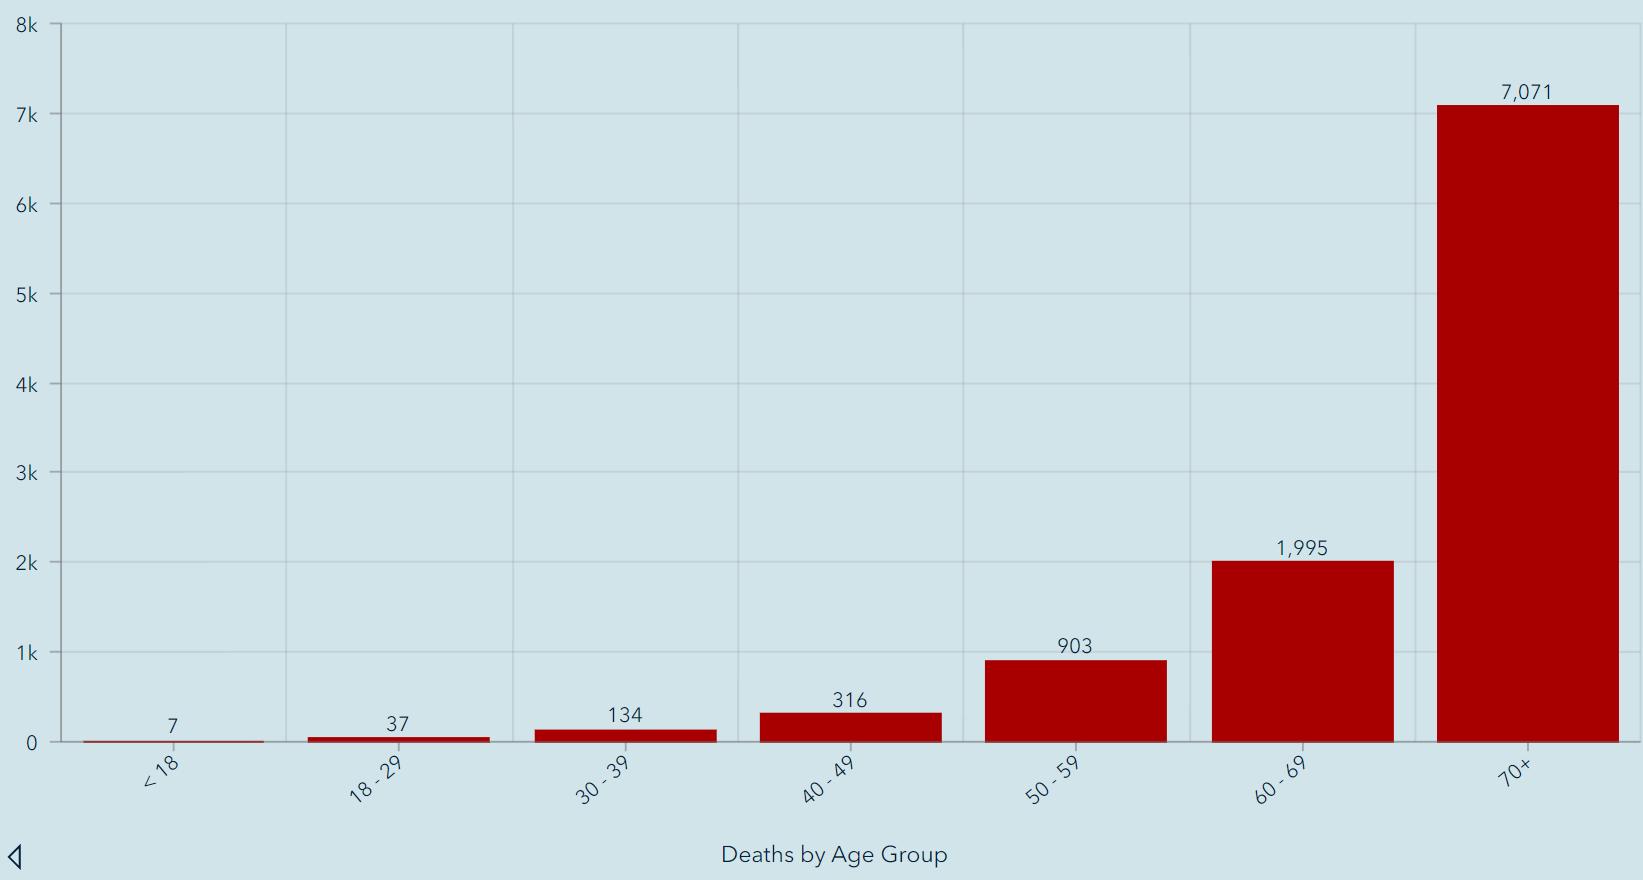
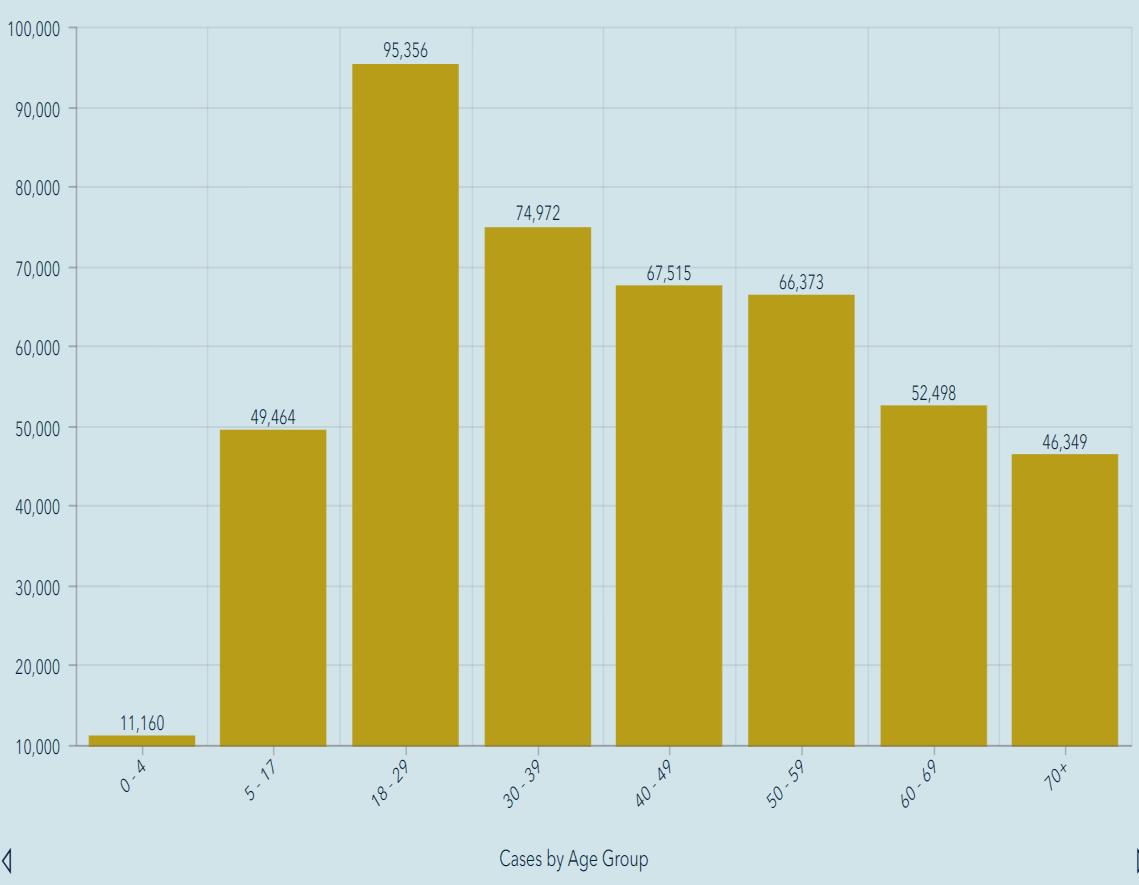
Source: Louisiana Office of Public Health, Region 6 (Central Louisiana), May 13, 2021.
Employed persons in the Alexandria MSA from 2019 – 2021.
Since the pandemic started, employment bottomed at 55,588 in May 2020 and peaked at 61,615 in November 2020.
In March 2021, 60,487 were employed compared to 59,483 in February, a 1.7% increase.
Source: Louisiana Workforce Commission, May 16, 2021
Initial and continued unemployment claims in Louisiana from March 14, 2020 through April 24, 2021.


Statewide average weekly initial unemployment claims filed inApril rose to 9,519 from 8,418 in March, a 13% increase.
Statewide average weekly continued unemployment claims in filed inApril rose to 50,446 from 44,514 in March, a 13% increase.
Source: Louisiana Workforce Commission, May 15, 2021
Initial and continued unemployment claims in central Louisiana from March 14, 2020 through April 24, 2021.

Average weekly initial unemployment claims in central Louisiana rose to 522 inApril from 401in March, a 30% increase.
Average weekly continued unemployment claims in central Louisiana rose to 3,046 inApril from 2,932 in March, a 4% increase.
Source: Louisiana Workforce Commission, May 15, 2021
The table below shows March 2021 preliminary unemployment rate, labor force, and employment data for central Louisiana parishes.
In March, parishes in central Louisiana had an average unemployment rate of 5.6% compared to 6.6% statewide.
At 3.4%, La Salle Parish had the lowest unemployment rate in the state, while Rapides had the 9th lowest at 4.4%.
Data Source: Louisiana Workforce Commission, May 15, 2021.
The table below shows March 2021 preliminary unemployment rate, labor force, and employment data for Metropolitan Statistical Areas in Louisiana.
At 4.4%, the Alexandria MSA had the lowest unemployment rate among the state’s major metro areas for the eleventh straight month, falling 0.3% since February.
Louisiana’s unemployment rate fell 0.5% in March to 6.6% from 7.1% in February.
Data Source: Louisiana Workforce Commission, May 15, 2021.
The table below shows the number of unemployed, number of advertised jobs online, and the ratio of unemployed to advertised job openings online for Metropolitan Statistical Areas in Louisiana in March 2021.
Alexandria metro area continues to have the tightest labor market in the state with only 0.53 unemployed persons per job opening compared to 1.40 statewide.
Source: Louisiana Workforce Commission, May 15, 2021
An overview of sales, vehicle sales, and hotel occupancy taxes collected in the April 2021 reflecting sales activity in March 2021.
Note: April tax revenue reflects sales activity in March. N/a = Not available
Data Source noted in detailed reports.
An overview of sales tax revenue in Rapides Parish other towns and cities in April 2021 (excluding Alexandria and Pineville).


Note: Current tax revenue reflects sales activity in prior month.


(TR) Alexandria total sales tax revenue for April with previous month, year, and YTD comparisons.
(BR) Alexandria total monthly sales tax revenue from 2019 to present.
Note: April sales tax revenue reflects sales activity in March.
Data Source: Rapides Parish Police Jury Treasurer’s Reports, May 2021.
Avoyelles Parish total sales tax revenue for April with previous month, year, and year-to-date comparisons. Vehicle and hotel tax revenues are excluded.
Note: March sales tax revenue reflects sales activity in February.
Data Source: Avoyelles Parish School Board. May 2021.
Avoyelles Parish vehicle sales tax revenue for April with previous month, year, and year-to-date comparisons.
Note: April sales tax revenue reflects sales activity in March.
Data Source: Avoyelles Parish School Board. May 2021
Catahoula Parish total sales tax revenue for April with previous month, year, and year-to-date comparisons.
Note: April sales tax revenue reflects sales activity in March.
Data Source: Catahoula Parish Tax Administrator May 2021
Evangeline Parish total sales tax revenue for April with previous month, year and YTD comparisons.
Note: May sales tax revenue reflects sales activity in April.
Data Source: Evangeline Parish Sales Tax Commissioner. May 2021
Evangeline Parish vehicle sales tax revenue for April with previous month, year and YTD comparisons.
Note: April sales tax revenue reflects sales activity in March.
Data Source: Evangeline Parish Sales Tax Commissioner. May 2021
La Salle Parish total sales tax revenue for April with previous month, year, and year-to-date comparisons.
Note: April sales tax revenue reflects sales activity in March.
Data Source: La Salle Parish Tax Administrator, May 2021
Concordia Parish total sales tax revenue for April with previous month, year, and year-to-date comparisons.
Note: April sales tax revenue reflects sales activity in March.
Data Source: Concordia Parish Tax Administrator. May 2021

(TR) Pineville sales tax revenue for April with previous month, year, and YTD comparisons.
(BR) Pineville monthly sales tax revenue from 2019 to present.
Note: Current sales tax revenue reflects sales activity in the prior month.
Data Source: Rapides Parish Police Jury Treasurer’s Reports, May 2021.
Rapides Parish occupational license revenue YTD with previous YTD comparisons.
Note: Rapides Parish reflects unincorporated areas.
Data Source: Rapides Parish Police Jury Treasurer’s Reports, May 2021.
(TR) Rapides Parish sales tax revenue for April with previous month, year, and YTD comparisons.
(BR) Rapides monthly sales tax revenue from 2019 to present. Data Source: Rapides Parish Police Jury Treasurer’s Reports, May 2021.
Note: Current sales tax revenue reflects sales activity in the prior month.
Rapides Parish vehicle sales tax revenue for April with previous month, year, and YTD comparisons.
St. Landry Parish sales tax revenue for April with previous month, year, and YTD comparisons.
Note: April sales tax revenue reflects sales activity in March.
Data Source: Tax revenue data from St. Landry Parish School Board. May 2021
St. Landry Parish vehicle sales tax revenue for April with previous month, year, and YTD comparisons.
Note: March sales tax revenue reflects sales activity in February.
Data Source: Tax revenue data from St. Landry Parish School Board. May 2021


Remote seller tax revenue is tax revenue from online sales by location of the seller at the time of purchase.
August 2020 - April 2021
SinceAugust 2020, $10.4 million in sales tax revenue has been collected from online sales in central Louisiana.
Online sales tax revenue increased 18.5% inApril over March.
Note: Sales tax revenue collected inApril reflects sales activity in March.
Data Source: Louisiana Sales and Use Tax Commission for Remote Sellers. August 2020 – May 2021


Remote sellers tax revenue is tax revenue from online sales by location of the seller at the time of purchase.
Note: Sales tax revenue collected in one month reflects sales activity in the prior month.
Data Source: Louisiana Sales and Use Tax Commission for Remote Sellers. August 2020 – May 2021


Remote sellers tax revenue is tax revenue from online sales by location of the seller at the time of purchase.
Note: Sales tax revenue collected in one month reflects sales activity in the prior month.
Data Source: Louisiana Sales and Use Tax Commission for Remote Sellers. August 2020 – May 2021


Remote sellers tax revenue is tax revenue from online sales by location of the seller at the time of purchase.
Note: Sales tax revenue collected in one month reflects sales activity in the prior month.
Data Source: Louisiana Sales and Use Tax Commission for Remote Sellers. August 2020 – May 2021
The valuation (estimated development cost) of new commercial construction permits issued by the City of Alexandria in April 2021 with previous month, year, and YTD comparisons.
The valuation (estimated development cost) of new residential construction permits issued by the City of Alexandria in April 2021 with previous month, year, and YTD comparisons.
This chart shows the valuation of permits issued by Rapides Area Planning Commission in Allen Parish in April between 2018-2021 with month-tomonth, year-to-year, and year-to-date comparisons.
Data Source: RapidesArea Planning Commission, May, 2021
This chart shows the valuation of permits issued by Rapides Area Planning Commission in Avoyelles Parish in April between 2019-2021 with month-to-month, year-to-year, and year-to-date comparisons.
Data Source: RapidesArea Planning Commission, May 2021.
This chart shows the valuation of permits issued by Rapides Area Planning Commission in Evangeline Parish in April between 2018-2021 with month-to-month, year-to-year, and year-to-date comparisons.
Data Source: RapidesArea Planning Commission, May 2021.
This chart shows the valuation of permits issued by Rapides Area Planning Commission in the City of Pineville in April between 20182021 with month-to-month, year-to-year, and year-to-date comparisons.
Data Source: RapidesArea Planning Commission, May 2021.
This charts shows the valuation of permits issued by Rapides Area Planning Commission in Rapides Parish (excluding Alexandria) in April between 20182021 with month-to-month, year-to-year, and year-to-date comparisons.
Data Source: RapidesArea Planning Commission, May 2021.
New residential construction permit valuation (estimated development cost) issued by Rapides Area Planning Commission by jurisdiction in April 2021 compared to March 2020.
Valuation of New Residential Construction April 2020 vs April 2021
Note: City ofAlexandria permits are accounted for separately.
Data Source: RapidesArea Planning Commission, May 2021.


These charts represent homeownership rates in the U.S. and Louisiana.
Rate US vs Louisiana
US homeownership rate peaked in 2004 at 69%, while the Louisiana homeownership rate peaked in 2008 at 73.5%.
2020, Louisiana remained 5.5% below it’s peak compared
Data Source: Fred Reserve Economic Database, St. Louis Federal Reserve Bank, May 16, 2021.
The chart represents the lumber price index in the U.S. from January 2020 – April 2021.
The US Lumber Price Index has risen in 10 of the past 12 month.
FromApril 2020 toApril 2021, the US Lumber Price Index rose from 205 to 388, an 89% increase.
Data Source: Fred Reserve Economic Database, St. Louis Federal Reserve Bank, May 16, 2021.

The count of active single-family and condo/townhome listings for Alexandria MSA (excludes pending listings) for April 20182021 with month-to-month and year-over-year comparisons.
Active listings decreased 60% since March 2020.

The count of pending single-family and condo/townhome listings for Alexandria MSA for April 2018-2021 with month-to-month and year-over-year comparisons.

The median number of days property listings spend on the market in Alexandria MSA for April 2018-2021 with month-to-month and year-over-year comparisons.

The median listing price of houses in Alexandria MSA for April 20182021 with month-to-month and year-over-year comparisons.
The median listing price fell -5.6% since March 2021 from $182,700 to $172,450 and declined -9.2% since April 2020.
The average listing price of houses in Alexandria MSA for April 2018-2021 with month-to-month and year-over-year comparisons.
The average listing price fell1.0% since last month from $240,872 to $238,409, but rose 3.2% last year.
Avoyelles Parish hotel occupancy tax revenue for April with previous month, year, and year-to-date comparisons.
Note: April tax revenue reflects hotel occupancy activity in March. Hotel occupancy tax revenue is used as a proxy for hotel occupancy rate.
Data Source: Avoyelles Parish School Board. May 2021.
Rapides Parish hotel occupancy tax revenue for April 2020 with previous month, year, and YTD comparisons.
Note: April tax revenue reflects hotel occupancy activity in March. Hotel occupancy tax revenue is used as a proxy for hotel occupancy rate.
Data Source: Rapides Parish Police Jury Treasurer’s Reports, May 2021.
This chart shows total passenger throughput at AEX and nationwide in April 2021 as a percent of traffic a year ago. AEX is the solid black line on a logarithmic scale.
Passenger Throughput as a Percent a Year Ago


AEX had the lowest total passenger throughput in the state in April at 654% compared to a year ago which is a positive indicator showing AEX’s relative outperformance in 2020.
Data Source: Alexandria International Airport, May 11, 2021
Nationwide daily percentage of passengers passing through current TSA checkpoints expressed as a percentage of 2020 and 2019 traffic.
Nationwide air passenger traffic inApril 2021 was up 9% above March and 1170% from a year ago. Average passenger traffic in U.S. increased 13% inApril 2021 from March 2021.
Data Source: DHS, Transportation Security Administration, https://www.tsa.gov/coronavirus/passenger-throughput, May 13, 2021
Total gasoline sales in Louisiana in 2019 - 2021.


Gasoline Sales in Louisiana
2019 2020 2021
Thousands of Gallons / Day
7,000
Gasoline sales in LA over the past 12 months are down -8.0% compared to the previous 12 months. 6,000
In February 2021, Louisiana gasoline sales increased 0.9% from January and was -9.3% below February 2020. 5,000
8,000 January February March April May June July August September October November December
The number of new businesses established in Rapides inApril 2021 was 7% higher than March 2021 and 158% over a year ago.
Year-to-date new businesses in Rapides are up 30% over 2020.
The chart below represents the number of new businesses established each month in Rapides from January 2019 through April 2021. Data Source: Rapides Parish Sales and Use Tax Department, May 11, 2021.


These graphs represents the percent change in average consumer credit and debit card spending in Louisiana as of April 4, 2021 with January 2020 as the baseline.
• Total consumer spending onApril 4, 2021 in Louisiana was up 19% compared to January 2020, with retail spending up 39% whileentertainment and recreation spending down -25%. Grocery spending was up 32%, health care up 9%, and restaurants up 4%.
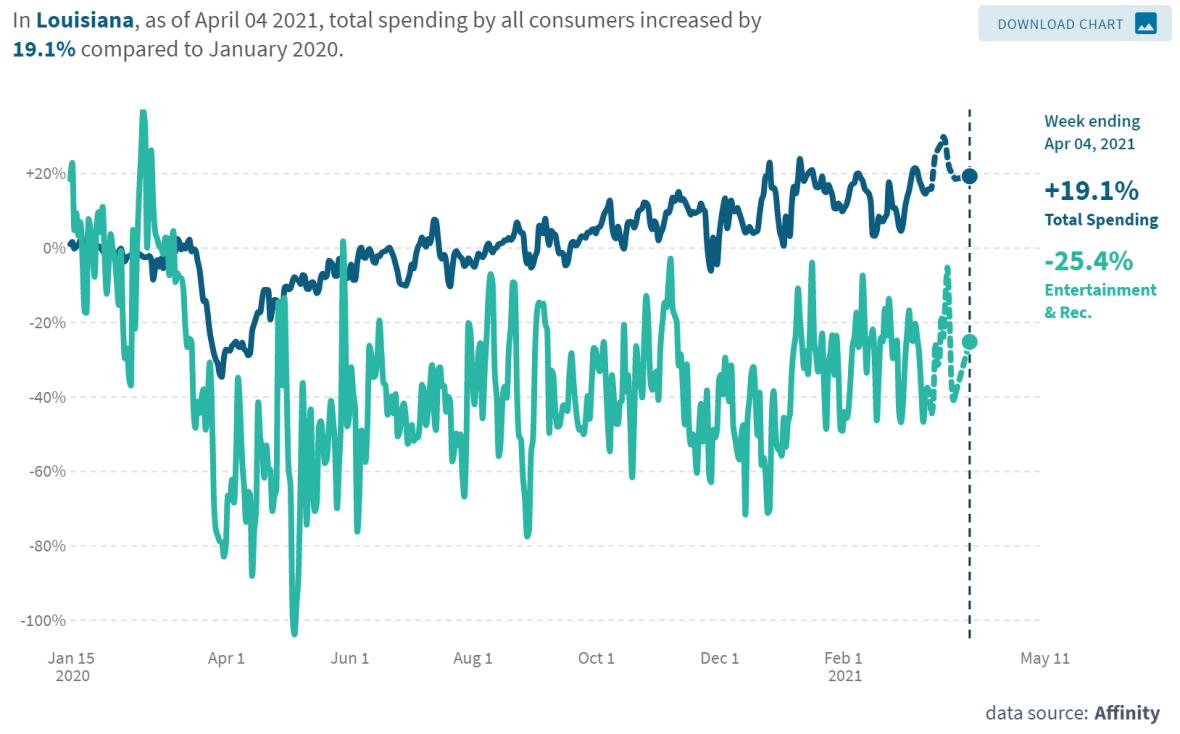
The table and chart represents the percent change in average consumer credit and debit card spending in Cenla as of April 4, 2021 with January 2020 as the baseline, while the chart represents Rapides.
Data Source: Opportunity Insights Economic Tracker, https://www.tracktherecovery.org/. Data Source: Affinity Solutions. Retrieved May 11, 2021
Data for Concordia andAvoyelles is not available.
The chart below represents the percent change in small business revenue in Louisiana as of April 28, 2021 with January 2020 as the baseline. The table shows the percentage change for small business revenue by industry.
The chart represents the percent of time employees in Rapides Parish spent at work as of May 7, 2021 with January 2020 as the baseline. The table provides comparable data for other central Louisiana parishes.
The Coincident Economic Activity Index for Louisiana includes four indicators: nonfarm payroll employment, the unemployment rate, average hours worked in manufacturing and wages and salaries. The index is set to match the trend for gross state product.
Coincident Economic Activity Index for Louisiana
• The chart shows the impact of COVID-19 on the Louisiana’s gross state product since January 2020.
The Index for March 2021 increased 0.7% over February 2021, indicating the economic recovery in Louisiana is still expanding although the recovery is slowing.

2020 - March 2021
Data Source: FRED Economic Data, Federal Reserve Bank of St. Louis, May 11, 2021. https://fred.stlouisfed.org/series/LAPHCI
Represents the number of drilling rigs actively exploring for or developing oil or natural gas in Louisiana and the U.S.


For March 2021, the rig count in Louisiana increased 2% over March 2021, indicating oil and natural gas exploration is still expanding although at a slow rate.
Source: Baker Hughes, https://rigcount.bakerhughes.com/na-rig-count, May 11, 2021
Gaming revenue in Louisiana for March 2021 with previous month and year comparisons.
Data Source: Louisiana Gaming Control Board, May 13, 2021. http://lgcb.dps.louisiana.gov/revenue_reports.html
U.S. economic indicators for March 2021.
Data Source: U.S. Census, https://www.census.gov/economic-indicators/, May 16, 2021.
The data presented throughout the CENLA Economic Dashboard reflects contributions from the following local organizations.
• Rapides Parish Policy Jury Treasurer
• Rapides Sales TaxAdministrator
• Avoyelles Parish School Board
• Alexandria International Airport
• RapidesArea Planning Commission
• City ofAlexandria Planning Division
• Evangeline Parish Sales Tax Commissioner
• Concordia, Catahoula, & La Salle TaxAdministrator
• Louisiana Office of Public Health, Region 6
• St. Landry Parish School Board
Also, special thanks to the following partners for distributing the dashboard.
Next Issue: Week of June 14th
• LSUAFoundation
• Central Louisiana Regional Chamber of Commerce
• Marksville Chamber of Commerce
• Bunkie Chamber of Commerce
• Evangeline Chamber of Commerce
• Concordia Chamber of Commerce
• St. Landry Chamber of Commerce
• Greater Vernon Chamber of Commerce