CENLA ECONOMIC DASHBOARD
April 16, 2021.
Dr.RandallDupont Dean,CollegeofBusiness
LouisianaStateUniversityofAlexandria
rdupont@lsua.edu


2
more information
to
a partner, visit www.lsua.edu/leadershipcenla
Platinum Sponsors For
or
become
KEYFINDINGS
April 16, 2021 CENLA Economic Dashboard
COVID-19
• Rapides and Natchitoches have the highest percentage of completed vaccinations in Region 6 at 17.5 %and 14.8%, respectively.
• However, Region 6 has the second lowest vaccination rate in the state with 14% of the population vaccinated.
EMPLOYMENT
• The labor force in theAlexandria MSA in January 2021 exceeded January 2020, 63,257 to 63,200.
• Statewide average weekly initial unemployment claims filed in March rose to 8,418 from 7,249 in February, a 16% increase. Average weekly continued unemployment claims in March fell to 44,514 from 55,439 in February, a 20% decrease.
• In CENLA, average weekly initial unemployment claims in central Louisiana fell to 401 in March from 414 in February, a 3% decrease, while average weekly continued unemployment claims in central Louisiana fell to 2,932 in March from 3,655 in February, a 20% decrease.
• Louisiana’s unemployment rate fell 0.5% in February to 7.1% from 7.6% in January.
• In February, parishes in central Louisiana had an average unemployment rate of 6.1%, compared to 7.1% statewide.
• La Salle Parish had the lowest unemployment rate in the state at 3.7%.
• At 4.7%, the Alexandria MSA had the lowest unemployment rate among the state’s major metro areas for the tenth straight month, falling 0.5% since January.
• Alexandria’s metro area continues to have the tightest labor market in the state with only 0.58 unemployed persons per job opening compared to 1.62 statewide.
TAX REVENUE
• Nearly all central Louisiana parishes saw a decrease in sales tax revenue in February ranging from a -20% to -3%.
However, when compared to the same month in the previous year and year-to-date, nearly all parishes and cities were higher. March tax data reflects sales activity in February.

KEYFINDINGS… continued
April 16, 2021 CENLA Economic Dashboard
• Occupational license revenue was up 0.3% year-to-date in March, reversing the sharp decline last month.
• Vehicle sales tax revenue was down in February in Avoyelles, Evangeline, and St. Landry ranging from -20% to -25%. However, February vehicle sales tax revenue was up 25% from January and 54% from last February.
BUILDING PERMITS
• Housing unit constructions in the Alexandria MSA averaged 443 units per year between 2004-2020, peaking in 2006 at 951 units.
• From 2004 to 2020, the number of newly constructed housing units fell 71% from 685 to 204.
• The valuation of housing unit construction in theAlexandria MSAaveraged $67,338,000 per year since 2004, peaking in 2006 at $126,167,000.
• From 2004 to 2020, the valuation per housing unit has grown from $119,336 to $241,623, a 102% increase.
• Residential construction permits in CENLAin March were up 302% over the same month a year ago.
HOUSING
• TheAlexandria real estate market remains strong with active listings down and pending listings up. The number of days a house stayed on the market fell sharply in March to 75 from 94 the month earlier.
• The US housing market remains extremely strong entering 2021, driven by low mortgage rates and inventory shortages.
• 2020 saw the strongest U.S. home price growth of any year since 2005, marking just the third year of double-digit growth in the past quarter century.
• According to the Black Knight Home Price Index, home prices in the U.S. grew at 11.6% in January, the highest annual rate in 15 years.
TRAVEL
• Hotel occupancy in Rapides increased 20% in February compared to January and 308% compared to a year ago. Avoyelles likewise experienced strong gains in hotel occupancy with a 270% increase over last February.
KEYFINDINGS… continued
April 16, 2021 CENLA Economic Dashboard
• Total passenger traffic at Alexandria International airport (AEX) averaged 145% of last March’s level compared to only 115% nationwide. AEX’s throughput rate was the highest in the state once again.
• Nationwide air passenger traffic in March 2021 was 15.3% above last year’s level.
• In January 2021, Louisiana gasoline sales decreased -6.6% from December and was -14.3% below January 2020.
• Gasoline sales in Louisiana for 2020 were down 5.8% compared to 2019.
LOCAL& LOUISIANA
• The number of new businesses established in Rapides in March 2021 was 43% higher than February 2021. Year-todate new businesses in Rapides are up 8% over 2020.
• Total consumer spending on March 14, 2021 in Louisiana was down 11% compared to January 2020, with retail spending up 0.2% while entertainment and recreation spending is down -42%. Grocery spending was down -0.9%, health care down 3-1.7%, and restaurants down -23.1%.
• Small business revenue in Louisiana was down 35% as of March 31, 2021 compared to January 2020 with retail down 8%.
• The Coincident Economic Activity Index for February 2021 increased 0.15% over January 2021, indicating the economic recovery in Louisiana is slowing. This is the lowest increase since the recovery started.
• The Baker Hughes exploration rig count in Louisiana decreased 2.1% in February, while the rig count nationwide increased 2.7% from a month ago. However, it remains -47% down from a year ago.
• Gaming revenue in Louisiana decreased 13% in February over January and was down 24% compared to the same month a year ago.
COVID-19
COVID-19VACCINATIONS
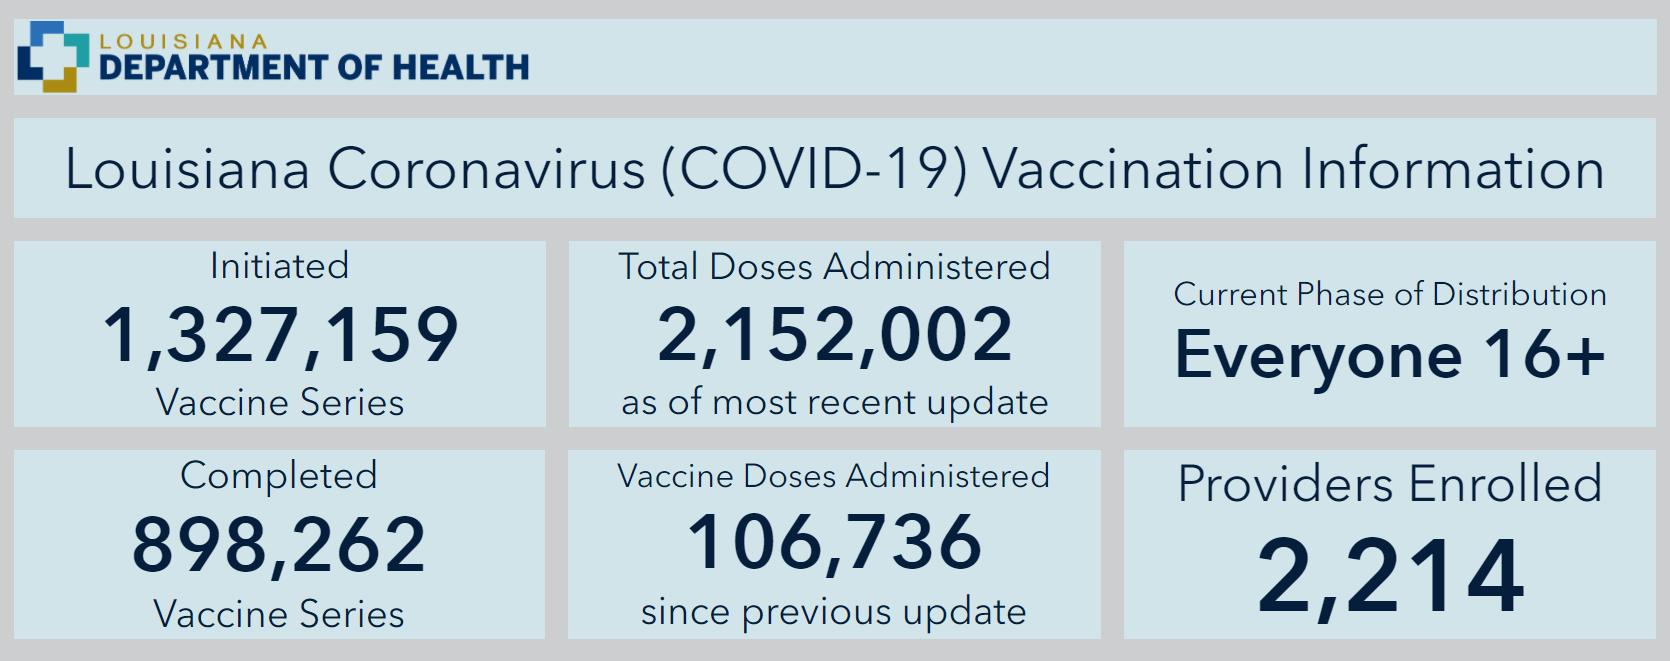
COVID-19 vaccinations as a percent of region population (left) and statewide (right) as of April 10, 2021.
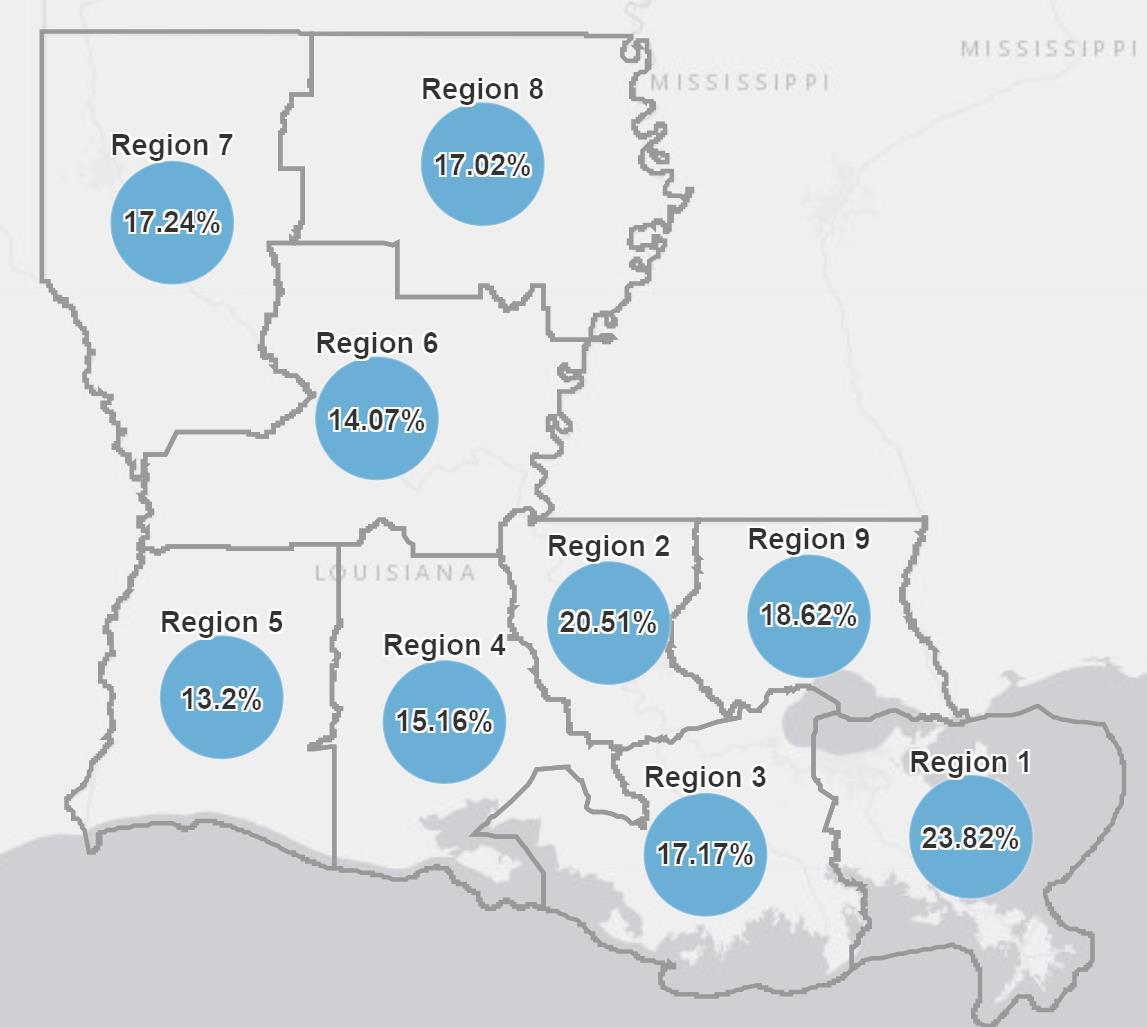
Source: Louisiana Office of Public Health, https://ldh.la.gov/covidvaccine, April 10, 2021
Region 6 has the second lowest vaccination rate in the state with 14% of the population vaccinated.
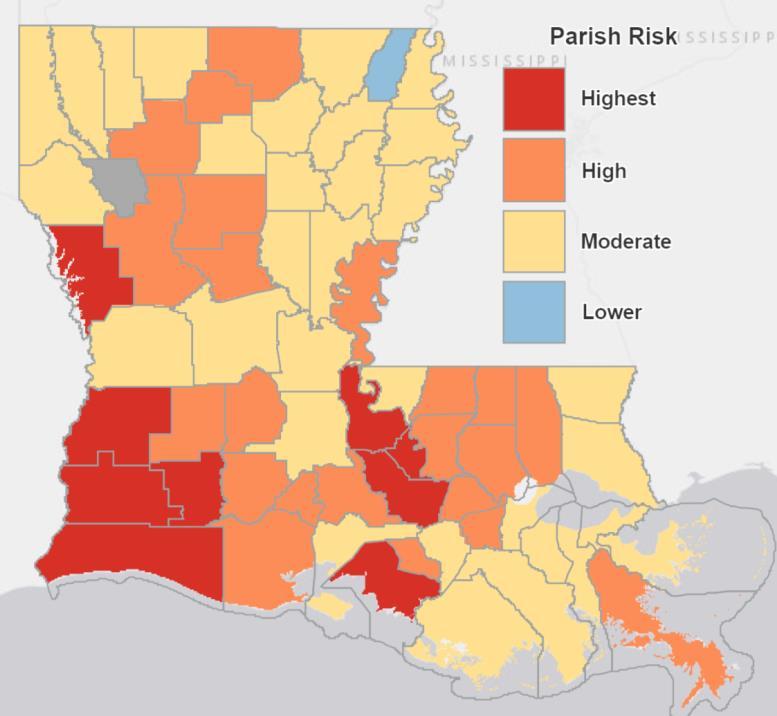
COVID-19VACCINATIONSBYPARISH
COVID-19 vaccinations as a percent of parish population as of April 10, 2021.
Rapides and Natchitoches have the highest percentage of completed vaccinations in Region 6 at 17.5 %and 14.8%, respectively.
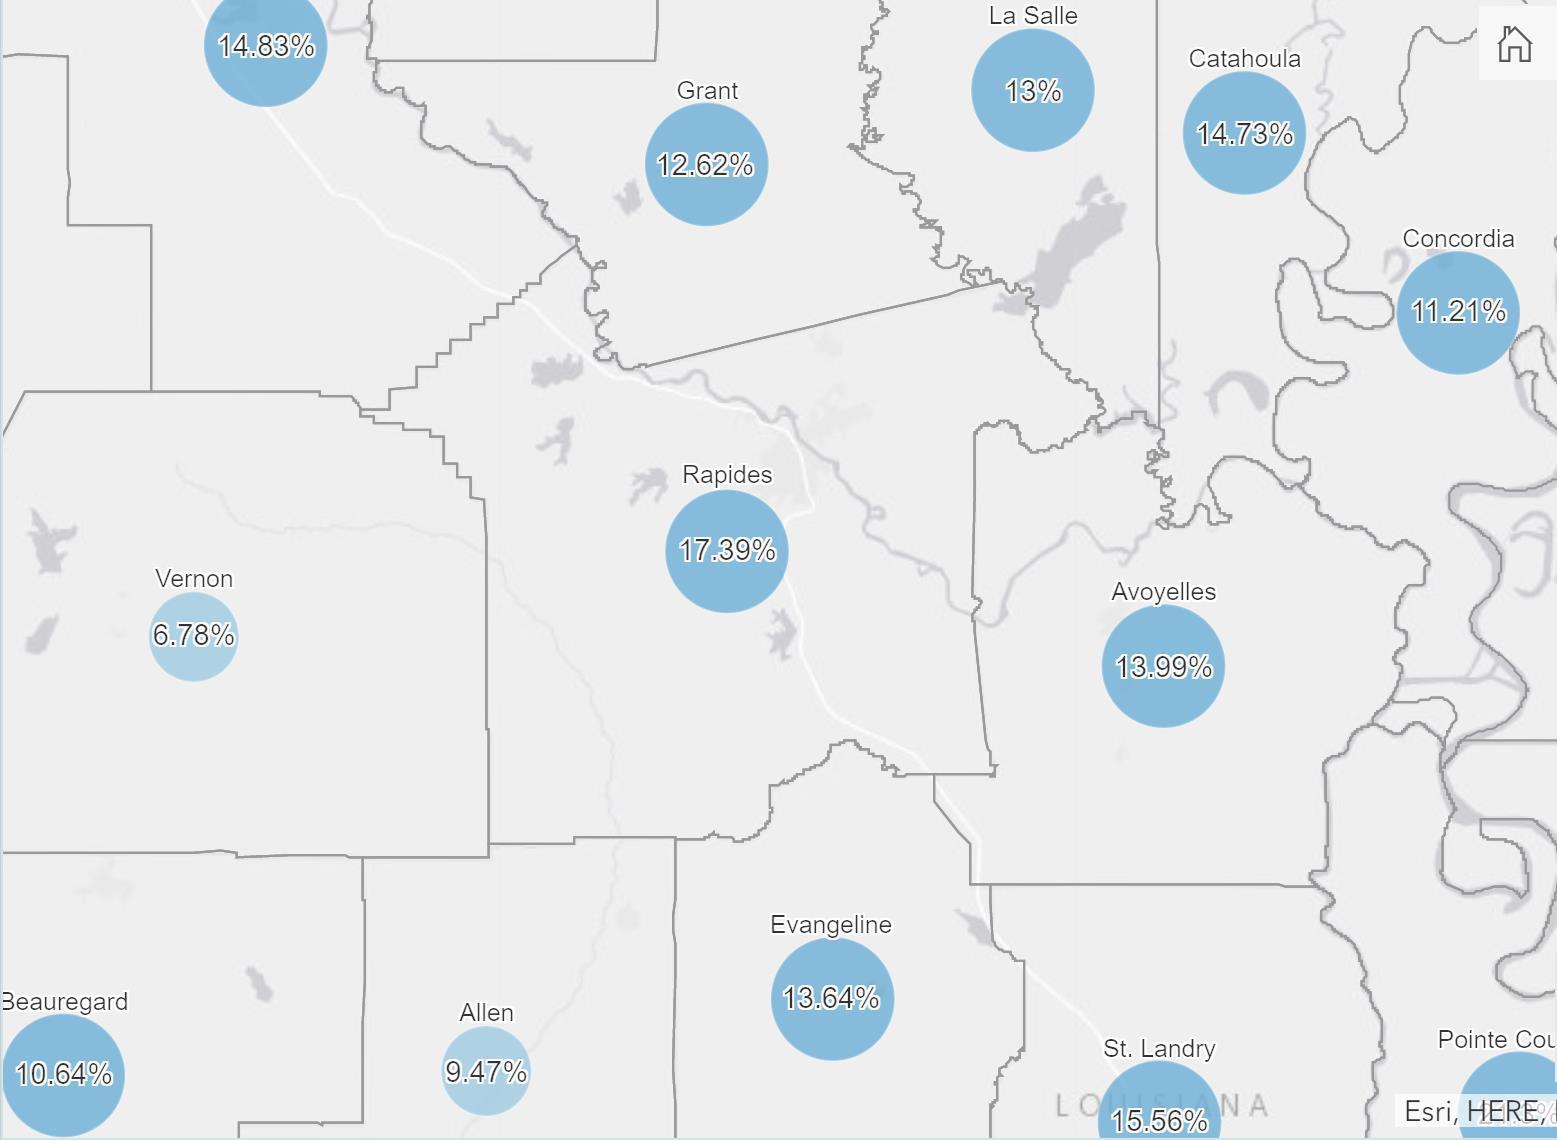
Region 1 (New Orleans) and Region 2 (Baton Rouge) have the highest vaccination rates at 23.8% and 20.5%, respectively.
Source: Louisiana Office of Public Health, https://ldh.la.gov/covidvaccine, April 10, 2021
COVID-19CASESBYK-12SCHOOLS
Covid-19 cases reported by K-12 schools in Region 6 from March 29 – April 4, 2021.
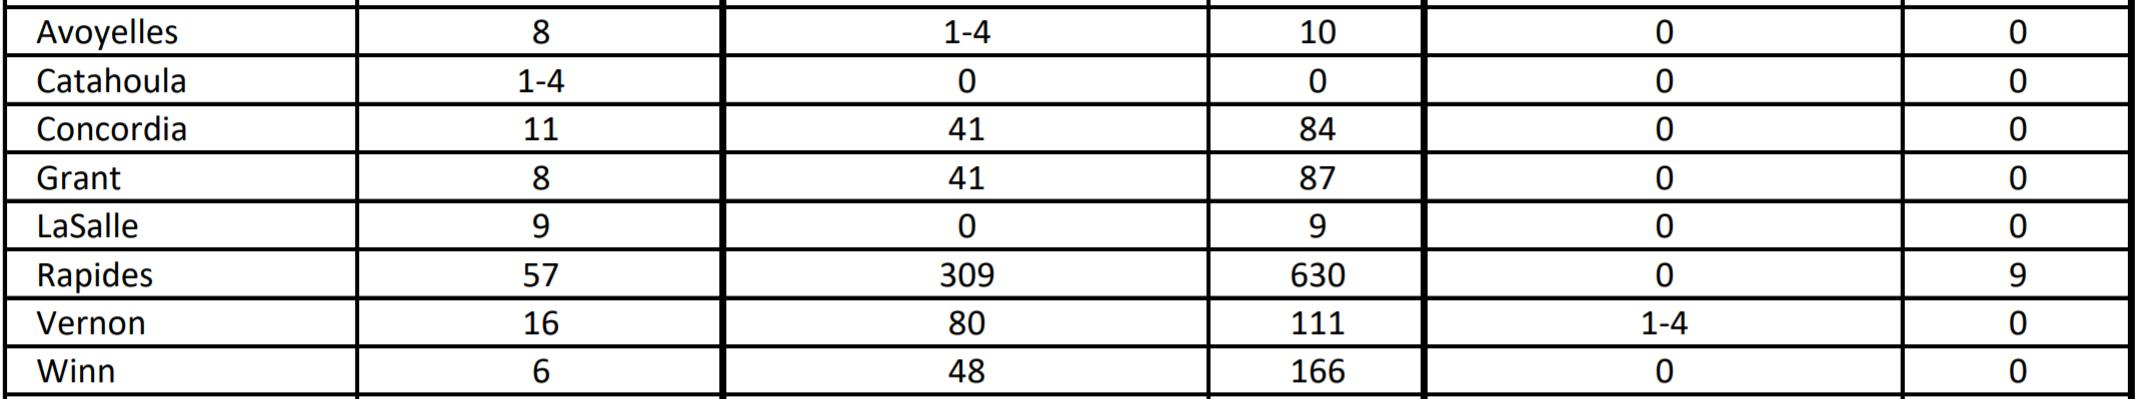
Source: Louisiana Office of Public Health, Region 6 (Central Louisiana), March 29 –April 4, 2021.
COVID-19CASESBYCOLLECTIONDATE
COVID-19 cases by collection date as of April 10, 2021 in Region 6 with a 7-day moving average.
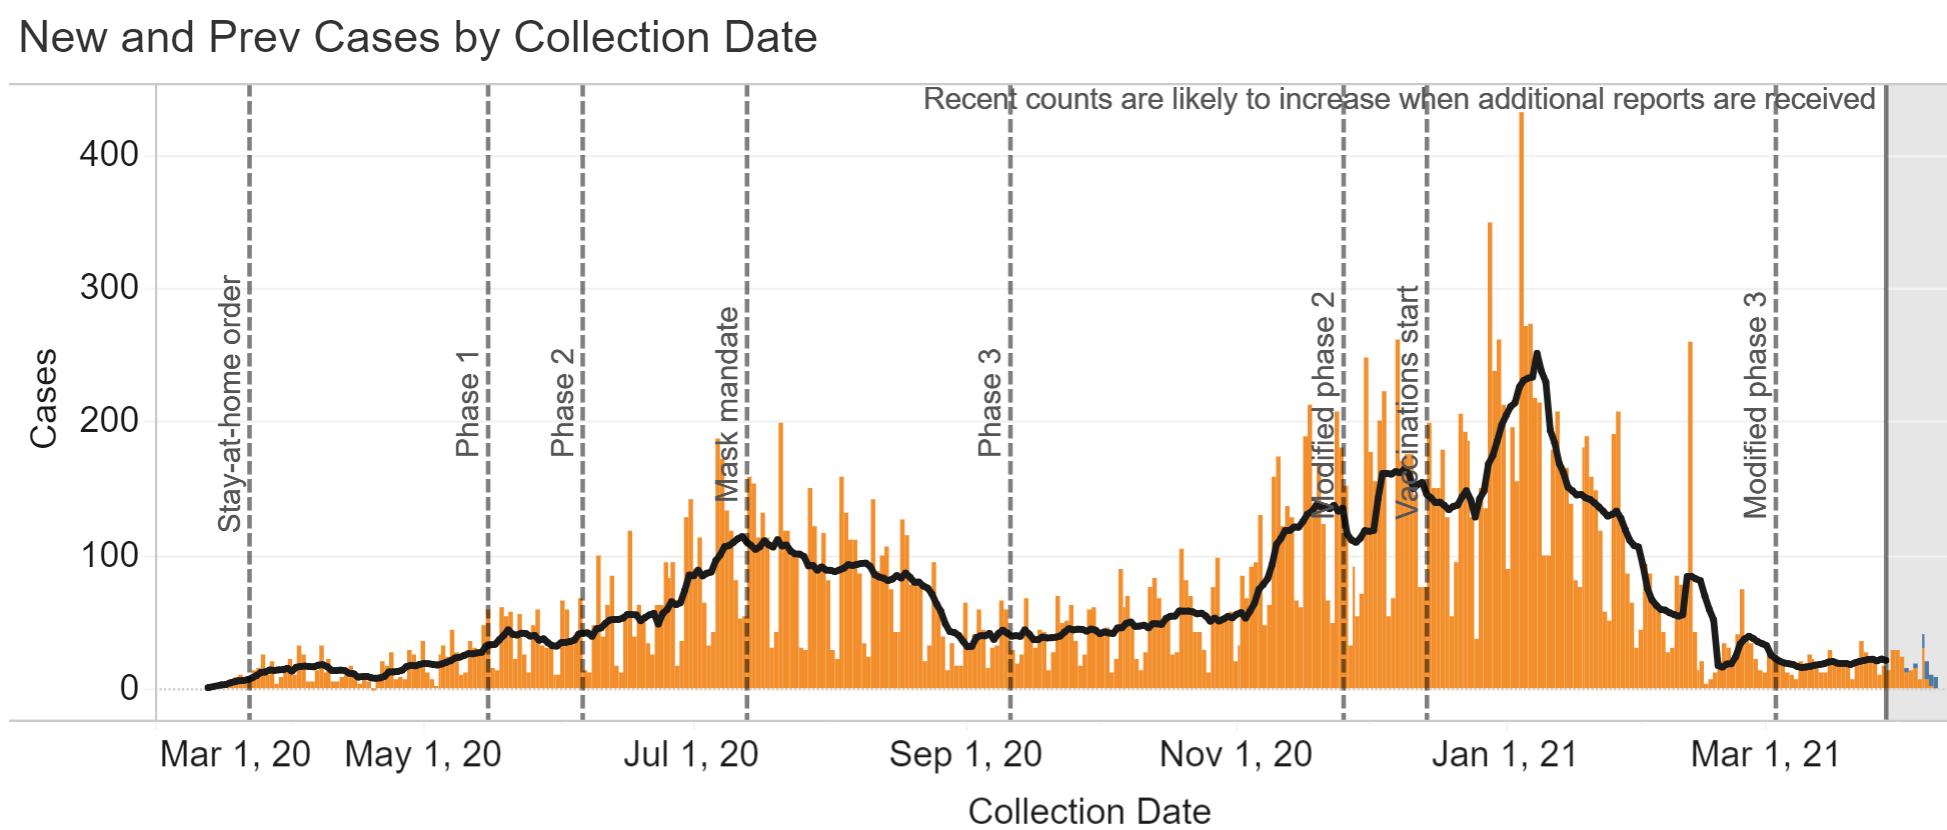
Source: Louisiana Office of Public Health, Region 6 (Central Louisiana), April 10, 2021.
:
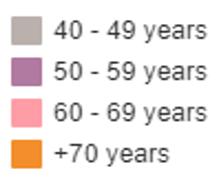
COVID-19REGION6CASESBYAGEGROUP
Cases over time by age group in Region 6 through April 9, 2021.
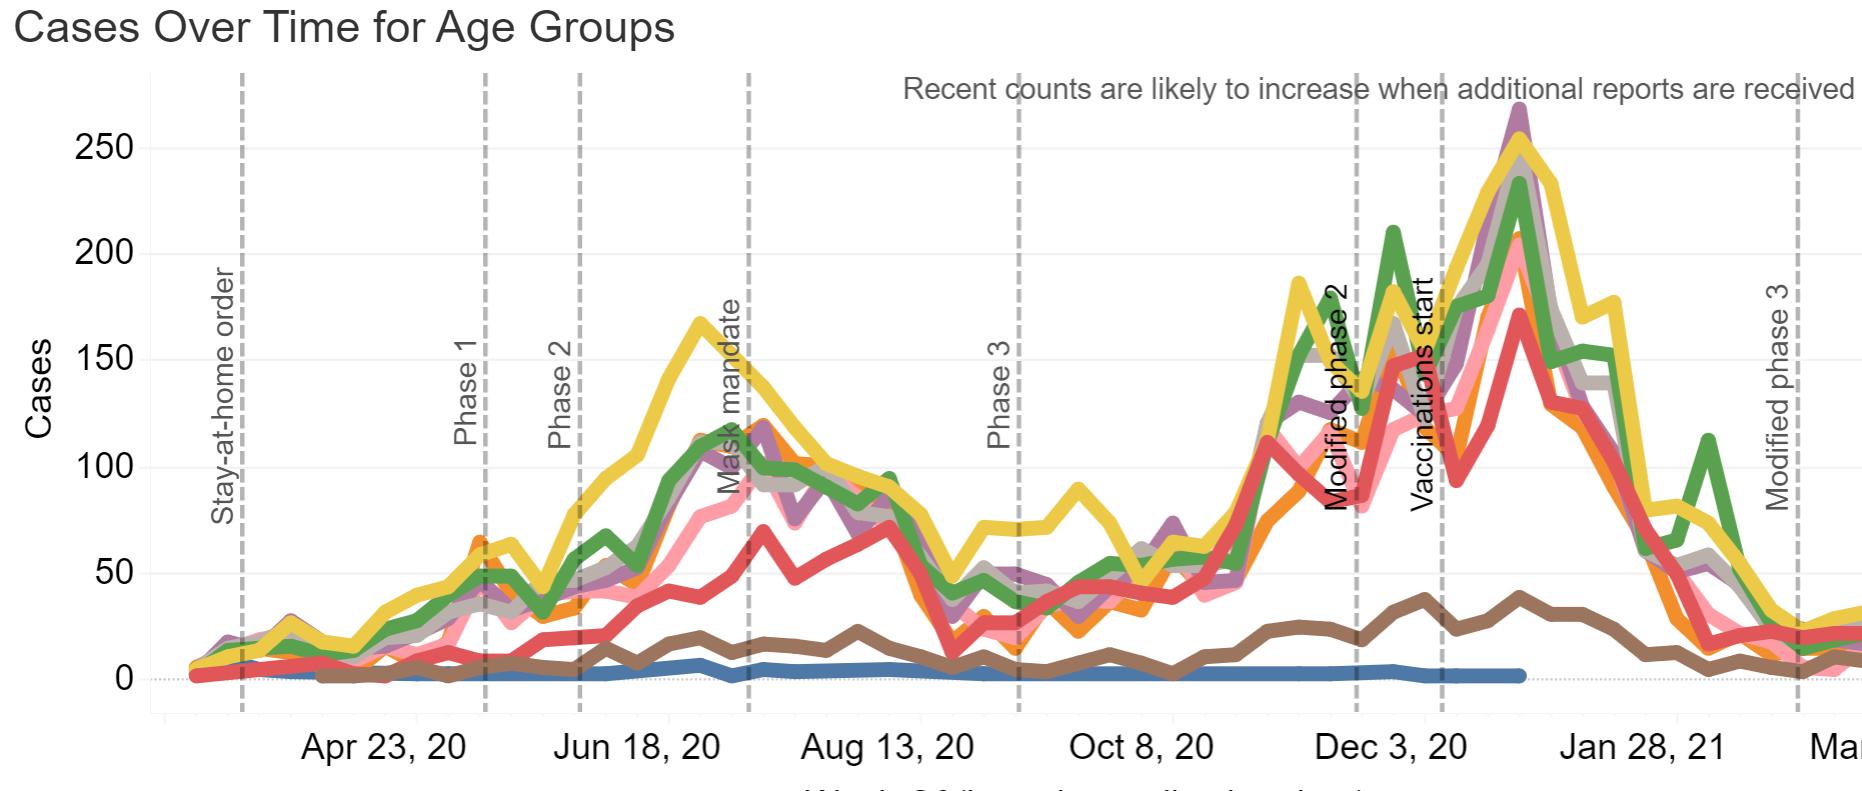
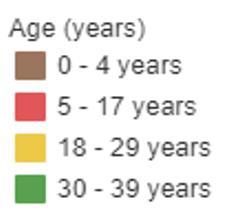
Source: Louisiana Office of Public Health, Region 6 (Central Louisiana), April 9, 2021.
:
COVID-19PERCENTPOSITIVEANDTESTVOLUME
COVID-19 percent positive and test volume in Region 6 as of April 9, 2021.
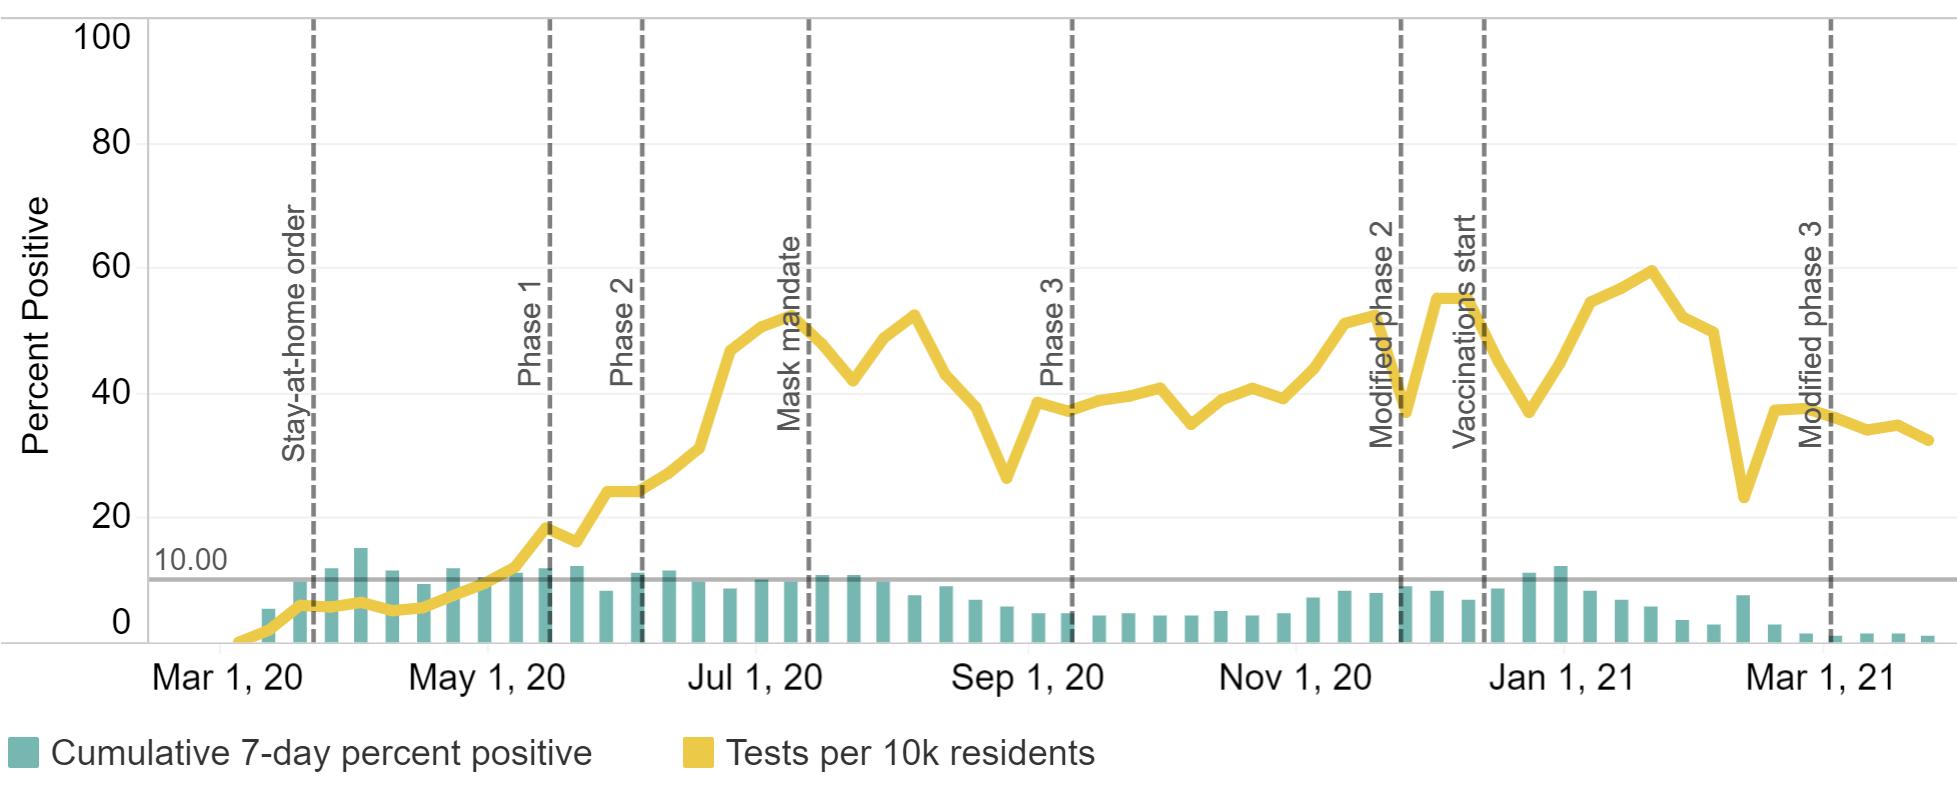
Source: Louisiana Office of Public Health, Region 6 (Central Louisiana), April 9, 2021..
:
COVID-19CASESSTATEWIDE
COVID-19 cases statewide by age group as of April 9, 2021.
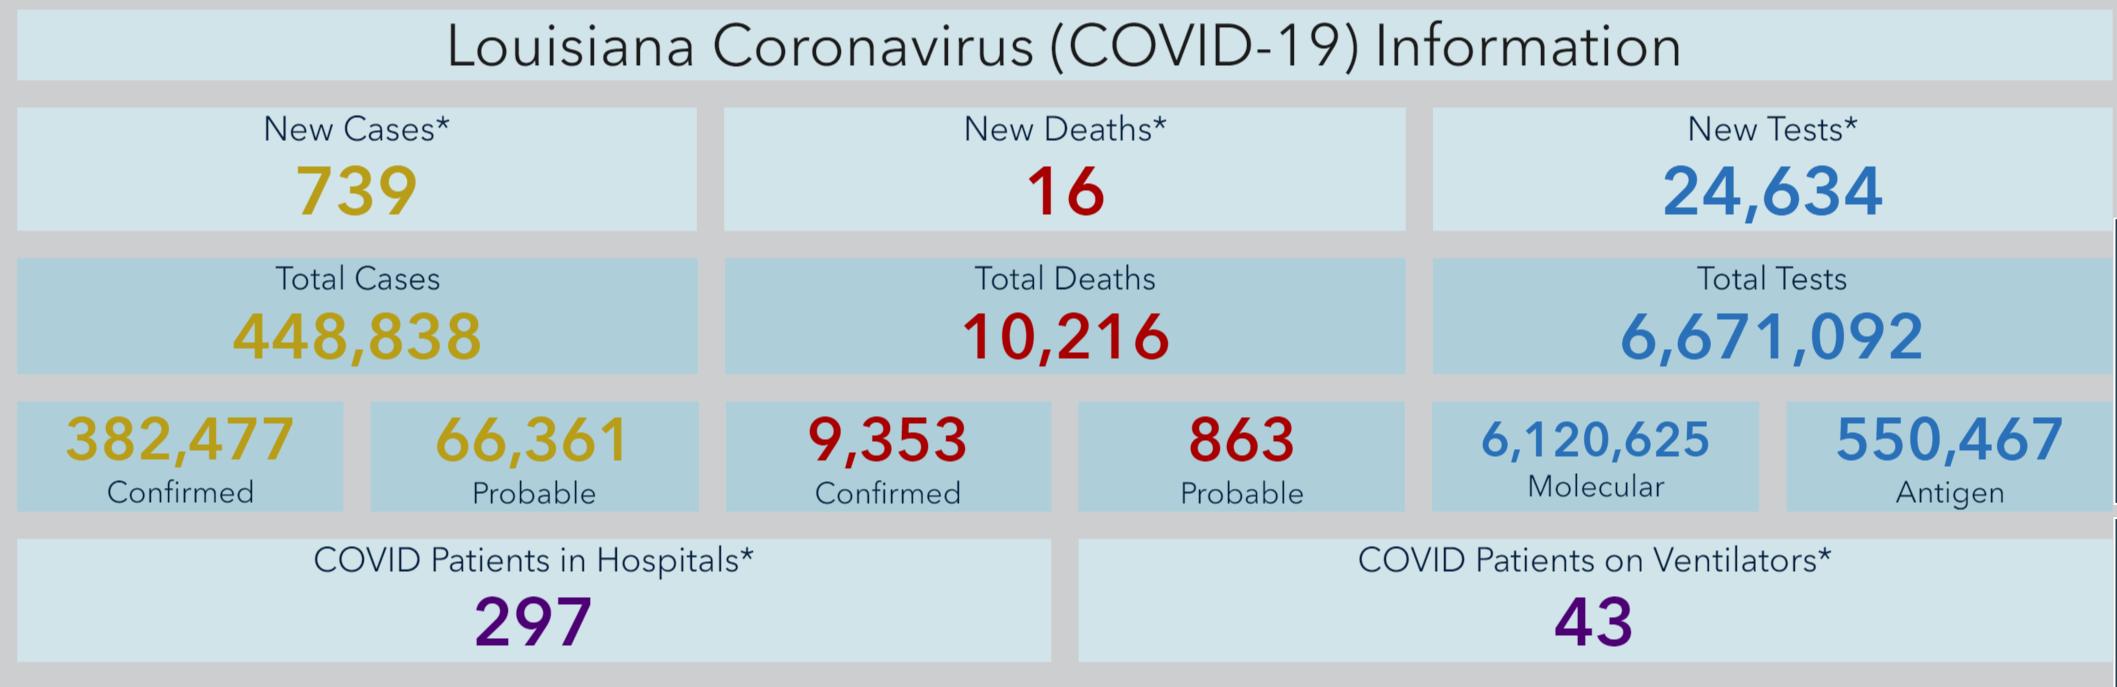
Source: Louisiana Office of Public Health, Region 6 (Central Louisiana), April 9, 2021.
:
COVID-19HOSPITALIZED&VENTILATED
Number of cases hospitalized (green line) and ventilated (yellow line) in Region 6 as of April 14, 2021.
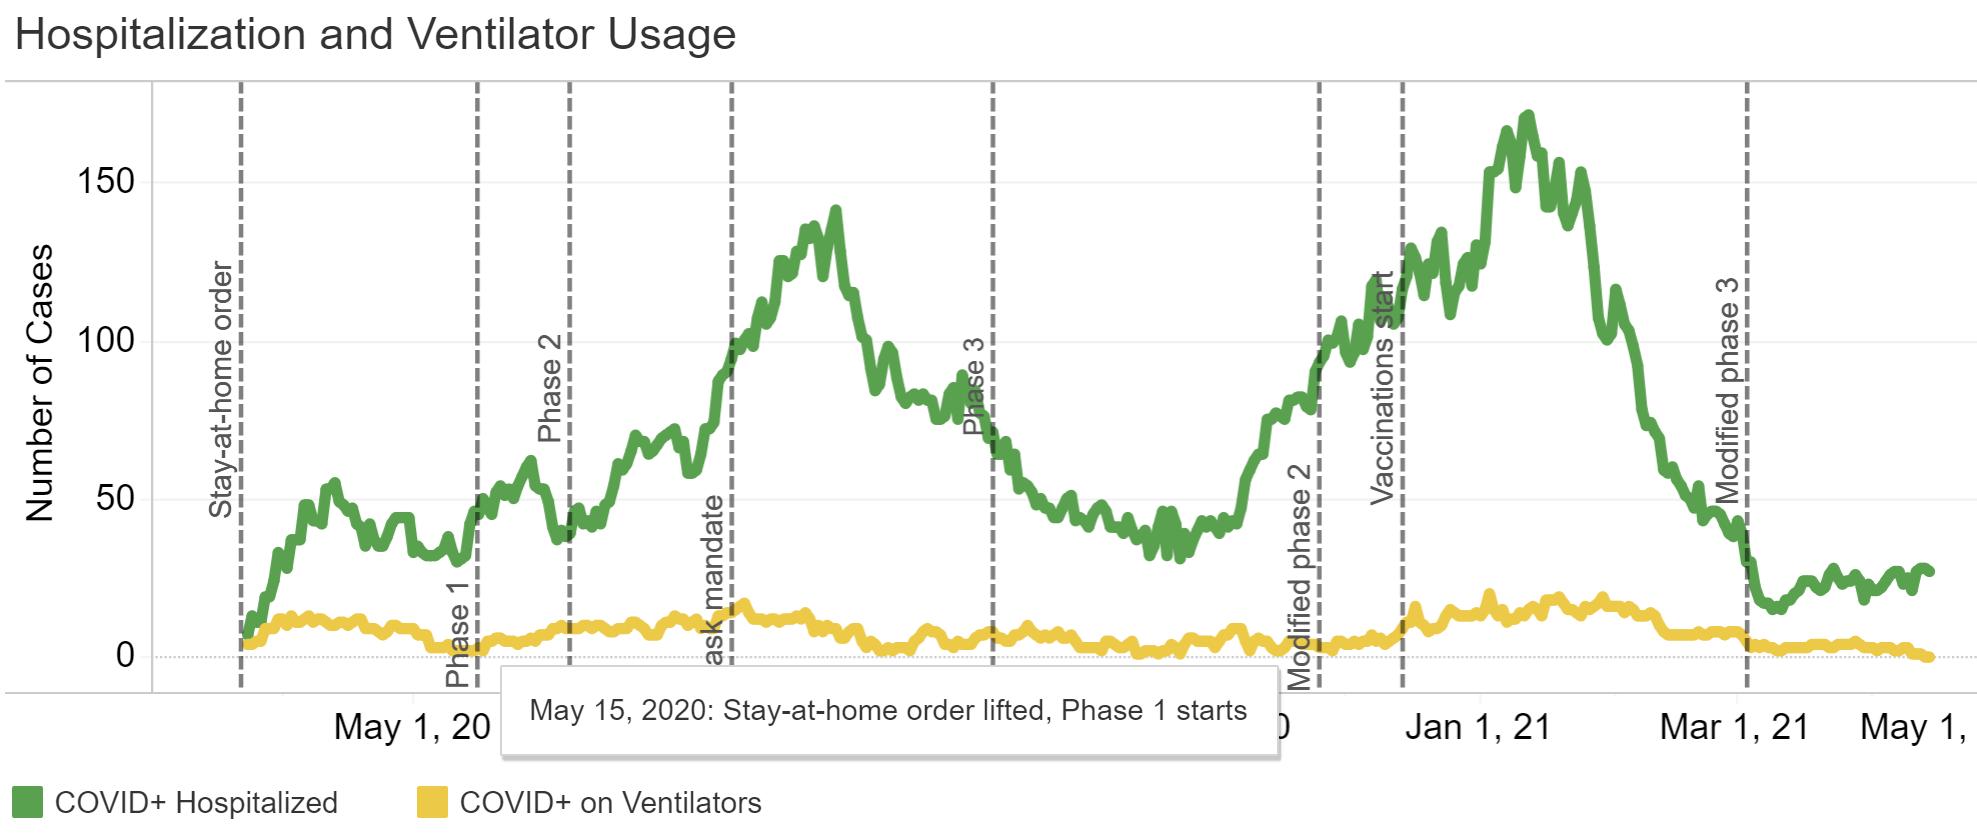
Source: Louisiana Office of Public Health, Region 6 (Central Louisiana), April 14, 2021.
:
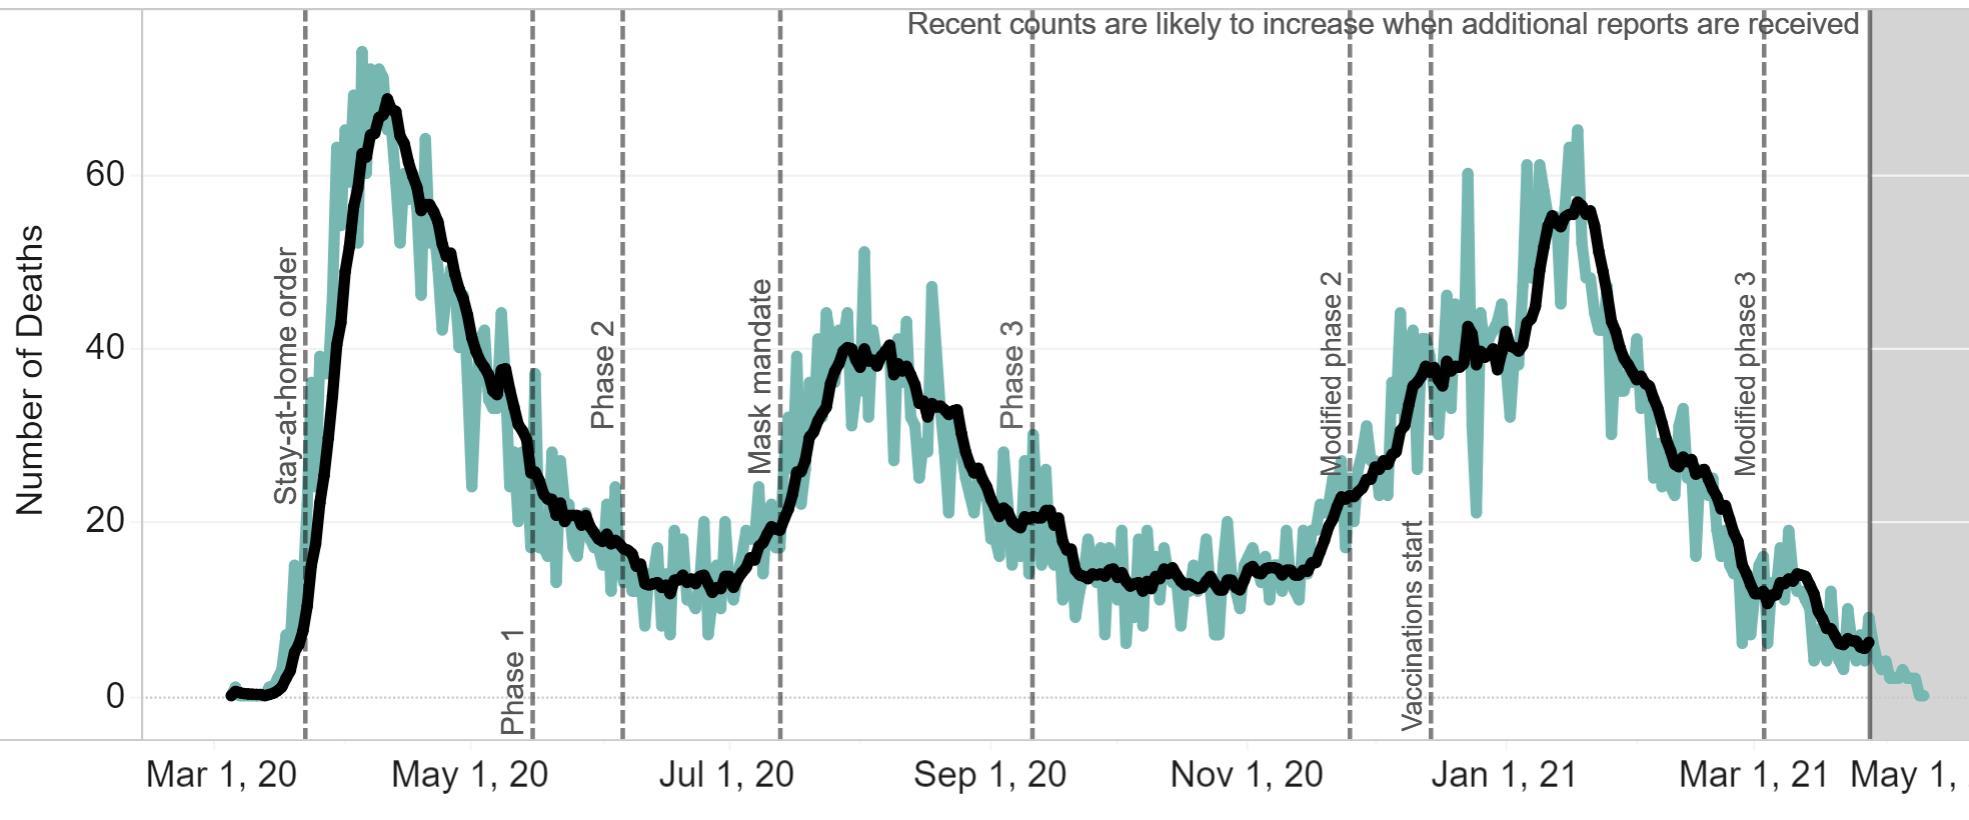
COVID-19DEATHSSTATEWIDEBYDATE
COVID-19 deaths by date of death statewide as of April 9, 2021.
Source: Louisiana Office of Public Health, Region 6 (Central Louisiana), April 9, 2021.
:
COVID-19CASES&DEATHSBYAGEGROUP
COVID-19 cases (left) and deaths (right) statewide by age group as of Aprl 9, 2021.
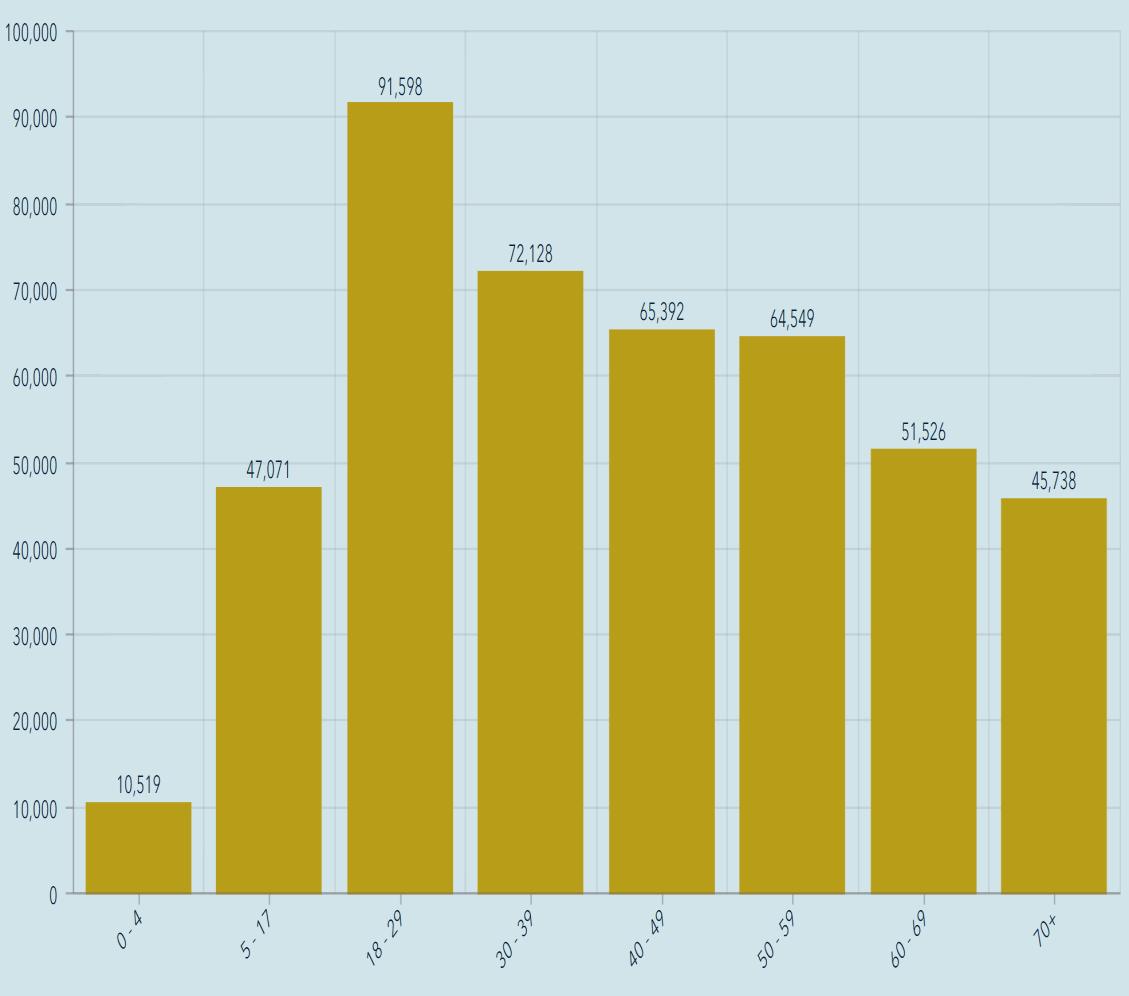
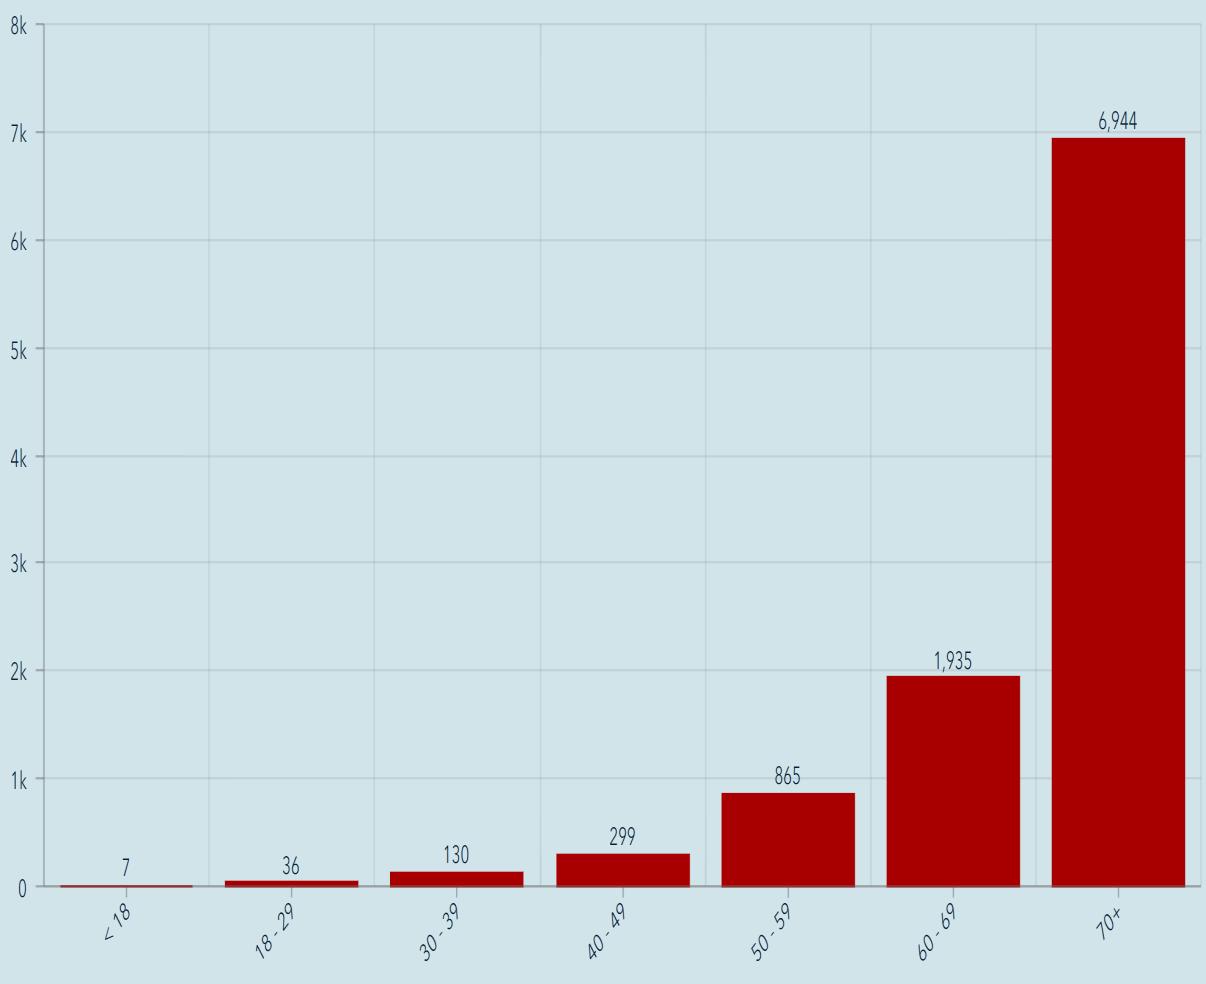
Source: Louisiana Office of Public Health, Region 6 (Central Louisiana), April 9, 2021.
:
EMPLOYMENT
LABORFORCEINALEXANDRIAMSA
Labor force level in the Alexandria MSA from 2019 – 2021.
The labor force in the Alexandria MSAin January 2021 exceeded January 2020, 63,257 to 63,200.
Source: Louisiana Workforce Commission,April 14, 2021
56000 58000 60000 62000 64000 66000 Jan Feb Mar Apr May Jun Jul Aug Sep Oct Nov Dec
2019 - 2021 2019 2020 2021
Labor Force in the Alexandria MSA
UNEMPLOYMENTCLAIMSINLOUISIANA
Initial and continued unemployment claims in Louisiana from March 14, 2020 through March 27, 2021.


Statewide average weekly initial unemployment claims filed in March rose to 8,418 from 7,249 in February, a 16% increase.
Statewide average weekly continued unemployment claims in March fell to 44,514 from 55,439 in February, a 20% decrease.
Source: Louisiana Workforce Commission,April 15, 2021
Unemployment Claims in Louisiana
0 20,000 40,000 60,000 80,000 100,000 120,000 0 50,000 100,000 150,000 200,000 250,000 300,000 350,000 3/14/2020 3/28/2020 4/11/2020 4/25/2020 5/9/2020 5/23/2020 6/6/2020 6/20/2020 7/4/2020 7/18/2020 8/1/2020 8/15/2020 8/29/2020 9/12/2020 9/26/2020 10/10/2020 10/24/2020 11/7/2020 11/21/2020 12/5/2020 12/19/2020 1/2/2021 1/16/2021 1/30/2021 2/13/2021 2/27/2021 3/13/2021 3/27/2021 Initial Claims Continued Claims
Continued Initial
UNEMPLOYMENTCLAIMSINCENLA
Initial and continued unemployment claims in central Louisiana from March 14, 2020 through March 27, 2021.

Average weekly initial unemployment claims in central Louisiana fell to 401 in March from 414 in February, a 3% decrease.
Average weekly continued unemployment claims in central Louisiana fell to 2,932 in March from 3,655 in February, a 20% decrease.
Source: Louisiana Workforce Commission,April 15, 2021
Unemployment Claims in CENLA
0 1,000 2,000 3,000 4,000 5,000 6,000 7,000 0 5,000 10,000 15,000 20,000 25,000 3/14/2020 3/28/2020 4/11/2020 4/25/2020 5/9/2020 5/23/2020 6/6/2020 6/20/2020 7/4/2020 7/18/2020 8/1/2020 8/15/2020 8/29/2020 9/12/2020 9/26/2020 10/10/2020 10/24/2020 11/7/2020 11/21/2020 12/5/2020 12/19/2020 1/2/2021 1/16/2021 1/30/2021 2/13/2021 2/27/2021 3/13/2021 3/27/2021 Initial Claims Continued Claims
Continued Initial
UNEMPLOYMENTRATEBYCENLAPARISH
The table below shows February 2021 preliminary unemployment rate, labor force, and employment data for central Louisiana parishes.
In February, parishes in central Louisiana had an average unemployment rate of 6.1% compared to 7.1% statewide.
At 3.7%, La Salle Parish had the lowest unemployment rate in the state.
Data Source: Louisiana Workforce Commission, April 15, 2021.
Area Labor Force Employed Unemployed Unemployment Unemployment Rate Feb 2021 Rate Jan 2021 Allen 8,055 7,505 550 6.8 7.5 Avoyelles 14,651 13,745 906 6.2 6.9 Catahoula 3,438 3,226 212 6.2 6.9 Concordia 6,759 6,294 465 6.9 7.3 Evangeline 11,631 10,868 763 6.6 7.1 Grant 8,030 7,665 365 4.5 5.3 La Salle 6,855 6,604 251 3.7 4.1 Natchitoches 15,650 14,801 849 5.4 6.1 Rapides 54,535 51,933 2,602 4.8 5.2 St. Landry 31,972 29,495 2,477 7.7 8.3 Vernon 15,423 14,661 762 4.9 6.0
UNEMPLOYMENTRATEAMONGLAMETROS
The table below shows February 2021 preliminary unemployment rate, labor force, and employment data for Metropolitan Statistical Areas in Louisiana.
At 4.7%, the Alexandria MSA had the lowest unemployment rate among the state’s major metro areas for the tenth straight month, falling 0.5% since January.
Louisiana’s unemployment rate fell 0.5% in February to 7.1% from 7.6% in January.
Data Source: Louisiana Workforce Commission,April 15, 2021.
Area Unemployment Rate Labor Force Employed Unemployed Louisiana 7.1% 2,042,105 1,897,761 144,344 Alexandria 4.7% 62,565 59,598 2,967 Baton Rouge 6.2% 416,477 390,781 25,696 Hammond 8.0% 55,893 51,431 4,462 Houma-Thibodaux 6.2% 86,367 81,003 5,364 Lafayette 6.5% 206,661 193,167 13,494 Lake Charles 7.3% 95,560 88,559 7,001 Monroe 6.2% 77,321 72,497 4,824 New Orleans-Metairie 8.6% 582,880 532,581 50,299 Shreveport-Bossier City 6.8% 180,259 168,009 12,250
UNEMPLOYEDPERJOBOPENING
The table below shows the number of unemployed, number of advertised jobs online, and the ratio of unemployed to advertised job openings online for Metropolitan Statistical Areas in Louisiana in February 2021.
Alexandria metro area continues to have the tightest labor market in the state with only 0.58 unemployed persons per job opening compared to 1.62 statewide.
Source: Louisiana Workforce Commission,April 15, 2021
Rank Metro Area Unemployed Job Openings Unemployed per Job Opening 1 Alexandria 2,967 5,127 0.58 2 Shreveport-Bossier City 12,250 9,887 1.24 3 Lake Charles 7,001 5,404 1.30 4 Monroe 4,824 3,317 1.45 5 Baton Rouge 25,696 16,370 1.57 6 New Orleans-Metairie 50,299 30,241 1.66 7 Lafayette 13,494 7,374 1.83 8 Houma-Thibodaux 5,364 2,340 2.29
TAXREVENUE
TAXREVENUEOVERVIEW
An overview of sales, vehicle sales, and hotel occupancy taxes collected in the March 2021 reflecting sales activity in February 2021.
Note: March tax revenue reflects sales activity in February. N/a = Not available
Data Source noted in detailed reports.
Sales Tax M/M Y/Y YTD Vehicle Sales Tax M/M Y/Y YTD Alexandria -8.3% 6.3% 8.2% Avoyelles -21.4% 6.6% 19.2% Avoyelles -8.9% 26.9% 20.9% Evangeline -23.5% 4.9% 8.7% Catahoula 10.8% 20.8% 17.2% Rapides 25.0% 53.5% 38.6% Concordia -13.1% 85% 18.3% St. Landry -25.0% -0.2% 0% Evangeline -2.8% 18.1% 14.0% La Salle -7.4% 15.7% 15.3% Hotel Occupancy Tax Pineville -13.0% 11.5% 11.3% Avoyelles 276% 270% 11% Rapides -5.3% 14.6% 13.4% Rapides 20.2% 308% -7.3% St. Landry -19.7% 1.0% -3.6% March 2021
RAPIDESPARISHTOWNS&CITIES
An overview of sales tax revenue in Rapides Parish other towns and cities in March 2021 (excluding Alexandria and Pineville).


Note: Current tax revenue reflects sales activity in prior month.
March Mar-20 Feb-21 Mar-21 % M/M % Y/Y %YTD Ball $55,596 $73,013 $61,814 -15.3% 11.2% 24.5% Boyce $25,370 $40,084 $70,184 75.1% 176.6% 85.0% Cheneyville $1,667 $2,187 $2,303 5.3% 38.2% -11.4% Glenmora $16,194 $17,917 $20,117 12.3% 24.2% 12.4% Lecompte $20,870 $20,730 $21,512 3.8% 3.1% 7.2% Woodworth $26,730 $46,760 $35,910 -23.2% 34.3% 51.4%
Parish Police Jury Treasurer’s
$40 $50 $60 $70 $80 $90 Jan Feb Mar Apr May Jun Jul Aug Sep Oct Nov Dec Thousands Ball 2019 2020 2021 $10 $20 $30 $40 $50 $60 Jan Feb Mar Apr May Jun Jul Aug Sep Oct Nov Dec Thousands Woodworth 2019 2020 2021
Data Source: Rapides
Reports,April 2021.
ALEXANDRIASALESTAX


(TR) Alexandria total sales tax revenue for March with previous month, year, and YTD comparisons.
(BR) Alexandria total monthly sales tax revenue from 2019 to present.
Note: March sales tax revenue reflects sales activity in February.
Data Source: Rapides Parish Police Jury Treasurer’s Reports,April 2021.
March -8.3%% Mar. YoY 6.3% Mar. YTD 8.2% March
2018 2019 2020 2021 March $ 2,825,913 $ 2,924,815 $ 2,856,685 $ 3,037,395 February $ 3,061,380 $ 2,868,635 $ 3,079,930 $ 3,313,658 % Chg over Prev Month -7.7% 2.0% -7.2% -8.3% % Chg over Prev Year 3.5% -2.3% 6.3% YTD (Jan - Dec) $ 9,919,898 $ 9,934,433 $ 10,069,410 $ 10,893,208 % Chg over Prev YTD 0.1% 1.4% 8.2% $$1 $2 $3 $4 $5 Millions Alexandria Sales Tax Revenue 2019-2021 2019 2020 2021
AVOYELLESSALESTAX
Avoyelles Parish total sales tax revenue for March with previous month, year, and year-to-date comparisons. Vehicle and hotel tax revenues are excluded. Data Source: Avoyelles Parish School Board. April 2021.
Note: March sales tax revenue reflects sales activity in February.
March -8.9% Mar. YoY 26.9% Mar. YTD 20.9% March
2017 2018 2019 2020 2021 March $ 1,282,540 $ 1,202,024 $ 1,293,507 $ 1,117,939 $ 1,419,160 February $ 1,211,961 $ 1,113,435 $ 1,177,667 $ 1,212,841 $ 1,557,712 % Chg over Prev Month 5.8% 8.0% 9.8% -7.8% -8.9% % Chg over Prev Year -6.3% 7.6% -13.6% 26.9% YTD (Jan - Dec) $ 4,179,322 $ 4,077,181 $ 4,367,437 $ 4,178,031 $ 5,051,631 % Chg over Prev YTD -2.4% 7.1% -4.3% 20.9%
AVOYELLESVEHICLESALESTAX
Avoyelles Parish vehicle sales tax revenue for March with previous month, year, and year-to-date comparisons.
Note: March sales tax revenue reflects sales activity in February.
Data Source: Avoyelles Parish School Board. April 2021
March -21.4% Mar. YoY 6.6% Mar. YTD 19.2% March
2017 2018 2019 2020 2021 March $ 220,232 $ 224,927 $ 236,649 $ 243,753 $ 259,727 February $ 268,296 $ 236,976 $ 287,839 $ 287,866 $ 330,453 % Chg over Prev Month -17.9% -5.1% -17.8% -15.3% -21.4% % Chg over Prev Year 2.1% 5.2% 3.0% 6.6% YTD (Jan - Dec) $ 772,316 $ 691,685 $ 716,431 $ 786,955 $ 938,326 % Chg over Prev YTD -10.4% 3.6% 9.8% 19.2%
CATAHOULASALESTAX
Catahoula Parish total sales tax revenue for March with previous month, year, and year-to-date comparisons.
Note: March sales tax revenue reflects sales activity in February.
Data Source: Catahoula Parish Tax Administrator April 2021
March -10.8% Mar. YoY 20.8% Mar. YTD 17.2% March
2018 2019 2020 2021 March $ 453,942 $ 418,599 $ 384,586 $ 464,418 February $ 431,138 $ 424,857 $ 460,357 $ 520,518 % Chg over Prev Month 5.3% -1.5% -16.5% -10.8% % Chg over Prev Year -7.8% -8.1% 20.8% YTD (Jan - Dec) $ 1,408,162 $ 1,358,427 $ 1,356,155 $ 1,589,420 % Chg over Prev YTD -3.5% -0.2% 17.2%
CONCORDIASALESTAX
Concordia Parish total sales tax revenue for March with previous month, year, and year-to-date comparisons.
Note: March sales tax revenue reflects sales activity in February.
Data Source: Concordia Parish Tax Administrator.April 2021
March -13.1% Mar. YoY 8.5% Mar. YTD 18.3% March
2018 2019 2020 2021 March $ 858,418 $ 976,350 $ 849,605 $ 921,494 February $ 824,230 $ 894,512 $ 936,784 $ 1,060,357 % Chg over Prev Month 4.1% 9.1% -9.3% -13.1% % Chg over Prev Year 13.7% -13.0% 8.5% YTD (Jan - Dec) $ 2,767,305 $ 3,176,513 $ 2,911,762 $ 3,444,315 % Chg over Prev YTD 14.8% -8.3% 18.3%
EVANGELINESALESTAX
Evangeline Parish total sales tax revenue for March with previous month, year and YTD comparisons.
Note: March sales tax revenue reflects sales activity in February.
Data Source: Evangeline Parish Sales Tax Commissioner.April 2021
March -2.8% Mar. YoY 18.1% Mar. YTD 14.0% March
2017 2018 2019 2020 2021 March $ 1,273,408 $ 1,295,041 $ 1,371,683 $ 1,323,124 $ 1,562,969 February $ 1,386,858 $ 1,297,401 $ 1,421,713 $ 1,457,691 $ 1,608,232 % Chg over Prev Month -8.2% -0.2% -3.5% -9.2% -2.8% % Chg over Prev Year 1.7% 5.9% -3.5% 18.1% YTD $ 2,660,266 $ 2,592,442 $ 2,793,396 $ 2,780,815 $ 3,171,201 % Chg over Prev YTD -2.5% 7.8% -0.5% 14.0%
EVANGELINEVEHICLESALESTAX
Evangeline Parish vehicle sales tax revenue for March with previous month, year and YTD comparisons.
Note: March sales tax revenue reflects sales activity in February.
Data Source: Evangeline Parish Sales Tax Commissioner.April 2021
March -23.5% Mar. YoY 4.9% Mar. YTD 8.7% March
2017 2018 2019 2020 2021 March $ 258,717 $ 255,084 $ 259,766 $ 261,498 $ 274,428 February $ 290,233 $ 272,076 $ 347,675 $ 320,877 $ 358,527 % Chg over Prev Month -10.9% -6.2% -25.3% -18.5% -23.5% % Chg over Prev Year -1.4% 1.8% 0.7% 4.9% YTD $ 548,950 $ 527,160 $ 607,441 $ 582,375 $ 632,955 % Chg over Prev YTD -4.0% 15.2% -4.1% 8.7%
LASALLESALESTAX
La Salle Parish total sales tax revenue for March with previous month, year, and year-to-date comparisons.
Note: March sales tax revenue reflects sales activity in February.
Data Source: La Salle Parish Tax Administrator April 2021
March -7.4% Mar. YoY 15.7% Mar. YTD 15.3% March
2018 2019 2020 2021 March $ 591,632 $ 743,823 $ 721,926 $ 834,953 February $ 604,999 $ 783,427 $ 814,504 $ 901,836 % Chg over Prev Month -2.2% -5.1% -11.4% -7.4% % Chg over Prev Year 25.7% -2.9% 15.7% YTD (Jan - Dec) $ 2,020,549 $ 2,767,003 $ 2,472,897 $ 2,852,217 % Chg over Prev YTD 36.9% -10.6% 15.3%
PINEVILLESALESTAX

(TR) Pineville sales tax revenue for March with previous month, year, and YTD comparisons.
(BR) Pineville monthly sales tax revenue from 2019 to present.
Note: Current sales tax revenue reflects sales activity in the prior month.
Data Source: Rapides Parish Police Jury Treasurer’s Reports,April 2021.
March -13.0% Mar. YoY 11.5% Mar. YTD 11.3% 2018 2019 2020 2021 March $ 806,993 $ 788,435 $ 827,923 $ 923,448 February $ 819,413 $ 796,423 $ 1,004,243 $ 1,061,220 % Chg over Prev Month -1.5% -1.0% -17.6% -13.0% % Chg over Prev Year -2.3% 5.0% 11.5% YTD (Jan - Dec) $ 2,638,700 $ 2,611,023 $ 2,930,615 $ 3,263,185 % Chg over Prev YTD -1.0% 12.2% 11.3% March
0.6 0.8 1.0 1.2 1.4 Millions Pineville Sales Tax Revenue 2019-2021 2019 2020 2021
RAPIDESOCCUPATIONALLICENSES
Rapides Parish occupational license revenue YTD with previous YTD comparisons.
Note: YTD occupational license revenue reflects licenses issued YTD in January and February. Rapides reflects unincorporated areas.
Data Source: Rapides Parish Police Jury Treasurer’s Reports,April 2021.
Rapides (rural) 2.9% Alexandria 0% Pineville 0.5% March Year-to-Date Other -7.1% Total 0.3% 2018 2019 2020 2021 Parish $ 510,487 $ 523,268 $ 498,887 $ 513,575 % Chg over Prev YTD 2.5% -4.7% 2.9% Alexandria $ 1,672,211 $ 1,628,057 $ 1,631,362 $ 1,632,123 % Chg over Prev YTD -2.6% 0.2% 0.0% Pineville $ 333,517 $ 359,558 $ 384,261 $ 386,002 % Chg over Prev YTD 7.8% 6.9% 0.5% Other $ 108,348 $ 115,853 $ 116,882 $ 108,567 % Chg over Prev YTD 6.9% 0.9% -7.1% Total $ 2,624,563 $ 2,626,736 $ 2,631,392 $ 2,640,267 % Chg over Prev YTD 0.1% 0.2% 0.3%
RAPIDESSALESTAX
(TR) Rapides Parish sales tax revenue for March with previous month, year, and YTD comparisons.
(BR) Rapides monthly sales tax revenue from 2019 to present.
Note: Current sales tax revenue reflects sales activity in the prior month.
March -5.3% Mar. YoY 14.6% Mar. YTD 13.4% 2018 2019 2020 2021 March $ 9,721,869 $ 10,050,047 $ 10,102,203 $ 11,580,922 February $ 9,777,757 $ 9,878,422 $ 11,163,593 $ 12,235,503 % Chg over Prev Month -0.6% 1.7% -9.5% -5.3% % Chg over Prev Year 3.4% 0.5% 14.6% YTD (Jan - Dec) $ 32,843,093 $ 33,787,413 $ 35,247,557 $ 39,964,001 % Chg over Prev YTD 2.9% 4.3% 13.4% March
Data Source: Rapides Parish Police Jury Treasurer’s Reports,April 2021.
$9 $11 $13 $15 $17 Millions Rapides Parish Total Sales Tax Revenue 2019 - 2021 2019 2020 2021
RAPIDESVEHICLESALESTAX
Rapides Parish vehicle sales tax revenue for March with previous month, year, and YTD comparisons.
Data Source: Tax revenue data from Rapides Parish Police Jury Treasurer’s Reports,April 2021.
March 25.0% Mar. YoY 53.5% Mar. YTD 30.6% March 2018 2019 2020* 2021* March $ 901,355 $ 874,535 $ 1,044,076 $ 1,602,680 February $ 1,010,781 $ 1,142,474 $ 1,171,176 $ 1,282,207 % Chg over Prev Month -10.8% -23.5% -10.9% 25.0% % Chg over Prev Year -3.0% 19.4% 53.5% YTD (Jan - Dec) $ 2,903,661 $ 2,891,315 $ 3,257,469 $ 4,254,102 % Chg over Prev YTD -0.4% 12.7% 30.6%
ST.LANDRYSALESTAX
St. Landry Parish sales tax revenue for March with previous month, year, and YTD comparisons.
Note: March sales tax revenue reflects sales activity in February.
Data Source: Tax revenue data from St. Landry Parish School Board. April 2021
March -19.7% Mar. YoY 1.0% Mar. YTD -3.6% March
2018 2019 2020 2021 March $ 4,901,561 $ 4,790,526 $ 4,851,629 $ 4,901,561 February $ 4,724,384 $ 5,191,009 $ 5,224,951 $ 6,107,045 % Chg over Prev Month 3.8% -7.7% -7.1% -19.7% % Chg over Prev Year -2.3% 1.3% 1.0% YTD (Jan - Dec) $16,181,949 $15,998,241 $16,794,324 $16,181,949 % Chg over Prev YTD -1.1% 5.0% -3.6%
ST.LANDRYVEHICLESALESTAX
St. Landry Parish vehicle sales tax revenue for March with previous month, year, and YTD comparisons.
Note: March sales tax revenue reflects sales activity in February.
Data Source: Tax revenue data from St. Landry Parish School Board. April 2021
March -25.0% Mar. YoY -0.2% Mar. YTD 0% March
2018 2019 2020 2021 March $ 730,772 $ 728,865 $ 706,995 $ 705,239 February $ 750,158 $ 815,297 $ 983,889 $ 939,891 % Chg over Prev Month -2.6% -10.6% -28.1% -25.0% % Chg over Prev Year -0.3% -3.0% -0.2% YTD (Jan - Dec) $ 2,126,038 $ 2,220,538 $ 2,503,796 $ 2,502,732 % Chg over Prev YTD 4.4% 12.8% 0.0%
REMOTESELLERSTAXREVENUEINCENLA


Remote seller tax revenue is tax revenue from online sales by location of the seller at the time of purchase.
Remote Sellers Sales Tax Collection
August 2020 - March 2021
Note: Sales tax revenue collected in one month reflects sales activity in the prior month.
Data Source: Louisiana Sales and Use Tax Commission for Remote Sellers. August 2020 –April 2021
$455,471 $586,935 $219,415 $292,754 $575,962 $338,545 $227,047 $684,473 $2,649,448 $1,693,757 $1,099,717 0 500,000 1,000,000 1,500,000 2,000,000 2,500,000 3,000,000
Allen Avoyelles Catahoula Concordia Evangeline Grant LaSalle Natchitoches Rapides St Landry Vernon
SinceAugust 2020, $8.8 million in sales tax revenue has been collected from online sales in central Louisiana.
REMOTESELLERSTAXREVENUE-1


Remote sellers tax revenue is tax revenue from online sales by location of the seller at the time of purchase.
Note: Sales tax revenue collected in one month reflects sales activity in the prior month.
Data Source: Louisiana Sales and Use Tax Commission for Remote Sellers. August 2020 –April 2021
43,443 39,092 44,540 53,607 69,016 86,592 64,643 54,538 $$20,000 $40,000 $60,000 $80,000 $100,000 Aug-20 Sep-20 Oct-20 Nov-20 Dec-20 Jan-21 Feb-21 Mar-21 Allen Parish $55,755 $52,967 $62,962 $73,017 $86,472 $101,419 $80,243 $74,100 $$20,000 $40,000 $60,000 $80,000 $100,000 $120,000 Aug-20 Sep-20 Oct-20 Nov-20 Dec-20 Jan-21 Feb-21 Mar-21 Avoyelles Parish $21,957 $19,418 $26,598 $24,256 $31,566 $38,404 $34,545 $22,671 $$20,000 $40,000 $60,000 Aug-20 Sep-20 Oct-20 Nov-20 Dec-20 Jan-21 Feb-21 Mar-21 Catahoula Parish $28,561 $28,149 $34,143 $34,785 $41,710 $52,856 $39,835 $32,715 $$20,000 $40,000 $60,000 Aug-20 Sep-20 Oct-20 Nov-20 Dec-20 Jan-21 Feb-21 Mar-21 Concordia Parish
REMOTESELLERSTAXREVENUE-2


Remote sellers tax revenue is tax revenue from online sales by location of the seller at the time of purchase.
Note: Sales tax revenue collected in one month reflects sales activity in the prior month.
Data Source: Louisiana Sales and Use Tax Commission for Remote Sellers. August 2020 –April 2021
$55,571 $52,605 $67,290 $67,173 $84,969 $102,328 $79,686 $66,340 $$20,000 $40,000 $60,000 $80,000 $100,000 $120,000 Aug-20 Sep-20 Oct-20 Nov-20 Dec-20 Jan-21 Feb-21 Mar-21 Evangeline Parish $31,161 $30,309 $35,736 $41,296 $50,354 $61,911 $47,966 $39,812 $$20,000 $40,000 $60,000 $80,000 Aug-20 Sep-20 Oct-20 Nov-20 Dec-20 Jan-21 Feb-21 Mar-21 Grant Parish $20,771 $20,388 $23,721 $26,088 $31,690 $43,525 $32,377 $28,487 $$20,000 $40,000 $60,000 Aug-20 Sep-20 Oct-20 Nov-20 Dec-20 Jan-21 Feb-21 Mar-21 LaSalle Parish $67,339 $69,070 $79,304 $84,315 $94,463 $118,614 $91,854 $79,514 $$20,000 $40,000 $60,000 $80,000 $100,000 $120,000 $140,000 Aug-20 Sep-20 Oct-20 Nov-20 Dec-20 Jan-21 Feb-21 Mar-21 Natchitoches Parish
REMOTESELLERSTAXREVENUE-3


Remote sellers tax revenue is tax revenue from online sales by location of the seller at the time of purchase.
Note: Sales tax revenue collected in one month reflects sales activity in the prior month.
Data Source: Louisiana Sales and Use Tax Commission for Remote Sellers. August 2020 –April 2021
$256,874 $231,000 $273,357 $320,452 $386,024 $473,077 $400,934 $307,730 $$100,000 $200,000 $300,000 $400,000 $500,000 Aug-20 Sep-20 Oct-20 Nov-20 Dec-20 Jan-21 Feb-21 Mar-21 Rapides Parish Remote Sellers Tax Revenue $176,598 $170,080 $185,115 $190,344 $237,188 $286,738 $246,450 $201,244 $$100,000 $200,000 $300,000 Aug-20 Sep-20 Oct-20 Nov-20 Dec-20 Jan-21 Feb-21 Mar-21 St. Landry Parish $105,111 $100,123 $114,716 $141,563 $159,311 $188,630 $157,506 $132,757 $$100,000 $200,000 Aug-20 Sep-20 Oct-20 Nov-20 Dec-20 Jan-21 Feb-21 Mar-21 Vernon Parish
BUILDINGPERMITS
ALEXANDRIAHOUSINGUNITS–HISTORICALDATA
The chart shows the number of new housing unit construction permits issued in the Alexandria MSA from 2004 – 2020. Data represents 52% coverage.
Housing unit constructions in the Alexandria MSA averaged 443 units per year between 20042020, peaking in 2006 at 951 units.
From 2004 to 2020, the number of newly constructed housing units fell 71% from 685 to 204.
Data Source: US Census, Building Permit Survey, Retrieved April 13, 2021
685 710 951 572 382 396 434 376 482 402 323 289 390 302 305 333 204 0 200 400 600 800 1000 2004 2005 2006 2007 2008 2009 2010 2011 2012 2013 2014 2015 2016 2017 2018 2019 2020
Housing Unit Permits Issued in the Alexandria MSA 2004-2020
ALEXANDRIAHOUSINGVALUATION
The total and average valuation of new housing unit construction permits issued in the Alexandria MSA from 2004 – 2020. Data represents 52% coverage.
Total and Average Valuation of Housing Units in the Alexandria MSA
2004-2020


The valuation of housing unit construction in the Alexandria MSA averaged $67,338,000 per year since 2004, peaking in 2006 at $126,167,000.
From 2004 to 2020, the valuation per housing unit has grown from $119,336 to $241,623, a 102% increase.
Total Val Avg Value
Data Source: US Census, Building Permit Survey, Retrieved April 13, 2021 $$50,000 $100,000 $150,000 $200,000 $250,000 $300,000 0 20 40 60 80 100 120 140 2004 2005 2006 2007 2008 2009 2010 2011 2012 2013 2014 2015 2016 2017 2018 2019 2020 Average Valuation of House Unites in Dollars Total Valuation of All Housing Units in $ (million) Millions
ALEXANDRIACOMMERCIALPERMITS
The valuation (estimated development cost) of new commercial construction permits issued by the City of Alexandria in March 2021 with previous month, year, and YTD comparisons.
Data Source: City ofAlexandria Planning Division.April 2021 March -95% Mar. YoY -55% Mar. YTD 213% March 2018 2019 2020 2021 March $ 9,597,440 $ 1,176,454 $ 1,014,850 $ 459,222 February $ 527,100 $ 4,694,401 $ 1,163,472 $ 8,499,638 % Chg over Prev Month -75% -13% -95% % Chg over Prev Year -88% -14% -55% YTD (Jan - Dec) $ 11,710,313 $ 7,273,739 $ 3,518,877 $ 11,031,606 % Chg over Prev YTD -38% -52% 213%
ALEXANDRIARESIDENTIALPERMITS
The valuation (estimated development cost) of new residential construction permits issued by the City of Alexandria in March 2021 with previous month, year, and YTD comparisons.
Data Source: City ofAlexandria Planning Division.April, 2021 March 86.1% Mar. YoY 109.3% Mar. YTD 76.5% March 2018 2019 2020 2021 March $ 1,941,748 $ 1,215,591 $ 1,631,365 $ 3,414,459 February $ 2,281,705 $ 1,857,830 $ 969,361 $ 1,834,964 % Chg over Prev Month -14.9% -34.6% 68.3% 86.1% % Chg over Prev Year -37.4% 34.2% 109.3% YTD (Jan - Dec) $ 6,408,457 $ 4,476,305 $ 3,808,136 $ 6,721,606 % Chg over Prev YTD -30.2% -14.9% 76.5%
ALLENPARISHPERMITVALUATIONS
This chart shows the valuation of permits issued by Rapides Area Planning Commission in Allen Parish in March between 2018-2021 with month-tomonth, year-to-year, and year-to-date comparisons.
Data Source: RapidesArea Planning Commission,April, 2021
March -56% Mar. YoY -42% Mar. YTD 69% March 2018 2019 2020 2021 March $ - $ 284,145 $1,655,000 $ 955,000 February $ 479,500 $ - $ 250,000 $2,164,000 % Chg Prev Month -100% 562% -56% % Chg from Prev Year 482% -42% YTD (Jan - Dec) $1,045,670 $1,012,145 $2,260,919 $3,818,250 % Chg over Prev YTD -3% 123% 69%
AVOYELLESPARISHPERMITVALUATIONS
This chart shows the valuation of permits issued by Rapides Area Planning Commission in Avoyelles Parish in March between 2019-2021 with month-to-month, year-to-year, and year-to-date comparisons.
Data Source: RapidesArea Planning Commission,April 2021.
March 285% Mar. YoY 78% Mar. YTD 1025% March 2019 2020 2021 March $ 5,433,925 $ 4,499,044 $ 7,991,410 February $ 2,991,003 $ 2,656,118 $ 2,078,210 % Chg Prev Month 82% 69% 285% % Chg from Prev Year -17% 78% YTD (Jan - Dec) $ 11,070,576 $ 1,878,163 $ 21,136,044 % Chg over Prev YTD -83% 1025%
EVANGELINEPARISHPERMITVALUATIONS
This chart shows the valuation of permits issued by Rapides Area Planning Commission in Evangeline Parish in March between 2018-2021 with month-to-month, year-to-year, and year-to-date comparisons.
Data Source: RapidesArea Planning Commission,April 2021.
March 1189% Mar. YoY 1323% Mar. YTD 912% February 2018 2019 2020 2021 March $ 401,000 $ 1,035,000 $ 1,221,490 $ 17,376,352 February $ 1,601,409 $ 743,170 $ 310,000 $ 1,348,110 % Chg Prev Month -75% 39% 294% 1189% % Chg from Prev Year 158% 18% 1323% YTD (Jan - Dec) $ 2,642,909 $ 2,033,170 $ 1,878,163 $ 19,005,467 % Chg over Prev YTD -23% -8% 912%
PINEVILLEPERMITVALUATIONS
This chart shows the valuation of permits issued by Rapides Area Planning Commission in the City of Pineville in March between 20182021 with month-to-month, year-to-year, and year-to-date comparisons.
Data Source: RapidesArea Planning Commission,April 2021.
March 122% Mar. YoY 57% Mar. YTD -42% March 2018 2019 2020 2021 March $ 426,788 $1,252,940 $ 760,000 $ 1,190,000 February $ 648,036 $1,192,034 $ 1,224,755 $ 534,875 % Chg Prev Month -34% 5% -38% 122% % Chg from Prev Year 194% -39% 57% YTD (Jan - Dec) $ 1,348,154 $3,698,574 $ 3,282,255 $ 1,912,435 % Chg over Prev YTD 174% -11% -42%
RESIDENTIALCONSTRUCTIONPERMITSBYAREA
New residential construction permit valuation (estimated development cost) issued by Rapides Area Planning Commission by jurisdiction in March 2021 compared to March 2020.
Valuation of New Residential Construction March 2020 vs March 2021
Note: City ofAlexandria permits are accounted for separately.
Data Source: RapidesArea Planning Commission,April 2021.
Year-over-year value of residential construction in the RAPC jurisdiction. 302% Mar-20 Mar-212 Change % Change Allen $ 1,656,000 $ 900,000 $ (756,000) -46% Avoyelles $ 2,082,714 $ 1,184,000 $ (898,714) -43% Pineville $ 575,000 $ 350,000 $ (225,000) -39% Evangeline $ 839,262 $ 17,275,352 $ 16,436,090 1958% LaSalle $ - $ 550,000 $ 550,000 Rapides $ 2,812,000 $ 3,810,807 $ 998,807 36%
HOUSING
RAPIDESPARISHPERMITVALUATIONS
This charts shows the valuation of permits issued by Rapides Area Planning Commission in Rapides Parish (excluding Alexandria) in March between 20182021 with month-to-month, year-to-year, and year-to-date comparisons.
Data Source: RapidesArea Planning Commission,April 2021.
March 29% Mar. YoY -13% Mar. YTD 1444% March 2018 2019 2020 2021 March $ 2,546,580 $ 3,525,216 $ 6,814,350 $ 5,926,135 February $ 1,296,292 $ 743,170 $ 2,656,118 $ 4,595,002 % Chg Prev Month 96% 374% 157% 29% % Chg from Prev Year 38% 93% -13% YTD (Jan - Dec) $ 6,518,533 $39,701,038 $13,343,216 $206,044,316 % Chg over Prev YTD 509% -66% 1444%
ALEXANDRIAACTIVELISTINGS

The count of active single-family and condo/townhome listings for Alexandria MSA (excludes pending listings) for March 20182021 with month-to-month and year-over-year comparisons.
Active listings decreased 62% since March 2020.
Data Source: Realtor.com. Retrieved from FRED, Federal Reserve Bank of St. Louis. April 11, 2021 March -17.0% Mar YoY -61.5% 2018 2019 2020 2021 March 465 465 405 156 February 468 470 475 188 % Chg Prev Month -0.6% -1.2% -14.7% -17.0% % Chg from Prev Year -0.1% -12.8% -61.5% March
0 100 200 300 400 500 600 2016-07-01 2017-03-01 2017-11-01 2018-07-01 2019-03-01 2019-11-01 2020-07-01 2021-03-01 Active Listings Count in Alexandria July 2016 - March 2021
ALEXANDRIAPENDINGLISTINGS

The count of pending single-family and condo/townhome listings for Alexandria MSA for March 2018-2021 with month-to-month and year-over-year comparisons.
Data Source: Realtor.com. Retrieved from FRED, Federal Reserve Bank of St. Louis. April 11, 2021 March 8.5% Mar YoY 71.5% 2018 2019 2020 2021 March 146 148 130 223 February 126 126 49 204 % Chg Prev Month 13.7% 14.9% 62.3% 8.5% % Chg from Prev Year 1.4% -12.2% 71.5% March Pending listings increased 72% over March 2020, from 130 to 223. 0 50 100 150 200 250 300 2016-07-01 2017-07-01 2018-07-01 2019-07-01 2020-07-01 Pending Listing Count in Alexandria July 2016 - March 2021
ALEXANDRIAMEDIANDAYSONMARKET

The median number of days property listings spend on the market in Alexandria MSA for March 2018-2021 with month-to-month and year-over-year comparisons.
Median days on the market fell 20% from February 2021 and 7% from February 2020.
Realtor.com. Retrieved from FRED, Federal Reserve Bank of St. Louis. April 11, 2021 March 20.2% Mar YoY 7.4% 2018 2019 2020 2021 March 99 100 81 75 February 99 105 93 94 % Chg Prev Month 0.5% -4.8% -12.9% -20.2% % Chg from Prev Year 1.0% -19.0% -7.4% March
50 60 70 80 90 100 110 120 2016-07-01 2017-07-01 2018-07-01 2019-07-01 2020-07-01 Median Days on Market in Alexandria July 2016 - March 2021
Data Source:
ALEXANDRIAMEDIANLISTINGPRICE

The median listing price of houses in Alexandria MSA for March 2018-2021 with month-to-month and year-over-year comparisons.
The median listing price fell -12% since March 2021 from $207,500 to $182,700 and declined -3.6% since March 2020.
Data Source: Realtor.com. Retrieved from FRED, Federal Reserve Bank of St. Louis. April 11, 2021. March -12.0% Mar YoY -3.6% 2018 2019 2020 2021 March $ 185,050 $ 190,538 $ 189,450 $ 182,700 February $ 189,950 $ 183,250 $ 184,550 $ 207,500 % Chg Prev Month -2.6% 4.0% 2.7% -12.0% % Chg from Prev Year 3.0% -0.6% -3.6% March
$170,000 $180,000 $190,000 $200,000 $210,000 $220,000 $230,000 $240,000 2016-07-01 2017-07-01 2018-07-01 2019-07-01 2020-07-01 Median Listing Price in Alexandria July 2016 - March 2021
ALEXANDRIAAVERAGELISTINGPRICE

The average listing price of houses in Alexandria MSA for March 2018-2021 with month-to-month and year-over-year comparisons.
The average listing price increased 7% since March 2020 from $224,610 to $240,872, but fell -11% last month.
Data Source: Realtor.com. Retrieved from FRED, Federal Reserve Bank of St. Louis. April 11, 2021. March -10.9% Mar YoY 7.2% 2018 2019 2020 2021 March $ 229,930 $ 229,168 $ 224,610 $ 240,872 February $ 237,917 $ 224,055 $ 216,432 $ 270,473 % Chg Prev Month -3.4% 2.3% 3.8% -10.9% % Chg from Prev Year -0.3% -2.0% 7.2% March
$200,000 $210,000 $220,000 $230,000 $240,000 $250,000 $260,000 $270,000 $280,000 $290,000 2016-07-01 2017-07-01 2018-07-01 2019-07-01 2020-07-01 Average
Price in Alexandria July 2016 - March 2021
Listing
HOMEPRICEAPPRECIATION
These charts represent home price appreciation in the U.S.
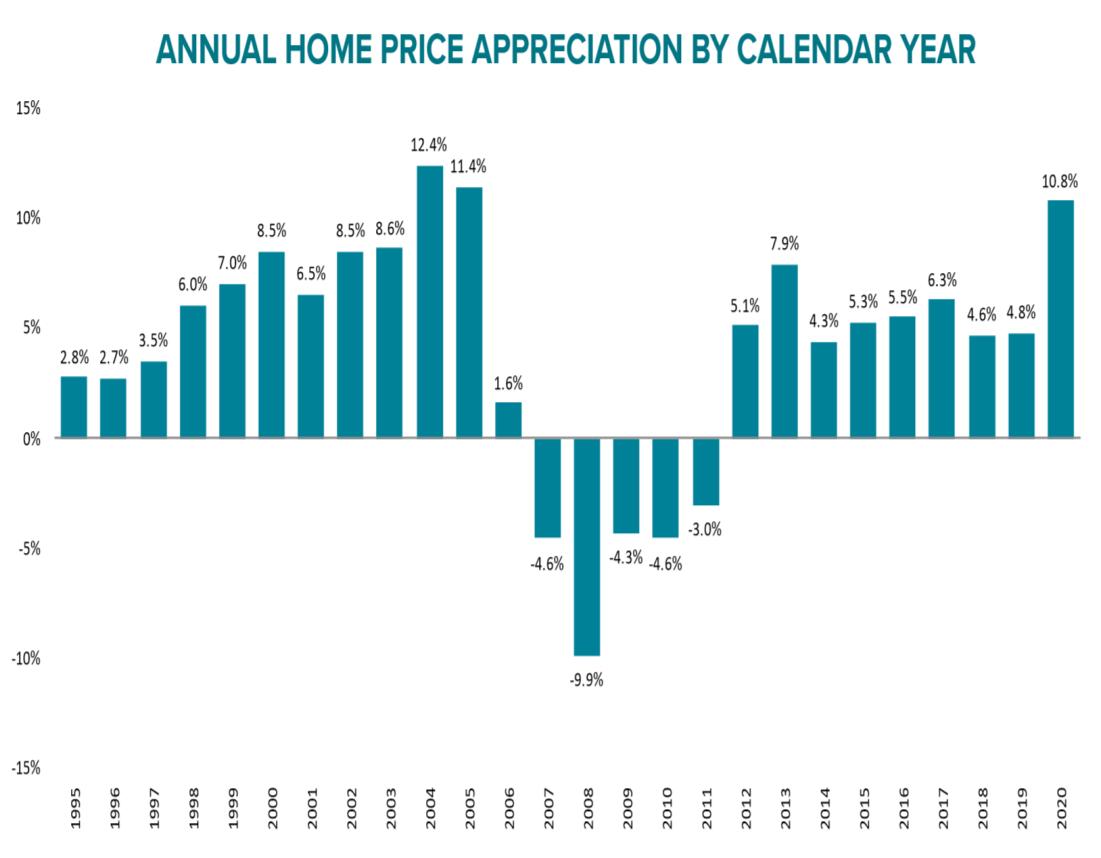
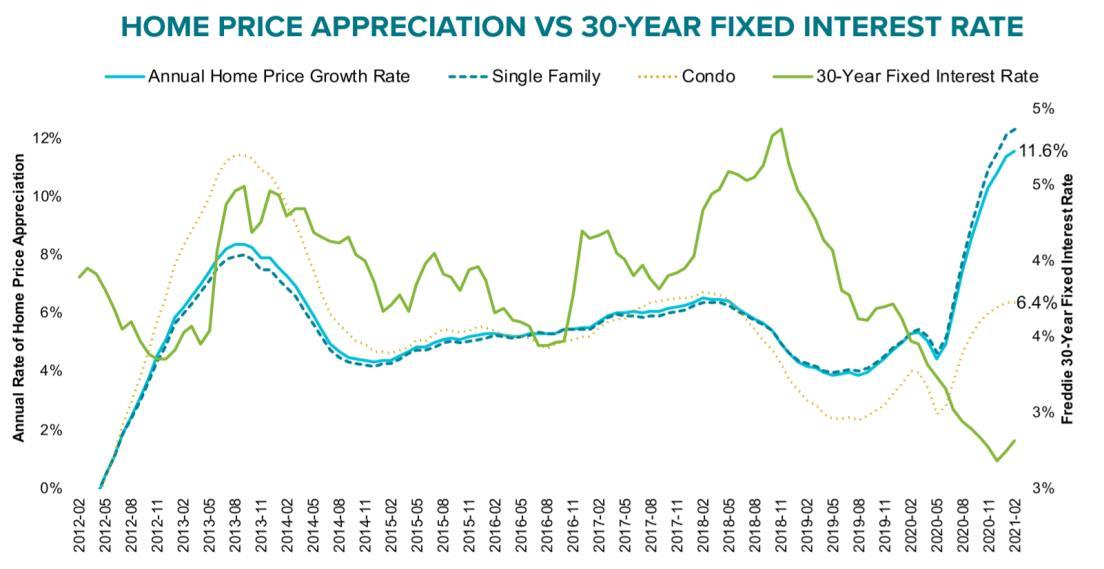
The US housing market remains extremely hot entering 2021, driven by low mortgage rates and inventory shortages.
2020 saw the strongest home price growth of any year since 2005, marking just the third year of double-digit growth in the past quarter century.
According to the Black Knight Home Price Index, home prices grew at 11.6% in January, the highest annual rate in 15 years.
Data Source: Mortgage Monitor Reports February, Black Knight Financial Technology Solutions,April 5, 2021.
TRAVEL
AVOYELLESHOTELOCCUPANCYTAX
Avoyelles Parish hotel occupancy tax revenue for March with previous month, year, and year-to-date comparisons.
Note: March tax revenue reflects hotel occupancy activity in February. Hotel occupancy tax revenue is used as a proxy for hotel occupancy rate.
Data Source: Avoyelles Parish School Board. April 2021.
March 276% Mar. YoY 270% Mar. YTD 11% March 2017 2018 2019 2020 2021 March $ 10,853 $ 9,566 $ 8,137 $ 3,369 $ 12,468 February $ 10,381 $ 6,684 $ 6,704 $ 9,093 $ 3,319 % Chg over Prev Month 4.5% 43.1% 21.4% -62.9% 275.6% % Chg over Prev Year -11.9% -14.9% -58.6% 270.0% YTD (Jan - Dec) $ 30,893 $ 24,144 $ 23,115 $ 20,263 $ 22,498 % Chg over Prev YTD -21.8% -4.3% -12.3% 11.0%
RAPIDESHOTELOCCUPANCYTAX
Rapides Parish hotel occupancy tax revenue for March 2020 with previous month, year, and YTD comparisons.
Note: March tax revenue reflects hotel occupancy activity in February. Hotel occupancy tax revenue is used as a proxy for hotel occupancy rate.
Data Source: Rapides Parish Police Jury Treasurer’s Reports, April 2021.
March 20.2% Mar. YoY 30.8% Mar. YTD 7.3% 2018 2019 2020 2021 March $ 126,383 $ 146,322 $ 111,228 $ 145,466 February $ 164,117 $ 170,915 $ 176,249 $ 120,971 % Chg over Prev Month -23.0% -14.4% -36.9% 20.2% % Chg over Prev Year 15.8% -24.0% 30.8% YTD (Jan - Dec) $ 383,219 $ 431,399 $ 422,758 $ 391,798 % Chg over Prev YTD 12.6% -2.0% -7.3% March 0 100 200 300 400 Thousands Hotel Occupancy Tax Revenue 2019-2021 2019 2020 2021
PASSENGERTRAFFICATLOUISIANAAIRPORTS
This chart shows total passenger throughput at Louisiana airports and nationwide in March 2021 as a percent of traffic a year ago. AEX is the solid black line on a logarithmic scale.
Passenger Throughput as a Percent a Year Ago in Louisiana (March 2021)

AEX had the highest total passenger throughput in the state in March at 145% compared to a year ago.
Data Source: Alexandria International Airport, April 11, 2021
Airport % of 2020 Traffic US 115% AEX 145% MSY 93% BTR 112% LCH 139% LFT 143% MLU 123% SHV 121% 10% 100% 1000% 10000% 100000% 3/4/2021 3/5/2021 3/6/2021 3/7/2021 3/8/2021 3/9/2021 3/10/2021 3/11/2021 3/12/2021 3/13/2021 3/14/2021 3/15/2021 3/16/2021 3/17/2021 3/18/2021 3/19/2021 3/20/2021 3/21/2021 3/22/2021 3/23/2021 3/24/2021 3/25/2021 3/26/2021 3/27/2021 3/28/2021 3/29/2021 3/30/2021 3/31/2021
US AEX MSY MSY BTR LFT MLU
AIRTRAVELERSTATS

Nationwide daily percentage of passengers passing through current TSA checkpoints expressed as a percentage of previous year’s traffic.
Nationwide air passenger traffic in March 2021 was 15.3% above last year’s level.
Average passenger traffic in U.S. increased 41% in March 2021, from 873,084 in February to 1,227,421 in March.
Data Source: DHS, Transportation Security Administration, https://www.tsa.gov/coronavirus/passenger-throughput, April 11, 2021
1% 10% 100% 1000% Passengers
TSA Airport Total Traveler Throughput as a Percent of Previous Year
LOUISIANAGASOLINESALES
Total gasoline sales in Louisiana in 2019 - 2021.


In January 2021, Louisiana gasoline sales decreased -6.6% from December and was -14.3% below January 2020.
Gasoline sales in LA in 2020 exceeded 2019 in only two month – January and August.
Gasoline sales for 2020 were down 5.8% compared to 2019.
Data Source: U.S. Energy Information Administration, Prices, Sales Volumes & Stocks by State,April 11, 2021
4,000 5,000 6,000 7,000 8,000 January February March April May June July August September October November December Thousands of Gallons / Day
Gasoline Sales in Louisiana
2019 2020 2021
LOCAL& LOUISIANA
NEWBUSINESSESINRAPIDES
The chart below represents the number of new businesses established each month in Rapides from January 2019 through March 2021.
March
2018 2019 2020 2021 March 44 45 30 46 February 44 46 32 32 % Chg Prev Month 0.0% -2.2% -6.3% 43.8% % Chg from Prev Year 2.3% -33.3% 53.3% YTD (Jan - Mar) 143 119 112 121 % Chg over Prev YTD -16.8% -5.9% 8.0%
Year-to-date new businesses in Rapides are up 8% over 2020. 20
The number of new businesses established in Rapides in March 2021 was 43% higher than February 2021. 10
40


30
New Businesses in Rapides 2019-2021 2019 2020 2021
50 Jan Feb Mar Apr May Jun Jul Aug Sep Oct Nov Dec
Data Source: Rapides Parish Sales and Use Tax Department, April 1, 2021. 0
CONSUMERSPENDINGINLOUISIANA
These graphs represents the percent change in average consumer credit and debit card spending in Louisiana as of March 14, 2021 with January 2020 as the baseline.
• Total consumer spending on March 14, 2021 in Louisiana is down 11% compared to January 2020, with retail spending up 0.2% while entertainment and recreation spending is down -42%. Grocery spending was down -0.9%, health care down 3-1.7%, and restaurants down -23.1%.
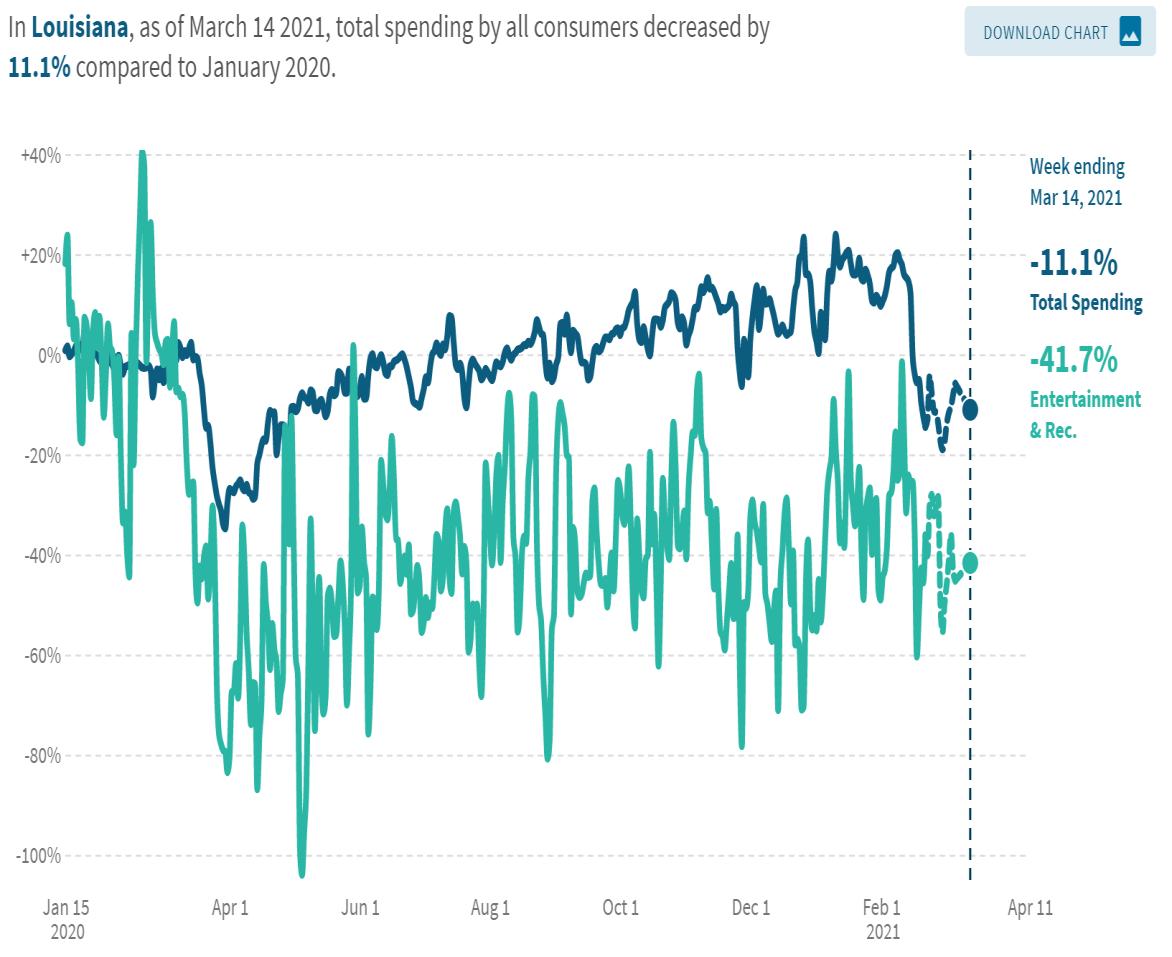
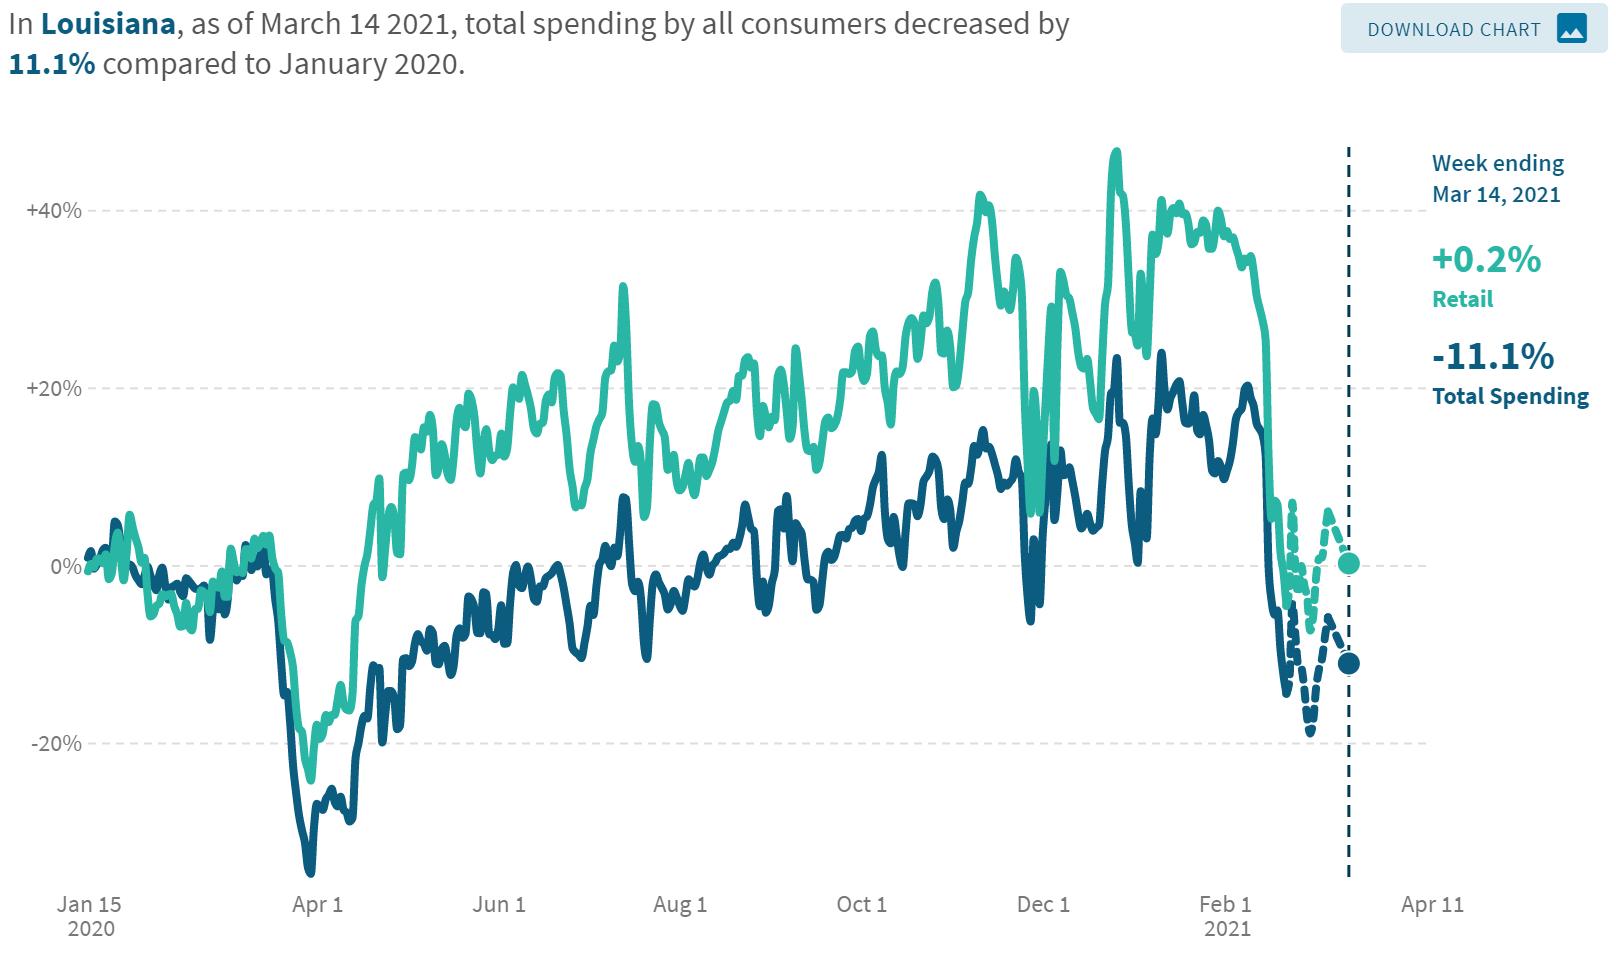
Data Source: Opportunity Insights Economic Tracker, https://www.tracktherecovery.org/. Data Source: Affinity Solutions. Retrieved April 11, 2021
ALLCONSUMERSPENDINGINCENLA
The table and chart represents the percent change in average consumer credit and debit card spending in Cenla as of March 14, 2021 with January 2020 as the baseline, while the chart represents Rapides.
Change in Spending
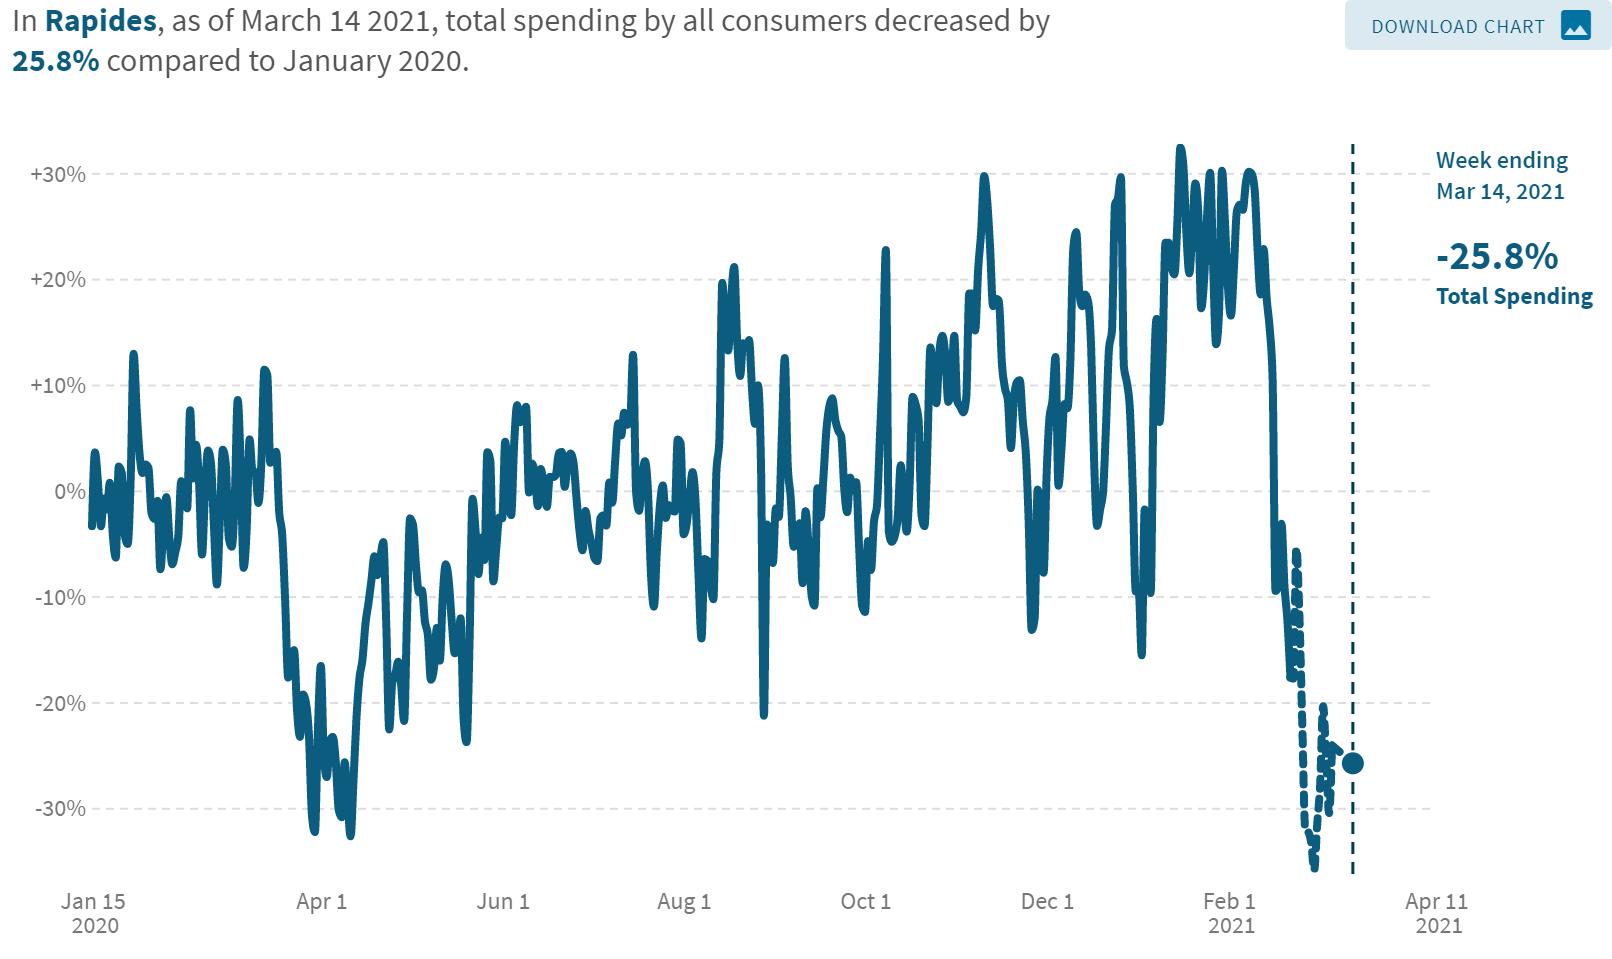
Data Source: Opportunity Insights Economic Tracker, https://www.tracktherecovery.org/. Data Source: Affinity Solutions. Retrieved April 11, 2021
Data for Concordia andAvoyelles is not available.
Allen -17.1% Catahoula -41.1% Evangeline -33.4% Grant -48.1% La Salle -49.9% Natchitoches -36.8% Rapides -25.8% St. Landry -5.3% Vernon +24.2%
SMALLBUSINESSREVENUEINLOUISIANA
The chart below represents the percent change in small business revenue in Louisiana as of March 31, 2021 with January 2020 as the baseline. The table shows the percentage change for small business revenue by industry.
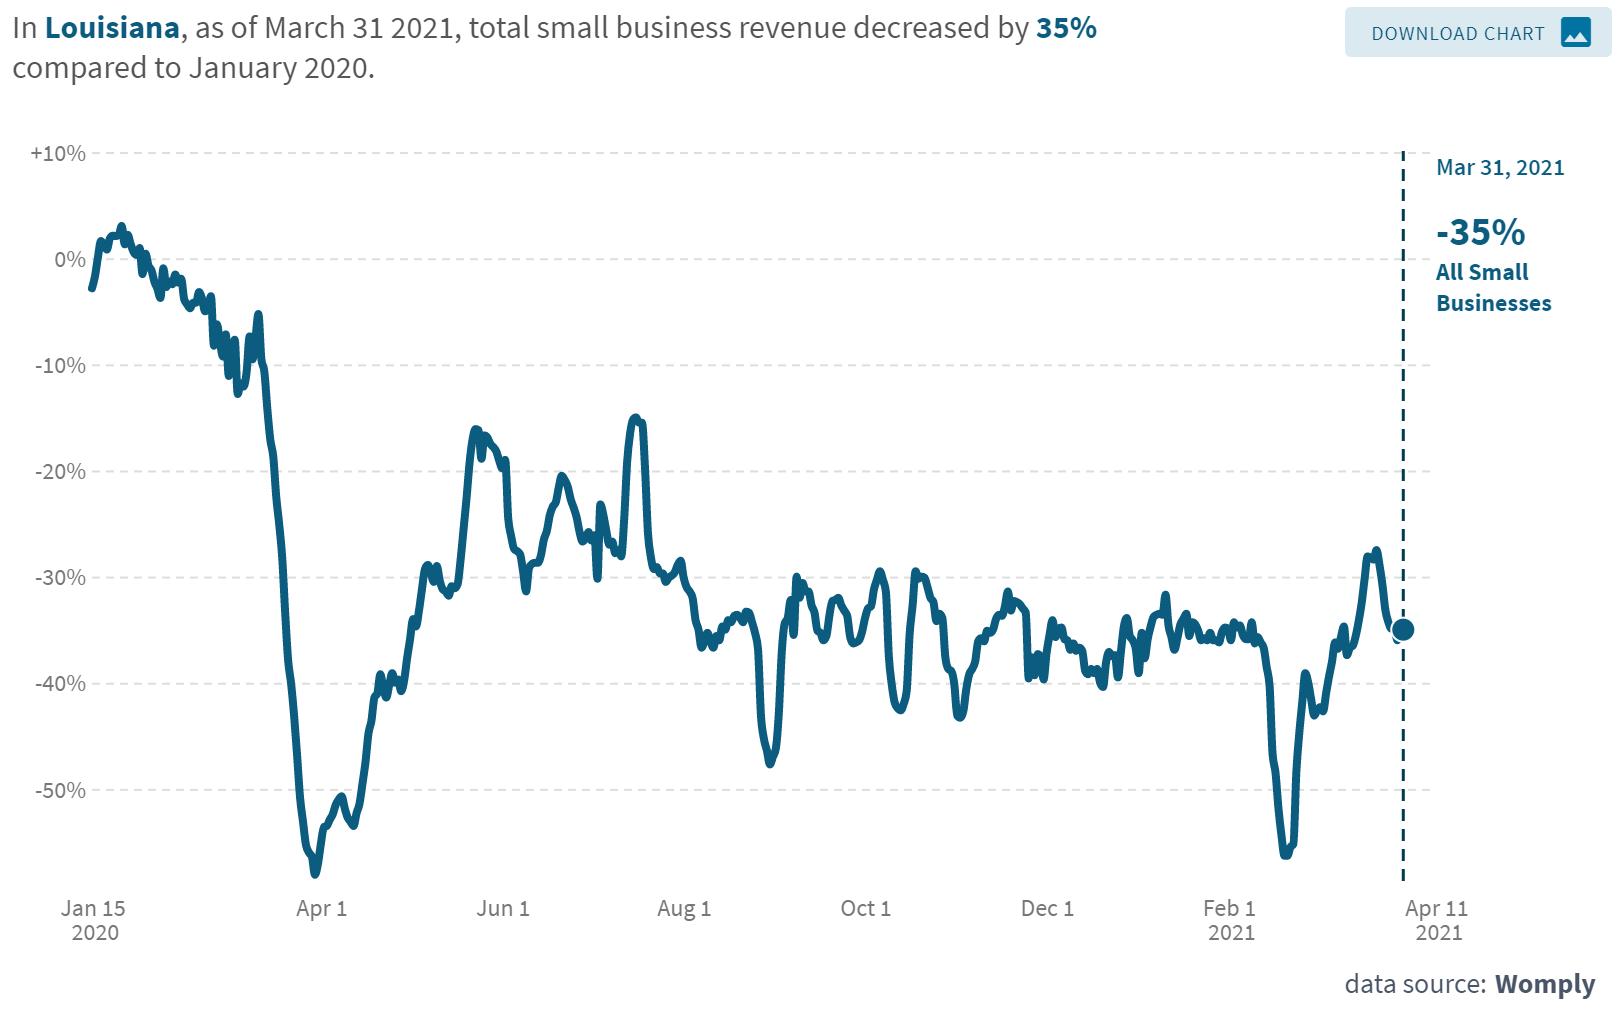
Source: Opportunity Insights Economic Tracker, https://www.tracktherecovery.org/ Date Source: Womply. Retrieved April 11, 2021. Industry % Change Education & Health Services -22% Retail -8% Leisure & Hospitality Professional -66% -16%
TIMESPENTATWORKINRAPIDES
The chart represents the percent of time employees in Rapides Parish spent at work as of April 4, 2021 with January 2020 as the baseline. The table provides comparable data for other central Louisiana parishes.
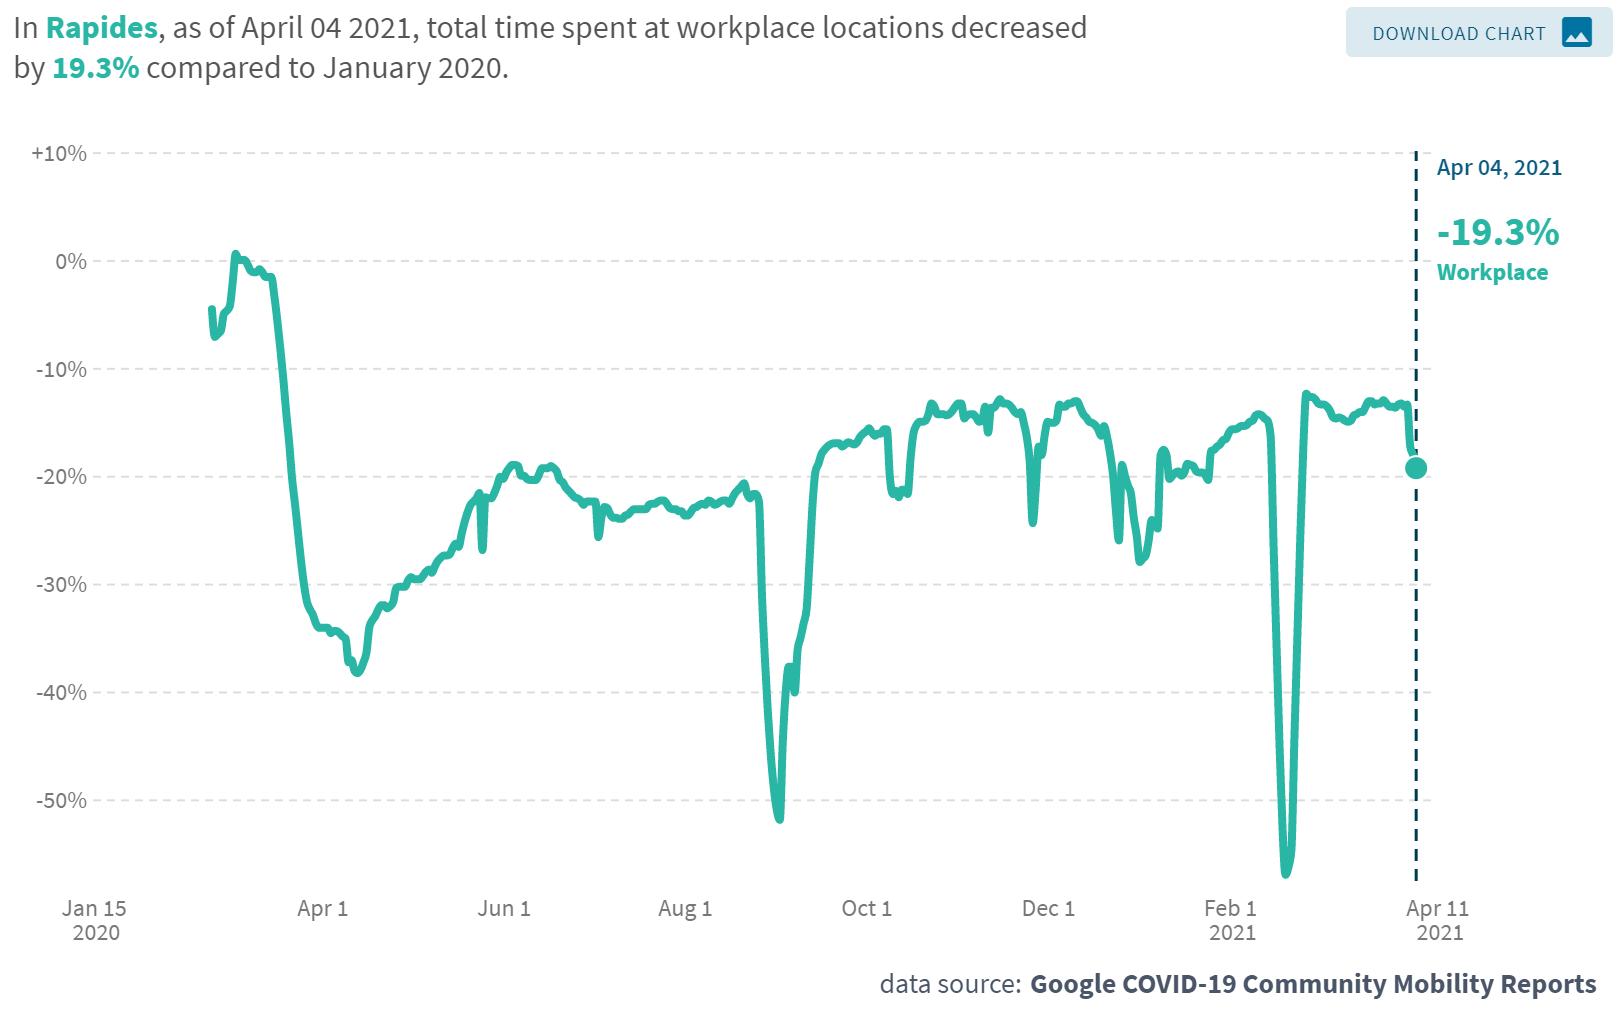
Hurricane Laura
Winter storms
Uri & Viola
The percent of time employees in Rapides spent at work during winter storms Uri and Viola was down -57% compared to -51% for Hurricane Laura. For the winter storms, Natchitoches was hardest hit at -61.6% followed by Grant (-58.4%), Rapides (-57%), and Vernon (-52.6%).
Source: Opportunity Insights Economic Tracker, https://www.tracktherecovery.org/ Date Source: Womply. Retrieved April 11, 2021.
in
at Work Avoyelles -21.1% Concordia -25.3% Evangeline -21.0% Grant -20.6% Natchitoches -23.0% Rapides -19.3% St. Landry -19.1% Vernon -18.7%
Change
Time
COINCIDENTECONOMICACTIVITYINDEX
The Coincident Economic Activity Index for Louisiana includes four indicators: nonfarm payroll employment, the unemployment rate, average hours worked in manufacturing and wages and salaries. The index is set to match the trend for gross state product.
Coincident Economic Activity Index for Louisiana January 2020 – February 2021
• The chart shows the impact of COVID-19 on the Louisiana’s gross state product since January 2020.
The index for February 2021 increased 0.15% over January 2021, indicating the economic recovery in Louisiana is slowing. This is the lowest increase since the recovery started.

Data Source: FRED Economic Data, Federal Reserve Bank of St. Louis, April 11, 2021. https://fred.stlouisfed.org/series/LAPHCI
110.1 110.0 109.5 95.3 93.3 96.8 97.6 99.4 100.1 100.8 101.3 101.6 102.1 102.3 85 90 95 100 105 110 115 2020-01-01 2020-03-01 2020-05-01 2020-07-01 2020-09-01 2020-11-01 2021-01-01 Index
BAKERHUGHESRIGCOUNT
Represents the number of drilling rigs actively exploring for or developing oil or natural gas in Louisiana and the U.S.


Exploration rig count in Louisiana decreased 2.1% in February. The rig count nationwide increased 2.7% from a month ago, but remains -47% down from a year ago.
Source: Baker Hughes, https://rigcount.bakerhughes.com/na-rig-count, April 11, 2021
Mar 20 Feb 21 Mar 21 N. LA-Land 27 32 34 S. LA –Int’l Water 1 1 0 S. LA-Land 1 0 1 S. LA-Offshore 19 15 11 TOTAL LOUISIANA 48 47 46 TOTAL US 771 397 408
0 10 20 30 40 50 60 70 0 200 400 600 800 1000 3-Jan 3-Feb 3-Mar 3-Apr 3-May 3-Jun 3-Jul 3-Aug 3-Sep 3-Oct 3-Nov 3-Dec 3-Jan 3-Feb 3-Mar Louisiana Rig Count U.S. Rig Count Rig Count in U.S. & Louisiana 2020-2021 US Louisiana
LOUISIANAGAMINGREVENUE
Gaming revenue in Louisiana for February 2021 with previous month and year comparisons.
Data Source: Louisiana Gaming Control Board, April 11, 2021. http://lgcb.dps.louisiana.gov/revenue_reports.html
February -13.2% February 2021 Feb. YoY -23.5% 20-Feb 21-Jan 21-Feb % Change MoM % Change YoY % Change YTD Video Poker $54,935,653 $61,258,981 $53,585,703 -12.5% -2.5% 9% Riverboat $155,480,786 $132,566,676 $112,390,715 -15.2% -27.7% -21% Landbased $26,588,129 $14,851,851 $15,756,573 6.1% -40.7% -41% Slots $30,384,134 $27,135,312 $22,941,114 -15.5% -24.5% -17% Total $267,388,702 $235,812,820 $204,674,105 -13.2% -23.5%
NATIONAL
NATIONALECONOMICINDICATORS
Monthly
U.S. economic indicators for February 2021.
Data Source: U.S. Census, https://www.census.gov/economic-indicators/, April 15, 2021.
Indicator Jan-21 Feb-21 Monthly Wholesale Trade 1.4% 0.6% Manufacturers Shipments, Inventories, and Orders 2.7% -0.8% Construction Spending 1.2% -0.8% Advance Monthly Wholesale Inventories 1.4% 0.5% Advance Monthly Retail Inventories -0.3% 0.0% Advance Durable Goods Manf. Shipments, Inventories, and Orders 3.5% -1.1% New Residential Sales 3.2% -18.2% New Residential Construction -5.1% -10.3% Advance Monthly Sales for Retail and Food Services -2.7% 9.8% Durable Goods -1.1%% Residential Sales -18.2% Residential Construction -10.3%
CONTRIBUTORS
The data presented throughout the CENLA Economic Dashboard reflects contributions from the following local organizations.
• Rapides Parish Policy Jury Treasurer
• Rapides Sales TaxAdministrator
• Avoyelles Parish School Board
• Alexandria International Airport
• RapidesArea Planning Commission
• City ofAlexandria Planning Division
• Evangeline Parish Sales Tax Commissioner
• Concordia, Catahoula, & La Salle TaxAdministrator
• Louisiana Office of Public Health, Region 6
• St. Landry Parish School Board
THANKYOU
Also, special thanks to the following partners for distributing the dashboard.
Next Issue: Week of May 17th
• LSUAFoundation
• Central Louisiana Regional Chamber of Commerce
• Marksville Chamber of Commerce
• Bunkie Chamber of Commerce
• Evangeline Chamber of Commerce
• Concordia Chamber of Commerce
• St. Landry Chamber of Commerce
• Greater Vernon Chamber of Commerce
Current and past issues of the CENLAEconomic Dashboard can be found at http://www.lsua.edu/coronavirus/cenla-economic-dashboard/